Status of Women in Utah€¦ · Associates Some College High School

Utah Women in Higher Education, 2000-2017
Dr. Catherine JeppsenResearch Fellow
Utah Women in the Economy CommissionApril 3, 2018

• Utah’s population is becoming more diverse
• Utah adults are making progress toward the ”66% in 2020” goal
• Utah businesses report a shortage of educated workers
• Utah fares poorly in many national rankings of women’s educational attainment and economic equality
Background
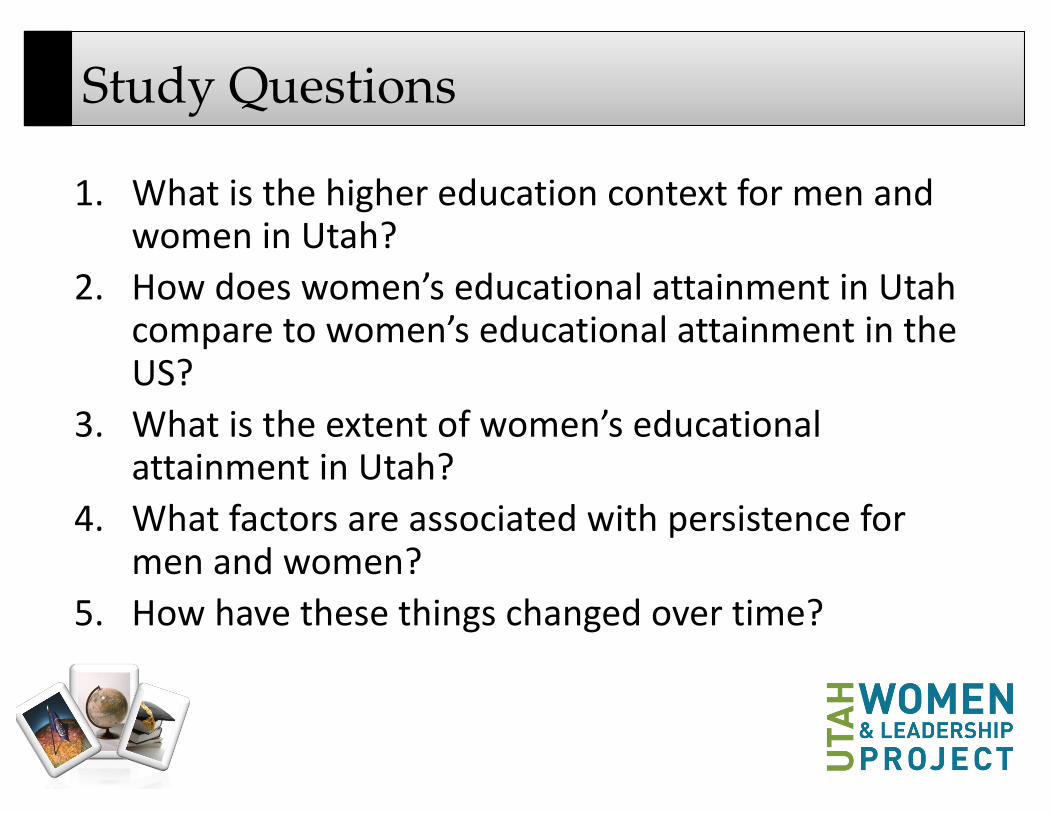
1. What is the higher education context for men and women in Utah?
2. How does women’s educational attainment in Utah compare to women’s educational attainment in the US?
3. What is the extent of women’s educational attainment in Utah?
4. What factors are associated with persistence for men and women?
5. How have these things changed over time?
Study Questions

• Population-level analysis using the American Community Survey (ACS), 2000-2016
• Institution-level analysis using the Integrated Postsecondary Education Data System (IPEDS), 2000-2016
• Individual-level analysis using the Utah System of Higher Education (USHE) data, 2000-2017
Study Structure

• Men’s graduate degree and women’s associate degree attainment are stable over time
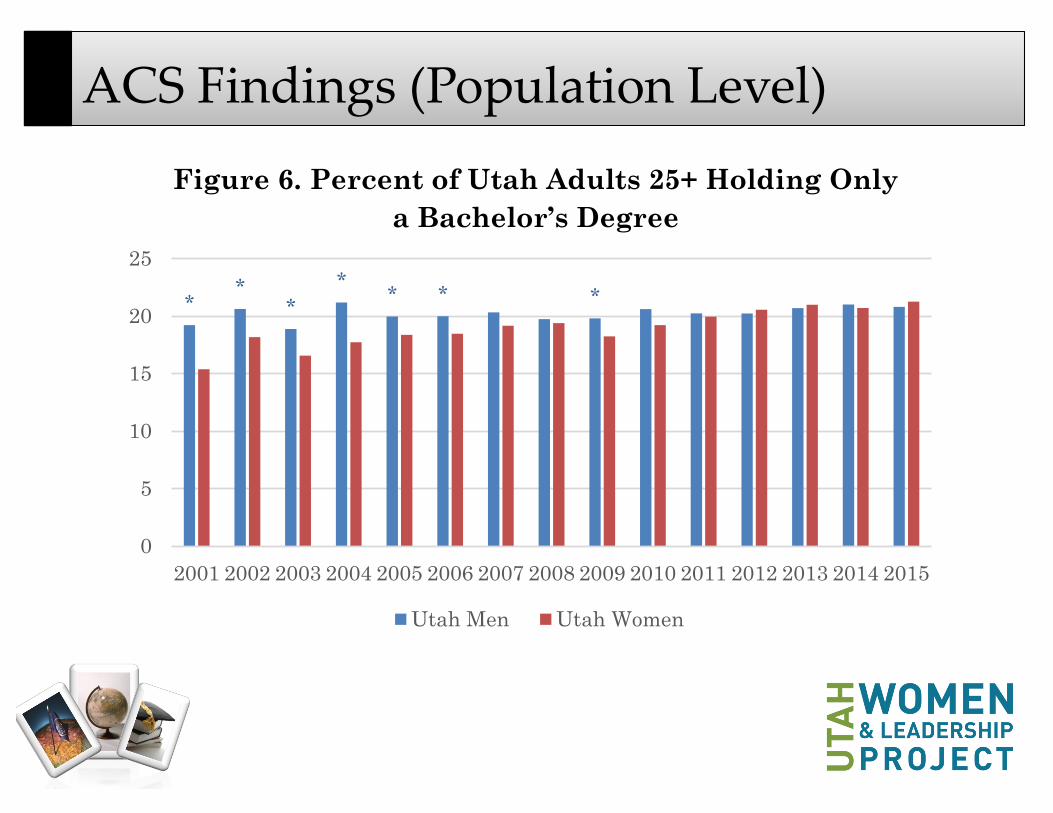
• The gap between men’s and women’s bachelor’s degree attainment has recently been eliminated
• For women, being married and having children are associated with having lower levels of postsecondary education
• Utah Women’s associated degree attainment is the highest in the nation
• Utah Men’s graduate degree attainment is the highest in the nation
ACS Findings (Population Level)
ACS Findings (Population Level)
18
Figure 6. Percent of Utah Adults 25+ Holding Only a Bachelor’s Degree
Table 6. Characteristics Associated with the Likelihood of Utah Adults 25+ Having a Bachelor’s Degree, 2011-2014
Compared to
Some College, No Degree
Compared to Associate Degree Holders
Compared to Graduate Degree Holders
Female (vs male) More likely No difference More likely Hispanic origin (vs no Hispanic origin)
Less likely Less likely More likely
Labor force participation
More likely More likely for men, less likely for women
Less likely, especially for women
Born out of Utah (vs born in Utah)
More likely More likely Less likely
In poverty (vs not in poverty)
Less likely Less likely More likely
Married (vs never married)
More likely for men, less likely for women
Less likely Less likely for men, more likely for women
Divorced, separated, or widowed (vs never married)
Less likely, especially for women
Less likely, especially for women
No difference
Children under 5 in home (vs no children under 5 in home)
More likely, especially for women
More likely Less likely
**
**
* * *
0
5
10
15
20
25
2001 2002 2003 2004 2005 2006 2007 2008 2009 2010 2011 2012 2013 2014 2015
Utah Men Utah Women

ACS Findings (Population Level)
14
shrinking. Despite this, when including graduate degrees Utah men have the highest educational levels compared to Utah women and US men and women, and Utah women have the lowest (Figure 3).
Table 3. Highest Level of Education for Utah and US Adults 25+ in 2015
Utah Men Utah
Women
US Men US Women
N/A or None 0.95 1.03 1.45 1.44 Didn’t finish high school 7.93 6.87 12.08 10.74 High school degree or GED 23.69 24.44 28.31 26.79 < 1 year college 6.74 8.77 5.96 6.44 > 1 year college, no degree 18.8 18.86 14.52 14.61 Associate degree 8.12 10.5 7.33 9.05 Bachelor’s degree 20.8 21.26 18.81 19.25 Master’s degree 8.7 6.57 7.5 8.94 Professional degree 2.29 0.89 2.37 1.65 Doctorate degree 1.99 0.83 1.68 1.09
Figure 3. Percent of Adults 18+ Holding at Least
a Bachelor’s Degree
In our previous section we saw that men and women have near-equal enrollment at the earlier ages, but men have higher enrollment in the 25-34 age range and women have higher enrollment in the 35-44 age range. This led us to ask whether this educational attainment for men and women, particularly the bachelor’s degree attainment, is happening on the same timeline for both groups. We also
0
5
10
15
20
25
30
35
2001 2002 2003 2004 2005 2006 2007 2008 2009 2010 2011 2012 2013 2014 2015
Utah Men Utah Women US Men US Women
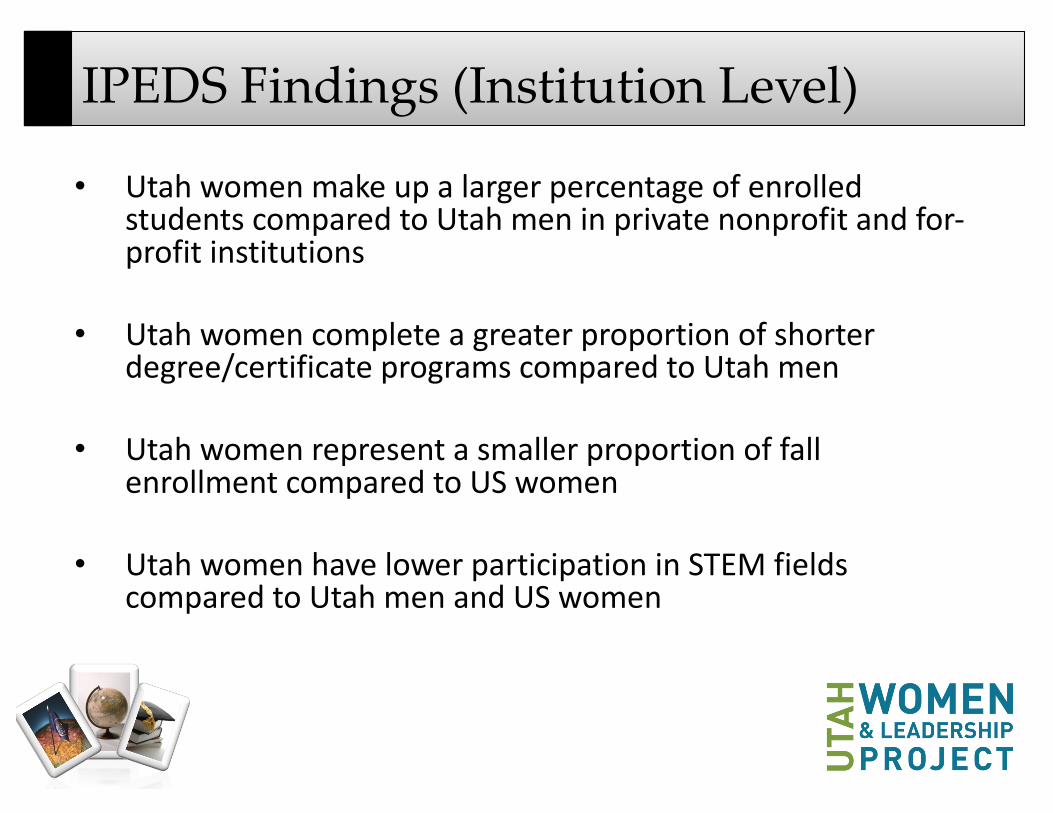
• Utah women make up a larger percentage of enrolled students compared to Utah men in private nonprofit and for-profit institutions
• Utah women complete a greater proportion of shorter degree/certificate programs compared to Utah men
• Utah women represent a smaller proportion of fall enrollment compared to US women
• Utah women have lower participation in STEM fields compared to Utah men and US women
IPEDS Findings (Institution Level)

• Of Utah men and women initially intending to earn a bachelor’s degree, a greater proportion of Utah women earn an associate degree and a greater proportion of Utah men earn a bachelor’s degree.
• Utah men are more likely to pursue fields of study such as engineering and business, and Utah women are more likely to pursue education
• Utah men and women experience different patterns of persistence and completion (though hypotheses for these differences should be informed by other data sources)
USHE Findings (Individual Level)

• Although Utah women are doing well compared to Utah men in many areas, they fare poorly in comparisons to US women
• Utah women pursue fields of study and certificate/degree lengths that are associated with poorer economic outcomes
• Both Utah men and Utah women both experience obstacles in their pursuit of higher education
Concerns

• Consider the level of data collection/analysis
• Recognize the context of postsecondary educational activities
Reconciling Findings

• How can we enable men and women to exercise their postsecondary education preferences?
• How can we better prepare Utah women for their eventual labor force participation?
• How can we support Utah families as men and women pursue higher education and labor force activities?
Conclusion

Dr. Catherine JeppsenResearch Fellow
Utah Valley University
Thank You
Utah Women & Leadership Project www.uvu.edu/uwlp
Utah Women & Education Initiativewww.utahwomenandeducation.org