USTER® LABORATORY SYSTEMS - Uster Technologies
12
Richard Furter October 2003 SE 580 USTER ® LABORATORY SYSTEMS APPLICATION REPORT Measurement of slub yarns with the USTER ® TESTER 4 THE STANDARD FROM FIBER TO FABRIC
Transcript of USTER® LABORATORY SYSTEMS - Uster Technologies
Richard Furter October 2003 SE 580
USTER®
LABORATORY SYSTEMS APPLICATION REPORT Measurement of slub yarns with the USTER® TESTER 4
THE STANDARD FROM FIBER TO FABRIC

THE STANDARD FROM FIBER TO FABRIC
Copyright 2007 by Uster Technologies AG All rights reserved. No part of this publication may be reproduced, stored in a re-trieval system, translated or transmitted in any form or by any means, electroni-cally, mechanically, photocopying, recording or otherwise, without the prior permis-sion in writing of the copyright owner. veronesi\TT\Schulung_Dokumente\ Off-Line\Laborsysteme\SE-580_Measurement of slub yarns with the Uster laboratory systems
2 (12) USTER® PRODUCTS
THE STANDARD FROM FIBER TO FABRIC
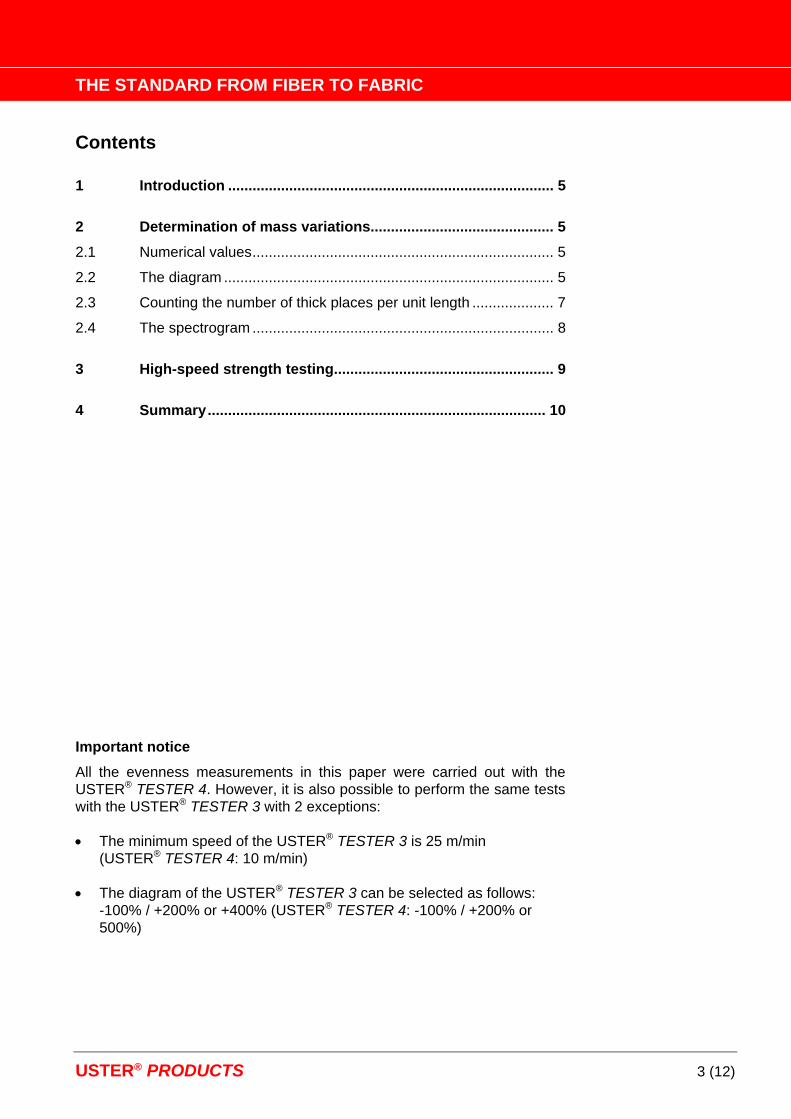
Contents
1 Introduction ................................................................................ 5
2 Determination of mass variations............................................. 5 2.1 Numerical values.......................................................................... 5 2.2 The diagram ................................................................................. 5 2.3 Counting the number of thick places per unit length .................... 7 2.4 The spectrogram .......................................................................... 8
3 High-speed strength testing...................................................... 9
4 Summary................................................................................... 10 Important notice All the evenness measurements in this paper were carried out with the USTER® TESTER 4. However, it is also possible to perform the same tests with the USTER® TESTER 3 with 2 exceptions: • The minimum speed of the USTER® TESTER 3 is 25 m/min
(USTER® TESTER 4: 10 m/min) • The diagram of the USTER® TESTER 3 can be selected as follows:
-100% / +200% or +400% (USTER® TESTER 4: -100% / +200% or 500%)
USTER® PRODUCTS 3 (12)

THE STANDARD FROM FIBER TO FABRIC
4 (12) USTER® PRODUCTS
THE STANDARD FROM FIBER TO FABRIC
1 Introduction If the quality characteristics of slub yarns have to be measured in the textile laboratory the following options are available: • The USTER® TESTER 4 serves for the determination of the mass varia-
tion, the number of produced thick places per 1000 m, the diagram and the spectrogram.
• The USTER® TENSOJET determines the mean force and elongation,
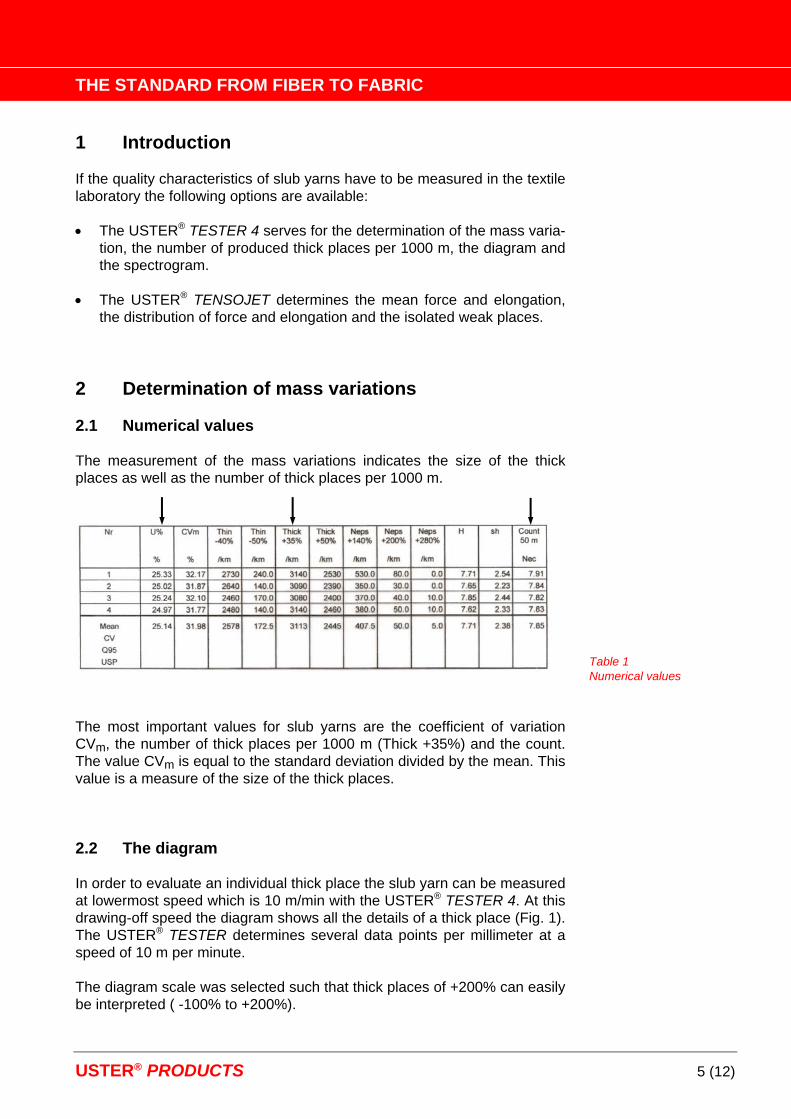
the distribution of force and elongation and the isolated weak places. 2 Determination of mass variations 2.1 Numerical values The measurement of the mass variations indicates the size of the thick places as well as the number of thick places per 1000 m.
Table 1 Numerical values
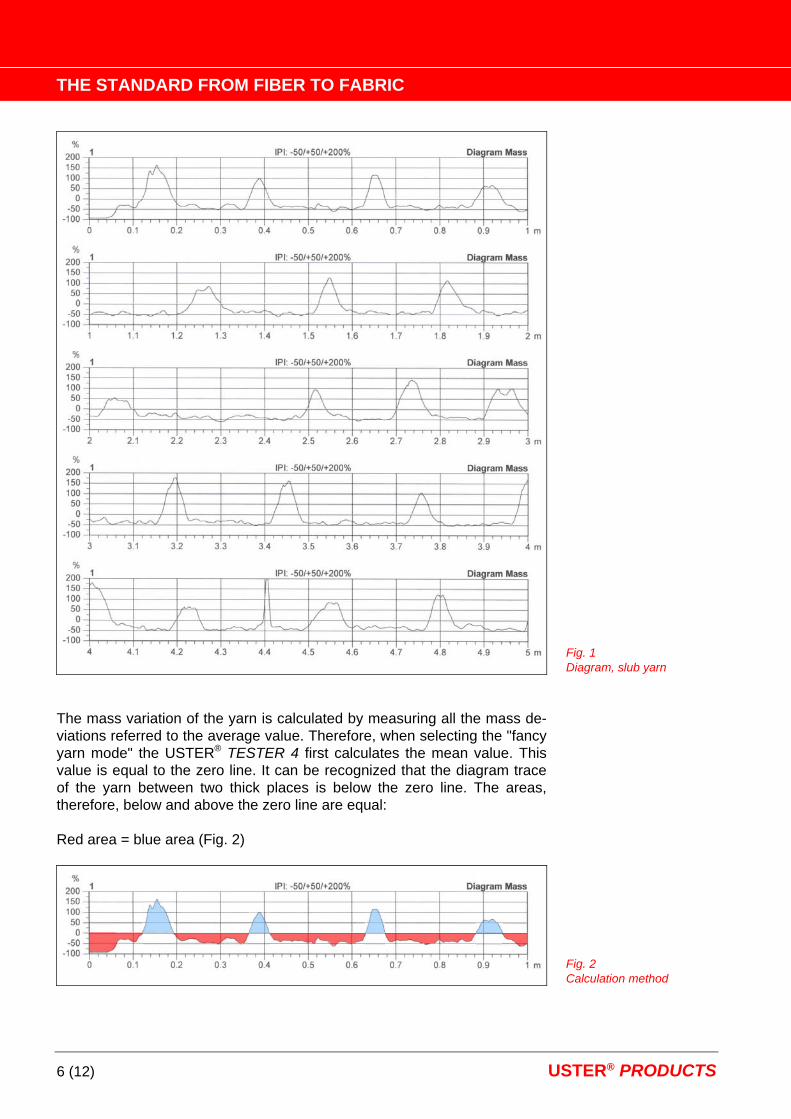
The most important values for slub yarns are the coefficient of variation CVm, the number of thick places per 1000 m (Thick +35%) and the count. The value CVm is equal to the standard deviation divided by the mean. This value is a measure of the size of the thick places. 2.2 The diagram In order to evaluate an individual thick place the slub yarn can be measured at lowermost speed which is 10 m/min with the USTER® TESTER 4. At this drawing-off speed the diagram shows all the details of a thick place (Fig. 1). The USTER® TESTER determines several data points per millimeter at a speed of 10 m per minute. The diagram scale was selected such that thick places of +200% can easily be interpreted ( -100% to +200%).
USTER® PRODUCTS 5 (12)
THE STANDARD FROM FIBER TO FABRIC
Fig. 1 Diagram, slub yarn
The mass variation of the yarn is calculated by measuring all the mass de-viations referred to the average value. Therefore, when selecting the "fancy yarn mode" the USTER® TESTER 4 first calculates the mean value. This value is equal to the zero line. It can be recognized that the diagram trace of the yarn between two thick places is below the zero line. The areas, therefore, below and above the zero line are equal: Red area = blue area (Fig. 2)
Fig. 2 Calculation method
6 (12) USTER® PRODUCTS
THE STANDARD FROM FIBER TO FABRIC
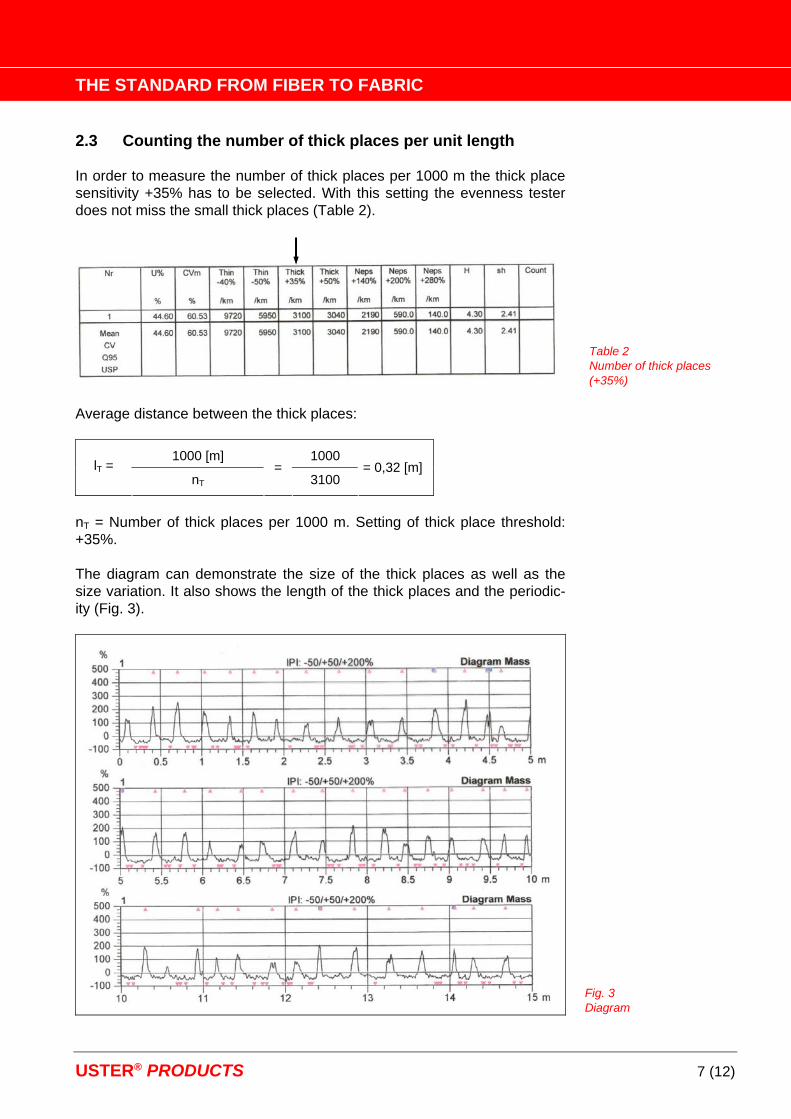
2.3 Counting the number of thick places per unit length In order to measure the number of thick places per 1000 m the thick place sensitivity +35% has to be selected. With this setting the evenness tester does not miss the small thick places (Table 2).
Table 2 Number of thick places (+35%)
Average distance between the thick places:
1000 [m] 1000 lT =
nT=
3100 = 0,32 [m]
nT = Number of thick places per 1000 m. Setting of thick place threshold: +35%. The diagram can demonstrate the size of the thick places as well as the size variation. It also shows the length of the thick places and the periodic-ity (Fig. 3).
Fig. 3 Diagram
USTER® PRODUCTS 7 (12)
THE STANDARD FROM FIBER TO FABRIC
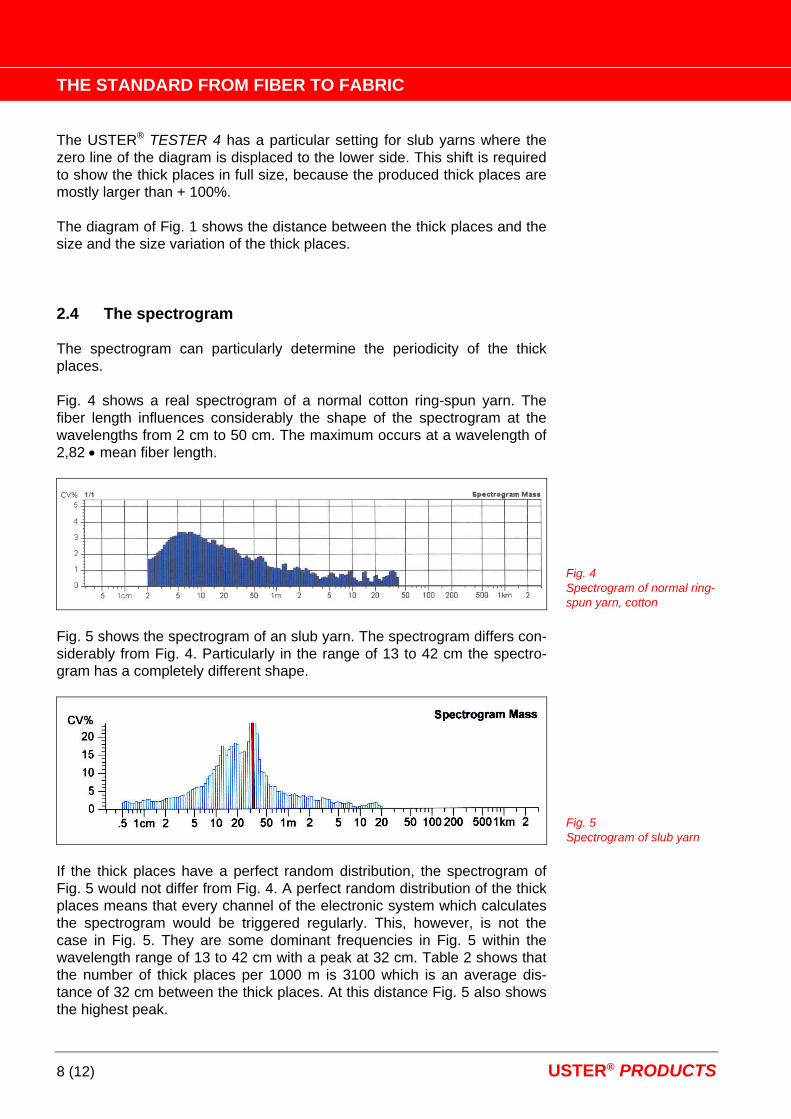
The USTER® TESTER 4 has a particular setting for slub yarns where the zero line of the diagram is displaced to the lower side. This shift is required to show the thick places in full size, because the produced thick places are mostly larger than + 100%. The diagram of Fig. 1 shows the distance between the thick places and the size and the size variation of the thick places. 2.4 The spectrogram The spectrogram can particularly determine the periodicity of the thick places. Fig. 4 shows a real spectrogram of a normal cotton ring-spun yarn. The fiber length influences considerably the shape of the spectrogram at the wavelengths from 2 cm to 50 cm. The maximum occurs at a wavelength of 2,82 • mean fiber length.
Fig. 4 Spectrogram of normal ring-spun yarn, cotton
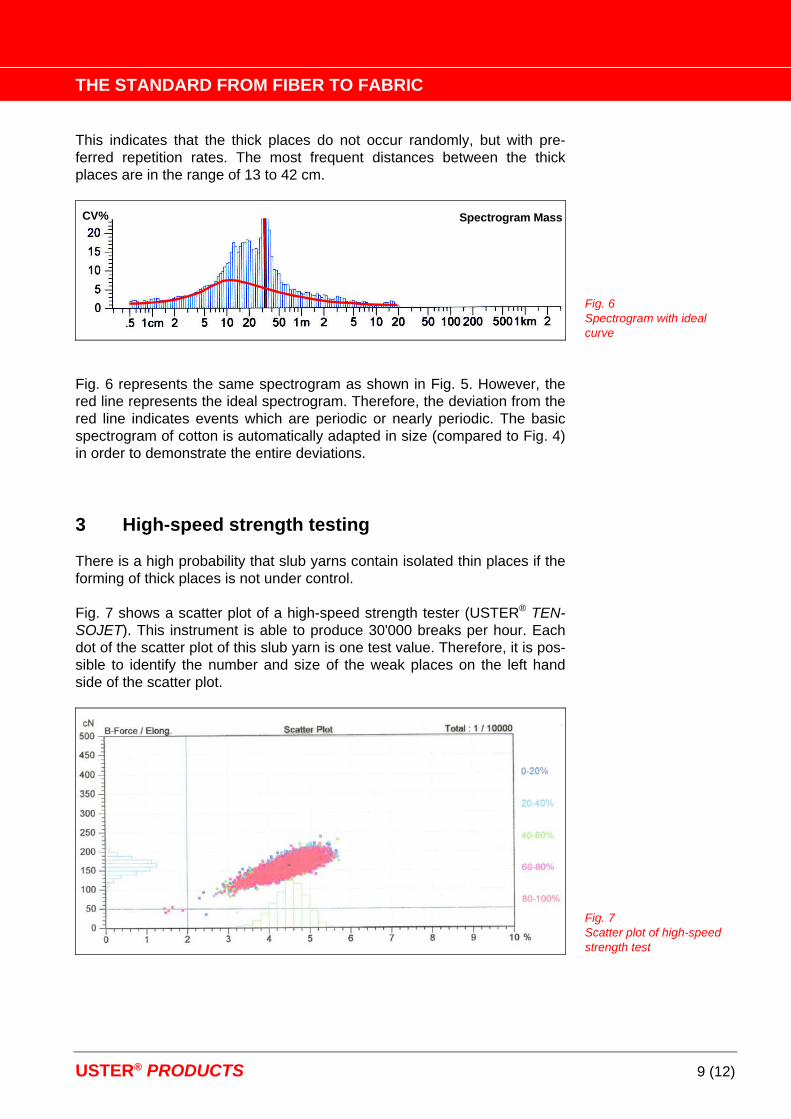
Fig. 5 shows the spectrogram of an slub yarn. The spectrogram differs con-siderably from Fig. 4. Particularly in the range of 13 to 42 cm the spectro-gram has a completely different shape.
Fig. 5 Spectrogram of slub yarn
If the thick places have a perfect random distribution, the spectrogram of Fig. 5 would not differ from Fig. 4. A perfect random distribution of the thick places means that every channel of the electronic system which calculates the spectrogram would be triggered regularly. This, however, is not the case in Fig. 5. They are some dominant frequencies in Fig. 5 within the wavelength range of 13 to 42 cm with a peak at 32 cm. Table 2 shows that the number of thick places per 1000 m is 3100 which is an average dis-tance of 32 cm between the thick places. At this distance Fig. 5 also shows the highest peak.
8 (12) USTER® PRODUCTS
THE STANDARD FROM FIBER TO FABRIC
This indicates that the thick places do not occur randomly, but with pre-ferred repetition rates. The most frequent distances between the thick places are in the range of 13 to 42 cm.
Spectrogram MassCV%
Fig. 6 Spectrogram with ideal curve
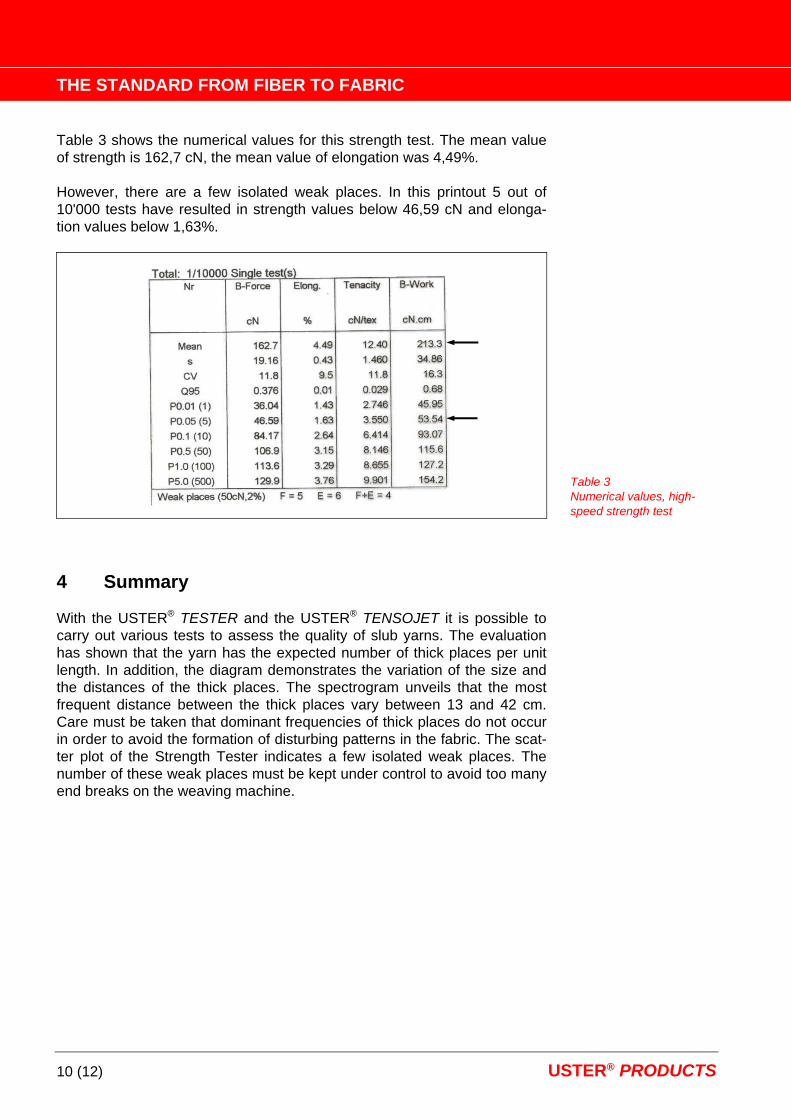
Fig. 6 represents the same spectrogram as shown in Fig. 5. However, the red line represents the ideal spectrogram. Therefore, the deviation from the red line indicates events which are periodic or nearly periodic. The basic spectrogram of cotton is automatically adapted in size (compared to Fig. 4) in order to demonstrate the entire deviations. 3 High-speed strength testing There is a high probability that slub yarns contain isolated thin places if the forming of thick places is not under control. Fig. 7 shows a scatter plot of a high-speed strength tester (USTER® TEN-SOJET). This instrument is able to produce 30'000 breaks per hour. Each dot of the scatter plot of this slub yarn is one test value. Therefore, it is pos-sible to identify the number and size of the weak places on the left hand side of the scatter plot.
Fig. 7 Scatter plot of high-speed strength test
USTER® PRODUCTS 9 (12)
THE STANDARD FROM FIBER TO FABRIC
Table 3 shows the numerical values for this strength test. The mean value of strength is 162,7 cN, the mean value of elongation was 4,49%. However, there are a few isolated weak places. In this printout 5 out of 10'000 tests have resulted in strength values below 46,59 cN and elonga-tion values below 1,63%.
Table 3 Numerical values, high-speed strength test
4 Summary With the USTER® TESTER and the USTER® TENSOJET it is possible to carry out various tests to assess the quality of slub yarns. The evaluation has shown that the yarn has the expected number of thick places per unit length. In addition, the diagram demonstrates the variation of the size and the distances of the thick places. The spectrogram unveils that the most frequent distance between the thick places vary between 13 and 42 cm. Care must be taken that dominant frequencies of thick places do not occur in order to avoid the formation of disturbing patterns in the fabric. The scat-ter plot of the Strength Tester indicates a few isolated weak places. The number of these weak places must be kept under control to avoid too many end breaks on the weaving machine.
10 (12) USTER® PRODUCTS

THE STANDARD FROM FIBER TO FABRIC
USTER® PRODUCTS 11 (12)

THE STANDARD FROM FIBER TO FABRIC
Uster Technologies AG Wilstrasse 11
H-8610 Uster / Switzerland C Phone +41 43 366 36 36
ax +41 43 366 36 37 F www.uster.com [email protected]
12 (12) USTER® PRODUCTS