USPTO Quality Measurements
19
National Association of Patent Practitioners 20 th Annual Meeting and Conference Martin Rater Office of Patent Quality Assurance, USPTO July 28, 2016 1
Transcript of USPTO Quality Measurements

National Association of Patent
Practitioners 20th Annual
Meeting and Conference
Martin Rater Office of Patent Quality Assurance, USPTO
July 28, 2016
1

USPTO Quality Measurements
Challenges, Processes, and Techniques

Challenges
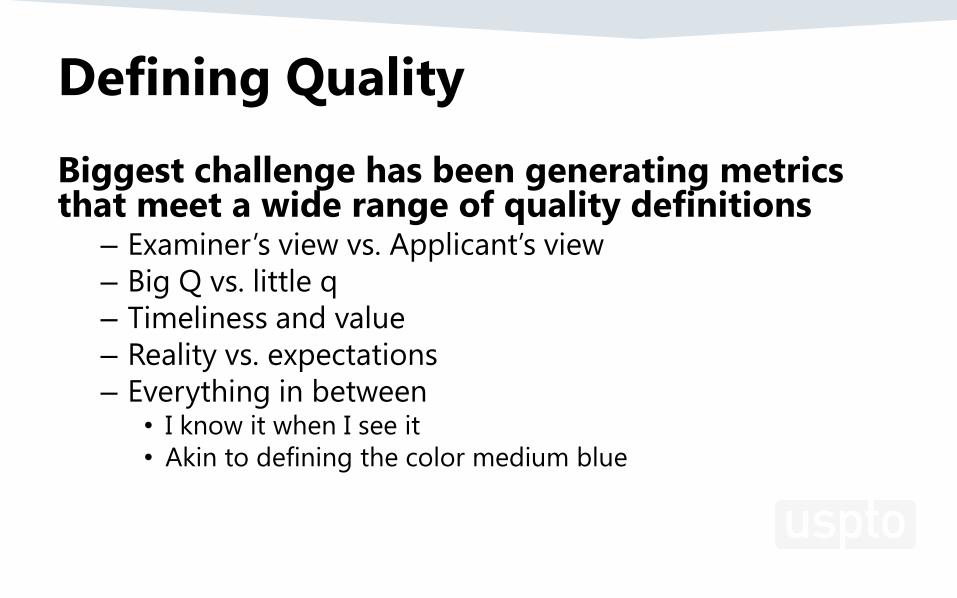
Defining Quality
Biggest challenge has been generating metrics that meet a wide range of quality definitions
– Examiner’s view vs. Applicant’s view
– Big Q vs. little q
– Timeliness and value
– Reality vs. expectations
– Everything in between • I know it when I see it
• Akin to defining the color medium blue

Patent Examination Quality
Primary focus has been on examination quality – Examiners’ adherence to laws, rules, and procedures
– Tracked against some established standards for desired outcomes • Correctness – statutory compliance
• Clarity
• Consistency
• Reopening
• Rework
• Impacts on advancing prosecution
– Basis for historic “compliance” metrics reported by USPTO

Additional Challenges
• Objectivity vs. Subjectivity
• Leading vs. Lagging indicators – What we are doing rather than what we did
• Controlling for a wide range of factors – e.g. Technology; Examiner experience; applicant behavior; pilot programs
and initiatives
• Establishing causal effects
• Balloon-effect of pushing quality problems elsewhere
• Verification and validation of quality metrics
• There is no silver bullet
• Uniqueness of what we do

Processes and
Techniques
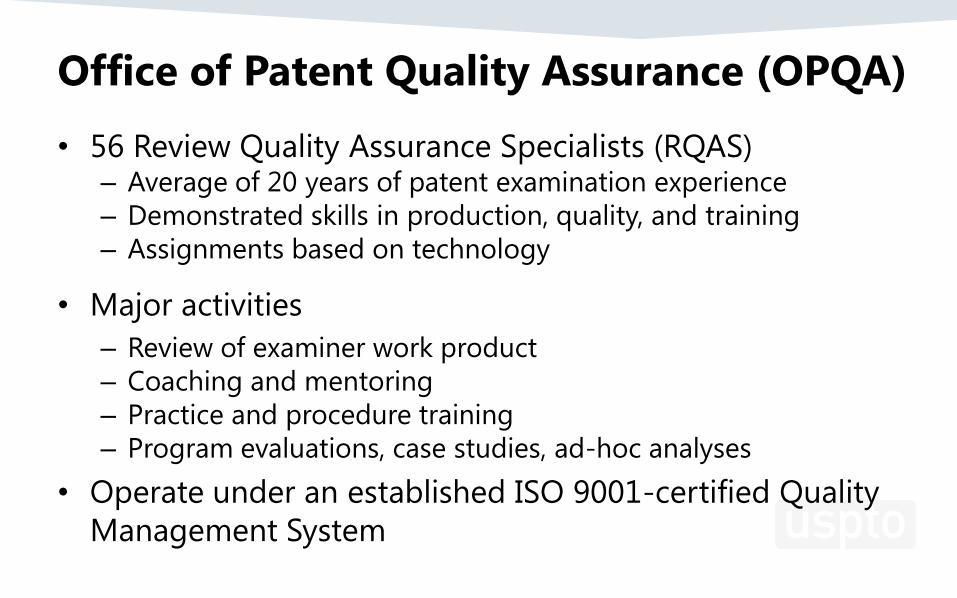
Office of Patent Quality Assurance (OPQA)
• 56 Review Quality Assurance Specialists (RQAS) – Average of 20 years of patent examination experience
– Demonstrated skills in production, quality, and training
– Assignments based on technology
• Major activities
– Review of examiner work product
– Coaching and mentoring
– Practice and procedure training
– Program evaluations, case studies, ad-hoc analyses
• Operate under an established ISO 9001-certified Quality
Management System

Data Sources • Patent Application and Monitoring System (PALM)
– Objective transactional data
• Review-based questionnaires/forms – OPQA
– Patent Operations
– Recent transition to Master Review Form
• Perception surveys – External stakeholders
– Patent examiners and managers
• Administrative data
• Big Data – Office Actions

Study Types
• Descriptive – Describe and explain conditions
• Time series / Longitudinal – Emphasis on growth or change
• Correlational – Explore relationships
• Causal – Cause and effect
Current case studies initiative encompasses multiple study types

Study Designs
• Quasi-experimental
– Lack random assignment
• e.g. program eligibility requirements
– Must control or account for characteristics such as
• Examination experience
• Technology
• Training/background

Sampling
• Random sampling – Larger sample sizes needed for estimating proportions
– Primary factors in sample size determination • How data will be used
• Resources necessary for data collection
– Maintain representativeness
– OPQA-generated metrics based on random sampling: • Compliance rate reviews
• Employee perceptions
• Training effectiveness

Sampling
• Stratified sampling – Superior to simple random sampling
– Requires weighting of data
– OPQA-generated metrics based on random sampling: • External Quality Survey
– Reduce sampling error and limit respondent burden
• Non-Probability Methods – Used sparingly to get general estimate of the results
• Convenience sampling
• Judgement sampling

Analysis of Quality Data
• Trend Analysis – Longitudinal data sets such as compliance rates, Quality Index Reporting
(QIR) database, quality surveys
– Statistically-significant differences • Significance is not always significant!
– Rolling 12-month statistics
• Pre-Post Comparisons – Evaluations of pilot programs
– Impacts of training initiatives and rules/policy changes
– Key points: • Establish a baseline
• Find a control group

Analysis of Quality Data
• Outlier analysis – Anomaly detection
– Primarily has been used for monitoring examination behaviors vis QIR database • Objective, comprehensive data set of transactions
– Big Data greatly enhances ability to detect anomalies • Not biased by what we think are the items of interest
• Custer and Factor Analysis – Cluster: classify
– Factor: reduce
• Correlation and Regression Analysis – Relationships
– Cause and effect
Reporting
• Frequency – Quarterly reporting most common for longitudinal data series
• Allow time for implementation of corrective and/or preventive actions
• Performance award plan inputs
• Level/Details – Maintain statistical validity
– Report only what the sample will support • Corps, TC, Art Unit, Examiner
– Combine reporting periods to enhance level of detail if sample size not sufficient
• Providing data sets for external analyses of data – Data hub
– Master Review Form

Moving Forward

Next steps in USPTO Quality Metrics
• Discontinue Quality Composite
• More granularity
– Statute
– Action Type
– Technology
• Consistency, Reopening, Rework
• External perceptions for validation
• Transparency and sharing of data for external analyses

Questions?