How the Active Directory Replication Model Works_ Active Directory

Economic and Financial MarketsMonthly Review & OutlookDetailed Report
October 2012

U.S. Bank Specialized Industries and Finance • October 2012
Source: Department of Commerce Source: Department of Labor
Source: Department of CommerceSource: Department of Commerce, Labor
We enter the final quarter of 2012 with a domestic economy that overall is struggling when measured in terms of gross domestic product (GDP) growth, real disposable income, jobs and corporate profits. Furthermore, forward looking indicators (aside from residential construction) show little acceleration as we approach year end. Policy uncertainty for the coming year is likely inhibiting business investment, which is tracking as the weakest segment of the economy in the third quarter. In total, our view that GDP growth would average about 1.5% for the final three quarters of 2012 looks to be on the mark. Our baseline forecast continues to anticipate that economic growth in 2013 will proceed very similarly to 2011 and 2012, with a very big caveat that policy makers continue to manage global imbalances in a non-disruptive manner next year.
-10-8-6-4-202468
10
1991 1994 1997 2000 2003 2006 2009 2012
Real Gross Domestic ProductQ/Q Percent Change (SAAR)
Q2 2012
2%3%4%5%6%7%8%9%
10%11%12%
1970 1976 1982 1988 1994 2000 2006 2012
After Tax Corporate Profits % of Nominal GDP
Q2 2012
-1012345678
1989 1992 1995 1998 2001 2004 2006 2009 2012
Nonfarm Productivity Y/Y Percent Change
Q2 2012
-1%
1%
3%
5%
7%
9%
11%
13%-5%
-3%
-1%
1%
3%
5%
7%
9%1982 1987 1992 1997 2002 2007 2012
Unit Labor Costs Y/Y (Inverted) Left Scale
Profit Margins and Unit Labor Costs
Profit Share of GDP Right ScaleQ2 2012
Overview of the Economy

U.S. Bank Specialized Industries and Finance • October 2012
Source: Conference Board Source: Department of Commerce
Source: Department of Commerce Source: Department of Commerce, Federal Reserve
Real disposable income fell in August as a result of high gas prices seeming to curtail real income gains. The combination of rising prices and lackluster income growth resulted in the decline in the savings rate in August. Tepid income data anchors our view of modest spending growth in the coming months. The increase in home values and rising stock prices pushed consumer confidence higher in September. The current level of consumer confidence is mildly supportive of consumption gains in the coming months. However, we anticipate that payroll tax rates will be normalized in 2013, which will restrain spending gains next year.
-6
-4
-2
0
2
4
6
8
1990 1993 1996 1999 2001 2004 2007 2010 2012
Real Personal Consumption Expenditures Q/Q Percent Change (SAAR)
Q2 2012
-6
-4
-2
0
2
4
6
8
1994 1997 2000 2003 2006 2009 2012
Real Consumer Spending and Disposable Income Y/Y Percent Change
Aug-12
Real Disposable Income
Real Consumer Spending
10
30
50
70
90
110
130
150
1994 1997 2000 2003 2006 2009 2012
Consumer ConfidenceIndex Level
Sep-12
3.50
4.50
5.50
6.50
0
2
4
6
8
10
12
14
1980 1984 1988 1992 1996 2000 2004 2008 2012
Household Net Worth and Personal Savings Rate
Net Worth Multiple of Disposable Income (right scale)
Personal Savings Percent of Disposable Income (left scale)
Q2 2012
Aug-12
Consumer Expenditures

U.S. Bank Specialized Industries and Finance • October 2012
Source: Department of Commerce Sources: Department of Commerce, Nat’l Assoc. of Realtors
Source: Department of Commerce Source: Standard and Poors
Housing starts rose and building permits fell in August. But both remain in an uptrend, a sign that the housing recovery continues. Home prices rose in July, reflecting the gradual improvement in housing market conditions. The combination of stronger demand, reduced inventory and the decline in distressed sales should support prices going forward. Homebuilder sentiment continued to climb in September as builders remain optimistic about the recovery. Cheaper properties and record low mortgage rates are attracting buyers as mortgage applications for home purchases showed gains during the month. A broader recovery may be hindered by tight lending standards, fiscal uncertainty and high unemployment. Homebuilding remains the fastest growing segment of the economy.
400600800
10001200140016001800200022002400
1990 1993 1996 1999 2002 2005 2008 2011 2014
Housing Starts and Building Permits (Thousand Units) Seasonally Adjusted Annual Rate
Aug-12
Building Permits
Housing Starts
2
3
4
5
6
7
8
1989 1992 1995 1998 2001 2004 2007 2010 20130
200400600800
1000120014001600
New Home Sales and Existing Home Sales (SAAR)
New Home Sales (left scale, thousands)
Existing Home Sales (right scale, millions)
Aug-12
1.0
1.5
2.0
2.5
3.0
1989 1993 1997 2001 2005 2009 2013
Homeowner Vacancy Rate
Q2 2012
-20-16-12-8-4048
121620
2001 2003 2005 2007 2009 2011 2013
Case-Shiller Composite 20 City Home Price Index Y/Y Percent Change
Jul-12
Housing
U.S. Bank Specialized Industries and Finance • October 2012
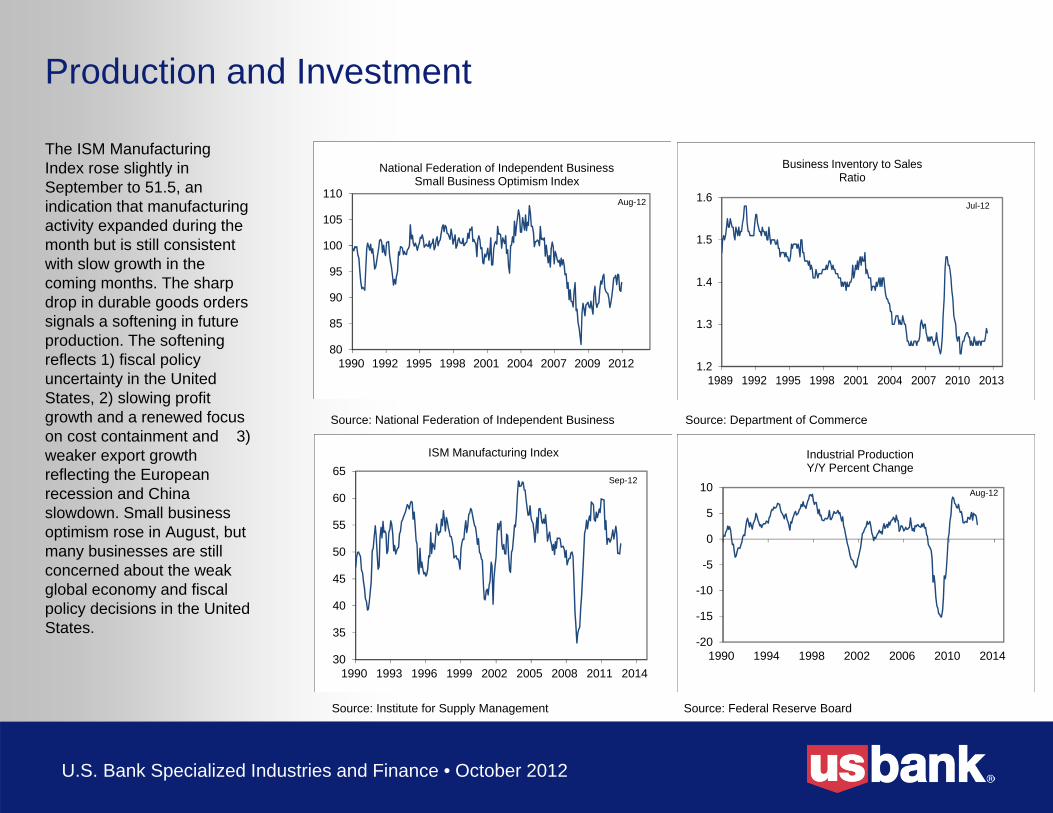
Source: National Federation of Independent Business Source: Department of Commerce
Source: Institute for Supply Management Source: Federal Reserve Board
The ISM Manufacturing Index rose slightly in September to 51.5, an indication that manufacturing activity expanded during the month but is still consistent with slow growth in the coming months. The sharp drop in durable goods orders signals a softening in future production. The softening reflects 1) fiscal policy uncertainty in the United States, 2) slowing profit growth and a renewed focus on cost containment and 3) weaker export growth reflecting the European recession and China slowdown. Small business optimism rose in August, but many businesses are still concerned about the weak global economy and fiscal policy decisions in the United States.
1.2
1.3
1.4
1.5
1.6
1989 1992 1995 1998 2001 2004 2007 2010 2013
Business Inventory to Sales Ratio
Jul-12
-20
-15
-10
-5
0
5
10
1990 1994 1998 2002 2006 2010 2014
Industrial Production Y/Y Percent Change
Aug-12
30
35
40
45
50
55
60
65
1990 1993 1996 1999 2002 2005 2008 2011 2014
ISM Manufacturing Index
Sep-12
80
85
90
95
100
105
110
1990 1992 1995 1998 2001 2004 2007 2009 2012
National Federation of Independent Business Small Business Optimism Index
Aug-12
Production and Investment

U.S. Bank Specialized Industries and Finance • October 2012
Source: Department of Commerce Source: Department of Commerce
Source: Bloomberg Sources: U.S. Department of Commerce
The real trade deficit widened in July as real exports slid 2.2%, the most in more than a year. This indicates that trade will likely weigh on GDP growth in third quarter and into fourth quarter 2012. The European recession remains ongoing despite the more favorable tone to financial markets in recent weeks, and indicators in China show no impending reacceleration in growth. Recent dollar weakness in reaction to additional quantitative easing (QE) is unlikely to materially alter current trends in international trade.
-70
-60
-50
-40
-30
-20
-10
0
1992 1995 1998 2001 2004 2007 2010 2013
US Real Goods Trade Balance$ Billions
Jul-12
-40-30-20-10
010203040
1993 1996 1999 2002 2005 2008 2011 2014
U.S. Imports and Exports Y/Y Percent Change
Imports
Exports
Jul-12
70
80
90
100
110
120
130
1989 1992 1995 1998 2001 2004 2007 2010 2013
U.S. Dollar Indexvs. Major Currencies
Sep-12
-75
-65
-55
-45
-35
-25
-15
-5
5
1992 1996 2000 2004 2008 2012
US Trade Balance $ Billions
Jul-12
International Trade
U.S. Bank Specialized Industries and Finance • October 2012
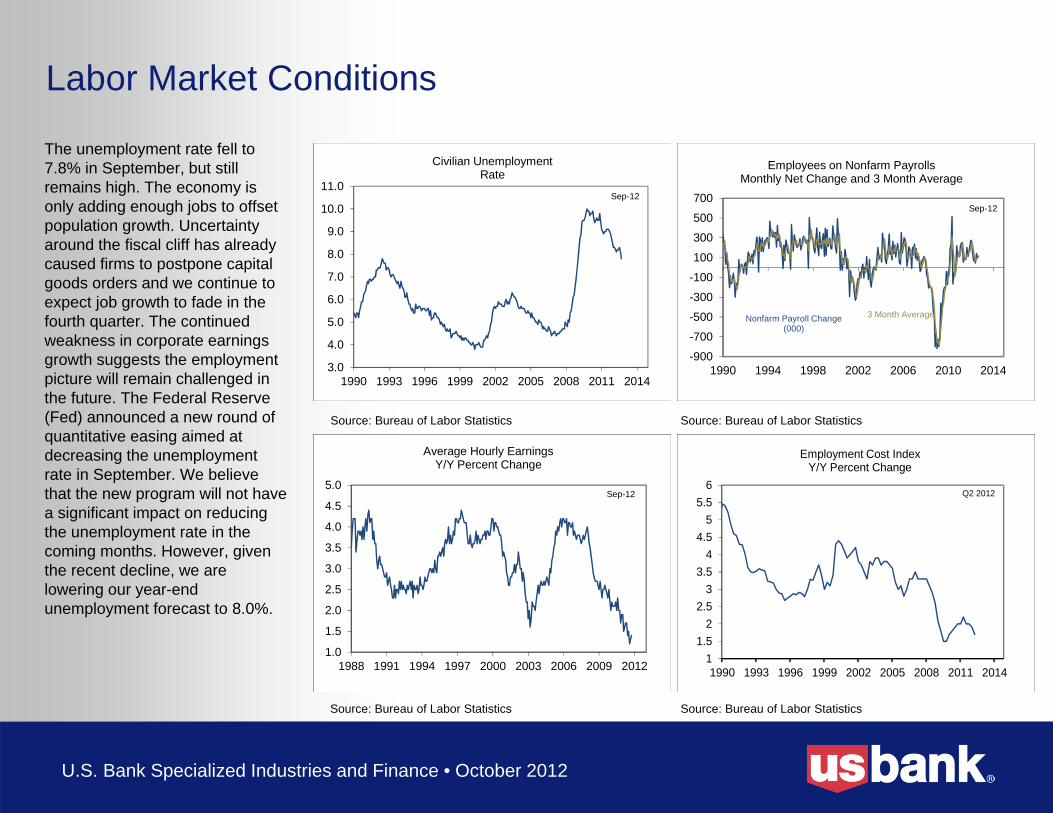
Source: Bureau of Labor Statistics Source: Bureau of Labor Statistics
Source: Bureau of Labor Statistics Source: Bureau of Labor Statistics
The unemployment rate fell to 7.8% in September, but still remains high. The economy is only adding enough jobs to offset population growth. Uncertainty around the fiscal cliff has already caused firms to postpone capital goods orders and we continue to expect job growth to fade in the fourth quarter. The continued weakness in corporate earnings growth suggests the employment picture will remain challenged in the future. The Federal Reserve (Fed) announced a new round of quantitative easing aimed at decreasing the unemployment rate in September. We believe that the new program will not have a significant impact on reducing the unemployment rate in the coming months. However, given the recent decline, we are lowering our year-end unemployment forecast to 8.0%.
3.0
4.0
5.0
6.0
7.0
8.0
9.0
10.0
11.0
1990 1993 1996 1999 2002 2005 2008 2011 2014
Civilian UnemploymentRate
Sep-12
1.0
1.5
2.0
2.5
3.0
3.5
4.0
4.5
5.0
1988 1991 1994 1997 2000 2003 2006 2009 2012
Average Hourly EarningsY/Y Percent Change
Sep-12
-900
-700
-500
-300
-100
100
300
500
700
1990 1994 1998 2002 2006 2010 2014
Employees on Nonfarm Payrolls Monthly Net Change and 3 Month Average
Sep-12
Nonfarm Payroll Change (000)
3 Month Average
11.5
22.5
33.5
44.5
55.5
6
1990 1993 1996 1999 2002 2005 2008 2011 2014
Employment Cost Index Y/Y Percent Change
Q2 2012
Labor Market Conditions

U.S. Bank Specialized Industries and Finance • October 2012
Source: Bureau of Labor Statistics Source: Federal Reserve Board
Source: Bureau of Labor Statistics Source: Reuters
Headline Consumer Price Index (CPI) rose in August, led by a surge in gas prices and a modest rise in food prices. The effects of the drought have not yet had a material impact on consumer prices, but will likely gradually build into food prices over the next several months. The Fed agreed to increase policy accommodation by purchasing additional agency mortgage-backed securities at a pace of $40 billion per month until economic conditions improve. We believe these additional asset purchases will not likely reduce long-term interest rates by a significant amount and will probably not have a substantial impact on economic growth in the near term. We will monitor longer term inflation expectations closely.
-6
-4
-2
0
2
4
6
1989 1992 1995 1998 2001 2004 2007 2010 2013
Nonfarm Unit Labor CostsY/Y Percent Change
Q2 2012
-3-2-101234567
1990 1993 1996 1999 2002 2005 2008 2011 2014
Consumer Price Index Y/Y Percent Change
Aug-12
CPI Ex. Food/Energy
CPI
-25-20-15-10-505
10152025
1991 1994 1997 2000 2003 2006 2009 2012
U.S. Import Prices Y/Y Percent Change
Aug-12
-60
-40
-20
0
20
40
60
1991 1994 1997 2000 2003 2006 2009 2012
CRB Commodity Index Y/Y Percent Change
Sep-12
Inflation and Monetary Policy

U.S. Bank Specialized Industries and Finance • October 2012
Source: Bloomberg Source: Bloomberg
Source: Barclays Capital Source: Barclays Capital
At the beginning of September the yield on the 10-Year U.S. Treasury bond rose to 1.88 as investors feared that the Fed’s plan to buy more debt and its pledge to keep monetary policy accommodative even when the economy strengthens would spur inflation. As Spanish debt yields rose toward levels that prompted other European nations to seek bailouts, investors sought safe assets, which drove the yield lower. The yield fell further at the end of the month as indicators of inflation expectations receded from the highs reached after the Federal Reserve announced a third round of quantitative easing.
0%
1%
2%
3%
4%
5%
3 Mo 2Yr 5Yr 10Yr 30Yr
U.S. TreasuryYield Curve
9/28/2011
9/28/2012
-2
0
2
4
6
8
10
1990 1993 1996 1999 2002 2005 2008 2011 2014
US Treasury YieldsPercent
Sep-12
3 Month Treasury Yield
10 Year Treasury Yield
0.0
1.0
2.0
3.0
4.0
5.0
6.0
7.0
8.0
2000 2002 2004 2006 2008 2010 2012Aaa AaA Baa
Credit Spreads by Quality (percent)Sep-12
5.16%2.99% 3.28%
10.76%
3.71%
12.64%
9.10% 8.32%
1.58%0.57% 1.11%
3.83%1.13%
3.99%2.12% 2.32%
-8.0%-4.0%0.0%4.0%8.0%
12.0%16.0%20.0%24.0%
Agg
rega
te
Trea
s.
Age
ncy
Cor
p
Mor
t
HY
Tips
Mun
i
Total Return by Market Sector
12 Months ending 9/28/2012
3 Months ending 9/28/2012
Fixed-Income Market

U.S. Bank Specialized Industries and Finance • October 2012
Source: Bloomberg Source: FactSet
Source: FactSet Source: Bloomberg
The S&P 500 Index rose 2.57% in September as markets reacted positively to the new program announced by the European Central Bank (ECB) and the Fed’s announcement of QE3. The index reached its 2012 high on September 14 only to fall through the end of the month as investors began to question whether QE3 was going to boost growth and questions emerged about who should bear the cost of problems within Spanish banks. Third quarter 2012 expectations look for a 1.1% decrease in year-over-year earnings for S&P 500 companies. Out of the 123 companies that have issued third-quarter guidance, 74% have issued negative. We continue to forecast $100 per share for full-year earnings given the slow trend in nominal GDP growth, weak external environment and the higher level of the dollar.
-20%
0%
20%
40%
2011
2012 YTD
Total Return by Sector09/28/12
-60%
-40%
-20%
0%
20%
40%
60%
1992 1995 1998 2001 2004 2007 2010 2013
S&P 500 Year/Year Percent Change
Sep-12
-40%-30%-20%-10%
0%10%20%30%40%
2011
2012 YTD
09/28/12Total Return by Style
0
200
400
600
800
1000
1200
1400
1600
1800
0500
100015002000250030003500400045005000
1987 1990 1993 1996 1999 2002 2005 2008 2011 2014
S&P 500 and NASDAQ
S&P 500 (right scale)
NASDAQ (left scale)
Sep-12
Equity Market

U.S. Bank Specialized Industries and Finance • October 2012
Source: MSCI Barra Source: MSCI Barra
Source: MSCI Barra Source: MSCI Barra
MSCI Emerging Markets Index was the most improved in September, as markets reacted favorably to central bank actions in Europe, the United States, Japan, China and Brazil to counter the drag on growth from Europe’s debt. The European Central Bank unveiled a new bond-buying program named Outright Monetary Transactions (OMTs), which will make open-ended purchases of short-term government bonds to keep borrowing costs down for struggling European countries. The People’s Bank of China injected a record amount of funds into their financial system to address the slow growth occurring in China. The Bank of Japan said it will provide more monetary stimulus by increasing the size of its asset purchases in response to a slowing in domestic economic activity.
0
1
2
3
4
5
6
7
1989 1992 1995 1998 2001 2004 2007 2010 2013
S&P 500 Index Relativeto MSCI AC World Ex US Index
Sep-12
-25%-20%-15%-10%-5%0%5%
10%15%
2011
2012 YTD
Total Return By Market Segment 09/28/12
0
100
200
300
400
500
600
1989 1992 1995 1998 2001 2004 2007 2010 2013
MSCI AC World ex US Total Return Index
Sep-12
0.000.050.100.150.200.250.300.350.400.45
1989 1992 1995 1998 2001 2004 2007 2010 2013
MSCI Emerging Markets vs. MSCI EAFE Ratio
Sep-12
International Markets

U.S. Bank Specialized Industries and Finance • October 2012
2012 Bloomberg 2013 Bloomberg2011 (A) 2012 (F) 2013 (F) Consensus** Consensus**
Real GDP (Q4/Q4) 2.0% 1.2% - 2.2% 1.2% - 2.2% 2.2% 2.1%Personal Consumption Expenditures 1.9% 1.0% - 2.0% 1.0% - 2.0%Investment 10.9% 2.0% - 4.0% 2.0% - 4.0%Net Exports ($) $-418B -$400B -$405BGovernment Spending -3.3% -1.0% - 0.0% -1.0% - 0.0%
Unemployment Rate*** 8.5% 8.0% 8.0% 8.2% 7.9%
CPI*** 3.0% 1.0% - 2.0% 1.0% - 2.0% 2.00% 2.00%CPI Excluding Food & Energy 2.2% 0.9% - 1.9% 0.8% - 1.8%
Fed Funds*** 0.25% 0.00 - 0.25% 0.00 - 0.25% 0.25% -10 Year Treasury*** 1.88% 1.50% - 2.50% 1.50% - 2.50% 1.75% -
Corporate Earnings (S&P Operating) $96.34 $100.00 $103.00 101.49* 115.06*Trade Weighted Dollar*** 80.18 80-90 80-90*Standard & Poor’s - September 28, 2012.**Bloomberg - October 8, 2012.***End of Period Level.
Economic, Rates and Earning Forecast

U.S. Bank Specialized Industries and Finance • October 2012
DisclosureSource: These views were prepared by Keith Hembre, Chief Economist for U.S. Bank. These views are subject to change at any time based upon market or other conditions and are current as of the date indicated on these materials. U.S. Bank is not responsible for and does not guarantee the products, services or performance of its affiliates and third party providers. This information is not intended to be a forecast of future events or guarantee of future results. It is not intended to provide specific advice or be construed as an offering of securities or a recommendation to invest. Not for use as a primary basis of investment decisions. Not to be construed to meet the needs of any particular investor. Not a representation or solicitation or an offer to sell/buy any security. Investors should consult with their investment professional for advice concerning their particular situation.
Past performance does not guarantee future results. All performance data, while deemed obtained from reliable sources, are not guaranteed for accuracy. Indexes shown are unmanaged and are not available for investment. The S&P 500 Index is a capitalization weighted index of 500 widely traded stocks that are considered to represent the performance of the U.S. stock market in general. Russell 1000 Value measures the performance of those Russell 1000 Index securities with lower price-to-book ratios and lower forecasted growth values, and is representative of U.S. securities exhibiting value characteristics. Russell 1000 Growth measures the performance of those Russell 1000 Index securities with lower price-to-book ratios and lower forecasted growth values, and is representative of U.S. securities exhibiting value characteristics. Russell Midcap measures the performance of the mid-cap segment of the U.S. equity universe and is a subset of the Russell 1000 Index. Russell 2000 measures the performance of the 2,000 smallest companies in the Russell 3000 Index and is representative of the U.S. small capitalization securities market. The NASDAQ Composite Index is market capitalization weighted average of roughly 5,000 stocks that are electronically traded in the NASDAQ market. MSCI EAFE Index is an unmanaged index that includes approximately 1,000 companies representing the stock markets of 21 countries in Europe, Australasia and the Far East (EAFE). MSCI Emerging Markets EMG Index is designed to measure equity market performance in global emerging markets. This index includes sub-indexes for various countries (such as China and Brazil). MSCI All Country World Index (excluding U.S.) tracks the performance of stocks representing developed and emerging markets around the world that collectively comprise most foreign stock markets. U.S. stocks are excluded from this index. MSCI World Index is an unmanaged index which tracks equity market performance of developed markets through individual country indices. MSCI Country Indices represent the market for a particular country.
Equity securities are subject to stock market fluctuations that occur in response to economic and business developments. Growth stocks are typically more volatile than value stocks; however, value stocks have a lower expected growth rate in earnings and sales. The value of large cap stocks will rise and fall in response to the activities of the company that issued them, general market conditions, and/or economic conditions. Stocks of small-and mid-cap companies pose special risks, including possible illiquidity and greater price volatility than stocks of larger, more established companies. International investing involves risks not typically associated with domestic investing, including risks of adverse currency fluctuations, potential political and economic instability, different accounting standards, foreign government regulations, currency exchange rates, limited liquidity, and volatile prices. Investing in emerging markets may involve greater risks than investing in more developed countries. In addition, concentration of investments in a single region may result in greater volatility. Investments in fixed income debt securities typically decrease in value when interest rates rise. This risk is usually greater for longer-term debt securities. Investments in real estate can be subject to fluctuations in the value of the underlying properties, the effect of economic conditions on real estate values, changes in interest rates and risks related to renting properties, such as rental defaults. An inflation protected security is a special type of note or bond designed to offer protection from inflation. Interest payments vary with the rate of inflation. These securities offer a lower return compared to other similar investments. The principal value may increase or decrease with the rate of inflation. Investments in high-yield bonds offer the potential for high current income and attractive total return, but involve certain risks. Changes in economic conditions or other circumstances may adversely affect a bond issuer’s ability to make principal and interest payments. There are special risks associated with an investment in commodities, including market price fluctuations, regulatory changes, interest rate changes, credit risk, economic changes, and the impact ofadverse political or financial factors. An investment in a hedge fund involves a substantially more complicated set of risk factors than traditional investments in stocks and bonds. Hedge funds are speculative and involve a high degree of risk. Investments in private equity are illiquid by nature and typically represent a long-term binding commitment. The investments made by private equity funds are not readily marketable and the valuation procedures for these positions are often subjective in nature.
10/2012
NOT A DEPOSIT NOT FDIC INSURED MAY LOSE VALUE NOT GUARANTEED BY THE BANK
NOT INSURED BY ANY FEDERAL GOVERNMENT AGENCY