Using the WCC Carbon Calculation Spreadsheet …...Lookup Table Guidance 3 Version 2.0 08 March 2018...
21
Lookup Table Guidance Version 2.0 08 March 2018 1 Using the WCC Carbon Calculation Spreadsheet Version 2.0 Vicky West March 2018 Contents 1. Introduction ................................................................................................................. 3 2. How to Complete a Carbon Calculation using the workbook provided........................ 3 2.1 Small project (≤ 5 ha net planting area) ................................................................. 3 2.2 Standard-sized project (over 5 ha net planting area)............................................. 4 2.2.1 Assumptions table 1: ........................................................................................... 4 2.2.2 Assumptions table 2: ........................................................................................... 6 2.2.3 Sequestration per hectare Table 3....................................................................... 8 2.2.4 Project sequestration Table 4 ............................................................................ 12 2.2.5 Net Carbon Sequestration Table 5 .................................................................... 13 2.2.6 Pending Issuance Units by Vintage ................................................................... 13 2.3 Total for groups or compartments within a project................................................14 2.3.1 Multiple compartments within a project .............................................................. 14 2.3.2 Multiple projects within a group.......................................................................... 14 5. References ................................................................................................................14 Appendix 1: The Makeup of the Biomass Carbon Lookup Table ..................................15 1.1 The ‘Biomass Carbon Lookup Table’ ...................................................................15 1.2 ‘Clearfell_Max_Seq_Values’ for clearfell options..................................................17 Appendix 2: Default values to use for broadleaved species..........................................18 Appendix 3: Default values to use for conifer species ..................................................20
Transcript of Using the WCC Carbon Calculation Spreadsheet …...Lookup Table Guidance 3 Version 2.0 08 March 2018...

Lookup Table Guidance Version 2.0 08 March 2018 1
Using the WCC Carbon Calculation Spreadsheet Version 2.0 Vicky West March 2018
Contents 1. Introduction ................................................................................................................. 3
2. How to Complete a Carbon Calculation using the workbook provided........................ 3
2.1 Small project (≤ 5 ha net planting area) ................................................................. 3
2.2 Standard-sized project (over 5 ha net planting area) ............................................. 4
2.2.1 Assumptions table 1: ........................................................................................... 4 2.2.2 Assumptions table 2: ........................................................................................... 6
2.2.3 Sequestration per hectare Table 3 ....................................................................... 8
2.2.4 Project sequestration Table 4 ............................................................................ 12
2.2.5 Net Carbon Sequestration Table 5 .................................................................... 13 2.2.6 Pending Issuance Units by Vintage ................................................................... 13
2.3 Total for groups or compartments within a project ................................................14
2.3.1 Multiple compartments within a project .............................................................. 14
2.3.2 Multiple projects within a group.......................................................................... 14
5. References ................................................................................................................14
Appendix 1: The Makeup of the Biomass Carbon Lookup Table ..................................15
1.1 The ‘Biomass Carbon Lookup Table’ ...................................................................15
1.2 ‘Clearfell_Max_Seq_Values’ for clearfell options ..................................................17
Appendix 2: Default values to use for broadleaved species ..........................................18
Appendix 3: Default values to use for conifer species ..................................................20

Lookup Table Guidance Version 2.0 08 March 2018 2
Updates to versions
Version No
Date Amendment Who
1.0 19/08/2010 -- Vicky West
1.1 01/10/2010 Correction to calculation in 3.5 – Clearfell after n years. Does not affect method or outcome
Vicky West
1.2 14/01/2011 -Description of ‘Max Clearfell Values’ sheet at 1.2 -Addition of guidance on native species mixtures at 3.2 / 3.4 -Change to guidance on clearfell regimes at 3.5 -Further clarity on the Permanence/Risk buffer at 4.
Vicky West
1.3 21/07/2011 -Update to model: Slight changes to figures in examples. -Addition of emissions from woodland management
Vicky West
1.4 27/07/2012 -Slight amendment to 3.6 Emissions from Woodland Management, Table 6, Seedling Cost. -Reflect changes to Risk Rating
Vicky West
2.0 08/03/2018 -Update to match WCC Carbon Calculation Spreadsheet V2.0 and WCC Carbon Lookup Tables V2.0
Vicky West
Disclaimer of Warranty – WCC Carbon Lookup Tables The Woodland Carbon Code Carbon Lookup Tables are distributed ‘as is’ and without warranties as to performance or merchantability or any other warranties whether expressed or implied. In particular, there is no warranty for the predictions derived from the Carbon Lookup Tables as they are regarded as indicative and not prescriptive. No responsibility for loss occasioned to any person or organisation acting, or refraining from action, as a result of any material in the product can be accepted by the Forestry Commission.

Lookup Table Guidance Version 2.0 08 March 2018 3
1. Introduction The Workbook ‘WCC Carbon Calculation Spreadsheet Version 2.0’ provides a template in which to carry out a prediction of carbon sequestration for a woodland project. There are a number of sheets in the workbook:
Standard Project Carbon Calculator – for ‘standard’ sized (> 5ha) projects
Small Project Carbon Calculator – for projects ≤ 5ha
A Summary PIU table for any projects which have multiple parts to a calculation or for groups of projects to provide a total amount of carbon.
3 examples of use of the Standard Project Carbon Calculator for a Productive conifer clearfell, regular thinned and a mixed native woodland.
The Carbon Calculation Spreadsheet should be used in conjunction with the updated WCC Carbon Lookup Tables Version 2.0 which contains the following sheets:
Biomass Carbon Lookup Table
Clearfell Maximum Sequestration Values
Soil Carbon Emissions from Ground Preparation
Soil Carbon accumulation Lookup Table
2. How to Complete a Carbon Calculation using the workbook provided Within the ‘WCC Carbon Calculation Spreadsheet’, both ‘Standard Project’ and ‘Small Project’ Carbon Calculators follow the same principle. The blue ‘assumptions’ cells need to be completed, and then the calculation should occur automatically.
2.1 Small project (≤ 5 ha net planting area)
The Small Project calculator is much simpler to use than the Standard Project calculator, as it makes certain assumptions about the establishment technique and the growth rate of trees planted. Only the blue boxes need to be completed and then the calculation is automatically completed. Note the Small Project Calculator can only be used for projects with 5 hectares net planting area or less, and only for projects which do not involve clearfelling. On the Small Project calculator you need to add
1. Project name 2. Name of person completing calculation 3. Date of calculation 4. Project start date (last day of planting) consistent with your PDD 5. Area of woodland creation which is:
a. Broadleaved minimum intervention b. Broadleaved thinned c. Conifer minimum intervention d. Conifer thinned
6. To establish soil carbon emissions: a. Soil type b. Previous land-use c. Site preparation technique d. Area of land that was prepared.

Lookup Table Guidance Version 2.0 08 March 2018 4
The prediction of the carbon to be sequestered will then be calculated automatically, and the ‘Pending Issuance Units by Vintage’ table should be copied to the Project Design Document. As part of the validation process, we also need to see the species breakdown of the project. This should be added in columns F to K for validation but it does not form part of the carbon calculation.
2.2 Standard-sized project (over 5 ha net planting area)
The Standard Project Carbon Calculator requires a few more inputs to be clarified by the project developer. Within the WCC Carbon Calculation Spreadsheet there are three example calculations which should also help:
A productive conifer scenario (no thinning, clearfell only)
A productive conifer scenario (regular thin only)
A mixed native woodland (minimum intervention) The calculator is divided into a number of tables from Left to Right. The actions to take in each are described below.
2.2.1 Assumptions table 1:
The first table brings together the assumptions about:
The timing and area of the project (start date, duration, net planting area)
The emissions generated whilst establishing the woodland
The soil carbon emissions due to disturbing the soil during establishment
The desire to claim for soil carbon accumulation These emissions due to establishment are accounted for in year 1 of the project. Timing and area: Start date: Enter the start date in dd/mm/yyyy format. The start date is the last date of planting. Project duration: Enter the project duration in years. Net planting area: Enter the net planting area (excluding open space/open ground) Emissions due to establishment:
For seedlings, enter the spacing used and the area of seedlings planted.
For Ground prep, tree shelters, fencing and herbicide, enter the area for which these are applicable. Remember a larger area could have been fenced, and herbicide could be applied more than once (double the area if two applications).
If any forest roads are constructed, enter the length in km.
If any trees or vegetation was removed prior to the start of the project this should be accounted for separately. See Guidance on 3.3 Project Carbon Sequestration
Soil carbon emissions from site preparation: Disturbance of soil during ground preparation can lead to greenhouse gas emissions from the soil. The greater the volume of soil disturbance, the greater the level of emissions. This soil carbon emission is accounted for in year 1 of the project. Enter the soil type, previous land-use, site preparation technique and country using the dropdown menus. You then need to select the area which has been prepared using this

Lookup Table Guidance Version 2.0 08 March 2018 5
technique - for some projects only a proportion of the site might have been mounded for example. Soil carbon accumulation: Under certain conditions, with minimal ground disturbance, soil carbon can accumulate as a woodland grows. Currently it is only possible to claim for this accumulation for a woodland managed as minimum intervention, which is on mineral soil and was previously in arable use. Select ‘Yes’ if you would like to claim soil carbon accumulation. Assumptions Table 1, Example for a mixed native woodland
Assumptions Table 1
Project Basics
01 April 2018
Project duration (years) 100
10.00
Emissions from establishment spacing (m) area (ha) tCO2e/ha tCO2e
Seedlings 2.5 10.0 -0.24 -2.4
Ground Preparation (Fuel) 10.0 -0.06 -0.6
Tree Shelters 0.0 -0.82 0.0
Fencing 15.0 -1.64 -24.6
Herbicide 10.0 -0.001 0.0
Road Building km tCO2e/km tCO2e
Roads 0.0 -43.13 0.0
Emissions from removal of trees or other vegetation at the start of the project
0.0
Total Emissions from establishment -27.6
Soil Type Mineral
Previous Landuse Arable
Site Preparation Technique
Negligible Disturbance:
Hand screefing only
Country England
% Topsoil Carbon Lost 0
Area tCO2e/ha tCO2e
10 0.0 0.0
Yes
Project start date
If previously arable site on mineral soil: Are you claiming any carbon
sequestration? Yes/No
Total soil carbon emissions
Soil carbon emissions (establishment) and sequestration
Soil C emissions from site preparation
Total net planting area - excluding open space (ha)
To be calculated separately if any trees or other vegetation is removed prior to
planting. See 3.3 Guidance
Soil Carbon accumulation (currently only claimable for a site with mineral soil which was previously
in arable use)
Lookup Table Guidance Version 2.0 08 March 2018 6
2.2.2 Assumptions table 2:
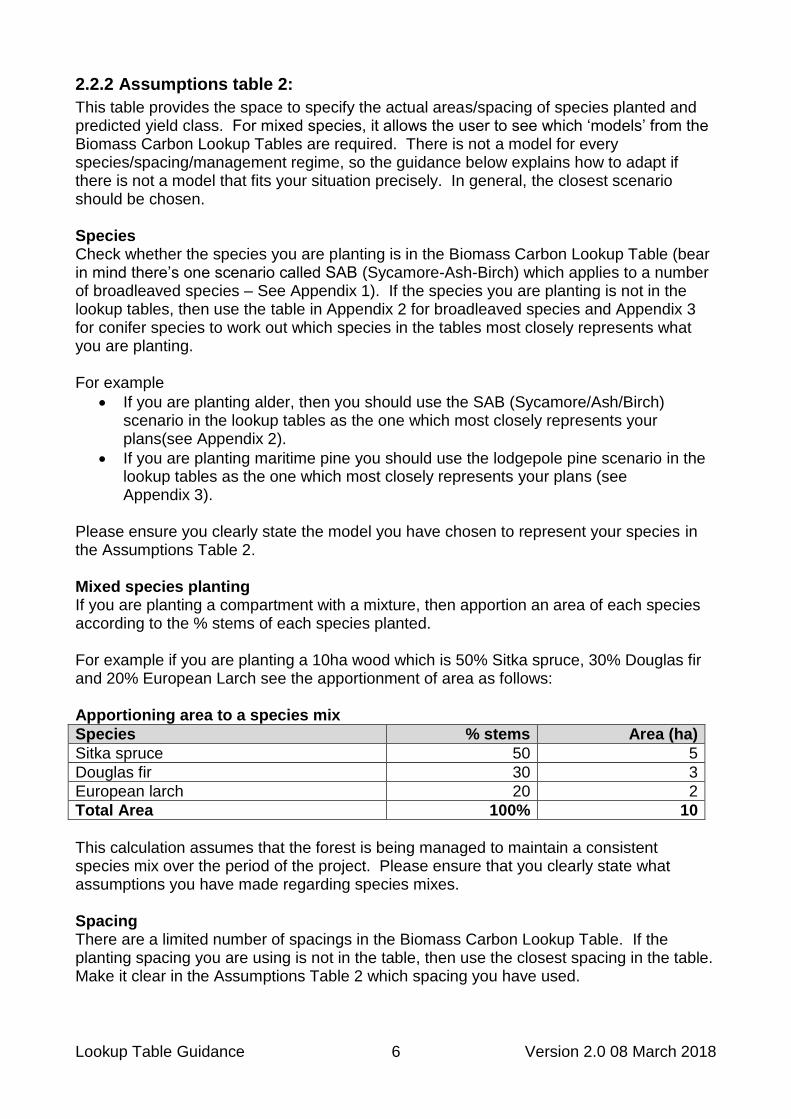
This table provides the space to specify the actual areas/spacing of species planted and predicted yield class. For mixed species, it allows the user to see which ‘models’ from the Biomass Carbon Lookup Tables are required. There is not a model for every species/spacing/management regime, so the guidance below explains how to adapt if there is not a model that fits your situation precisely. In general, the closest scenario should be chosen. Species Check whether the species you are planting is in the Biomass Carbon Lookup Table (bear in mind there’s one scenario called SAB (Sycamore-Ash-Birch) which applies to a number of broadleaved species – See Appendix 1). If the species you are planting is not in the lookup tables, then use the table in Appendix 2 for broadleaved species and Appendix 3 for conifer species to work out which species in the tables most closely represents what you are planting. For example
If you are planting alder, then you should use the SAB (Sycamore/Ash/Birch) scenario in the lookup tables as the one which most closely represents your plans(see Appendix 2).
If you are planting maritime pine you should use the lodgepole pine scenario in the lookup tables as the one which most closely represents your plans (see Appendix 3).
Please ensure you clearly state the model you have chosen to represent your species in the Assumptions Table 2. Mixed species planting If you are planting a compartment with a mixture, then apportion an area of each species according to the % stems of each species planted. For example if you are planting a 10ha wood which is 50% Sitka spruce, 30% Douglas fir and 20% European Larch see the apportionment of area as follows: Apportioning area to a species mix
Species % stems Area (ha)
Sitka spruce 50 5
Douglas fir 30 3
European larch 20 2
Total Area 100% 10
This calculation assumes that the forest is being managed to maintain a consistent species mix over the period of the project. Please ensure that you clearly state what assumptions you have made regarding species mixes. Spacing There are a limited number of spacings in the Biomass Carbon Lookup Table. If the planting spacing you are using is not in the table, then use the closest spacing in the table. Make it clear in the Assumptions Table 2 which spacing you have used.
Lookup Table Guidance Version 2.0 08 March 2018 7
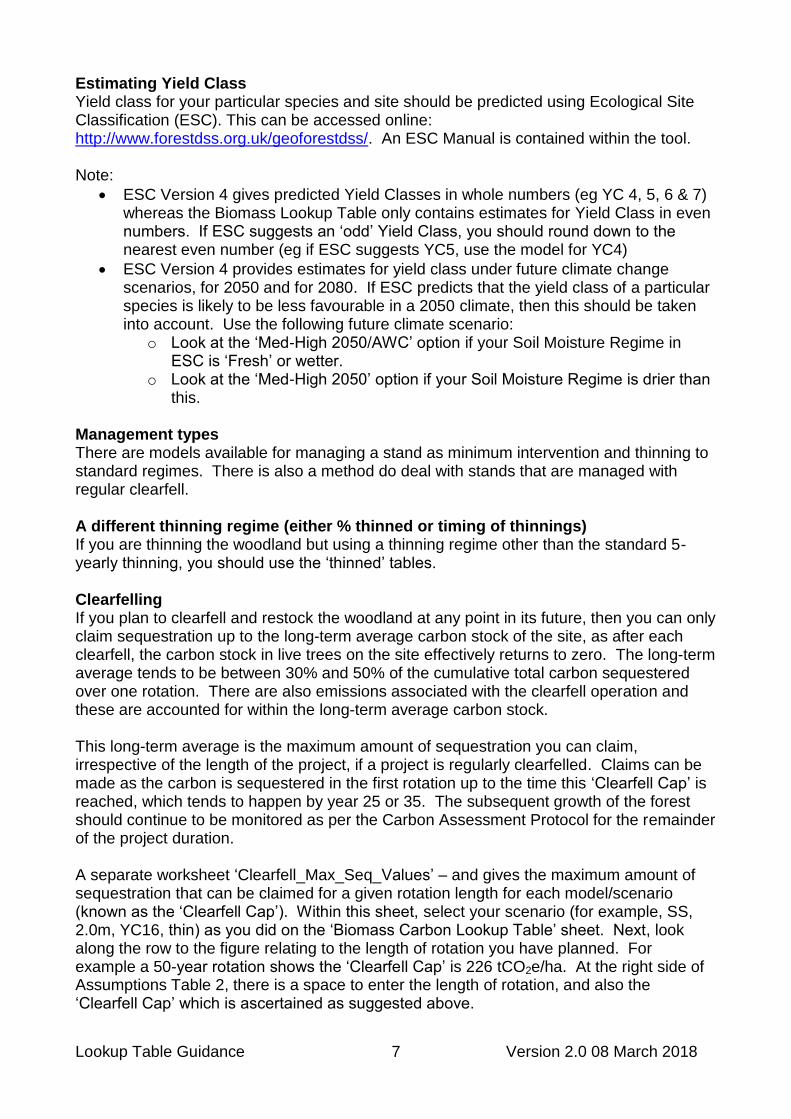
Estimating Yield Class Yield class for your particular species and site should be predicted using Ecological Site Classification (ESC). This can be accessed online: http://www.forestdss.org.uk/geoforestdss/. An ESC Manual is contained within the tool. Note:
ESC Version 4 gives predicted Yield Classes in whole numbers (eg YC 4, 5, 6 & 7) whereas the Biomass Lookup Table only contains estimates for Yield Class in even numbers. If ESC suggests an ‘odd’ Yield Class, you should round down to the nearest even number (eg if ESC suggests YC5, use the model for YC4)
ESC Version 4 provides estimates for yield class under future climate change scenarios, for 2050 and for 2080. If ESC predicts that the yield class of a particular species is likely to be less favourable in a 2050 climate, then this should be taken into account. Use the following future climate scenario:
o Look at the ‘Med-High 2050/AWC’ option if your Soil Moisture Regime in ESC is ‘Fresh’ or wetter.
o Look at the ‘Med-High 2050’ option if your Soil Moisture Regime is drier than this.
Management types There are models available for managing a stand as minimum intervention and thinning to standard regimes. There is also a method do deal with stands that are managed with regular clearfell. A different thinning regime (either % thinned or timing of thinnings) If you are thinning the woodland but using a thinning regime other than the standard 5-yearly thinning, you should use the ‘thinned’ tables. Clearfelling If you plan to clearfell and restock the woodland at any point in its future, then you can only claim sequestration up to the long-term average carbon stock of the site, as after each clearfell, the carbon stock in live trees on the site effectively returns to zero. The long-term average tends to be between 30% and 50% of the cumulative total carbon sequestered over one rotation. There are also emissions associated with the clearfell operation and these are accounted for within the long-term average carbon stock. This long-term average is the maximum amount of sequestration you can claim, irrespective of the length of the project, if a project is regularly clearfelled. Claims can be made as the carbon is sequestered in the first rotation up to the time this ‘Clearfell Cap’ is reached, which tends to happen by year 25 or 35. The subsequent growth of the forest should continue to be monitored as per the Carbon Assessment Protocol for the remainder of the project duration. A separate worksheet ‘Clearfell_Max_Seq_Values’ – and gives the maximum amount of sequestration that can be claimed for a given rotation length for each model/scenario (known as the ‘Clearfell Cap’). Within this sheet, select your scenario (for example, SS, 2.0m, YC16, thin) as you did on the ‘Biomass Carbon Lookup Table’ sheet. Next, look along the row to the figure relating to the length of rotation you have planned. For example a 50-year rotation shows the ‘Clearfell Cap’ is 226 tCO2e/ha. At the right side of Assumptions Table 2, there is a space to enter the length of rotation, and also the ‘Clearfell Cap’ which is ascertained as suggested above.

Lookup Table Guidance Version 2.0 08 March 2018 8
Continuous Cover Forestry Other management regimes such as Continuous Cover Forestry regimes are not yet covered within the lookup tables. In the first instance you should use the standard thinning table if continuous cover is the longer-term objective. Assumptions Table 2: Example for a Mixed Native Woodland
Assumptions Table 2If Clearfelling only
Sectn No:Actual
Species
Actual
Spacing
(m)
Scenario/
Model from
Lookup
Table
Spacing used in
Lookup tables (m)
Yield Class Used in
Lookup Tables (Get
from ESC)
Management Regime
from Lookup Tables
% of Area
if mixture Area (ha)
Age at
clearfell
(years)
Clearfell
Cap
(tCO2e/ha)
1 Oak 2.2 OK 2.5 4 No thin no clearfell 20.00% 2.00
1 Sycamore 2.2 SAB 2.5 6 No thin no clearfell 20.00% 2.00
1 Birch 2.2 SAB 2.5 8 No thin no clearfell 20.00% 2.00
1 Aspen 2.2 SAB 2.5 8 No thin no clearfell 8.00% 0.80
1 Alder 2.2 SAB 2.5 4 No thin no clearfell 10.00% 1.00
1 Rowan 2.2 SAB 2.5 4 No thin no clearfell 10.00% 1.00
1 Hazel 2.2 SAB 2.5 4 No thin no clearfell 7.00% 0.70
1 Willow 2.2 SAB 2.5 4 No thin no clearfell 5.00% 0.50
Total Area 100.0% 10.00
2.2.3 Sequestration per hectare Table 3
Having made the assumptions above, you will have selected a number of ‘model’ scenarios’ which will represent your woodland creation project. For each ‘model scenario’ you will need to name a column in ‘Sequestration per hectare Table 3’, and then look-up in the Biomass Carbon Lookup Table, how carbon will be sequestered over time for that model scenario, and copy these figures to the Sequestration per hectare Table 3. For example, if one model scenario is that your woodland contains:
2.8ha of birch (modelled as SAB)
planted at 2.5m spacing;
predicted yield class 8
not thinned Simply select these options in the ‘Biomass Carbon Lookup Table’ by clicking on the ‘down arrow’ in the header of each of columns 1-4, and you will be presented with the information in Table 4. You then need to copy this into the relevant column in ‘Sequestration per hectare Table 3’ within the WCC Carbon Calculation Spreadsheet.

Lookup Table Guidance Version 2.0 08 March 2018 9
Example scenario from the Carbon Lookup Tables showing woodland carbon sequestration rate
SpeciesSpacing
(m)
Yield
ClassManagement
Period
(year)
Carbon
Standing
(tCO2e/
ha/yr)
Debris
(tCO2e/ha/yr
)
Total
(tCO2/ha/yr
)
Cumulative
in-period
(tCO2e/ha/
5yr period)
Cum.
Biomass
Sequestrn
(tCO2e/ha)
Cum. Emis.
Ongoing
Mgmt
(tCO2e/ha)
Cumulative
Total
Sequestrn
(tCO2e/ha)
Removed from
Forest
(tCO2e/ha/yr)
SAB 2.5 8 NO_thin 0-5 1.70 0.23 1.92 9.6 9.6 0.00 9.6 0.00
SAB 2.5 8 NO_thin 5-10 7.29 0.44 7.72 38.6 48.2 0.00 48.2 0.00
SAB 2.5 8 NO_thin 10-15 21.76 1.18 22.95 114.7 163.0 0.00 163.0 0.00
SAB 2.5 8 NO_thin 15-20 28.81 1.23 30.04 150.2 313.1 0.00 313.1 0.00
SAB 2.5 8 NO_thin 20-25 20.89 0.39 21.28 106.4 419.5 0.00 419.5 0.00
SAB 2.5 8 NO_thin 25-30 15.40 6.39 21.79 109.0 528.5 0.00 528.5 0.00
SAB 2.5 8 NO_thin 30-35 11.30 8.79 20.08 100.4 628.9 0.00 628.9 0.00
SAB 2.5 8 NO_thin 35-40 9.88 2.26 12.14 60.7 689.6 0.00 689.6 0.00
SAB 2.5 8 NO_thin 40-45 9.10 -0.03 9.07 45.4 734.9 0.00 734.9 0.00
SAB 2.5 8 NO_thin 45-50 8.26 -1.18 7.08 35.4 770.4 0.00 770.4 0.00
SAB 2.5 8 NO_thin 50-55 7.05 -1.58 5.47 27.4 797.7 0.00 797.7 0.00
SAB 2.5 8 NO_thin 55-60 6.01 -1.68 4.32 21.6 819.3 0.00 819.3 0.00
SAB 2.5 8 NO_thin 60-65 5.20 -0.97 4.23 21.1 840.5 0.00 840.5 0.00
SAB 2.5 8 NO_thin 65-70 4.54 -1.23 3.32 16.6 857.1 0.00 857.1 0.00
SAB 2.5 8 NO_thin 70-75 3.99 -1.18 2.81 14.1 871.1 0.00 871.1 0.00
SAB 2.5 8 NO_thin 75-80 3.65 -0.68 2.97 14.8 886.0 0.00 886.0 0.00
SAB 2.5 8 NO_thin 80-85 3.29 -0.48 2.81 14.0 900.0 0.00 900.0 0.00
SAB 2.5 8 NO_thin 85-90 2.92 -0.63 2.29 11.4 911.4 0.00 911.4 0.00
SAB 2.5 8 NO_thin 90-95 2.57 -0.55 2.02 10.1 921.6 0.00 921.6 0.00
SAB 2.5 8 NO_thin 95-100 2.35 -0.46 1.89 9.5 931.0 0.00 931.0 0.00 Sequestration per hectare Table 3
SOIL
Period
(year) Birch
(SAB YC8
2.5m, No
thin)
Soil C
accumuln
for mineral
soil
previously
arable use
0-5 9.6 2.8
5-10 48.2 5.5
10-15 163.0 8.3
15-20 313.1 11.0
20-25 419.5 13.8
25-30 528.5 16.5
30-35 628.9 19.3
35-40 689.6 22.0
40-45 734.9 24.8
45-50 770.4 27.5
50-55 797.7 29.3
55-60 819.3 31.2
60-65 840.5 33.0
65-70 857.1 34.8
70-75 871.1 36.7
75-80 886.0 38.5
80-85 900.0 40.3
85-90 911.4 42.2
90-95 921.6 44.0
95-100 931.0 45.8
From Carbon Lookup Tables: 'Cumulative total sequestration'
(column L): t CO2/ha
Copy and ‘paste special’ (values only) the figures from the selected model in the Biomass Carbon Lookup Table to the ‘Sequestration per hectare Table 3’ in the Carbon Calculator.

Lookup Table Guidance Version 2.0 08 March 2018 10
Projects involving clearfelling If your project involves clearfelling, you need to do one extra step. In 2.2.2, you looked up the ‘clearfell cap’ for your project. You need to apply this to the ‘sequestration per hectare’ table from the point at which the clearfell cap is reached. Continuing the example from 2.2.2, if you have SS, 2.0m, YC16, thin, clearfelled at year 50, then we ascertained the ‘Clearfell Cap’ was 226 tCO2e/ha. In this case this should be applied from the period 20-25 years. Sequestration per hectare Table 3
Period
(year)SS, YC16,
2.0m,
Thinned
0-5 5.9
5-10 22.0
10-15 68.2
15-20 190.4
20-25 247.4
25-30 297.3
30-35 369.7
35-40 433.5
40-45 483.3
45-50 519.4
50-55 555.0
55-60 582.7
60-65 611.2
65-70 631.2
70-75 650.3
75-80 669.1
80-85 683.7
85-90 693.6
90-95 702.6
95-100 711.4
From Carbon Lookup Tables: 'Cumulative total sequestration'
(column L): t CO2/ha
Sequestration per hectare Table 3
Period
(year)SS, YC16,
2.0m,
Thinned
0-5 5.9
5-10 22.0
10-15 68.2
15-20 190.4
20-25 226.0
25-30 226.0
30-35 226.0
35-40 226.0
40-45 226.0
45-50 226.0
50-55 226.0
55-60 226.0
60-65 226.0
65-70 226.0
70-75 226.0
75-80 226.0
80-85 226.0
85-90 226.0
90-95 226.0
95-100 226.0
From Carbon Lookup Tables: 'Cumulative total sequestration'
(column L): t CO2/ha
Apply the ‘Clearfell Cap’ (226 tCO2) from the time it is reached (in this case from the period 20-25 up to the 95-100 year period)

Lookup Table Guidance Version 2.0 08 March 2018 11
Projects involving natural regeneration If a woodland is to be established by natural regeneration rather than planting, trees are likely to take longer to establish. As such, projects should
Use a conservative scenario (eg assume SAB, YC4, 2.5m spacing, no thin)
‘Set back’ the growth of trees by 5 years (so anticipated sequestration for year 0-5 from a planted stand occurs in year 5-10 of a natural regeneration area
Sequestration per hectare Table 3
SOIL
Period
(year)
Nat
Regen
(SAB YC4
2.5m, No
thin)
Soil C
accumuln
for mineral
soil
previously
arable use
0-5 0.0 2.8
5-10 2.6 5.5
10-15 11.8 8.3
15-20 43.0 11.0
20-25 133.3 13.8
25-30 241.2 16.5
30-35 319.3 19.3
35-40 376.1 22.0
40-45 421.6 24.8
45-50 460.5 27.5
50-55 505.0 29.3
55-60 526.6 31.2
60-65 541.3 33.0
65-70 553.6 34.8
70-75 559.8 36.7
75-80 566.9 38.5
80-85 574.1 40.3
85-90 579.9 42.2
90-95 585.5 44.0
95-100 604.3 45.8
From Carbon Lookup Tables: 'Cumulative total sequestration'
(column L): t CO2/ha
Sequestration per hectare Table 3
SOIL
Period
(year)
Nat
Regen
(SAB YC4
2.5m, No
thin)
Soil C
accumuln
for mineral
soil
previously
arable use
0-5 2.6 2.8
5-10 11.8 5.5
10-15 43.0 8.3
15-20 133.3 11.0
20-25 241.2 13.8
25-30 319.3 16.5
30-35 376.1 19.3
35-40 421.6 22.0
40-45 460.5 24.8
45-50 505.0 27.5
50-55 526.6 29.3
55-60 541.3 31.2
60-65 553.6 33.0
65-70 559.8 34.8
70-75 566.9 36.7
75-80 574.1 38.5
80-85 579.9 40.3
85-90 585.5 42.2
90-95 604.3 44.0
95-100 606.1 45.8
From Carbon Lookup Tables: 'Cumulative total sequestration'
(column L): t CO2/ha
Lookup Table Guidance Version 2.0 08 March 2018 12
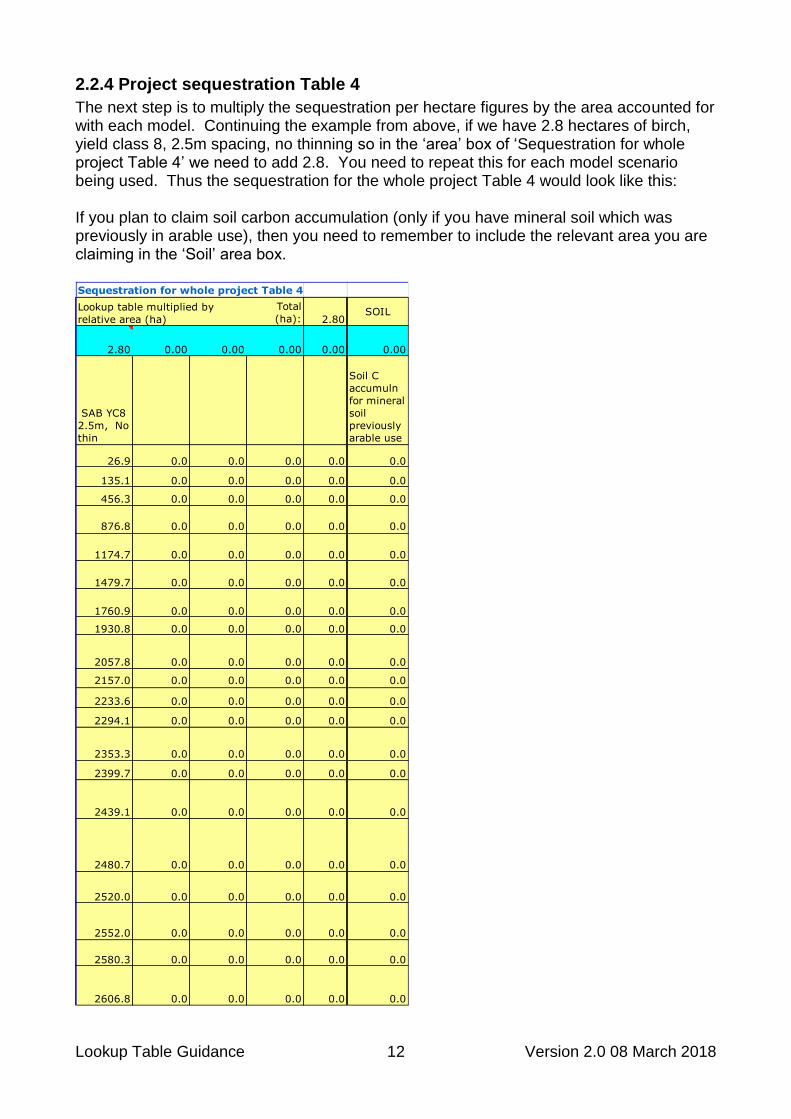
2.2.4 Project sequestration Table 4
The next step is to multiply the sequestration per hectare figures by the area accounted for with each model. Continuing the example from above, if we have 2.8 hectares of birch, yield class 8, 2.5m spacing, no thinning so in the ‘area’ box of ‘Sequestration for whole project Table 4’ we need to add 2.8. You need to repeat this for each model scenario being used. Thus the sequestration for the whole project Table 4 would look like this: If you plan to claim soil carbon accumulation (only if you have mineral soil which was previously in arable use), then you need to remember to include the relevant area you are claiming in the ‘Soil’ area box. Sequestration for whole project Table 4
Total
(ha): 2.80SOIL
2.80 0.00 0.00 0.00 0.00 0.00
SAB YC8
2.5m, No
thin
Soil C
accumuln
for mineral
soil
previously
arable use
26.9 0.0 0.0 0.0 0.0 0.0
135.1 0.0 0.0 0.0 0.0 0.0
456.3 0.0 0.0 0.0 0.0 0.0
876.8 0.0 0.0 0.0 0.0 0.0
1174.7 0.0 0.0 0.0 0.0 0.0
1479.7 0.0 0.0 0.0 0.0 0.0
1760.9 0.0 0.0 0.0 0.0 0.0
1930.8 0.0 0.0 0.0 0.0 0.0
2057.8 0.0 0.0 0.0 0.0 0.0
2157.0 0.0 0.0 0.0 0.0 0.0
2233.6 0.0 0.0 0.0 0.0 0.0
2294.1 0.0 0.0 0.0 0.0 0.0
2353.3 0.0 0.0 0.0 0.0 0.0
2399.7 0.0 0.0 0.0 0.0 0.0
2439.1 0.0 0.0 0.0 0.0 0.0
2480.7 0.0 0.0 0.0 0.0 0.0
2520.0 0.0 0.0 0.0 0.0 0.0
2552.0 0.0 0.0 0.0 0.0 0.0
2580.3 0.0 0.0 0.0 0.0 0.0
2606.8 0.0 0.0 0.0 0.0 0.0
Lookup table multiplied by
relative area (ha)
Lookup Table Guidance Version 2.0 08 March 2018 13
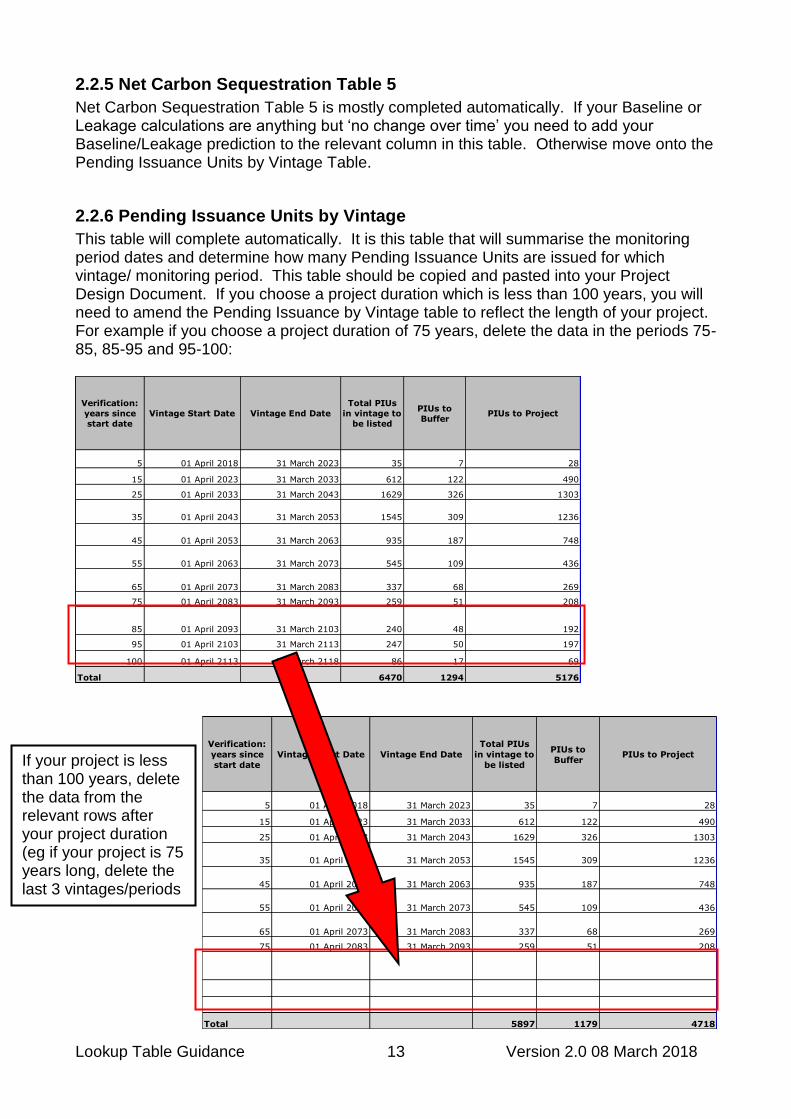
2.2.5 Net Carbon Sequestration Table 5
Net Carbon Sequestration Table 5 is mostly completed automatically. If your Baseline or Leakage calculations are anything but ‘no change over time’ you need to add your Baseline/Leakage prediction to the relevant column in this table. Otherwise move onto the Pending Issuance Units by Vintage Table.
2.2.6 Pending Issuance Units by Vintage
This table will complete automatically. It is this table that will summarise the monitoring period dates and determine how many Pending Issuance Units are issued for which vintage/ monitoring period. This table should be copied and pasted into your Project Design Document. If you choose a project duration which is less than 100 years, you will need to amend the Pending Issuance by Vintage table to reflect the length of your project. For example if you choose a project duration of 75 years, delete the data in the periods 75-85, 85-95 and 95-100:
Verification:
years since
start date
Vintage Start Date Vintage End Date
Total PIUs
in vintage to
be listed
PIUs to
BufferPIUs to Project
5 01 April 2018 31 March 2023 35 7 28
15 01 April 2023 31 March 2033 612 122 490
25 01 April 2033 31 March 2043 1629 326 1303
35 01 April 2043 31 March 2053 1545 309 1236
45 01 April 2053 31 March 2063 935 187 748
55 01 April 2063 31 March 2073 545 109 436
65 01 April 2073 31 March 2083 337 68 269
75 01 April 2083 31 March 2093 259 51 208
85 01 April 2093 31 March 2103 240 48 192
95 01 April 2103 31 March 2113 247 50 197
100 01 April 2113 31 March 2118 86 17 69
Total 6470 1294 5176
Verification:
years since
start date
Vintage Start Date Vintage End Date
Total PIUs
in vintage to
be listed
PIUs to
BufferPIUs to Project
5 01 April 2018 31 March 2023 35 7 28
15 01 April 2023 31 March 2033 612 122 490
25 01 April 2033 31 March 2043 1629 326 1303
35 01 April 2043 31 March 2053 1545 309 1236
45 01 April 2053 31 March 2063 935 187 748
55 01 April 2063 31 March 2073 545 109 436
65 01 April 2073 31 March 2083 337 68 269
75 01 April 2083 31 March 2093 259 51 208
Total 5897 1179 4718
If your project is less than 100 years, delete the data from the relevant rows after your project duration (eg if your project is 75 years long, delete the last 3 vintages/periods

Lookup Table Guidance Version 2.0 08 March 2018 14
2.3 Total for groups or compartments within a project
2.3.1 Multiple compartments within a project
If your project is complex with several compartments of different species or management, it might be easier to use a ‘Standard Project Carbon Calculator’ for each compartment. You will then need to add together the compartments to get a total figure for the project. Use the sheet ‘SummaryPIU_Table_comptmt_groups’ to add together the individual PIU tables from each compartment and re-name this sheet/tab so it’s clear what it refers to.
2.3.2 Multiple projects within a group
If you are submitting a group of projects for validation, you will need to copy the relevant Carbon Calculator to a new sheet so you have a separate sheet for each project. You will also need to come up with a ‘total’ sequestration for your whole group. Use the sheet ‘SummaryPIU_Table_comptmt_groups’ to add together the individual PIU tables from each project and re-name this sheet/tab so it’s clear what it refers to.
5. References Morison, J. Matthews, R.W. Miller, G. Perks, M. Randle, T. Vanguelova, E. White, M. and Yamulki, S. (2012) Understanding the Carbon and Greenhouse Gas Balance of UK Forests. Forestry Commission, Edinburgh. Randle, T.J. Jenkins T.A.R. and Matthews, R.W (2011). The production of lookup tables for estimating changes in carbon stock forestry projects: A document for users of the Forestry Commission's Woodland Carbon Code. Forestry Commission, UK. Whittaker, C. Killer, D. Zybert, D. and Russel, D. (2008). Life cycle assessment of construction of forest roads. (Spreadsheet tool). Imperial college, London.

Lookup Table Guidance Version 2.0 08 March 2018 15
Appendix 1: The Makeup of the Biomass Carbon Lookup Table
1.1 The ‘Biomass Carbon Lookup Table’
The ‘Biomass Carbon Lookup Table’ gives annualised sequestration rates at 5-yearly intervals for a range of woodland types in terms of species, initial spacing, yield class and management activity. A separate table deals with woodlands which are periodically clearfelled and another document deals with how the tables were constructed (Randle et al 2011). Morison et al (2012) provides a more technical description of the processes accounted for in modelling the carbon balance in forests. The Biomass Carbon Lookup Table contains the information described in Table 1, for 5-yearly intervals, 0-5, 5-10, 10-15 etc up to years 195-200: Table 1: Description of Fields in the Woodland Carbon Lookup Tables
Purpose Column Contents Units
Input values – Choose the situation most suited
A Species Standard abbreviation
B Initial Spacing m
C Yield Class Standard yield classes
D Management Standard thinning or no thinning
Rate of carbon sequestration in each period.
E Period years
F Standing carbon tCO2e/ha/year
G Debris tCO2e/ha/year
H Total Carbon tCO2e/ha/year
I In-period cumulative total C
tCO2e/ha/5-years
Cumulative CO2e sequestered over time in the biomass
J Cum. Biomass Sequestrn
tCO2e/ha
Cumulative Emissions from Ongoing woodland management
K Cum. Emis. Ongoing Mgmt.
tCO2e/ha
Total Cumulative CO2e sequestered over time
L Cumulative Total Sequestrn
tCO2e/ha
For information only: Carbon removed from forest during thinning
M Removed from forest tCO2e/ha/year
Positive values represent carbon sequestration; negative values represent carbon emissions. 1.1.1 Input values Species 17 major UK forest species are currently represented in the Biomass Carbon Lookup Tables (Table 2). There are 3 broadleaved scenarios (including Sycamore/Ash/Birch which is applicable to these species individually or as a mixture) and 14 conifer species.

Lookup Table Guidance Version 2.0 08 March 2018 16
Table 2: Species included within the woodland Carbon Lookup Tables
Broadleaved species Name Botanical Name
BE Beech Fagus sylvatica
OK Oak Quercus spp.
SAB sycamore, ash, birch (mix or pure species)
Acer pseudoplatanus/
Fraxinus excelsior/ Betula spp.
Conifer species Name Botanical Name
CP Corsican pine Pinus nigra var maritima
DF Douglas fir Pseudotsuga menziesii
EL European larch Larix decidua
GF grand fir Abies grandis
HL hybrid larch Larix x eurolepis
JL Japanese larch Larix kaempferi
LEC Leyland cypress Cupressocyparis leylandii
LP lodgepole pine Pinus contorta
NF noble fir Abies procera
NS Norway spruce Picea abies
RC western red cedar Thuja plicata
SP Scots pine Pinus sylvestris
SS Sitka spruce Picea sitchensis
WH western hemlock Tsuga heterophylla
Initial spacing (m) Tables currently contain initial spacings from 1.2m (ie 6,944 stems per ha) to 3.0m (i.e. 1,111 stems per ha). The spacings shown depend upon the species. Yield Class The predicted yield class of the woodland. Again the options available vary with species from 4 (for beech) to 30 (for grand fir). Management Currently there are two options available
Thin. In this option the crop is regularly thinned to the standard 5-yearly thinning regime
No Thin. In this option there is no management intervention the crop is simply left to grow.
1.1.2 Rate of carbon sequestration in each period Period The period is indicated as 5-year periods since establishment. The tables run from the first period 0-5 years, to 195-200 years. Carbon Standing The rate of carbon sequestration for the whole tree (including roots, stem, branch and foliage) in each 5-year period. Debris The rate of sequestration for the debris (a positive figure indicates that more has been added to the debris ‘pool’ than has decayed from it (eg as litter fall or dead wood left in the forest at thinning)) Total = Rate of carbon sequestration for the whole tree biomass plus debris. Soil carbon is dealt with separately. Cumulative In-period = five-year total of carbon standing plus debris. Again changes to soil carbon is dealt with separately.

Lookup Table Guidance Version 2.0 08 March 2018 17
1.1.3 Cumulative sequestration in biomass. Cumulative total carbon stored per hectare in the biomass as the forest grows from establishment to year 200. 1.1.4 Cumulative emissions from ongoing woodland management. Cumulative emissions (shown as negative) due to thinning operations. 1.1.5 Total cumulative sequestration. This column shows the net cumulative carbon sequestration taking into account the ongoing emissions from woodland management. These are the figures that need to be used in calculations of carbon sequestered in a potential new woodland creation project. 1.1.6 Removed from Forest. For completeness, this column shows the carbon that is removed from a woodland during thinnings. These figures should not be used in any calculations of carbon stored in woodland creation projects. They are shown to aid understanding of the difference between the thinned and unthinned scenarios.
1.2 ‘Clearfell_Max_Seq_Values’ for clearfell options
The figures given in the standard ‘Biomass Carbon Lookup Table’ assume that woodlands are managed without clearfelling. If a woodland is to be managed on a clearfell basis, then an adjustment needs to be made to these figures, to find the long-term average carbon on the site when periodically clearfelling trees. This is effectively a ‘cap’ to the amount of CO2e that could be claimed from the ‘Biomass Carbon Lookup Table’ (which assumes no clearfelling). These figures are found on the ‘Clearfell_Max_Seq_Values’ sheet (Table 3). Table 3: Description of Fields in the ‘Max Sequestration Values’ Table
Purpose Column Contents Units
Input values – Choose the situation most suited
A Species Standard abbreviation
B Initial Spacing M
C Yield Class Standard yield classes
D Management Standard thinning or no thinning
Long-term average carbon sequestration for various clearfell rotation lengths
E to T Cap for clearfell scenarios of various rotation lengths
tCO2e/ha
Species, Initial Spacing, Yield Class and Management as per the Carbon Lookup Table and described in 1.1 Cap for scenarios with varying rotation lengths The long-term average amount of carbon that will be sequestered for each scenario, for a given rotation length (20 to 200 years). This is the maximum amount of CO2e per hectare that can be claimed, in the first rotation only, where woodlands are managed on a clearfell regime. It also allows for the operational emissions from carrying out the clearfell within this ‘cap’.

Lookup Table Guidance Version 2.0 08 March 2018 18
Appendix 2: Default values to use for broadleaved species
Abbr. Name Botanical name Use table
for:
Alder Alnus spp. SAB
AH (SAB)
Ash Fraxinus excelsior SAB
Aspen Populus tremula SAB
BE Beech Fagus sylvatica BE
big leaf maple Acer macrophyllum SAB
BI (SAB) birch (downy/silver) Betula spp. SAB
bird cherry Prunus padus SAB
black poplar Populus nigra SAB
black walnut Juglans nigra OK
Blackthorn Prunus spinose SAB
Box Buxus spp. SAB
cider gum Eucalyptus gunnii SAB
common alder Alnus glutinosa SAB
common lime Tilia europea SAB
common walnut Juglans regia OK
crab apple Malus sylvestris SAB
crack willow Salix fragilis SAB
downy birch Betula pubescens SAB
downy oak Quercus pubescens OK
Elm Ulmus spp. BE
English elm Ulmus procera BE
field maple Acer campestre SAB
goat willow Salix caprea SAB
green alder Alnus viridis SAB
grey alder Alnus incana SAB
grey poplar Populus canescens SAB
grey willow Salix cinerea SAB
hawthorn species Crataegus spp SAB
Hazel Corylus avellana SAB
holly species Ilex spp. SAB
Holm oak Quercus ilex OK
Hornbeam Carpinus betulus BE
horse chestnut Aesculus hippocastanum SAB
Hungarian oak Quercus frainetto OK
hybrid poplars Populus serotina/trichocarpa etc.
SAB
Italian alder Alnus cordata SAB
large-leaved lime Tilia platyphyllos SAB
Lenga Nothofagus pumilio SAB
Lime Tilia spp. SAB
London plane Platanus x acerifolia SAB
mixed broadleaves SAB
Narrow-leafed ash Fraxinus angustifolia SAB

Lookup Table Guidance Version 2.0 08 March 2018 19
Abbr. Name Botanical name Use table for:
Norway maple Acer platanoides SAB
OK oak (robur/petraea) Quercus spp. OK
oriental beech Fagus orientalis BE
other birches Betula spp. SAB
other broadleaves SAB
other cherry spp Prunus spp. SAB
other Eucalyptus Eucalyptus spp. SAB
other Nothofagus Nothofagus spp. SAB
other oak spp Quercus spp. OK
other Poplar spp Populus spp. SAB
other walnut Juglans spp. OK
other willows Salix spp. SAB
paper-bark birch Betula papyrifera SAB
pedunculate/common
oak
Quercus robur OK
plane spp Platanus spp. SAB
Pyrenean oak Quercus pyrenaica OK
raoul/rauli Nothofagus nervosa SAB
red alder Alnus rubra SAB
red ash Fraxinus pennsylvanica SAB
red oak Quercus borealis BE
Roble Nothofagus obliqua SAB
Rowan Sorbus aucuparia SAB
sessile oak Quercus petraea OK
shagbark hickory Carya ovata BE
shining gum Eucalyptus nitens BE
silver birch Betula pendula SAB
silver maple Acer saccharinum SAB
small-leaved lime Tilia cordata SAB
smooth-leaved elm Ulmus carpinifolia BE
sweet chestnut Castanea sativa BE
SY
(SAB)
Sycamore Acer pseudoplatanus SAB
tulip tree Liriodendron tulipifera BE
Turkey oak Quercus cerris OK
white ash Fraxinus Americana SAB
white oak Quercus alba OK
white poplar Populus alba SAB
white willow Salix alba SAB
Whitebeam Sorbus aria SAB
wild cherry, gean Prunus avium SAB
wild service tree Sorbus torminalis SAB
wych elm Ulmus glabra BE

Lookup Table Guidance Version 2.0 08 March 2018 20
Appendix 3: Default values to use for conifer species
Abbr. Name Botanical name Use table
for:
Armand's pine Pinus armandii SP
Atlas cedar Cedrus atlantica NF
Austrian pine Pinus nigra var nigra CP
Bhutan pine Pinus wallichiana SP
Bishop pine Pinus muricata CP
Bornmuller's fir Abies bornmuelleriana NF
Calabrian pine Pinus brutia SP
cedar of Lebanon Cedrus libani NF
Coast redwood Sequoia sempervirens GF
CP Corsican pine Pinus nigra var maritima CP
DF Douglas fir Pseudotsuga menziesii DF
EL European larch Larix decidua EL
European silver fir Abies alba NF
GF Grand fir Abies grandis GF
Grecian fir Abies cephalonica NF
HL hybrid larch Larix x eurolepis HL
Japanese cedar Cryptomeria japonica RC
JL Japanese larch Larix kaempferi JL
Korean pine Pinus koreana SP
Lawson's cypress Chamaecyparis lawsoniana RC
LEC Leyland cypress Cupressocyparis leylandii LEC
loblolly pine Pinus taeda CP
LP lodgepole pine Pinus contorta LP
Macedonian pine Pinus peuce CP
Maritime pine Pinus pinaster LP
Mexican white pine Pinus ayacahuite SP
mixed conifers NS
Monterey pine Pinus radiata CP
mountain pine Pinus uncinata SP
NF noble fir Abies procera NF
Nordmann fir Abies nordmanniana NF
NS Norway spruce Picea abies NS
oriental spruce Picea orientalis NS
other Cedar Cedrus spp. NF
other conifers NS
other firs (Abies) Abies spp. NF
other larches Larix spp. EL
other pines Pinus spp. SP
other spruces Picea spp. NS
Ponderosa pine Pinus ponderosa SP
red fir (pacific silver) Abies amabilis GF
SP Scots pine Pinus sylvestris SP
Serbian spruce Picea omorika NS
SS Sitka spruce Picea sitchensis SS

Lookup Table Guidance Version 2.0 08 March 2018 21
Abbr. Name Botanical name Use table for:
slash pine Pinus ellottii LP
Wellingtonia Sequoiadendron giganteum GF
WH western hemlock Tsuga heterophylla WH
RC western red cedar Thuja plicata RC
western white pine Pinus monticola LP
Weymouth pine Pinus strobus SP
Yew Taxus baccata SP
Yunnan pine Pinus yunnanensis SP