Using the relative intensity variation of the Earth’s ... · Der folgende Artikel ist eine...
11
175 Quartär 56 (2009) : 175-185 Using the relative intensity variation of the Earth’s magnetic palaeofield as correlative dating technique: A case study from loess with Upper Palaeolithic cultural layers at Poiana Cireşului, Romania Die Anwendung der relativen Intensität des Paläoerdmagnetfeldes als korrelative Datierungsmethode: Eine Fallstudie an Löss mit jungpaläolithischen Kulturschichten aus Poiana Cireşului, Rumänien Christian Zeeden 1 *, Ulrich Hambach 1 , Leif Steguweit 2 , Alexander Fülling 1, 4 , Mircea Anghelinu 3 & Ludwig Zöller 1 1 Lehrstuhl für Geomorphologie, Universität Bayreuth, D-95440 Bayreuth 2 Institut für Ur- und Frühgeschichte, Universität Erlangen-Nürnberg, Kochstrasse 4/18, D-91054 Erlangen 3 Facultatea de Ştiinţe Umaniste, Universitatea ”Valahia” Târgovişte, Lt. Stancu Ion 34-36, RO-130105 Târgovişte 4 present address: Geographisches Institut, Humboldt-Universität zu Berlin, Unter den Linden 6, D-10099 Berlin Abstract - A high-resolution palaeomagnetic intensity study of 160 discrete samples from an archaeological excavation near Piatra Neamt (Romania) gives the opportunity to compare the palaeointensity signal from this sequence to reference data from sites with established age control. We correlate the relative palaeointensity record obtained from the Poiana Cireşului site to reference data, discuss our correlation and the possibility of indirect dating of (archaeology bearing) loess by the way of palaeomagnetic intensity signal comparison. The obtained age model supports dating by means of luminescence and radiocarbon techniques. Within the palaeomagnetic record we find the Mono Lake excursion and possibly also the Laschamp excursion, which represent the most important palaeomagnetic time markers of the Late Upper Pleistocene. Zusammenfassung - Eine hochauflösende paläomagnetische Intensitätsstudie an 160 Einzelproben einer archäologischen Grabung bei Piatra Neamt (Rumänien) gibt die Möglichkeit, das Paläointensitätssignal des Erdmagnetfeldes mit datierten Referenzdaten zu vergleichen. Wir korrelieren das Paläointensitätssignal aus der Grabung Poiana Cireşului mit datierten Referenzdaten und diskutieren unsere Zuordnung und die Möglichkeit der indirekten Datierung von (archäologische Funde enthaltenden) Lössen durch die Korrelation des relativen Paläointensitätssignals. Das gewonnene Zeitmodell stütz Datierungen mittels Lumineszenztechniken und der Radiokohlenstoffmethode. In der paläomagnetischen Zeitreihe sehen wir wahrscheinlich Signale der Mono Lake und Laschamp geomagnetischen Exkursionen, welche die wichtigsten paläo- magnetischen Zeitmarker des späten Oberpleistozän darstellen. Keywords - palaeomagnetism, relative palaeointensity, geomagnetic excursions, Upper Palaeolithic chronology, loess, Romania Paläomagnetik, relative Paläointensität, geomagnetische Exkursionen, Chronologie des Jungpaläolithikums Löss, Rumänien *corresponding author: [email protected] Introduction The appearance of Upper Palaeolithic cultures and their temporal evolution is precisely recorded in Upper Würmian loess deposits throughout eastern and central Europe. Loess is an ideal archive not only of Late Pleistocene palaeoclimatic variations but also for the remains of Palaeolithic cultures. Loess is an aeolian sediment occurring predominantly in the Quaternary, it is defined as aeolian transported silt which underwent a special diagenetic process called Editors‘ note: The following article is an extended version of a talk given at the meeting „UP Archaeology in Eastern Central Europe and its Loess deposits“ on Sept. 11 th 2007 at Krems, Austria. The meeting was organised by Leif Steguweit, Erlangen, and Ulrich Hambach, Bayreuth. Der folgende Artikel ist eine ausgearbeitete Version eines Vortrags, der bei der Tagung „UP Archaeology in Eastern Central Europe and its Loess deposits“ am 11. Sept. 2007 in Krems, Österreich, gehalten wurde. Die Tagung wurde organisiert von Leif Steguweit, Erlangen, und Ulrich Hambach, Bayreuth.
Transcript of Using the relative intensity variation of the Earth’s ... · Der folgende Artikel ist eine...
175
Quartär 56 (2009) : 175-185
Using the relative intensity variation of the Earth’s magnetic palaeofield as correlative dating technique: A case study from loess with Upper Palaeolithic cultural layers at Poiana Cireşului, RomaniaDie Anwendung der relativen Intensität des Paläoerdmagnetfeldes als korrelative Datierungsmethode: Eine Fallstudie an Löss mit jungpaläolithischen Kulturschichten aus Poiana Cireşului, Rumänien
Christian Zeeden1*, Ulrich Hambach1, Leif Steguweit2, Alexander Fülling1, 4 , Mircea Anghelinu3 & Ludwig Zöller1
1 Lehrstuhl für Geomorphologie, Universität Bayreuth, D-95440 Bayreuth2 Institut für Ur- und Frühgeschichte, Universität Erlangen-Nürnberg, Kochstrasse 4/18, D-91054 Erlangen3 Facultatea de Ştiinţe Umaniste, Universitatea ”Valahia” Târgovişte, Lt. Stancu Ion 34-36, RO-130105 Târgovişte4 present address: Geographisches Institut, Humboldt-Universität zu Berlin, Unter den Linden 6, D-10099 Berlin
Abstract - A high-resolution palaeomagnetic intensity study of 160 discrete samples from an archaeological excavation near Piatra Neamt (Romania) gives the opportunity to compare the palaeointensity signal from this sequence to reference data from sites with established age control. We correlate the relative palaeointensity record obtained from the Poiana Cireşului site to reference data, discuss our correlation and the possibility of indirect dating of (archaeology bearing) loess by the way of palaeomagnetic intensity signal comparison. The obtained age model supports dating by means of luminescence and radiocarbon techniques. Within the palaeomagnetic record we find the Mono Lake excursion and possibly also the Laschamp excursion, which represent the most important palaeomagnetic time markers of the Late Upper Pleistocene.
Zusammenfassung - Eine hochauflösende paläomagnetische Intensitätsstudie an 160 Einzelproben einer archäologischen Grabung bei Piatra Neamt (Rumänien) gibt die Möglichkeit, das Paläointensitätssignal des Erdmagnetfeldes mit datierten Referenzdaten zu vergleichen. Wir korrelieren das Paläointensitätssignal aus der Grabung Poiana Cireşului mit datierten Referenzdaten und diskutieren unsere Zuordnung und die Möglichkeit der indirekten Datierung von (archäologische Funde enthaltenden) Lössen durch die Korrelation des relativen Paläointensitätssignals. Das gewonnene Zeitmodell stütz Datierungen mittels Lumineszenztechniken und der Radiokohlenstoffmethode. In der paläomagnetischen Zeitreihe sehen wir wahrscheinlich Signale der Mono Lake und Laschamp geomagnetischen Exkursionen, welche die wichtigsten paläo- magnetischen Zeitmarker des späten Oberpleistozän darstellen.
Keywords - palaeomagnetism, relative palaeointensity, geomagnetic excursions, Upper Palaeolithic chronology, loess, Romania Paläomagnetik, relative Paläointensität, geomagnetische Exkursionen, Chronologie des Jungpaläolithikums Löss, Rumänien
*corresponding author: [email protected]
Introduction
The appearance of Upper Palaeolithic cultures and their temporal evolution is precisely recorded in
Upper Würmian loess deposits throughout eastern and central Europe. Loess is an ideal archive not only of Late Pleistocene palaeoclimatic variations but also for the remains of Palaeolithic cultures. Loess is an aeolian sediment occurring predominantly in the Quaternary, it is defined as aeolian transported silt which underwent a special diagenetic process called
Editors‘ note: The following article is an extended version of a talk given at the meeting „UP Archaeology in Eastern Central Europe and its Loess deposits“ on Sept. 11th 2007 at Krems, Austria. The meeting was organised by Leif Steguweit, Erlangen, and Ulrich Hambach, Bayreuth.Der folgende Artikel ist eine ausgearbeitete Version eines Vortrags, der bei der Tagung „UP Archaeology in Eastern Central Europe and its Loess deposits“ am 11. Sept. 2007 in Krems, Österreich, gehalten wurde. Die Tagung wurde organisiert von Leif Steguweit, Erlangen, und Ulrich Hambach, Bayreuth.
Quartär 56 (2009) C. Zeeden et al.
176
“loessification” after deposition. Silt size sediment is blown out of river floodplains (and dried endorheic basins), and accumulates in Western Eurasia predomi-nantly in the vicinities of fluvial systems, in particular the Danube and Rhine (Smalley et al. 2008). This may include the slopes of surrounding mountains as well as fluvial terraces. Dry and cold conditions are generally assumed to lead to relatively high accumulation rates of loess, whereas during warmer and more humid environmental conditions vegetation cover prevents clastic silt production as well as ablation; soils develop on the loesses. Though sedimentation rates may differ with climatic conditions, loess-palaeosol sequences may represent high resolution geoarchives of past climatic conditions (e.g. Heller & Evans 1996). Loess does not only record palaeoclimate, but “can record short-term features of the Earth’s magnetic field” (Zhu et al. 2006, in reference to Chinese loess). Further, loess may preserve archaeological remains in extra-ordinary quality because: 1) stratigraphical infor-mation of finds may be preserved as different cultural layers, 2) the imbedding in the loess prevents later disturbances of artefacts, and 3) the calcareous loess and its geochemical properties give the chance to find relatively unweathered artefacts in sediments (sensu Händel et al. in press).
The Earth’s magnetic field (EMF) has a dominant dipole component, which is assumed to be geocentric in a time average. Non-dipole components exist additional to the dipole. The geomagnetic field may therefore be described as the sum of a dipole component and non-dipole components. The Earth’s magnetic field undergoes changes in direction and amplitude in different time scales, and switches its polarity.
Secular variation describes the time variation of both the direction and intensity of the Earth’s magnetic field with time on time scales up to 1 000 years. It includes both dipole and non-dipole components, which may be local. Secular variation is globally not uniform, but shows similar patterns on a “sub-continental” scale (e.g. Butler 1992). Therefore secular variation patterns should only be compared in the same region.
In cases of so called geomagnetic excursions the Earth’s magnetic field changes its direction up to a reversed polarity for a short time period (≤ 3 000 years in full reversed state), but re-establishes in its previous position, because the magnetic field in the inner core is not completely reversed (Gubbins 1999). Geomagnetic excursions show low magnetic field intensities and high directional deviations from an axial dipole field (Laj & Channell 2007). The so called Mono Lake (ca. 32-34 ka) and Laschamp (ca. 41 ka) excursions represent the most important palaeo- magnetic time markers of the last glacial cycle and were recognised worldwide.
Sediments may preserve the magnetic field vector, consisting of direction and intensity of the magnetic
field during or shortly after deposition. The magneti-sation process for loess is not fully understood (e.g. Zhu et al. 2006), various theoretical models are discussed. Liu et al. (2003) (in reference to Chinese loess) believe that the loess characteristic remanent magnetisation is a (post)depositional remanent magnetisation. It is assumed to be acquired shortly after deposition, and is therefore able to record magnetic field variations even on time scales of ≤ 1 000 years.
Relative palaeointensity (RPI) records provide a measure of the variability of the strength of the Earth’s geomagnetic field at a given point on the Earth’s surface. It may be obtained from sediments, whereas absolute palaeointensities may only be obtained from strongly heated material as e.g. volcanic rocks, hearths and (ancient) pottery. The RPI is calculated by norma-lising a stable component of the natural remanent magnetisation by a concentration-related rock magnetic (RM) parameter (sensu Tauxe 1993, 1998), as the magnetic susceptibility, the anhysteretic remanent magnetisation (ARM) or the isothermal remanent magnetisation (IRM). The calculated RPI ideally represents the relationship of acquired magnetisation to the ability to acquire a magnetisation. The relative variations of this signal are thought to represent the intensity variations of the Earth’s magnetic field during or shortly after sediment deposition. Among other quality criteria, one of the most important ones is the affectedness by environmental and mineralogical changes. Tauxe (1993) suggested that records where the variation of RM parameters exceeds an order of magnitude should be avoided.
Palaeomagnetic dating also called magnetic stratigraphy includes all approaches dealing with the temporal variation of the direction as well as with the intensity of the EMF on time scales from 102 to 107 years. The magnetic stratigraphic investigation is a helpful tool in the age determination of sedimentary sequences. However for higher resolution records Stoner et al. (2002) state that “paleointensity can provide a global correlation tool at a resolution unattainable from isotope data alone”. Hambach et al. (2008a) discuss magnetic dating with emphasis to the Quaternary. Magnetic stratigraphy provided first age control on many loess sites. In this context the Mono Lake, Laschamp and other geomagnetic excursions may be employed as important time markers for these sediments. Nawrocki et al. (1999) demonstrated that palaeomagnetic directional pattern comparison may be used for the correlation of European loess sequences. Geomagnetic excursions as time markers in loess were already successfully employed by e.g. Reinders & Hambach (1995) and references therein.
At the archaeological site of Poiana Cireşului near Piatra Neamt in Northeastern Romania we have the opportunity to date Gravettian cultural remains (charcoal, bones) by the way of 14C and luminescence, and gain a palaeomagnetic RPI signal from the same

Quartär 56 (2009) Palaeomagnetic intensity dating of loess
177
sediment. This way we combine numerical dating techniques with the palaeomagnetic signal at this site, which is a rare opportunity for terrestrial sedimentary sequences of this resolution.
Geological setting
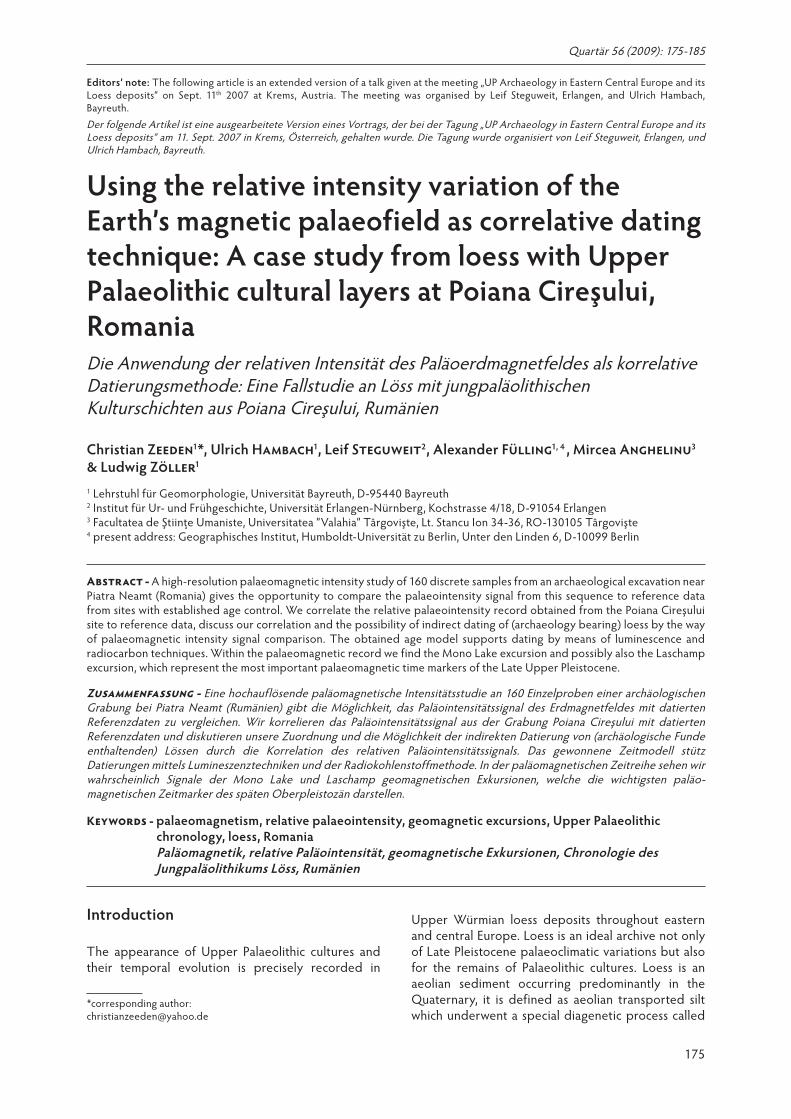
The archaeological site of Poiana Cireşului is located near Piatra Neamt in eastern Romania, in the eastern proximity of the Carpathians. The archaeological excavation is one of numerous archaeological sites in the Bistriţa valley, it is situated at the southern edge of the Bistriţa valley at ~46°55’ N and ~26°19’ E. Figure 1 gives the location of the archaeological site in a regional context. The site is situated southeast of the confluence of the Bistriţa and Doamna waters. The Poiana Cireşului archaeological site is situated at the edge of a terrace, and represents a rim structure between the terrace slope toward the Bistriţa valley and a land slide scar rectangular to the slope towards the rivulet Doamna. The site is situated on an erosional terrace of the Bistriţa, which was cut in Neogene flysch strata. The stratigraphic sequence at Poiana Cireşului is similar to the general stratigraphic succession of the middle terrace (pointed out by Nicolăescu-Plopşor et al. 1966). As the site is located on a rim structure, the depth of both palaeosols and
cultural layers differs spatially and with the topo- graphy. The loess imbedding cultural layers was most probably blown out of the flood plains of the Bistriţa valley, and covers its edges and the lower parts of the enclosing mountains. At the Poiana Cireşului site, the loess has a thickness of up to ca. 8 metres, and includes palaeosols and layers of redeposited loess (Carciumaru et al. 2006). The stratigraphy is not uniform in the proximity of the excavation; figure 2 depicts the stratigraphy of the western excavation wall of the 2006 excavation. Palaeomagnetic sampling was carried out a few meters to the north from the crest of the ridge where the youngest loess is best developed. Under the recent soil, a loess layer exists above a reddish cambisol which shows strong hydromorphic overprint caused by a gelistagnic water regime. The transition between decalcified (top) and calcified (bottom) loess is situated little below the soil; our sampling started in the calcified loess. An Epigravettian cultural layer (Epigravettian II) is present in the excava-tions at a stratigraphical position just below the decalcification level at the crest of the ridge. Below this stratigraphic level, loess of more yellowish to brownish colours occurs, and is intercalated by a Gravettian (Gravettian II) cultural layer around 390 cm depth, which corresponds to the peak in the magnetic susceptibility. Around 480 to 510 cm the loess is more
Fig. 1. Location of the Upper Palaeolithic archaeological site Poiana Cireşului in Romania and in the regional context of the Bistriţa valley. Also other important upper Palaeolithic archaeological sites in the Bistriţa valley are plotted.Abb. 1. Die Lage der jungpaläolithischen archäologischen Fundstätte Poiana Cireşului in Rumänien und in regionalem Umfeld des Bistriţa Tales. Auch andere wichtige jungpaläolithische archäologische Fundstellen sind dargestellt.
Quartär 56 (2009) C. Zeeden et al.
178
humiferous and some charcoal was found, which may indicate incipient soil formation and human occupation. The lower part (from ca. 6 m downward) of the site appears to be spatially relatively inhomo-geneous, in boreholes charcoal remains and more than one depth interval with redeposited loess was found (Carciumaru et al. 2006, Fig. 5). For the evaluation of the Upper Palaeolithic chronology in the Bistriţa valley we refer to Steguweit et al. (this volume).
For this study a depth interval of 334 cm of relatively unaltered loess was sampled. Figure 2 gives a schematic stratigraphy of the sampled wall. The sampling was done approximately 4 m north of the plotted profile where the sedimentation rates are lower than in the stratigraphic plot for the upper part
of the sampled section (as indicated in Fig. 2). We plot lithology and magnetic parameters vs. the depth below the surface level of the plotted sequence, which may not be comparable to other profiles from the site due to the spatial inhomogeneity of the site. However, cultural layers may be taken as time/depth markers.
Methods
Palaeomagnetic procedures were applied on oriented specimens to reliably determine estimates for the strength of the palaeomagnetic field. This relative palaeointensity data set is compared with reference data, and this way is used to constrain existing age determinations for the site.
Oriented specimens were taken from the archaeo-logical site using brass tubes and an orientation holder. Full spatial orientation is provided by magnetic compass measurements. Samples were taken with an edge length of 2 cm each, giving 8 cm3 samples. 160 samples were taken with a spacing of 2,1 cm between sample centres, giving a sampling extent of 336 cm. The oriented samples were stored in a µ-metal box until measurements began, and were stored in this box between measurements in order to shield samples against the EMF and laboratory fields.
Magnetic low-field susceptibility measurements were made employing an AGICO KLY-3S kappabridge. The frequency dependence of the magnetic susceptibility was determined from measurements at 300 Hz and 3 kHz using a MAGNON VFSM. Here the ((κ@0.3kHz-κ@3kHz)/(κ@0.3kHz)*100) is taken as measure for the frequency dependence of the magnetic susceptibility.
The 3-dimensional magnetisation was measured using an AGICO JR-6A spinner magnetometer. Alternating field demagnetisation was done in seven/eight steps up to 40/50 mT.
ARMs were produced along one spatial axis with a 100 mT alternating field (AF) and a 50 µT static field applied simultaneously using a Magnon AFD 300. Resulting magnetisations were measured, then samples were demagnetised in the same spatial direction with 20 mT alternating field intensity (and no static field). The resulting magnetisations were measured.
IRMs with pulse field intensities of 2 T and 350 mT (back-field) were produced along one spatial axis using a MAGNON PM II pulse magnetiser, the resulting magnetisations were measured.
To obtain mass normalisation we normalise data given by instruments by the density in kg/m3.
Optically stimulated luminescence (OSL) dating was carried out on silt-sized quartz grains to get burial ages of one sample from above the Epigravettian II cultural layer. The sample was treated with HCl and H2O2 to remove carbonate and organic matter. Quartz grains of a diameter of 38–63 µm were extracted by wet sieving, followed by a 14- to 20-day treatment
Fig. 2. Schematic stratigraphy of the sampled deposits at Poiana Cireşului. Left: stratigraphy of the sampled section. On the right, the magnetic susceptibility of the sampled interval is plotted as reference. Note the susceptibility peak at the Gravettian II cultural layer. *: Sedimentation rates are lower for the upper part of the palaeomagnetically sampled section, which is located further on the slope than the plotted reference section which represents the depocenter at the crest of the ridge. Abb. 2. Schematische Stratigraphie der Sedimente in Poiana Cireşului. Links: Stratigraphie der beprobten Sedimentabfolge. Rechts ist die magnetische Suszeptibilität des beprobten Intervalls dargestellt, die Gravettien II Kulturschicht zeigt ein deut-liches Suszeptibilitäts-Maximum. *: Sedimentationsraten sind im oberen Teil des für die Paläomagnetik beprobten Intervalls, das am Hang liegt, niedriger als im dargestellten Referenzprofil, welches das Depozentrum am Kamm des Rückens repräsentiert.
Quartär 56 (2009) Palaeomagnetic intensity dating of loess
179
with 35% hydroflourosilicic acid (H2SiF6). The grains were then deposited on aluminium discs and were measured on a Risø TL-DA-15 reader, equipped with a 90Sr/90Y beta source (dose rate of 0.14 Gy/s). Stimulation was performed using blue diode light of a wavelength of 470 ± 20 nm, while the resulting OSL signal was detected within the ultraviolet part of the spectrum between 260 and 390 nm (filter U340, thickness 7.5 mm). The single aliquot regenerative-dose protocol (SAR) according Murray & Wintle (2000) was applied using a modified cutheat tempe-rature (cutheat: 220 °C, preheat: 240 °C for 10 s).
Alpha counting was carried out to quantify the U and Th content of the sediment, whereas the K content was measured via inductively coupled plasma-mass spectrometry (ICP-MS). The contribution of alpha radiation to the environmental dose rate is dependent on the alpha particle track length in the mineral. Hence, an alpha efficiency factor (a-value) has to be defined, expressing the ratio of luminescence per unit alpha track length to the luminescence per unit absorbed beta dose (Aitken & Bowman 1975). Rees-Jones (1995) determined a mean a-value of 0.04 for fine grained quartz, other authors later on found slightly lower mean values of 0.03 on silt-sized quartz (Mauz et al. 2006) or 0.035 on quartz extracted from Chinese loess (Lai et al. 2008). In the present study, the alpha efficiency was not determined experimen-
tally but the a-value of 0.035 ± 0.03 suggested by Lai et al. (2008) was used.
Computing of correlations was done using the R software package (Ihaka & Gentleman 1996). 14C data were calibrated using CalPal-2007online (Danzeglocke et al. 2008) with the Weninger & Jöris (2008) calibration data. All ages are given in calendric ages, if not noted otherwise.
Results and discussion
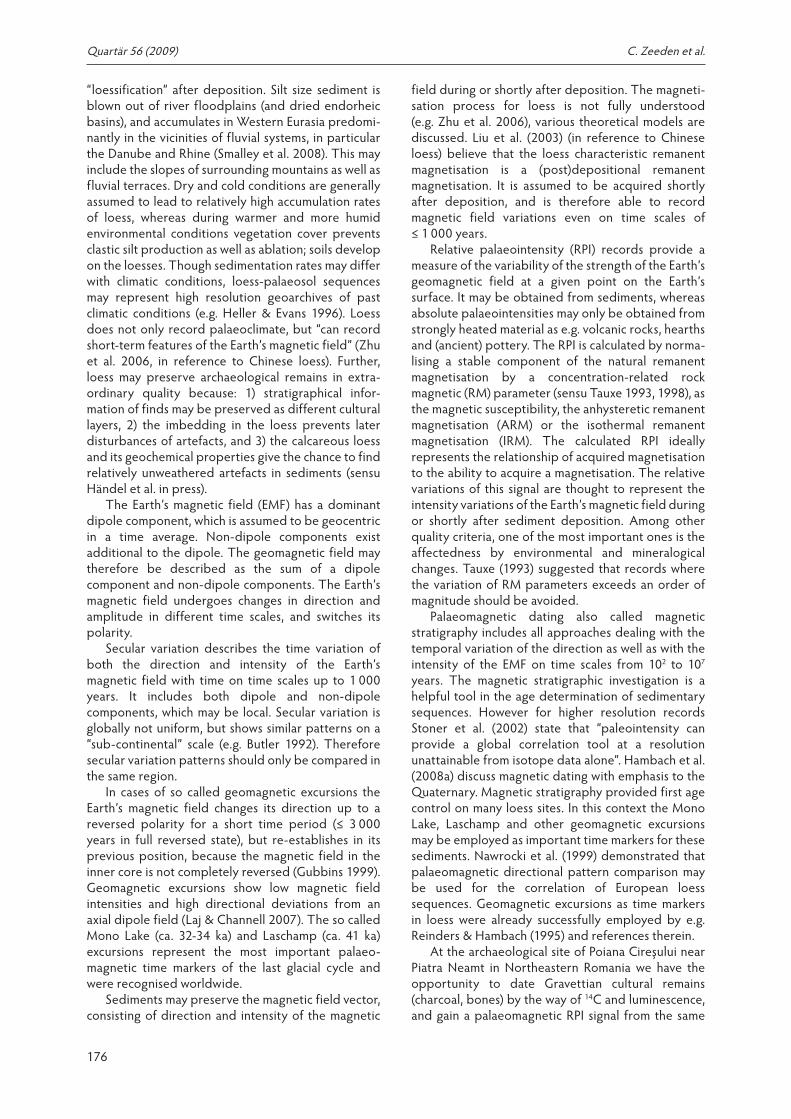
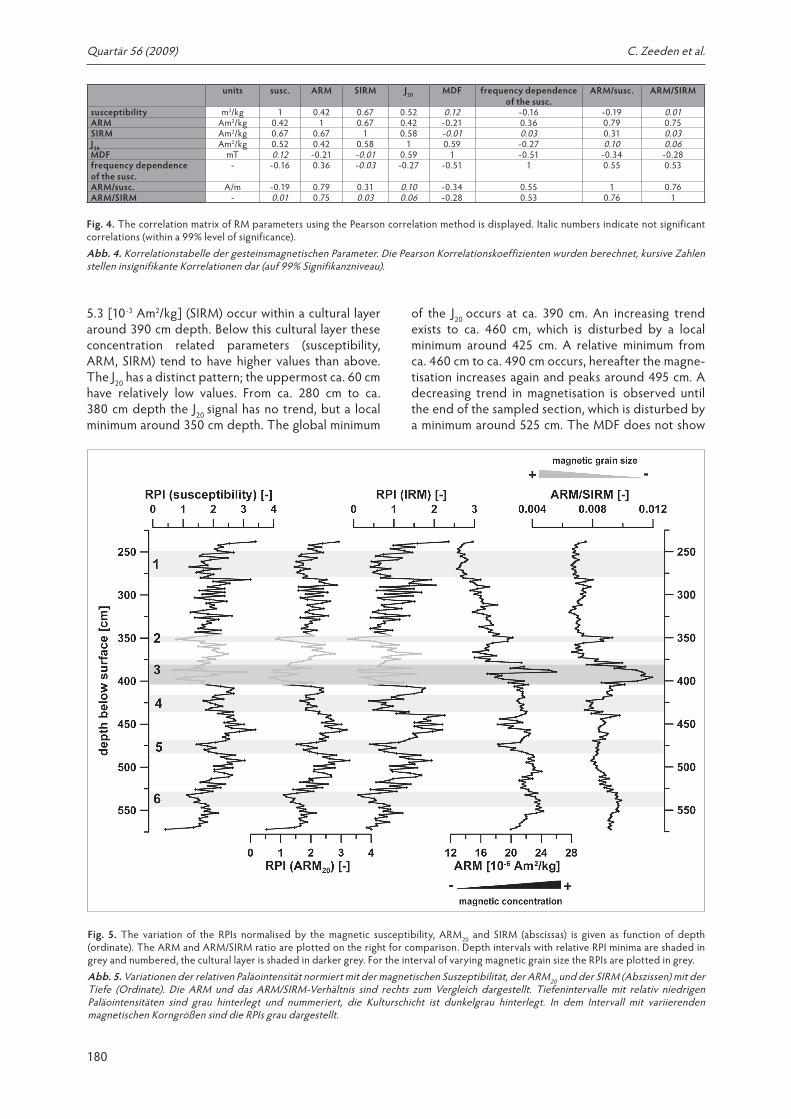
Rock magnetic propertiesThe variation of the rock magnetic parameters magnetic susceptibility, ARM, saturation IRM (SIRM, IRM @ 2 T), intensity of the 20 mT demagnetisation step ( J20), the mean destructive field (MDF), the frequency dependence of the magnetic susceptibility, the ARM/susceptibility ratio, and the ARM/SIRM ratio with depth are plotted in figure 3. The correlation matrix for the RM parameters employing the Pearson (Pearson 1896) correlation method tested for significance (after Best & Roberts 1975) is displayed in figure 4.
The concentration related parameters magnetic susceptibility, ARM and SIRM have a high analogy and correlate with a minimum correlation coefficient of 0.42 significantly, high values with 533 [10-9 m3/kg] (susceptibility), 26 [10-6 Am2/kg] (ARM) and
Fig. 3. Variation of rock magnetic parameters (abscissas) with stratigraphic depth (ordinate). From left to right: the magnetic susceptibility, the ARM, the SIRM, the J20, the MDF, the frequency dependence of the magnetic susceptibility, the ARM/susceptibility ratio and the ARM/SIRM ratio. The cultural layer is shaded grey. Interpretations of these parameters as representative for magnetic concentration (left, black triangles) and magnetic grain size (right, grey triangles) are plotted. Abb. 3. Die Variation gesteinsmagnetischer Parameter (Abszissen) mit stratigraphischer Tiefe (Ordinate). Von links nach rechts: magnetische Suszeptibilität, ARM, SIRM, J20, das MDF, die Frequenzabhängigkeit der magnetischen Suszeptibilität, das ARM/Suszeptibilitäts− und das ARM/SIRM- Verhältnis. Die Kulturschicht ist grau hinterlegt. Interpretationen der gesteinsmagnetischen Parameter als repräsentativ für die magnetische Konzentration (links, schwarze Dreiecke) und die magnetische Korngröße (rechts, graue Dreiecke) sind dargestellt.
Quartär 56 (2009) C. Zeeden et al.
180
5.3 [10-3 Am2/kg] (SIRM) occur within a cultural layer around 390 cm depth. Below this cultural layer these concentration related parameters (susceptibility, ARM, SIRM) tend to have higher values than above. The J20 has a distinct pattern; the uppermost ca. 60 cm have relatively low values. From ca. 280 cm to ca. 380 cm depth the J20 signal has no trend, but a local minimum around 350 cm depth. The global minimum
of the J20 occurs at ca. 390 cm. An increasing trend exists to ca. 460 cm, which is disturbed by a local minimum around 425 cm. A relative minimum from ca. 460 cm to ca. 490 cm occurs, hereafter the magne-tisation increases again and peaks around 495 cm. A decreasing trend in magnetisation is observed until the end of the sampled section, which is disturbed by a minimum around 525 cm. The MDF does not show
units susc. ARM SIRM J20 MDF frequency dependence of the susc.
ARM/susc. ARM/SIRM
susceptibility m3/kg 1 0.42 0.67 0.52 0.12 -0.16 -0.19 0.01ARM Am2/kg 0.42 1 0.67 0.42 -0.21 0.36 0.79 0.75SIRM Am2/kg 0.67 0.67 1 0.58 -0.01 0.03 0.31 0.03J20 Am2/kg 0.52 0.42 0.58 1 0.59 -0.27 0.10 0.06MDF mT 0.12 -0.21 -0.01 0.59 1 -0.51 -0.34 -0.28frequency dependence of the susc.
- -0.16 0.36 -0.03 -0.27 -0.51 1 0.55 0.53
ARM/susc. A/m -0.19 0.79 0.31 0.10 -0.34 0.55 1 0.76ARM/SIRM - 0.01 0.75 0.03 0.06 -0.28 0.53 0.76 1
Fig. 4. The correlation matrix of RM parameters using the Pearson correlation method is displayed. Italic numbers indicate not significant correlations (within a 99% level of significance).Abb. 4. Korrelationstabelle der gesteinsmagnetischen Parameter. Die Pearson Korrelationskoeffizienten wurden berechnet, kursive Zahlen stellen insignifikante Korrelationen dar (auf 99% Signifikanzniveau).
Fig. 5. The variation of the RPIs normalised by the magnetic susceptibility, ARM20 and SIRM (abscissas) is given as function of depth (ordinate). The ARM and ARM/SIRM ratio are plotted on the right for comparison. Depth intervals with relative RPI minima are shaded in grey and numbered, the cultural layer is shaded in darker grey. For the interval of varying magnetic grain size the RPIs are plotted in grey.Abb. 5. Variationen der relativen Paläointensität normiert mit der magnetischen Suszeptibilität, der ARM20 und der SIRM (Abszissen) mit der Tiefe (Ordinate). Die ARM und das ARM/SIRM-Verhältnis sind rechts zum Vergleich dargestellt. Tiefenintervalle mit relativ niedrigen Paläointensitäten sind grau hinterlegt und nummeriert, die Kulturschicht ist dunkelgrau hinterlegt. In dem Intervall mit variierenden magnetischen Korngrößen sind die RPIs grau dargestellt.
Quartär 56 (2009) Palaeomagnetic intensity dating of loess
181
much amplitude, most values are between 12 and 24 mT. All rock magnetic parameters show relatively little variation (a factor of ~3 at maximum) and the interval around the cultural layer appears to have the highest deviations from average values.
The magnetic susceptibility, ARM and SIRM are taken as indicative for the concentration of magnetic matter within the sediment, whereas the frequency dependence of the magnetic susceptibility, the ARM/susceptibility and the ARM/SIRM ratios may be taken as indicative for the magnetic grain size with higher values representing a higher amount of small superparamagnetic particles.
Rock magnetic parameters obviously vary within the Poiana Cireşului section. The concentration related parameters show a trend of increasing amounts of magnetic matter with depth, whereas the grain size related parameters show no trend but relatively high variations between 345 and 400 cm. The depth interval around the cultural layer between 350 and 410 cm is the only depth interval with distinctly abnormal values of the concentration- and grain size- related parameters.
The relative palaeointensittyThe RPI is determined using different normalisation methods. The J20 is chosen for normalisation because overprints were reliably removed by 20 mT AF demagnetisation, and this demagnetisation step still obtains a reasonable amount of magnetisation. For RPI determination, input parameters are detrended, then the RPI is normalised to a mean of 2 and a standard deviation of 0.5. The J20 is normalised by 1) the susceptibility 2) the ARM demagnetised at 20 mT (ARM20) and 3) the SIRM. Results are plotted in figure 5 together with the concentration related ARM as well as the grain size related ARM/SIRM ratio.
The RPI data sets obviously have similar trends. Relative minima (1-6 in fig. 5) occur around 270 cm, 350 cm, 375-405 cm, 425, 475 and 540 cm and are shaded grey. Relative maxima occur around 290 cm,
370 cm, 415 cm, 460 cm, 490 cm and 560 cm.For the calculations of correlations, data from the
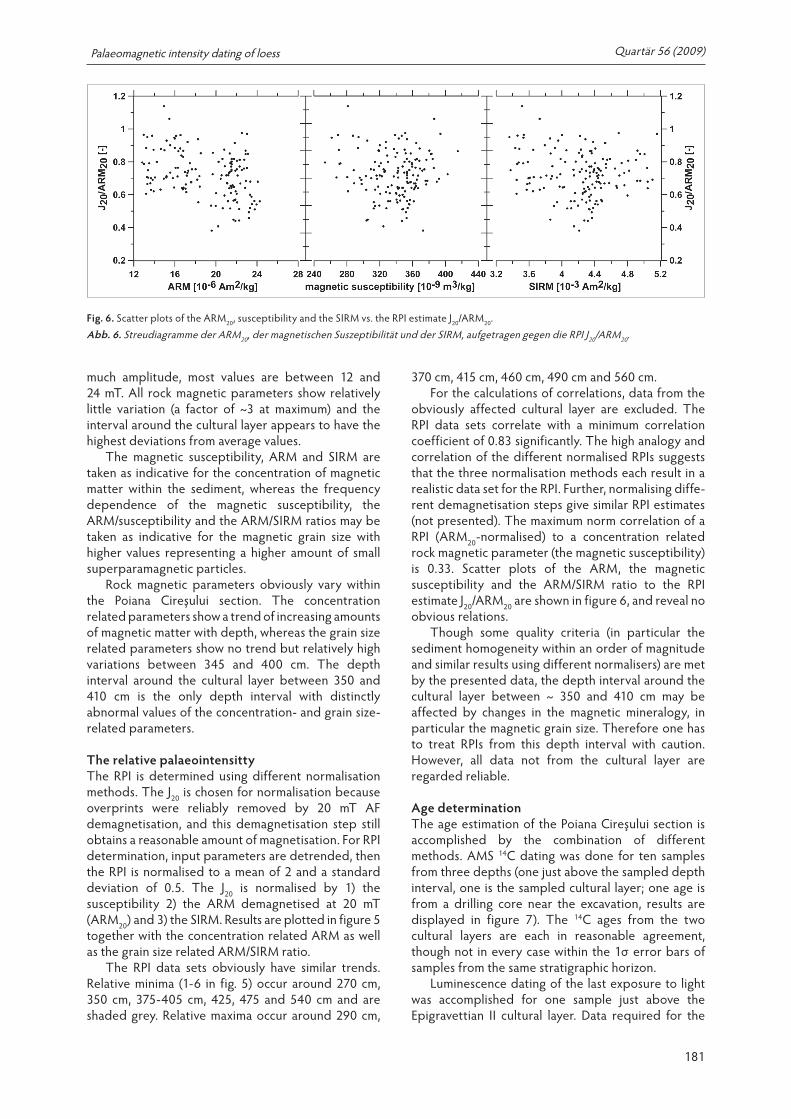
obviously affected cultural layer are excluded. The RPI data sets correlate with a minimum correlation coefficient of 0.83 significantly. The high analogy and correlation of the different normalised RPIs suggests that the three normalisation methods each result in a realistic data set for the RPI. Further, normalising diffe-rent demagnetisation steps give similar RPI estimates (not presented). The maximum norm correlation of a RPI (ARM20-normalised) to a concentration related rock magnetic parameter (the magnetic susceptibility) is 0.33. Scatter plots of the ARM, the magnetic susceptibility and the ARM/SIRM ratio to the RPI estimate J20/ARM20 are shown in figure 6, and reveal no obvious relations.
Though some quality criteria (in particular the sediment homogeneity within an order of magnitude and similar results using different normalisers) are met by the presented data, the depth interval around the cultural layer between ~ 350 and 410 cm may be affected by changes in the magnetic mineralogy, in particular the magnetic grain size. Therefore one has to treat RPIs from this depth interval with caution. However, all data not from the cultural layer are regarded reliable.
Age determinationThe age estimation of the Poiana Cireşului section is accomplished by the combination of different methods. AMS 14C dating was done for ten samples from three depths (one just above the sampled depth interval, one is the sampled cultural layer; one age is from a drilling core near the excavation, results are displayed in figure 7). The 14C ages from the two cultural layers are each in reasonable agreement, though not in every case within the 1σ error bars of samples from the same stratigraphic horizon.
Luminescence dating of the last exposure to light was accomplished for one sample just above the Epigravettian II cultural layer. Data required for the
Fig. 6. Scatter plots of the ARM20, susceptibility and the SIRM vs. the RPI estimate J20/ARM20.Abb. 6. Streudiagramme der ARM20, der magnetischen Suszeptibilität und der SIRM, aufgetragen gegen die RPI J20/ARM20.
Quartär 56 (2009) C. Zeeden et al.
182
age determination and the dating results are presented in figure 8. The datum above the palaeo-magnetically sampled interval of 22.66±1.81 ka supports the results of 14C dating.
RPI correlationThe palaeomagnetic palaeointensity correlation relies on a rough idea of the timing of the sediment deposi-tion and therefore palaeomagnetic signal acquisition. In the case of this study the RPI signal may be corre-lated unambiguously above the cultural layer due to independent numerical dating.
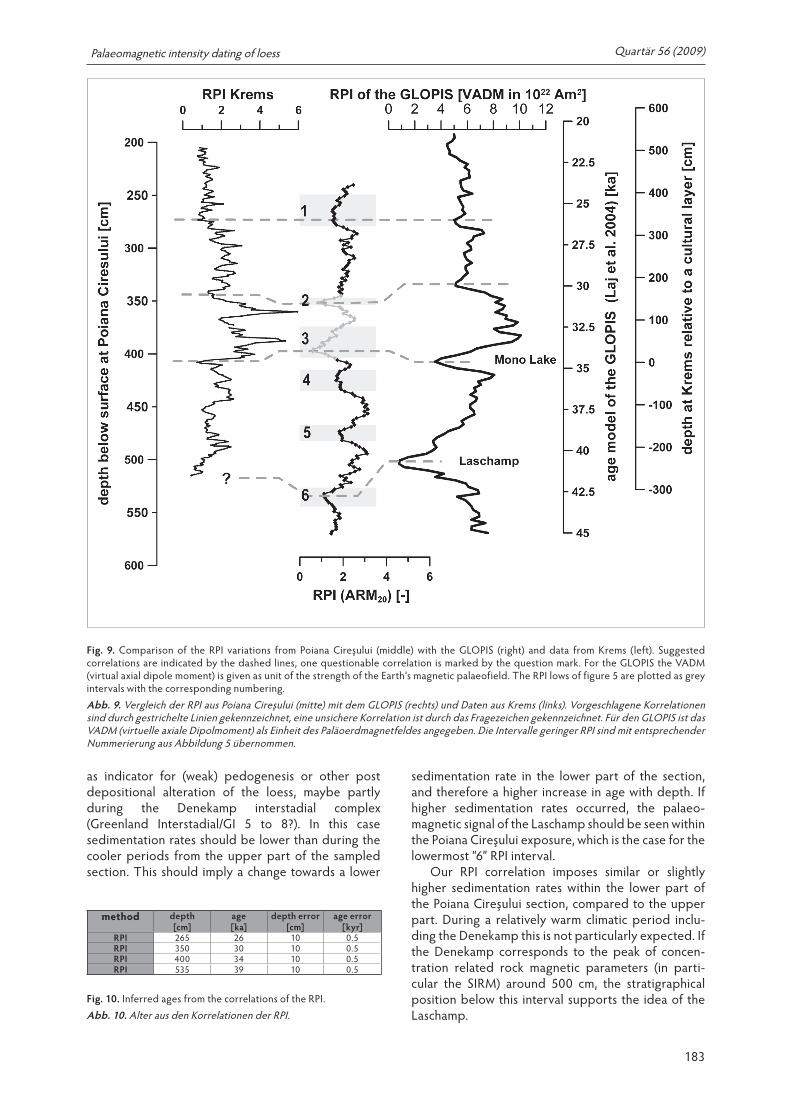
The RPI (ARM20 normalised) smoothed with a running average of three samples is compared to the GLOPIS (High resolution global paleointensity stack) compiled by Laj et al. (2004) and to RPI data from loess at Krems Wachtberg (Austria), presented by Hambach et al. (2008b).
The RPI minima numbered “2” and “3” within the grey shaded depth interval may be related to a similar counter-correlated pattern on the ARM/SIRM ratio, and therefore may be artefacts of changing magnetic properties, but may as well represent features of the palaeomagnetic field. We interpret the RPI pattern of this interval not to be the result of only changing rock magnetic properties, but at least partly to be the result of the palaeomagnetic field. The little variations in the rock magnetic properties (a factor of ~3 at maximum), the similarity of different normalisation methods, and no correlation of the RPI to concentra-tion related parameters speak for this interpretation. Further, no significant correlation between the J20 and the ARM/SIRM can be established for the whole data set (see Fig. 4), this way we can exclude the grain size variation as systematically biasing factor for the magnetisation for the whole data set. Though a bias in some intervals can not be excluded, we interpret the
RPI signal as mainly the result of magnetic field intensity variations.
Following this idea, relatively low RPIs numbered 1 - 6 in figure 5 are correlated to distinct RPI features of the GLOPIS, as plotted in figure 9, ages obtained from this correlation are displayed in figure 10. The uppermost “1“ RPI minimum is correlated to a minimum of the GLOPIS around 26 ka (on the GISP2 time scale of the GLOPIS). The “2“ RPI minimum at ~350 cm depth is assigned to a minimum of the GLOPIS around 30 ka. The global RPI minimum is correlated to the GLOPIS minimum corresponding to the Mono Lake geomagnetic excursion at ca. 34 ka. The RPI minima “4“ and “5“ cannot be matched to the GLOPIS. Other high resolution RPI data sets (see e.g. Krems Wachtberg) of this time interval show RPI minima between the Mono Lake and Laschamp excursions. The correlation of the RPI minimum “6” to the Laschamp is reasonable if a similar sedimentation rate is assumed all over the profile. In most data sets, the Laschamp shows lower RPIs than the Mono Lake, therefore the “4” and “5” RPI minima are not suggested to represent the Laschamp. If one interpreted the interval between the “2” and “3” RPI minima as affected by changes in mineralogy, and therefore unsuitable for RPI determination, one might interpret the RPI minimum “4” as the Mono Lake. This would not imply major changes of the resulting overall sedimen-tation rate and the age model. The oldest 14C age from the drill (see Fig. 7) implies that the loess was deposited in MIS 3, and is not much older in the lower part. This supports our idea of semi-continuous sedimentation.
The sediment composition above and below the Gravettian II cultural layer is somewhat different, with more humiferous and dense sediment in the lower part of the section (below 450 cm). This may be taken
Lab No. layer age [ka]
depth error [cm]
age error [kyr]
14C age [uncal. ka]
Erl-12162 Epigravettian II 23.24 15 0.31 19.459+/-96Erl-12163 Epigravettian II 24.096 15 0.294 20.154+/-97Erl-9964 Epigravettian II 23.978 15 0.361 20.053+/-188Erl-9965 Epigravettian II 24 15 0.358 20.076+/-185Beta 206707 Gravettian II 31 10 0.404 26.070+/-340Erl-9963 Gravettian II 31.057 10 0.418 26.185+/-379Erl-9962 Gravettian II 31.141 10 0.425 26.347+/-387Erl-11860 Gravettian II 31.379 10 0.361 26.677+/-244Erl-11859 Gravettian II 31.969 10 0.195 27.321+/-234Erl-11858 6.90 m of core 3 (Carciumaru et al. 2006) depth, may be beyond the dating limit 55.923+/-12.196
Fig. 7. AMS 14C dates of the Poiana Cireşului excavation.Abb. 7. AMS 14C Datierungen der Grabung Poiana Cireşului.
Sample ID Sample ID Depth K U Th Water ED Aliquot number
D Age[field] [lab] [m] [%] [ppm] [ppm] content [%] [Gy ± 1σ] [Gy/ka] [ka]
PC 2 BT 499 1.2 2.18 ± 0.11 3.16 ± 0.16 11.31 ± 0.57 20 ± 5 77.7 ± 1.9 15 3.43 ± 0.26 22.66 ± 1.81
Fig. 8. Environmental radioactivity and OSL dating results. ED = Equivalent dose, D = Dose rate. Water content is given in percent of dry mass. Dose rate calculation includes the radiation emitted by K, U, Th, and cosmic dose. The alpha efficiency was taken as a = 0.035 ± 0.003 (Lai et al. 2008).Abb. 8. Umweltradioaktivität und OSL-Datierungsergebnisse. ED = Equivalenzdosis, D = Dosisrate. Der Wassergehalt ist in Prozent der Trockenmasse angegeben. Die Dosisleistungsberechnung beinhaltet K, U, Th und kosmische Strahlung. Der a-Wert wurde mit a = 0.035 ± 0.003 angenommen (Lai et al. 2008).
Quartär 56 (2009) Palaeomagnetic intensity dating of loess
183
as indicator for (weak) pedogenesis or other post depositional alteration of the loess, maybe partly during the Denekamp interstadial complex (Greenland Interstadial/GI 5 to 8?). In this case sedimentation rates should be lower than during the cooler periods from the upper part of the sampled section. This should imply a change towards a lower
sedimentation rate in the lower part of the section, and therefore a higher increase in age with depth. If higher sedimentation rates occurred, the palaeo- magnetic signal of the Laschamp should be seen within the Poiana Cireşului exposure, which is the case for the lowermost “6” RPI interval.
Our RPI correlation imposes similar or slightly higher sedimentation rates within the lower part of the Poiana Cireşului section, compared to the upper part. During a relatively warm climatic period inclu-ding the Denekamp this is not particularly expected. If the Denekamp corresponds to the peak of concen-tration related rock magnetic parameters (in parti-cular the SIRM) around 500 cm, the stratigraphical position below this interval supports the idea of the Laschamp.
Fig. 9. Comparison of the RPI variations from Poiana Cireşului (middle) with the GLOPIS (right) and data from Krems (left). Suggested correlations are indicated by the dashed lines, one questionable correlation is marked by the question mark. For the GLOPIS the VADM (virtual axial dipole moment) is given as unit of the strength of the Earth‘s magnetic palaeofield. The RPI lows of figure 5 are plotted as grey intervals with the corresponding numbering.Abb. 9. Vergleich der RPI aus Poiana Cireşului (mitte) mit dem GLOPIS (rechts) und Daten aus Krems (links). Vorgeschlagene Korrelationen sind durch gestrichelte Linien gekennzeichnet, eine unsichere Korrelation ist durch das Fragezeichen gekennzeichnet. Für den GLOPIS ist das VADM (virtuelle axiale Dipolmoment) als Einheit des Paläoerdmagnetfeldes angegeben. Die Intervalle geringer RPI sind mit entsprechender Nummerierung aus Abbildung 5 übernommen.
method depth [cm]
age [ka]
depth error [cm]
age error [kyr]
RPI 265 26 10 0.5RPI 350 30 10 0.5RPI 400 34 10 0.5RPI 535 39 10 0.5
Fig. 10. Inferred ages from the correlations of the RPI. Abb. 10. Alter aus den Korrelationen der RPI.
Quartär 56 (2009) C. Zeeden et al.
184
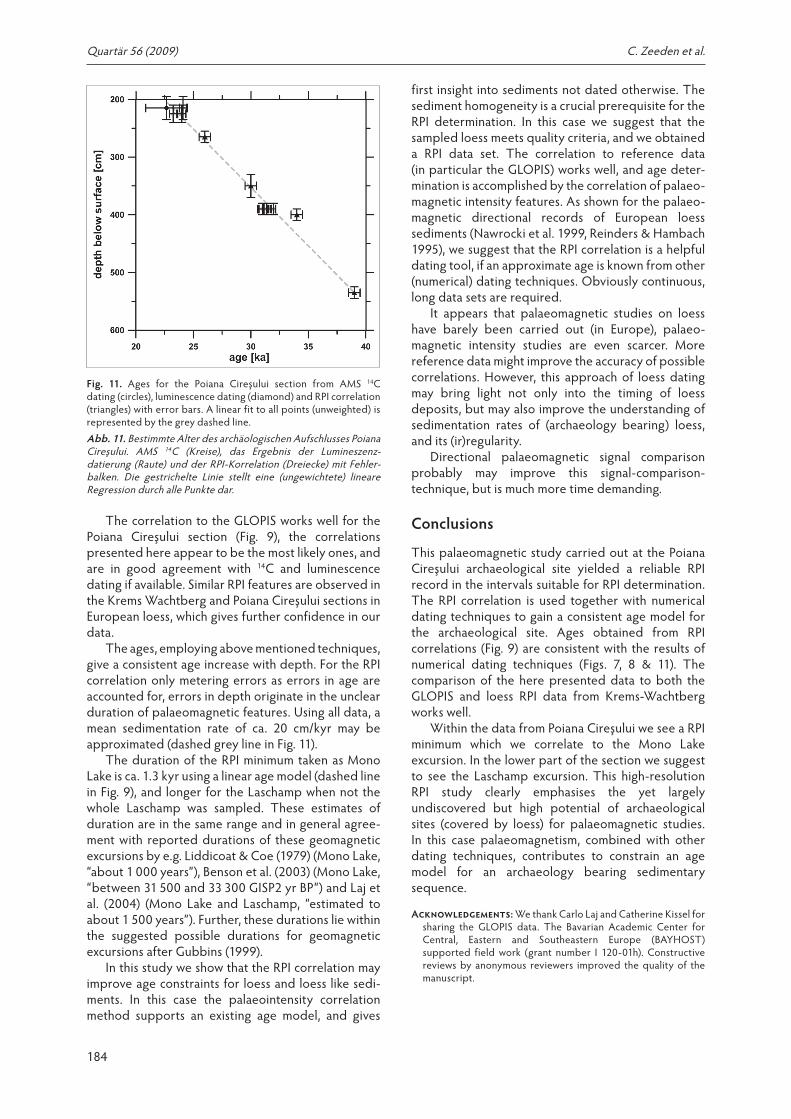
The correlation to the GLOPIS works well for the Poiana Cireşului section (Fig. 9), the correlations presented here appear to be the most likely ones, and are in good agreement with 14C and luminescence dating if available. Similar RPI features are observed in the Krems Wachtberg and Poiana Cireşului sections in European loess, which gives further confidence in our data.
The ages, employing above mentioned techniques, give a consistent age increase with depth. For the RPI correlation only metering errors as errors in age are accounted for, errors in depth originate in the unclear duration of palaeomagnetic features. Using all data, a mean sedimentation rate of ca. 20 cm/kyr may be approximated (dashed grey line in Fig. 11).
The duration of the RPI minimum taken as Mono Lake is ca. 1.3 kyr using a linear age model (dashed line in Fig. 9), and longer for the Laschamp when not the whole Laschamp was sampled. These estimates of duration are in the same range and in general agree-ment with reported durations of these geomagnetic excursions by e.g. Liddicoat & Coe (1979) (Mono Lake, “about 1 000 years”), Benson et al. (2003) (Mono Lake, “between 31 500 and 33 300 GISP2 yr BP”) and Laj et al. (2004) (Mono Lake and Laschamp, “estimated to about 1 500 years”). Further, these durations lie within the suggested possible durations for geomagnetic excursions after Gubbins (1999).
In this study we show that the RPI correlation may improve age constraints for loess and loess like sedi-ments. In this case the palaeointensity correlation method supports an existing age model, and gives
first insight into sediments not dated otherwise. The sediment homogeneity is a crucial prerequisite for the RPI determination. In this case we suggest that the sampled loess meets quality criteria, and we obtained a RPI data set. The correlation to reference data (in particular the GLOPIS) works well, and age deter-mination is accomplished by the correlation of palaeo-magnetic intensity features. As shown for the palaeo-magnetic directional records of European loess sediments (Nawrocki et al. 1999, Reinders & Hambach 1995), we suggest that the RPI correlation is a helpful dating tool, if an approximate age is known from other (numerical) dating techniques. Obviously continuous, long data sets are required.
It appears that palaeomagnetic studies on loess have barely been carried out (in Europe), palaeo- magnetic intensity studies are even scarcer. More reference data might improve the accuracy of possible correlations. However, this approach of loess dating may bring light not only into the timing of loess deposits, but may also improve the understanding of sedimentation rates of (archaeology bearing) loess, and its (ir)regularity.
Directional palaeomagnetic signal comparison probably may improve this signal-comparison- technique, but is much more time demanding.
Conclusions
This palaeomagnetic study carried out at the Poiana Cireşului archaeological site yielded a reliable RPI record in the intervals suitable for RPI determination. The RPI correlation is used together with numerical dating techniques to gain a consistent age model for the archaeological site. Ages obtained from RPI correlations (Fig. 9) are consistent with the results of numerical dating techniques (Figs. 7, 8 & 11). The comparison of the here presented data to both the GLOPIS and loess RPI data from Krems-Wachtberg works well.
Within the data from Poiana Cireşului we see a RPI minimum which we correlate to the Mono Lake excursion. In the lower part of the section we suggest to see the Laschamp excursion. This high-resolution RPI study clearly emphasises the yet largely undiscovered but high potential of archaeological sites (covered by loess) for palaeomagnetic studies. In this case palaeomagnetism, combined with other dating techniques, contributes to constrain an age model for an archaeology bearing sedimentary sequence.
Acknowledgements: We thank Carlo Laj and Catherine Kissel for sharing the GLOPIS data. The Bavarian Academic Center for Central, Eastern and Southeastern Europe (BAYHOST) supported field work (grant number I 120-01h). Constructive reviews by anonymous reviewers improved the quality of the manuscript.
Fig. 11. Ages for the Poiana Cireşului section from AMS 14C dating (circles), luminescence dating (diamond) and RPI correlation (triangles) with error bars. A linear fit to all points (unweighted) is represented by the grey dashed line.Abb. 11. Bestimmte Alter des archäologischen Aufschlusses Poiana Cireşului. AMS 14C (Kreise), das Ergebnis der Lumineszenz- datierung (Raute) und der RPI-Korrelation (Dreiecke) mit Fehler-balken. Die gestrichelte Linie stellt eine (ungewichtete) lineare Regression durch alle Punkte dar.

Quartär 56 (2009) Palaeomagnetic intensity dating of loess
185
Literature citedAitken, M. J. & Bowman, S. G. E. (1975). Thermoluminescent
dating: assessment of alpha particle contribution. Archaeometry 17: 132-138.
Benson, L., Liddicoat, J., Smoot, J., Sarna-Wojcicki, A., Negrini, R. & Lund, S. (2003). Age of the Mono Lake excursion and asso-ciated tephra. Quaternary Science Reviews 22 (2-4): 135-140.
Best, D. & Roberts, D. (1975). Algorithm AS 89: The Upper Tail Probabilities of Spearman’s Rho. Applied Statistics 24 (3): 377-379.
Butler, R. F. (1992). Magnetic domains to geologic terranes. Blackwell Scientific, Boston, 319 p.
Carciumaru, M., Anghelinu, M., Steguweit, L., Nita, L., Fontana, L., Brugere, A., Hambach, U., Margarit, M., Dumitrascu, V. & Cosac, M. (2006). The Upper Palaeolithic site of Poiana Ciresului (Piatra Neamt, North-Eastern Romania): recent results. Archäologisches Korrespondenzblatt 36 (3): 319-331.
Danzeglocke, U., Jöris, O. & Weninger, B. (2008). CalPal- 2007online. http://www.calpal-online.de/, accessed 2008-07-05.
Gubbins, D. (1999). The distinction between geomagnetic excursions and reversals. Geophysical Journal International 137 (1): F1-F3.
Hambach, U., Rolf, C. & Schnepp, E. (2008a). Magnetic dating of Quaternary sediments, volcanics and archaeological materials: an overview. Eiszeitalter und Gegenwart Quaternary Science Journal (57): 25-51.
Hambach, U., Zeeden, C., Hark, M. & Zöller, L. (2008b). Magnetic dating of an Upper Palaeoltihic cultural layer bearing loess from the Krems-Wachtberg site (Lower Austria). In: J. Reitner et al. (Eds.) Veränderter Lebensraum – Gestern, Heute und Morgen. DEUQUA Symposium 2008. Abhandlungen der geologischen Bundesanstalt (62): 153-157.
Händel, M., Simon, U., Einwögerer, T. & Neugebauer-Maresch, C. (2008). Loess deposits and the conservation of the archaeo-logical record—The Krems-Wachtberg example. Quaternary International. doi: 10.1016/j.quaint.2008.07.005.
Heller, F. & Evans, M. (1996). Magnetoklimatologie: Mineral-magnetismus und Eiszeiten. Naturwissenschaften 83 (3): 97-102.
Ihaka, R. & Gentleman, R. (1996). R: A language for data analysis and graphics. Journal of Computational and Graphical Statistics 5 (3): 299-314.
Lai, Z. P., Zöller, L., Fuchs, M. & Brückner, H. (2008). Alpha efficiency determination for OSL of quartz extracted from Chinese loess. Radiation Measurements 43: 767-770.
Laj, C. & Channell, J. E. T. (2007). Geomagnetic excursions. In: Schubert, G. (Ed.) Treatise on Geophysics, 5, 373-416.
Laj, C., Kissel, C. & Beer, J. (2004). High resolution global paleointensity stack since 75 kyr (GLOPIS-75) calibrated to absolute values. In: J. E. T. Channell, D. V. Kent, W. Lowrie & J. G. Meert (Eds.) Timescales of the Paleomagnetic Field. Geophysical monograph, Washington, 255-265.
Laj, C., Kissel, C., Mazaud, A., Channell, J. E. T. & Beer, J. (2000). North Atlantic palaeointensity stack since 75ka (NAPIS-75) and the duration of the Laschamp event. Philosophical Transactions: Mathematical, Physical and Engineering Sciences 358 (1768): 1009-1025.
Liddicoat, J. & Coe, R. (1979). Mono Lake geomagnetic excursion. Journal of Geophysical Research 84 (B1): 261-263.
Liu, Q., Jackson, M., Banerjee, S., Zhu, R., Pan, Y. & Chen, F. (2003). Determination of magnetic carriers of the characteristic remanent magnetization of Chinese loess by low-temperature demagnetization. Earth and Planetary Science Letters 216 (1-2): 175-186.
Mauz, B., Packman, S. & Lang, A. (2006). The alpha effective-ness in silt-sized quartz: new data obtained by single and multiple aliquot protocols. Ancient TL 24 (2): 47-52.
Murray, A. S. & Wintle, A. G. (2000). Luminescence dating of quartz using an improved single-aliquot regenerative-dose protocol. Radiation Measurements 32: 57-73.
Nawrocki, J., Bakhmutov, V., Bogucki, A. & Dolecki, L. (1999). The paleo-and petromagnetic record in the Polish and Ukrainian loess-paleosol sequences. Physics and Chemistry of the Earth, Part A: Solid Earth and Geodesy 24 (9): 773-777.
Nicolăescu-Plopşor, C. S., Pauneccu, A. & Mogosanu, F. (1966). Le paléolithique de Ceahlău. Dacia N.S. 10: 5-116.
Pearson, K. (1896). Mathematical contributions to the theory of evolution. III. Regression, heredity and panmixia. Philosophical Transactions of the Royal Society of London. Series A 187: 59-65.
Rees-Jones, J. (1995). Optical dating of young sediments using fine-grain quartz. Ancient TL 13: 9-14.
Reinders, J. & Hambach, U. (1995). A geomagnetic event recorded in loess deposits of the Tönchesberg (Germany): identification of the Blake magnetic polarity episode. Geophysical Journal International 122: 407-418.
Smalley, I., O’Hara-Dhand, K., Wint, J., Machalett, B., Jary, Z. & Jefferson, I. (2008). Rivers and loess: The significance of long river transportation in the complex event-sequence approach to loess deposit formation. Quaternary International. doi: 10.1016/j.quaint.2008.06.009
Stoner, J., Laj, C., Channell, J. & Kissel, C. (2002). South Atlantic and North Atlantic geomagnetic paleointensity stacks (0–80 ka): implications for inter-hemispheric correlation. Quaternary Science Reviews 21 (10): 1141-1151.
Steguweit, L., Cârciumaru, M., Anghelinu, M. & Niţă, L. (this volume). Reframing the Upper Palaeolithic on the Bistriţa Valley (Northeastern Romania).
Tauxe, L. (1993). Sedimentary records of relative paleointensity of the geomagnetic field: theory and practice. Reviews of Geophysics 31 (3): 319-354.
Tauxe, L. (1998). Paleomagnetic principles and practice. Kluwer Academic Publishers, Dordrecht, 299 p.
Wagner, G., Beer, J., Laj, C., Kissel, C., Masarik, J., Muscheler, R. & Synal, H.-A. (2000). Chlorine-36 evidence for the Mono Lake event in the Summit GRIP ice core. Earth and Planetary Science Letters 181: 1-6.
Weninger, B. & Jöris, O. (2008). A 14C age calibration curve for the last 60 ka: the Greenland-Hulu U/Th timescale and its impact on understanding the Middle to Upper Paleolithic transition in Western Eurasia. Journal of Human Evolution 55,:772–781.
Zhu, R., Liu, Q., Pan, Y., Deng, C. & Sun, J. (2006). Identifying the origin of the magnetic directional anomalies recorded in the Datong loess profile, northeastern Chinese loess plateau. Geophysical Journal International 164 (2): 312-318.