Using the CPPS to Evaluate Children with Learning Problems Dr. Milton J. Dehn Schoolhouse...
60
Using the CPPS to Evaluate Children with Learning Problems Dr. Milton J. Dehn Schoolhouse Educational Services www.psychprocesses.com
-
Upload
quentin-heath -
Category
Documents
-
view
216 -
download
0
Transcript of Using the CPPS to Evaluate Children with Learning Problems Dr. Milton J. Dehn Schoolhouse...

Using the CPPS to Evaluate Childrenwith Learning Problems
Dr. Milton J. DehnSchoolhouse Educational Services
www.psychprocesses.com
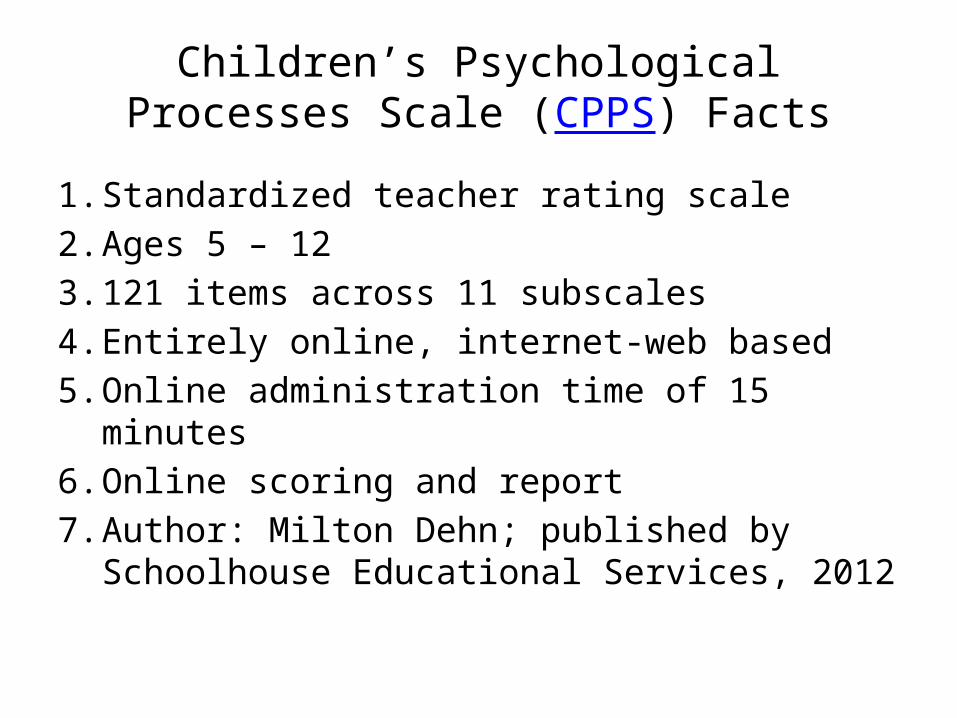
Children’s Psychological Processes Scale (CPPS) Facts
1. Standardized teacher rating scale2. Ages 5 – 123. 121 items across 11 subscales4. Entirely online, internet-web based5. Online administration time of 15 minutes6. Online scoring and report7. Author: Milton Dehn; published by
Schoolhouse Educational Services, 2012

Uses of the CPPS
1. Screening1. Identifies need for intervention2. Predicts academic skills development3. Useful in planning comprehensive assessment
2. LD Evaluations1. Identify psych processing deficits2. Pattern of strengths and weaknesses
3. Measure progress during interventions1. Through the use of change-sensitive W-scores

What is psychological processing?
1. Brain processes, operations, functions2. Any time mental contents are operated on3. When information is perceived, transformed,
manipulated, stored, retrieved, expressed4. Whenever we think, reason, problem-solve5. Can’t learn and perform without processing6. Learning depends on these processes7. Doesn’t include knowledge or academic skills

MN Processing Criteria
“The child has a disorder in one or more of the basic psychological processes which includes an information processing condition that is manifested in a variety of settings by behaviors such as inadequate …. (next slide)

MN Processing Criteria
….acquisition of information; organization; planning and sequencing; working memory, including verbal, visual, or spatial; visual and auditory processing; speed of processing; verbal and nonverbal expression; transfer of information; and motor control for written tasks.” (Can include other processes not listed.)

What is a Processing Disorder?
1. Disorder: A group of symptoms involving abnormal behaviors
2. A disorder involves deficits3. Deficit: A lack or shortage of something4. Weakness: Lacking normal ability5. A processing disorder impairs academic learning6. Not many official processing disorders
1. E.g. CAPD, aphasia, amnesia, dyspraxia

Evidence for a Processing Disorderand SLD Diagnosis
1. It’s not specific to one environment2. A normative weakness (below average score)3. Intra-individual: score is significantly weaker than
predicted from discrepancy analysis4. Best if it’s an intra-individual weakness and a
normative weakness (this is a deficit; these are rare)5. It’s impacting academic learning6. The low psychological processes and low academics
have research-based links7. The linked process and academic skills both have low
scores (consistency approach)

Processes and Academic Learning
1. Psychological processes are like “aptitudes”2. Relations established through research
1. Flanagan et al.2. McGrew’s review of research
3. The influence of processes varies by age4. Look for academic area and related
psychological processes to both be low5. See Table

Psychological Processes Measured by the CPPS
1. Attention2. Auditory Processing3. Executive Functions4. Fine Motor5. Fluid Reasoning6. Long-Term Recall7. Oral Language8. Phonological Processing9. Processing Speed10. Visual-Spatial Processing11. Working Memory 12. General Processing Ability (Composite)
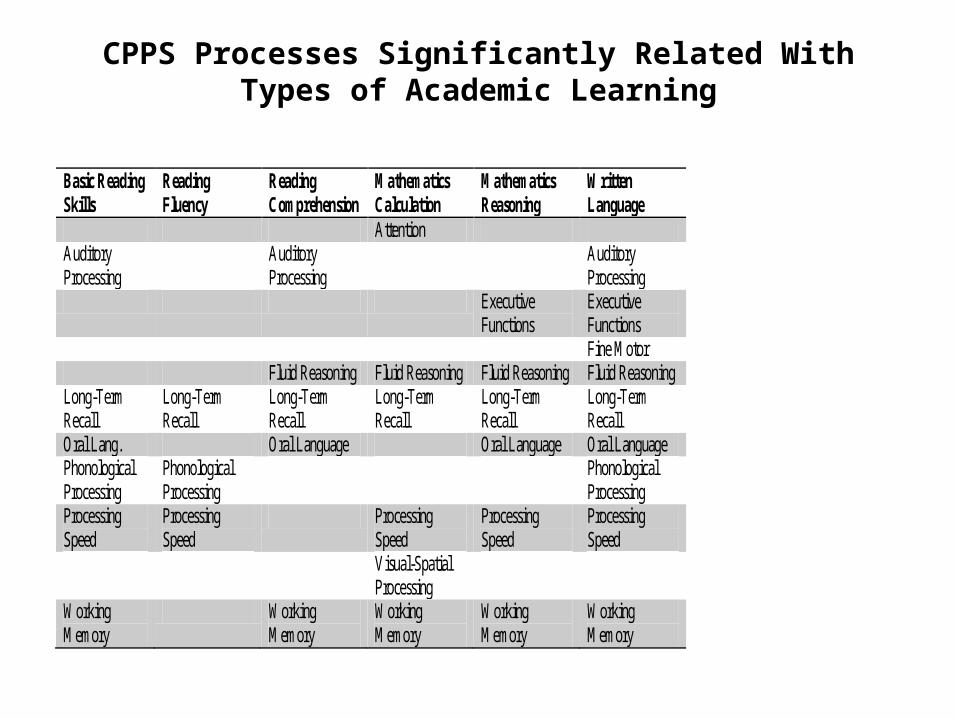
CPPS Processes Significantly Related With Types of Academic Learning
Basic Reading Skills
Reading Fluency
Reading Comprehension
Mathematics Calculation
Mathematics Reasoning
Written Language
Attention Auditory Processing
Auditory Processing
Auditory Processing
Executive Functions
Executive Functions
Fine Motor Fluid Reasoning Fluid Reasoning Fluid Reasoning Fluid Reasoning Long-Term Recall
Long-Term Recall
Long-Term Recall
Long-Term Recall
Long-Term Recall
Long-Term Recall
Oral Lang. Oral Language Oral Language Oral Language Phonological Processing
Phonological Processing
Phonological Processing
Processing Speed
Processing Speed
Processing Speed
Processing Speed
Processing Speed
Visual-Spatial Processing
Working Memory
Working Memory
Working Memory
Working Memory
Working Memory
Characteristics of CPPS Processes
1. Brain-based2. Interrelated3. Necessary for academic learning4. They underlie academic performance5. They are broad processes6. Observable in classroom

Attention
1. In classroom: Necessary for learning2. Attention deficits part of LD; not necessarily ADHD3. Types: Selective, focused, divided, sustained4. The problem is attentional control & lack of
inhibition5. On CPPS, links to Executive Functions and Working
Memory6. Lowest Item: “Is noisy and disruptive in class”7. Highest Item: “Has difficulty dividing attention
between two tasks”

Auditory Processing
1. Ability to perceive, analyze, synthesize, and discriminate auditory stimuli, mainly speech
2. In classroom: Perceiving and comprehending instruction; being able to understand words with background noise
3. Lowest item: “Has difficulty associating a voice with the correct person”
4. Highest item: “Has difficulty understanding instruction when there is background noise”

Executive Functions1. Management of cognitive functions and
psychological processes2. Effectiveness depends on self-monitoring, self-
regulation, and metacognition3. Has a longer course of development4. More to do with classroom performance than
learning of academic skills5. Lowest item “Has difficulty adapting to changes,
such as a change in routine”6. Highest item: “Does not notice errors in
schoolwork”

Fine Motor
1. Hits developmental plateau by age 72. On CPPS, has weaker relations with cognitive
processes in general but has strong relations with academics
3. On CPPS, pairs up with visual-spatial process.4. Lowest item: “Has difficulty picking up small
objects with thumb and forefinger”5. Highest item: “Has difficulty staying between
the lines when printing or writing”
Fluid Reasoning
1. Deductive, inductive reasoning, especially with novel materials
2. Has a longer course of development3. More important for applied academics4. Lowest item: “When given clues, does poorly
at guessing the answer”5. Highest item: “Has difficulty solving
unfamiliar problems”

Long-Term Recall
1. Close connection with other processes and with academic learning in general
2. Includes encoding, consolidation, storage, and retrieval
3. RAN is part of 4. Lowest item: “Has difficulty remembering
nursery rhymes or stories”5. Highest item: “Has difficulty recalling
information during tests”
Oral Language
1. Not the content (vocabulary) or receptive language but the oral expression processes
2. Lowest item “Substitutes or omits vowel and consonant sounds when speaking”
3. Highest item: “Has difficulty paraphrasing when speaking”
Phonological Processing
1. Processing of phonemes, e.g. blending2. Phonemic awareness is part of 3. Lowest item: “Has difficulty identifying the
first sound in a word”4. Highest item: “Has difficulty sounding out
unknown words when reading”
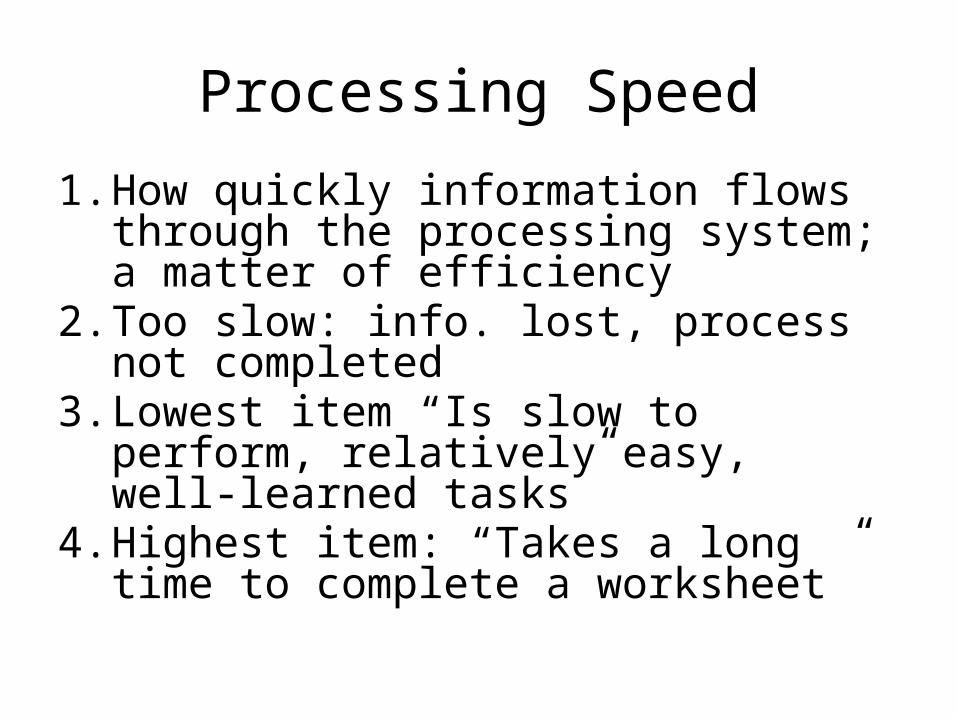
Processing Speed
1. How quickly information flows through the processing system; a matter of efficiency
2. Too slow: info. lost, process not completed3. Lowest item “Is slow to perform, relatively
easy, well-learned tasks”4. Highest item: “Takes a long time to complete
a worksheet”
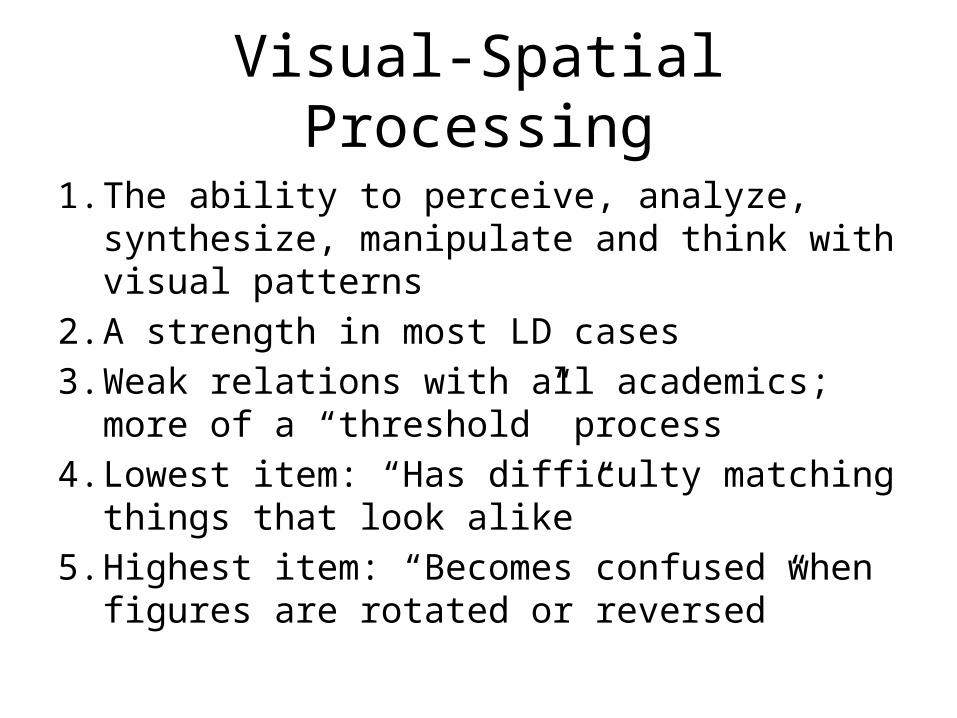
Visual-Spatial Processing
1. The ability to perceive, analyze, synthesize, manipulate and think with visual patterns
2. A strength in most LD cases3. Weak relations with all academics; more of a
“threshold” process4. Lowest item: “Has difficulty matching things
that look alike”5. Highest item: “Becomes confused when figures
are rotated or reversed”

Working Memory
1. Processing while retaining information2. On CPPS includes short-term memory3. Both verbal and visual4. Lowest item: “Loses place when counting”5. Highest item: “Has difficulty organizing
information when writing”

General Processing Ability (GPA)
1. Based on average of all process scores2. Emerges from factor analysis; similar to
concept of general intelligence3. Processes function in an inter-related fashion4. Most processes contribute to any given
behavior, task5. On CPPS defined as “the underlying efficiency
of automaticity of processing”

CPPS Standardization
1. 1,121 students rated by 278 teachers2. 128 communities in 30 states3. Entirely online4. Demographics match U.S. Census well5. Scores were weighted6. Included children with disabilities 7. Demographics details Link

Item Selection
1. Two rounds of piloting2. W-scores indicate wide ability range3. Skewed distributions common4. Rasch item analysis5. Exploratory factor analysis to check subscale
alignment
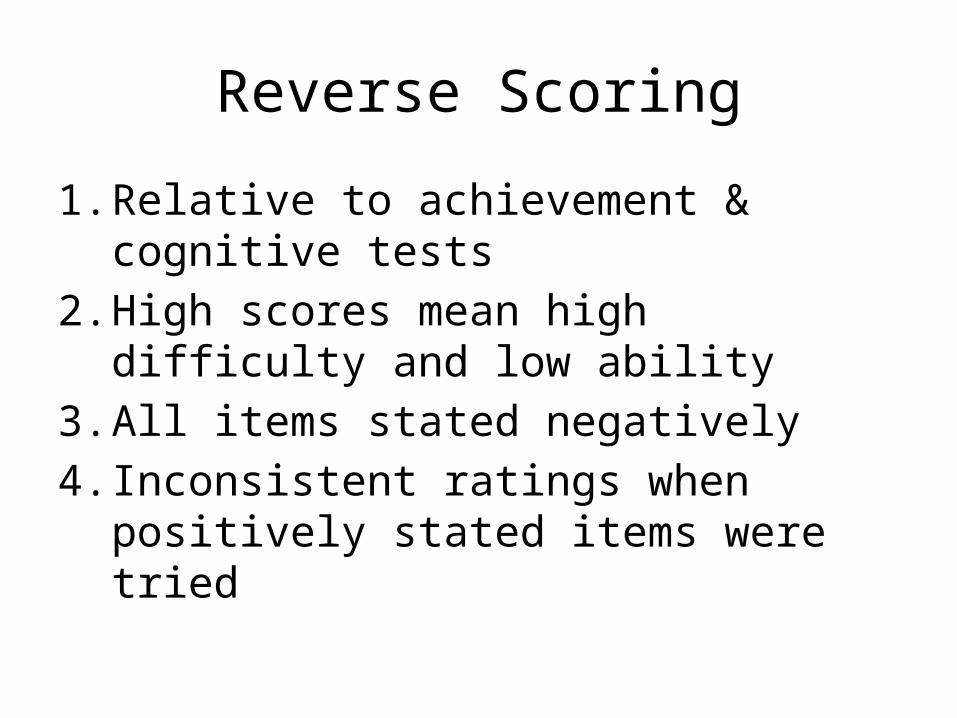
Reverse Scoring
1. Relative to achievement & cognitive tests2. High scores mean high difficulty and low
ability3. All items stated negatively4. Inconsistent ratings when positively stated
items were tried

Norms and Scores
1. 4 age groups (5-6; 7-8; 9-10; 11-12)2. Boys have more processing problems3. No sign. sex differences in fluid reasoning,
phonological, and visual-spatial4. Norms not divided by sex Link5. Combined sex norms better for identification6. T-scores derived from linear transformation
of actual standardization distribution

W-Scores
1. Used in item analysis, development of scoring system, and in reports
2. Mean of 500 at age 10; SD of roughly 203. Converts ordinal rankings into equal intervals4. More precise measurement
1. Gradient with smaller steps 2. More sensitive to changes, progress
5. Use when re-evaluating student with CPPS
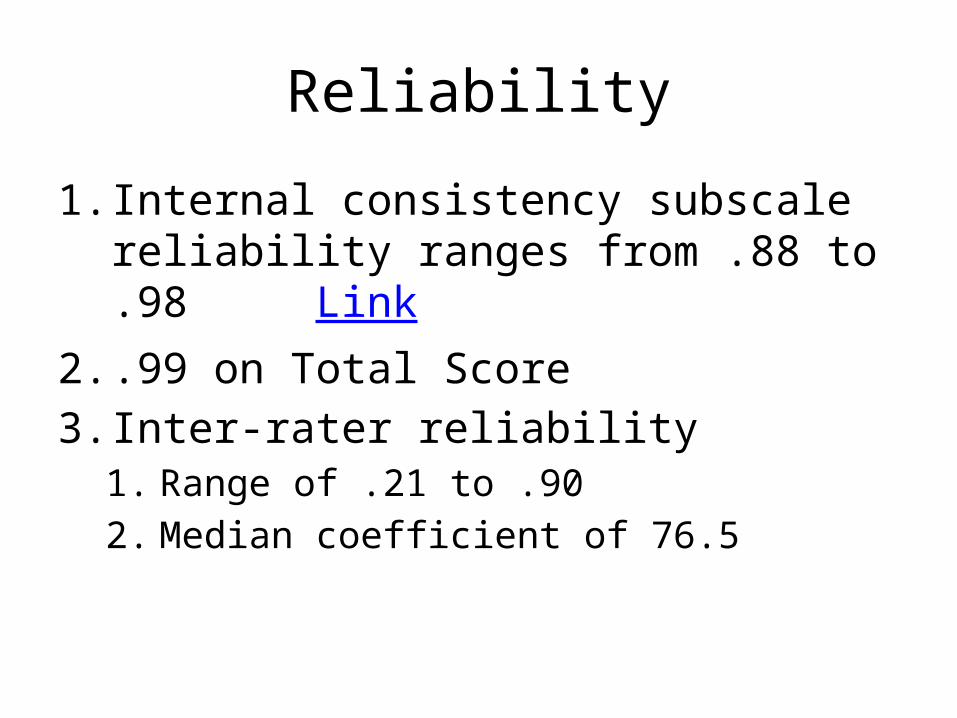
Reliability
1. Internal consistency subscale reliability ranges from .88 to .98 Link
2. .99 on Total Score3. Inter-rater reliability
1. Range of .21 to .902. Median coefficient of 76.5

Validity: Developmental Evidence
1. Skewed distributions because1. Very few children have processing problems2. Fewer processing problems in older children3. Most processes fully develop early4. Teachers rate relative to that grade level
2. Dev. changes observed in younger children3. Changes observed in upper half of problem
distribution Link See Range4. W values used to arrange items in order

Correlations with Achievement
1. High correlations with WJ III Achievement Test scores Link1. The broader the achievement score, the higher
the correlations
2. Correlation of .66 between teacher’s overall ranking of academic skills and CPPS GPA
3. Parent education level and CPPS GPA is .33

Correlations with WJ III COG
1. Fewer correlations than achievement Link2. All CPPS processes have sign. correlations
with Cognitive Fluency (ability to quickly and fluently perform cog. tasks)
3. Most CPPS scales expected to link with WJ III COG tests do, except attention, processing speed, and working memory
4. Also, discriminant evidence

Correlations with BRIEF
1. CPPS Attention, Executive Functions, and Working Memory have the highest correlations with all BRIEF scales and a sign. correlation with every BRIEF score
2. CPPS Attention and EF mostly are >.70 indicating they measure same domains as BRIEF Link
3. Other CPPS scales correlate with BRIEF metacognitive scales but not behavioral

Factor and Cluster Analysis
1. A general factor; all subtests load on1. General processing ability (GPA) may reflect
processing efficiency or automaticity Link
2. Second factor is Attention, EF, sometimes WM: Self-Regulatory Processes
3. Third factor is Fine Motor and Visual-Spatial: Visual-Motor processes Link
4. Results fairly consistent across age groups

Diagnostic Utility for LD
1. 37 LD subjects with broad demographics2. Compared to matched controls, LD subjects
had significantly higher means on all subscales Link
3. The CPPS has high classification accuracy in regards to LD1. Using CPPS GPA cutoff of 60 has 92%
classification accuracy across 74 subjects
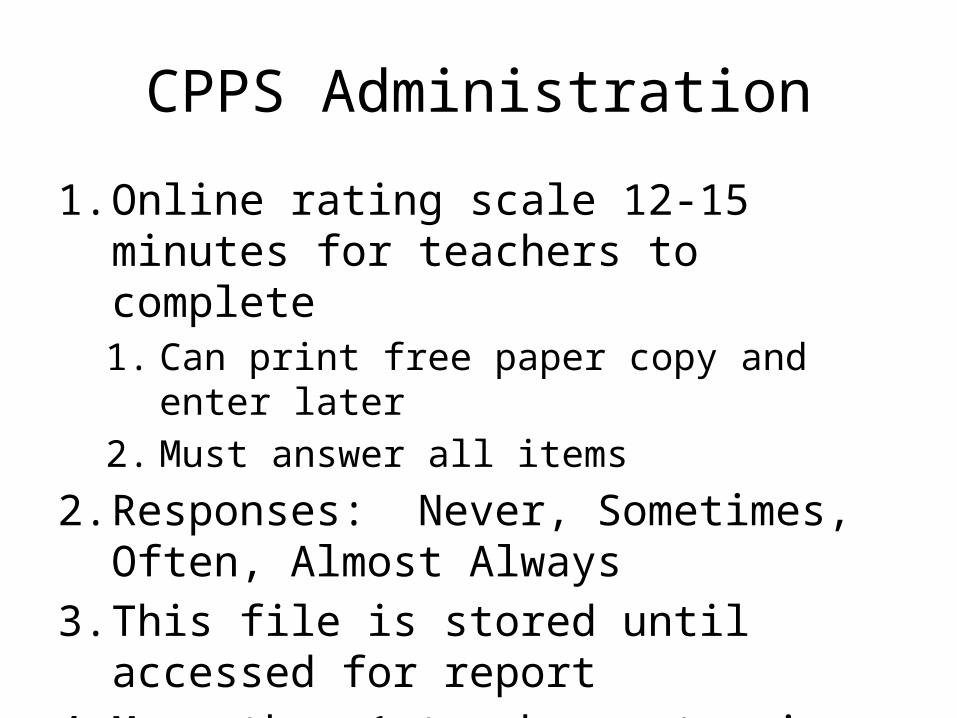
CPPS Administration
1. Online rating scale 12-15 minutes for teachers to complete1. Can print free paper copy and enter later 2. Must answer all items
2. Responses: Never, Sometimes, Often, Almost Always
3. This file is stored until accessed for report4. More than 1 teacher rater is recommended
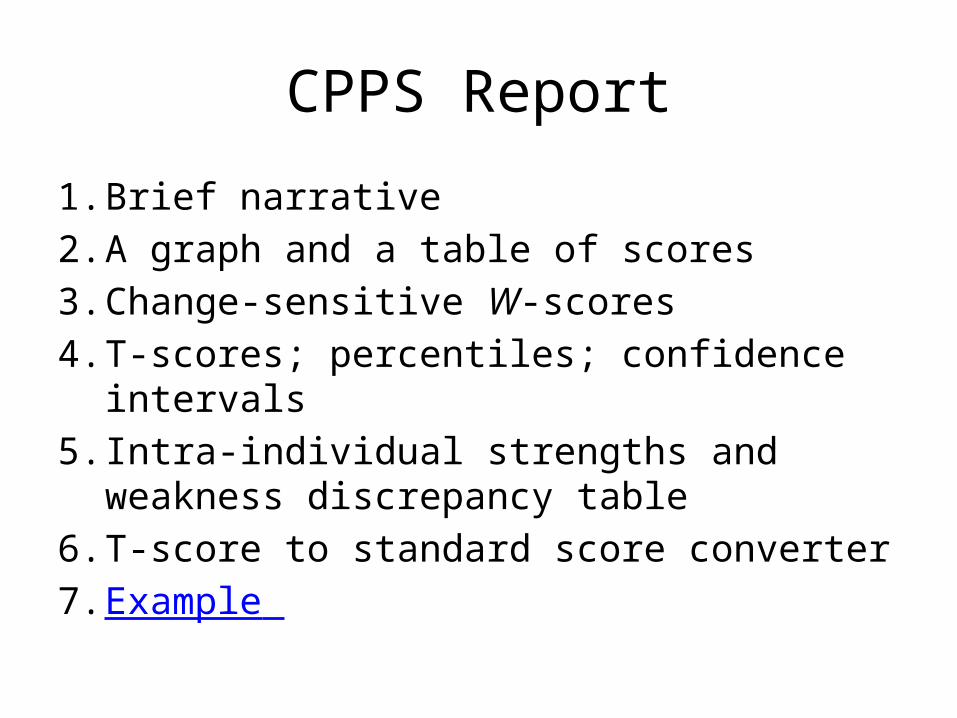
CPPS Report
1. Brief narrative2. A graph and a table of scores3. Change-sensitive W-scores4. T-scores; percentiles; confidence intervals5. Intra-individual strengths and weakness
discrepancy table6. T-score to standard score converter7. Example

Multiple Raters
1. Expect differences2. Compare scores on the graphs
1. Is the profile similar but one teacher’s scores are consistently higher than others
2. Significantly different when confidence bands do not overlap
3. How are the teachers’ experiences with the student different?
4. If 3 raters, give most creditability to middle rater

Diagnosing LD with the CPPS
1. Use a T-score of 60 or above on the GPA2. Use discrepancy table to determine pattern
of strengths and weaknesses1. Predicted score based on mean of other 10 2. Use +/- 1.00 SD of discrepancy as criterion3. Non LD also have a pattern Link
3. Weaknesses should link to evidence-based achievement relations Link

Case I Background
1. 5th grade, 12 year old male2. History of struggling with Math & Wr Lang3. Received tutoring and extra help at school4. Not placed for LD after eval. 2 years prior5. Average IQ6. Doesn’t meet ADHD diagnostic criteria7. Seems immature

Case I CPPS Scores
Attention 70Auditory Processing 51Executive Functions 55Fine Motor 63Fluid Reasoning 64Long-Term Recall 61Oral Language 61Phonological Processing 53Processing Speed 58Visual-Spatial Processing 48Working Memory 63General Processing Ability 60

Case I WJ Cog Scores
Comp-Knowledge 97 *a close match with CPPSLT Retrieval 86*Vis-Spatial 93*Auditory Proc 97*Fluid Reasoning 103Process Speed 82ST Memory 90Phonemic Aware 103*Working Memory 87*Broad Attention 90Cognitive Fluency 85

Case I WJ III ACH
Broad Reading 91*Broad Math 89**Broad Wr Lang 86**Math Calc Skills 90**Writ Exp 85***Has strong CPPS related processes**Has weak CPPS related processes

Case I Conclusions
1. From a processing perspective, could qualify for LD
2. Does not because IQ-Ach discrepancy not severe enough
3. Nevertheless, struggles because of processing problems

Case II Background
1. 7 year old, first grade male2. 1st grade teacher reported many concerns:
attention, math difficulties, losing things, slow to start, slow to complete work
3. Good at art, visual-spatial, behavior4. Reported concerns to parent5. History: needed oxygen at birth6. No health or developmental problems

CPPS Case Study II
Attention 69Auditory Processing 69Executive Functions 65Fine Motor 53Fluid Reasoning 66Long-Term Recall 73Oral Language 64Phonological Processing 65Processing Speed 70Visual-Spatial Processing 65Working Memory 72General Processing Ability 68

Case II WJ III COG Scores
Comp-Knowledge 84LT Retrieval 101Vis-Spatial 110Auditory Proc 122Fluid Reasoning 98Process Speed 96ST Memory 112Phonemic Awareness 108Working Memory 93Broad Attention 99Cognitive Fluency 83

Case II WJ III ACH
Brief Reading 85Broad Math 69*Brief Writing 80 (-1.49)Math Calc Skills 67*
*More than 2.00 SD’s of discrepancy below ability

Case II BRIEF Scores
Inhibit 49Shift 50Emot Control 43BRI 47Initiate 67Working Memory 72Plan/Organize 72Org of Materials 57Monitor 49MI 64GEC 58

Case II WRAML2 Scores
Verbal Memory 108Visual Memory 85Attention/Concentration 88General Memory 91Verbal Recognition 105Visual Recognition 84General Recognition 94Delayed Recall Average 10 (mean for subs)
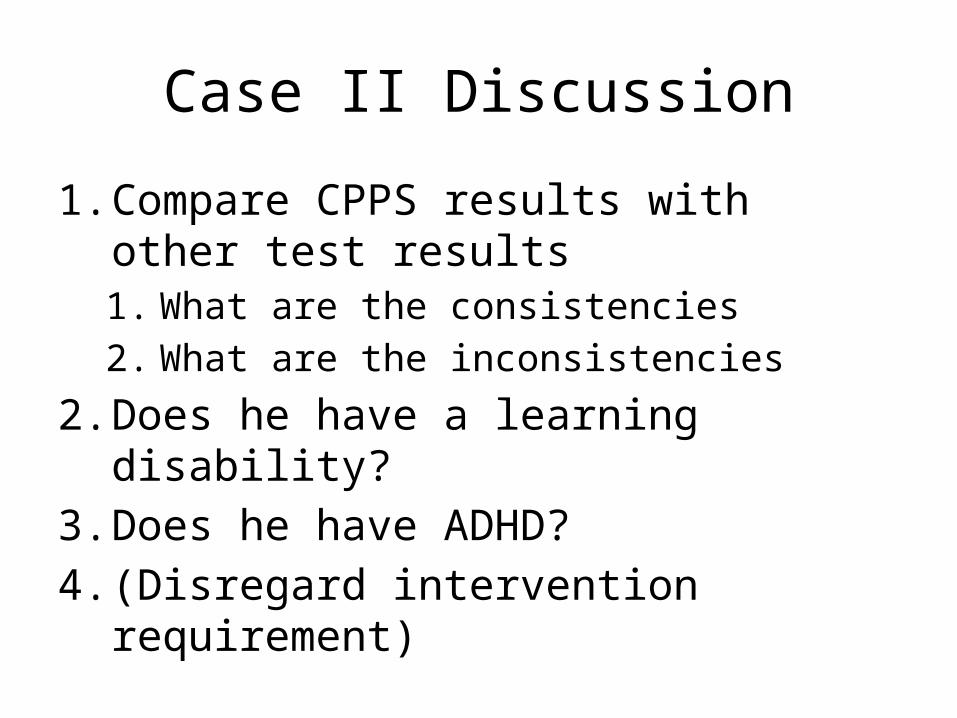
Case II Discussion
1. Compare CPPS results with other test results1. What are the consistencies2. What are the inconsistencies
2. Does he have a learning disability?3. Does he have ADHD?4. (Disregard intervention requirement)

Selective, Cross-Battery Testing
1. Assess areas based on concerns, not on what a test has to offer
2. Mix tests/batteries to cover all the areas1. Limit to 2 or 3 batteries2. Should be normed about the same time
3. Avoid redundancies4. Ideally, 2 subtests per process5. Analyze results together by computing a
cross-battery mean or using IQ
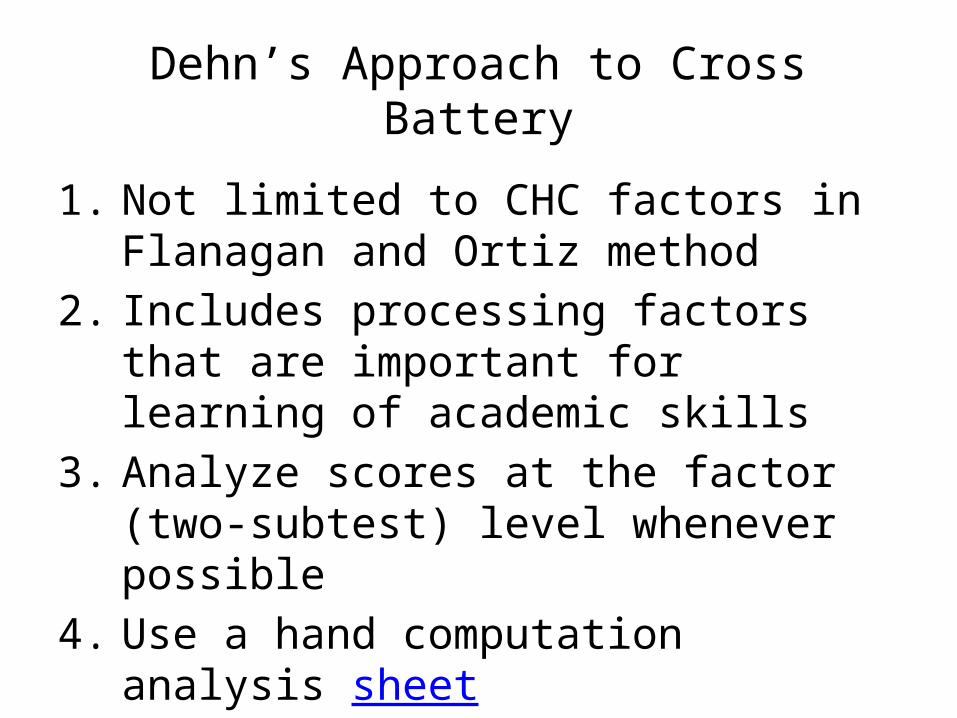
Dehn’s Approach to Cross Battery
1. Not limited to CHC factors in Flanagan and Ortiz method
2. Includes processing factors that are important for learning of academic skills
3. Analyze scores at the factor (two-subtest) level whenever possible
4. Use a hand computation analysis sheet

Selective Testing
1. Not necessary to administer entire battery2. Focus most on hypothesized deficits3. Know the factors/subtests that measure
processes4. Apply a cross-battery approach5. See selective testing table for cog. & ach.
Link

Using CPPS Results to Guide Standardized Testing
1. The WJ III COG is a good match2. Other broad scales, such as memory3. Use selective testing table4. Sample all processing areas but especially
weak and borderline areas5. CPPS processes with scores above 60 should
be sampled with at least 2 subtests

Using the CPPS to Measure Progress
1. Use W-Scores2. Have a mean of 500 at age 103. Standard deviations vary (about 20)4. 4-5 W-score points for every 1-2 T-score
points5. A change of 20 points can be considered
statistically significant

Using the CPPS to Plan an Intervention
1. Select processes with scores above 60 (weaknesses)
2. Prioritize if too many3. Look for strengths (scores below 40) to
counterbalance weakness

References
• Dehn, M. J. (2006). Essentials of Processing Assessment. Wiley Publishing.
(a revision of this book will be out spring 2013)
• Dehn, M. J. (2012). Children’s Psychological Processes Scale, Professional Manual. Schoolhouse Educational Serivces