
Using System Dynamics To Model Risk Perception And - Decision
29
Using System Dynamics to Model Risk Perception and Communication in Response to Threat Alan Brothers, PNNL and Oleg V. Pavlov, WPI
Transcript of Using System Dynamics To Model Risk Perception And - Decision

Using System Dynamics to Model Risk Perception and
Communication in Response to Threat
Alan Brothers, PNNLand
Oleg V. Pavlov, WPI

Mathematical Modeling in Social Science
Physical sciences as ideal for social scienceSocial science evolved from case studies
Margaret MeadClark Hull
Advantages of modelsForces precisionHypothesis testing
Work at PNNL in Motivation and IntentAid analysts in assessing group propensity for violenceModel social science theories after the fact of their constructionCan serve as a blue print for collaboration between modelers and social scientists in research on Dynamics of Risk Perception.
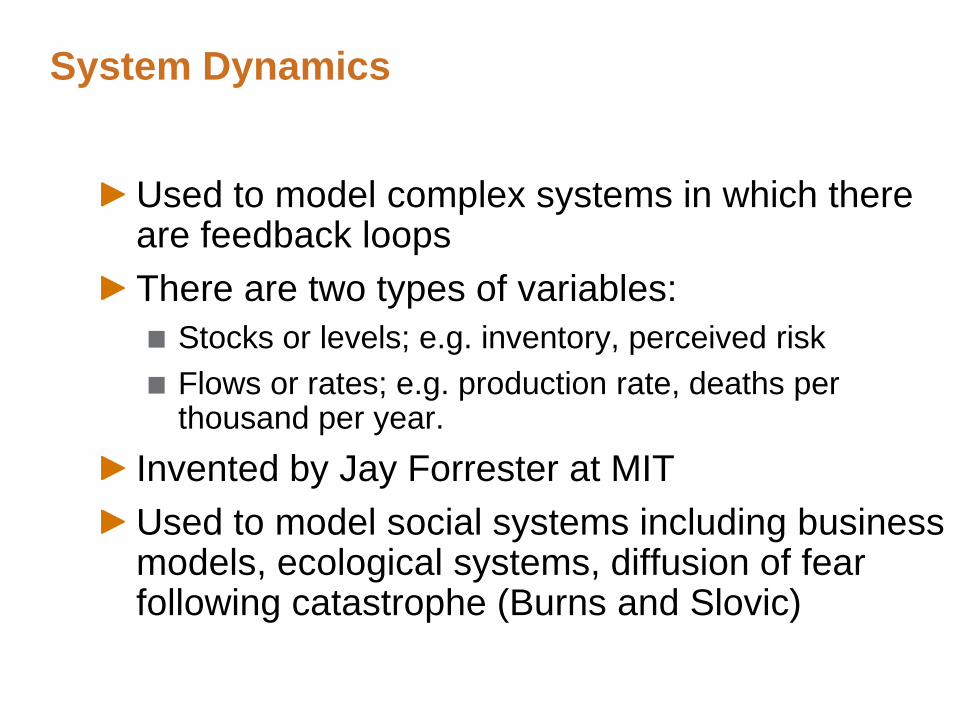
System Dynamics
Used to model complex systems in which there are feedback loopsThere are two types of variables:
Stocks or levels; e.g. inventory, perceived riskFlows or rates; e.g. production rate, deaths per thousand per year.
Invented by Jay Forrester at MITUsed to model social systems including business models, ecological systems, diffusion of fear following catastrophe (Burns and Slovic)
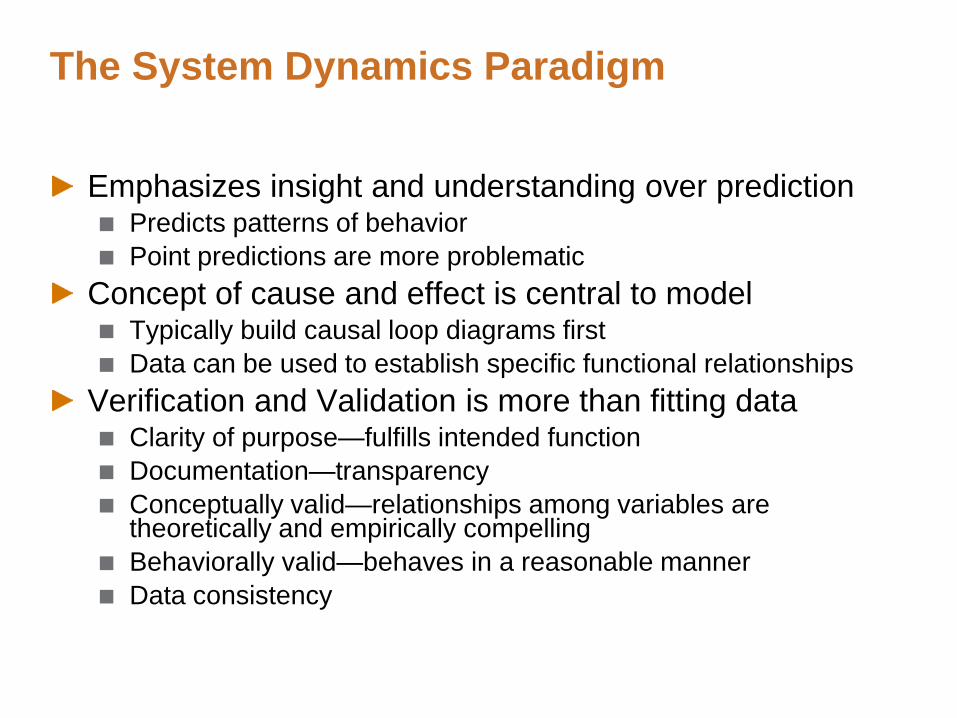
The System Dynamics Paradigm
Emphasizes insight and understanding over predictionPredicts patterns of behaviorPoint predictions are more problematic
Concept of cause and effect is central to modelTypically build causal loop diagrams firstData can be used to establish specific functional relationships
Verification and Validation is more than fitting dataClarity of purpose—fulfills intended functionDocumentation—transparencyConceptually valid—relationships among variables are theoretically and empirically compellingBehaviorally valid—behaves in a reasonable mannerData consistency

The System Dynamic Method
MethodIdentify major factors.Identify cause and effect relationships.Characterize the relationships as direct or inverse.Diagram relationships.Build stock and flow computer model.Validate the model.Analyze behavior of system through simulations.
Value: It shifts the focus from one aspect of a system to the behavior of the system as a whole.

Some Simple Loops: Reinforcing or Positive Loop
ExerciseAmount
Fitness Level
Pleasure ofExercise
+
++
R
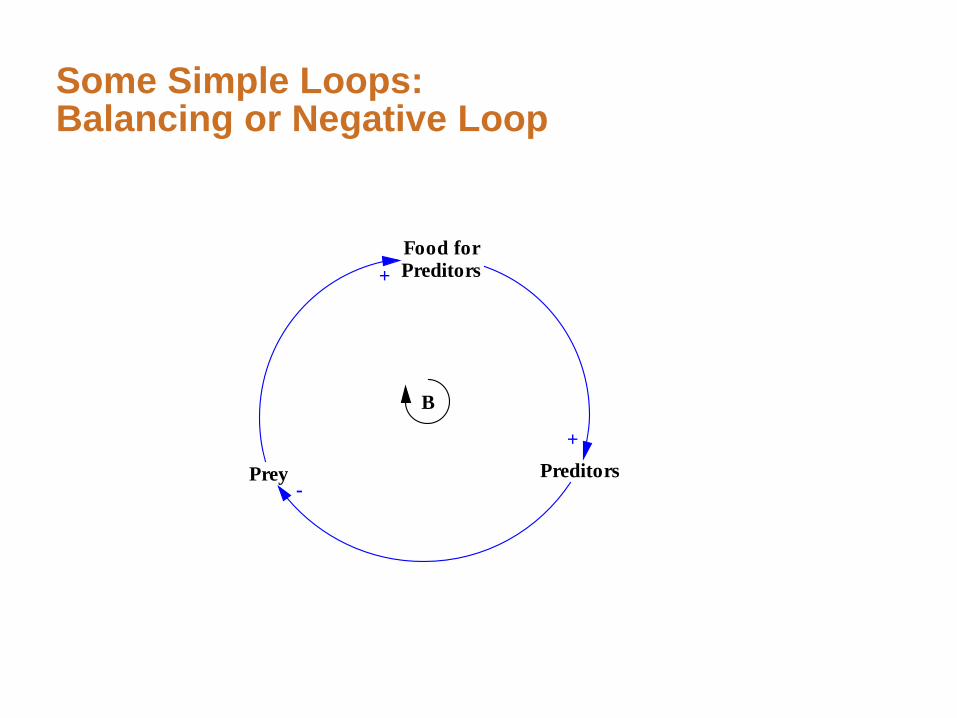
Some Simple Loops: Balancing or Negative Loop
PreditorsPrey-
B
Food forPreditors+
+
8
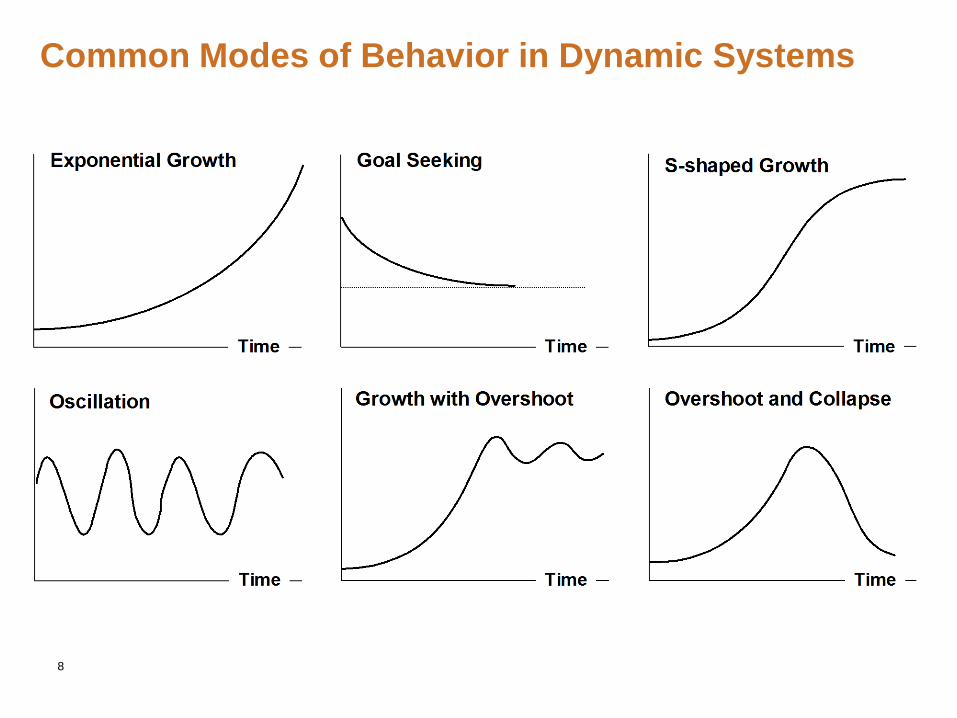
Common Modes of Behavior in Dynamic Systems

9
Exponential decline
Asymptotic decline
Exponential growth
Asymptotic growth
Stock
Overshoot and collapse behavior

10

11
Note: Time axes for top and bottom graphs differ.Source: Bahn and Flenley (1992, p. 174).
Estimated population and tree cover of Easter Island

12
Generic structure that generates overshoot and collapse

Monthly IED incidents in Iraq (JIEDDO)
• Build model based on subject matter expertise that is consistent with data.
A System Dynamics model of IED Effectiveness
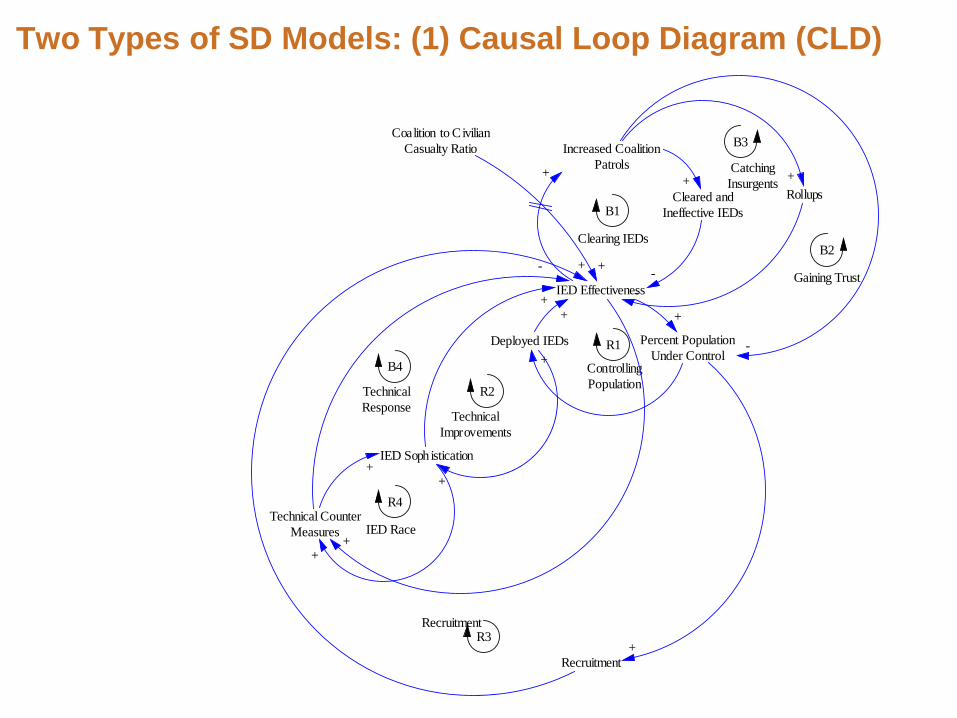
Two Types of SD Models: (1) Causal Loop Diagram (CLD)
Percent PopulationUnder Control
IED Effectiveness
+
R1
Increased CoalitionPatrols+
B1
IED Soph istication
+
ControllingPopulationR2
TechnicalImprovements
-
B2
Gaining Trust
Technical CounterMeasures
+
-
B4
TechnicalResponse
Coalition to CivilianCasualty Ratio
+
Cleared andIneffective IEDs
+
-
Clearing IEDs
Deployed IEDs
+
Rollups+
-
B3
CatchingInsurgents
Recruitment+
+
R3Recruitment
++
+
+
R4
IED Race

Two Types of Models: (2) Stock and Flow Model
Infection Module Escalation Module

A New Paradigm of Risk Perception
Risk perception had been staticThe focus of past research has been on factors that influence perceptions of risk and how layman conceptions differ from experts.Perception of risk following terrorist events or natural disasters evolve quickly as events unfold. There is a need for dynamic models of how risk perceptions evolves following catastrophic events and how it is impacted by government actions and the media.
System dynamics is well suited to model these changes over time
complex interactions and feedback loops.

Dynamic Hypothesis

Model Sectors

The Mass Media Sector
Alternativ e Cov erage
Ev ent Cov erage
Increase in Cov erage
~
HazardEv ent Signal
~Ef f ect of Hazard Ev ent on Cov erage
~ Ef f ect of Signal on Cov erage
Ty pical Duration ofCov erage
Time to Increase Cov erage
Decrease in Cov erage
Desired Cov erage
Max Cov erageof An Ev ent
Gap in Cov erage
Fractional Loss in Economic
Activ ity~Ef f ect of Economy
on Cov erage
Mass Media

The Risk Perception Sector
~
Ef f ect of Signal on Fear
Fearf ulIncrease in Fearf ul
Decrease in Fearf ul
Management Competency
TrustIncrease in Awareness
Max Fraction of Fearf ul
~Ef f ect of
Competency onFear Adjusted Fraction
of Fearf ul
Not Fearf ul
Signal
Time to Calm Down
~Ef f ect of
Trust on Fear
Risk Perception

Base Run

High and Low Values of Trust
High Trust
Low Trust

Amplification of the Signal
Signal = 0.2
Signal = 0.5
Signal = 1.0

What Causes Dynamics?
All dynamics are driven by –
Feedback processesAccumulation processes
The generic behavior modes can be produced by relatively simple generic structures.
24

25
Exponential growth: Structure and behavior

26
Goal seeking: structure and behavior
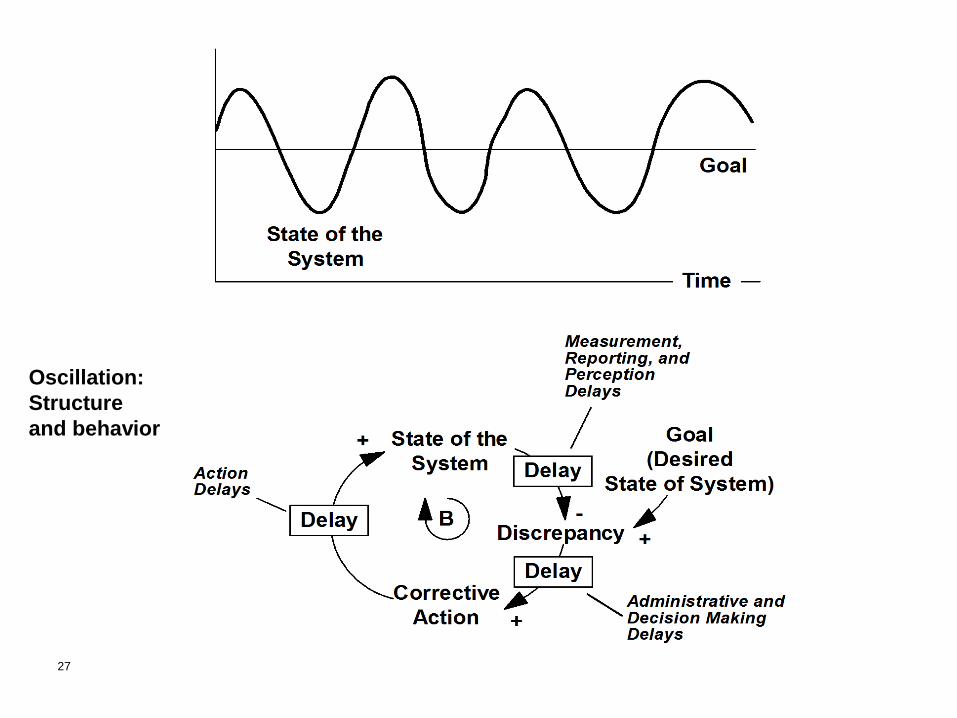
27
Oscillation: Structure and behavior

28
S-shaped growth with overshoot and oscillation:structure and behavior

29
S-shaped growth:
structure and behavior