Using Social Visualization to Motivate Social...
10
1 Abstract—In this article we argue that social visualization can motivate contributors to social production projects, such as Wikipedia and open source development. As evidence, we present CodeSaw, a social visualization of open source software development that we studied with real open source communities. CodeSaw mines open source archives to visualize group dynamics that currently lie buried in textual databases. Furthermore, CodeSaw becomes an active social space itself by supporting comments directly inside the visualization. To demonstrate CodeSaw, we apply it to a popular open source project, showing how the visualization reveals group dynamics and individual roles. The article concludes by presenting evidence that CodeSaw, and social visualization more generally, can motivate contributors to social production projects if the visualization leaves the laboratory and makes it to the community visualized. Index Terms— Open source, Remote Collaboration, Social Visualization, Visualization. I. INTRODUCTION “Its an emergent property of connected human minds that they create things for one anothers pleasure and to conquer their uneasy sense of being too alone.” — Eben Moglen, Professor, Columbia Law School [1] Yochai Benkler defines social production as “a new modality of organizing production: radically decentralized, collaborative, and nonproprietary; based on sharing resources and outputs among widely distributed, loosely connected individuals who cooperate with each other without relying on either market signals or managerial commands” ([2], p.60). In other words, social production is the amazing work we see in open source communities, Wikipedia and elsewhere [3]. Just looking at open source development, we can confidently say that social production has succeeded: nearly 1.1 million North American software developers participate in open source development [4]. Major companies and governments have adopted open source software for critical infrastructure [5]. Manuscript received June 1, 2008. This work was supported in part by the National Science Foundation NSF 0643502. E. Gilbert is at the University if Illinois, Urbana, IL 61801 USA phone: 217-333-3328; fax: 217-244-6869; e-mail: egilber2@ cs.uiuc.edu. K. Karahalios is at the University if Illinois, Urbana, IL 61801 USA phone: 217-265-6841; fax: 217-244-6869; e-mail: [email protected]. Projects like Linux, Apache and Firefox have catapulted the social production “movement” into the popular consciousness, to say nothing of Wikipedia. Social production operates quite differently than traditional information projects. Contributors do not meet face to face. There are few plans and even fewer schedules. Contributors choose what they work on and how much time they spend working on it. In almost all cases, they do not get paid for their work. In open source development, for example, traditional mechanisms for coordinating work (e.g., schedules, plans, face-to-face meetings) are absent [6] yet studies show that open source development needs coordination more than collocated development [7]. We are just starting to understand what drives these communities. Many social production communities represent vibrant social spaces, as well [8]. User discussion and documented conflict resolution have steadily grown on Wikipedia [9]. In open source communities, developers have heated emailed exchanges about feature additions and current legal issues concerning software licensing. Furthermore, the organizational structures that these communities adopt impact their sociality and contributors’ motivations [10]. Considering the motivations of contributors to social production projects, Benkler writes, For all of us, there comes a time . . . when we choose to act in some way that is oriented toward fulfilling our social and psychological needs, not our market-exchangeable needs. It is that part of our lives and our motivational structure that social production taps, and on which it thrives. There is nothing mysterious about this. It is evident to any of us who rush home to our family or to a restaurant or bar with friends at the end of a workday . . . When can all these acts, distinct from our desire for money and motivated by social and psychological needs, be mobilized, directed, and made effective . . .? ([2], p. 98—99) In this article, we argue that social visualization can help answer Benkler’s question. Theorists and experimenters have found that social production projects rely on the intrinsic motivations of contributors, what Benkler describes as our “social and psychological needs,” as opposed to external motivations, like money [10]-[12]. Moreover, researchers have found that positive verbal feedback can increase intrinsic motivation [12]. We present evidence here that feedback in the form of social visualization also positively impacts contributors’ motivations, in addition to providing a space for social reflection. Using Social Visualization to Motivate Social Production Eric Gilbert, Member, IEEE and Karrie Karahalios, Member, IEEE
Transcript of Using Social Visualization to Motivate Social...
1
Abstract—In this article we argue that social visualization can
motivate contributors to social production projects, such as
Wikipedia and open source development. As evidence, we present
CodeSaw, a social visualization of open source software
development that we studied with real open source communities.
CodeSaw mines open source archives to visualize group
dynamics that currently lie buried in textual databases.
Furthermore, CodeSaw becomes an active social space itself by
supporting comments directly inside the visualization. To
demonstrate CodeSaw, we apply it to a popular open source
project, showing how the visualization reveals group dynamics
and individual roles. The article concludes by presenting
evidence that CodeSaw, and social visualization more generally,
can motivate contributors to social production projects if the
visualization leaves the laboratory and makes it to the
community visualized.
Index Terms— Open source, Remote Collaboration, Social
Visualization, Visualization.
I. INTRODUCTION
“It s an emergent property of connected human minds that they
create things for one another s pleasure and to conquer their
uneasy sense of being too alone.”
— Eben Moglen, Professor, Columbia Law School [1]
Yochai Benkler defines social production as “a new
modality of organizing production: radically decentralized,
collaborative, and nonproprietary; based on sharing resources
and outputs among widely distributed, loosely connected
individuals who cooperate with each other without relying on
either market signals or managerial commands” ([2], p.60). In
other words, social production is the amazing work we see in
open source communities, Wikipedia and elsewhere [3]. Just
looking at open source development, we can confidently say
that social production has succeeded: nearly 1.1 million North
American software developers participate in open source
development [4]. Major companies and governments have
adopted open source software for critical infrastructure [5].
Manuscript received June 1, 2008. This work was supported in part by the
National Science Foundation NSF 0643502.
E. Gilbert is at the University if Illinois, Urbana, IL 61801 USA phone: 217-333-3328; fax: 217-244-6869; e-mail: egilber2@ cs.uiuc.edu.
K. Karahalios is at the University if Illinois, Urbana, IL 61801 USA
phone: 217-265-6841; fax: 217-244-6869; e-mail: [email protected].
Projects like Linux, Apache and Firefox have catapulted the
social production “movement” into the popular consciousness,
to say nothing of Wikipedia.
Social production operates quite differently than traditional
information projects. Contributors do not meet face to face.
There are few plans and even fewer schedules. Contributors
choose what they work on and how much time they spend
working on it. In almost all cases, they do not get paid for their
work. In open source development, for example, traditional
mechanisms for coordinating work (e.g., schedules, plans,
face-to-face meetings) are absent [6] yet studies show that
open source development needs coordination more than
collocated development [7]. We are just starting to understand
what drives these communities.
Many social production communities represent vibrant
social spaces, as well [8]. User discussion and documented
conflict resolution have steadily grown on Wikipedia [9]. In
open source communities, developers have heated emailed
exchanges about feature additions and current legal issues
concerning software licensing. Furthermore, the organizational
structures that these communities adopt impact their sociality
and contributors’ motivations [10].
Considering the motivations of contributors to social
production projects, Benkler writes,
For all of us, there comes a time . . . when we choose to act in
some way that is oriented toward fulfilling our social and
psychological needs, not our market-exchangeable needs. It is
that part of our lives and our motivational structure that social
production taps, and on which it thrives. There is nothing
mysterious about this. It is evident to any of us who rush home
to our family or to a restaurant or bar with friends at the end of
a workday . . . When can all these acts, distinct from our desire
for money and motivated by social and psychological needs,
be mobilized, directed, and made effective . . .? ([2], p. 98—99)
In this article, we argue that social visualization can help
answer Benkler’s question. Theorists and experimenters have
found that social production projects rely on the intrinsic
motivations of contributors, what Benkler describes as our
“social and psychological needs,” as opposed to external
motivations, like money [10]-[12]. Moreover, researchers have
found that positive verbal feedback can increase intrinsic
motivation [12]. We present evidence here that feedback in
the form of social visualization also positively impacts
contributors’ motivations, in addition to providing a space for
social reflection.
Using Social Visualization to Motivate Social Production
Eric Gilbert, Member, IEEE and Karrie Karahalios, Member, IEEE
2
As primary evidence for our claim, we present CodeSaw, a
social visualization of open source software development that
we studied with real open source communities [13]. Almost all
social production communities record the community’s
actions and interactions; however, most leave the archives
untapped. The sheer size of the archives may play a significant
role. A typical open source project can generate over 20,000
code checkins, and a project mailing list may hold years of
conversations, comprising thousands of individual email
messages. While a long history of group dynamics lives in
these archives, the current state of technology leaves it buried.
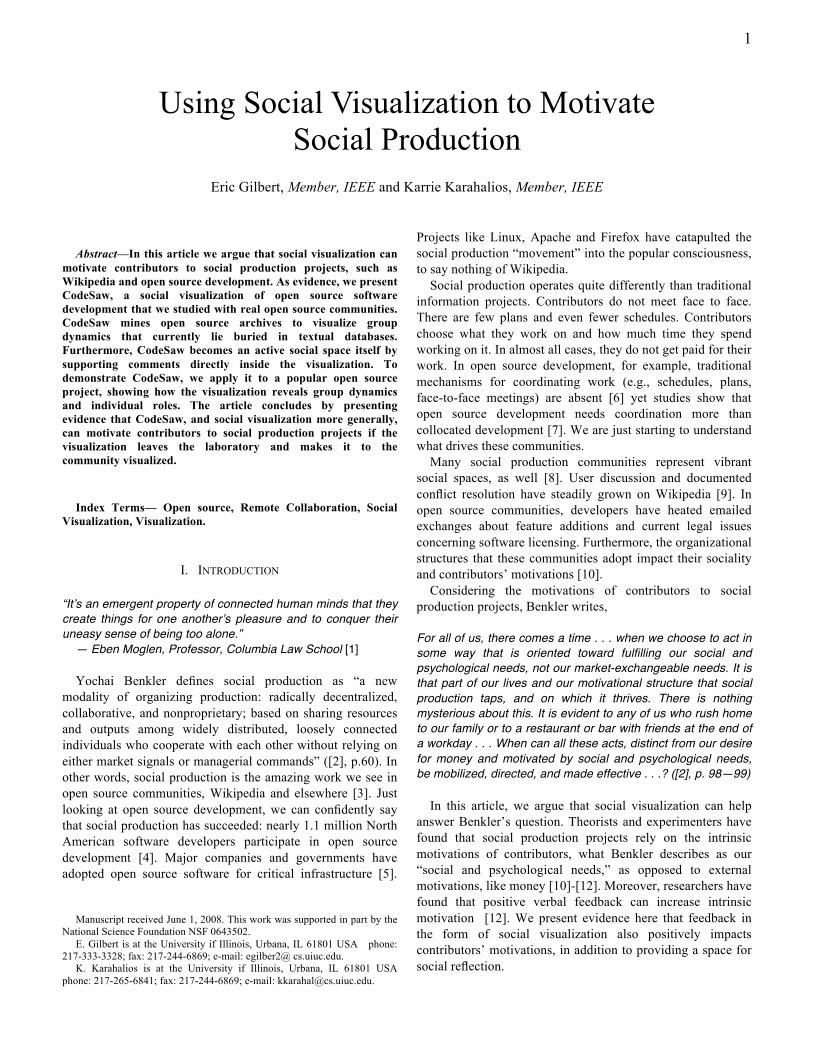
CodeSaw mines open source archives, combining code
repository information with project communication to
visualize a software community from two independent
perspectives (Figure 1). By bringing together both shared
artifacts (code) and the talk surrounding those artifacts
(project mail), CodeSaw reveals group dynamics that currently
lie dormant in text archives. CodeSaw bundles novel
interaction techniques with visualization best practices to
provide a space for reflection for dispersed online
communities.
For the foundation of social production communities, the
open source developers, the Wikipedia authors, etc., social
visualization offers a chance to reflect on their community and
their achievements. Especially because most do not get paid
for their work, seeing their contributions in a community
context can be powerful. For example, when asked about how
CodeSaw made him feel about his contributions to a project,
one user study participant told us that it made him feel
“vindicated.” CodeSaw was designed from the start to support
and reflect community. It serves to support awareness for the
widely-distributed and loosely-knit teams found in social
production communities.
Many projects have visualized online communities,
including social production communities [14]-[24]. To date,
however, most have taken the approach that the visualization
is intended for outsiders (e.g., researchers) to gain insight into
a community’s behavior and structure. CodeSaw has a
different goal: we argue that integrating social visualization
back into actual communities can make a significant impact on
the communities themselves. As far as we know, ours is the
first work to examine the impact of social visualization on the
motivations of contributors to real social production projects.
In social production communities, contributors build and
closely guard their reputations [25]. Social visualization can
help contributors show off their reputations, increase their
motivation and reward them for their contributions. This
argument, the CodeSaw visualization itself and our focus on
Fig. 1. CodeSaw, a social visualization of open source communities, visualizing the open source project Gaim in 2004 (Gaim, 2007). Small
timelines denote developers, with time progressing from left to right. The top of each axis represents code contributions; the bottom represents project communication. The user has compared two developers by dragging their timelines into the investigation area at the top. By hovering, the user sees the top 5 files changed by a developer.
3
our theoretical foundations, form the main contributions of
this article.
II. BACKGROUND
We begin by focusing on related work in distributed
software development, CodeSaw’s target audience. We then
review related work in both software visualization and social
visualization. Finally, we explain how our approach builds on
and extends previous research in social visualization.
A. Distributed and Open Source Software Development
Gutwin, et al. interviewed open source developers to learn
more about the mechanisms that underlie their collaboration
[26]. In their study, they found that open source developers do
maintain awareness of one another, and that text-based
communication (e.g., mailing lists and chat systems) is the
primary vehicle for maintaining it. Along the same lines,
LaToza's study claims that developers devote 40% of their
time to communicating about code [27]. Kraut and Streeter
stressed the uncertainty, interdependence and informal
communication of software development [28]. Noting the
distinct problems of scale inherent in large software systems,
they point out that “many software systems . . . are very large
and far beyond the ability of any individual or small group to
create or even understand in detail.”
Nakakoji, et al. looked at the evolution of open source
projects, providing a taxonomy of open source developers:
Passive User, Reader, Bug Reporter, Bug Fixer, Peripheral
Developer, Active Developer, Core Member and Project
Leader [29]. Yamauchi notes that properties of “lean media”
enable open source developers to piece together simple
communication tools to get their work done [30]. In the
context of maintaining large software systems, Singer found
that code repositories (e.g., CVS) are important sources of
information for programmers [31].
Researchers have also looked at open source communities
from an organizational perspective. Mockus, et al. studied two
well-known and successful open source projects, Apache and
Mozilla [6].They examined the assignment of roles in each
community, finding that a core group of about 10 to 15
developers used mailing lists to coordinate and assign work.
Osterloh and Deci found that organizational forms and
different types of feedback significantly impact intrinsic
motivation, a critical element in social production
communities [10],[12]. In brief, they found that external
motivations “crowd out” intrinsic motivations—for example,
paying your friends to watch over your house while you go on
vacation can actually decrease their motivation to help you.
B. Visualization of Software and Software Development
A number of projects have visualized software projects
[32]-[36],[16],[17]. SeeSys takes an overall project approach,
using a treemap visualization of a source code file system
[32]. SeeSys works particularly well for very large projects
that are also relatively stable. Seesoft approaches the problem
on a line-by-line basis, mapping every line of a file to a
column [35]. Columns are colored based on attributes such as
recency of change, the developer that made the change, etc.
Biehl’s FASTDash aggregates individual code files into a
treemap and attaches meaningful contextual information to
support co-located programming [33]. Ducheneaut looked at
online software development, but from a network prospective
[17],[34]. Ducheneaut’s work examines the social and material
networks that form in online software collaboration.
Other work adopts a line-oriented style. Augur presents one
user with an integrated visual-diff display of CVS records
[16]. Augur, as in [17],[34], also gives users a social network
view of the code and a temporal view. The temporal view is of
particular interest to CodeSaw’s design process. While Augur
shows a line-oriented temporal history, CodeSaw abstracts
that information. CodeSaw shows one year in the life of a
project, and is not tied to any one file. CodeSaw also differs
from Augur by adding spatial messaging and email
communication as social features to its visualization. We
designed CodeSaw as a community mirror, a visualization for
an entire group.
C. Social Visualization
Social visualization is visualization about people, for people
[37]. The first social visualizations [14],[18], organized
themselves around two basic principles, and most successive
work has followed suit: (1) group membership is fundamental
to social practice [38], and (2) behavior patterns often emerge
from groups that individuals cannot themselves describe [39].
Later work in social visualization [9],[40], on the other hand,
has worked on distributing visual analysis across many people,
which seems to yield better overall results [41]. Some social
visualization designers have designed spectator experiences
into their visualizations to support social data analysis
[42],[43]. On the whole, effective social visualizations, like
effective social systems generally, tend to respect the
principles of visibility, awareness and accountability, known
as social translucence [44].
A number of projects have looked at the behavioral patterns
that communities demonstrate [9],[14],[15],[18],[20],[22],
[23],[43],[45],[46]. History Flow [46] and [23] visualize
Wikipedia and Usenet postings, respectively. History Flow
focuses on the interaction of collaborators on one Wikipedia
entry. Authorlines deals with one user's posts to Usenet. Also
looking at Usenet, Smith and Fiore built a treemap
visualization of Usenet’s hierarchy which allowed them to
analyze posting patterns in different parts of the community.
Nardi constructed a social network visualization of contacts.
And Wattenberg accidently created a minor Internet fad with a
visualization of the popularity of baby names over time [45].
We build on and extend the research presented here. We
note that the work summarized above focuses on learning
about a community or data set from the outside (usually
researchers learning about a community of interest). Two
notable exceptions to this rule, both by Fernanda Viégas,
support our argument that social visualization can motivate
social production: PostHistory and Themail [22],[21]. Both
projects visualized personal email archives and found that
4
users had strong personal reactions to the visualizations. Users
told stories that the visualizations prompted in their minds;
they sent screenshots to family and friends. In short, the
visualizations compelled them to interact. We believe social
visualization not only holds the power to spur social
interaction in the way observed by Viégas, but also to
motivate contributions to important social production projects,
like Wikipedia and open source development.
III. CODESAW: A SOCIAL VISUALIZATION OF OPEN SOURCE
SOFTWARE DEVELOPMENT
CodeSaw evolved from a prototype to its current form over
the course of four major iterations. We next discuss the four
major design implications from our formative evaluations that
guided the final design of CodeSaw.
A. Design Implication: Focus on people
Users of the prototype started by asking simple social
questions. “When was I most active?” “Who writes more code
than me?” “Who was sending email then?” From the start it
was evident that the prototype had difficulty answering these
simple questions. We noticed that users of the visualization
asked questions that revolved around people: themselves and
the others working in the periphery. Therefore, CodeSaw
focuses first and foremost on the people in the community.
B. Design Implication: Design for social data analysis
During formative evaluations, users would often call over
other people to look at their discoveries. In one instance, a
user noted that a particular developer only contributed code
during the summer, wondering “if this developer might be a
student.” In another instance, a user commented that with the
exception of one developer, no one had contributed to a
particular project during the last week of December. Talking
about the one developer that contributed, the user said, “the
holidays must not have been good, since this guy worked so
much.” The developer contributed only code during this
period; the mailing list was silent, implying that the developer
worked alone. We feel that our focus on people directly lead
to the social data analysis we observed.
C. Design Implication: Allow users to explore context
While early CodeSaw iterations achieved a simplicity that
users liked, some felt that it hid too much information. They
asked for a way to uncover some of the information that
CodeSaw aggregated or discarded. For example, a number of
designers wanted to know on what files the developers were
working, or what phrases the developers were most commonly
writing in emails at the time of a release.
D. Design Implication: Only visualize essential information
The CodeSaw prototype used a large portion of the
available information in the visualization: number of lines
added, number of lines subtracted, recency of changes, etc.
Initially, we hypothesized that code developers would want
such a high level of detail. However, users told us that it
exposed too much information. If they wanted such high
levels of detail, users could more easily go back to the CVS
archives and the code itself. Only the information items
indicated as very useful by users made their way into
CodeSaw.
CodeSaw presents an easily graspable concept of
“contribution:” raw number of code lines added or email
words written. Although this choice throws away some
important information about a developer's actions, most
designers and developers considered it a fairly accurate
representation of work.
This simplified representation is very powerful. Most
existing tools focus on only one archive. CodeSaw, on the
other hand, incorporates two archives, visualizing the
community from two important and separate perspectives.
CodeSaw intuitively made sense to users, since it did not
incorporate complex measurements that were hard to
understand quickly. Unlike our experience with early
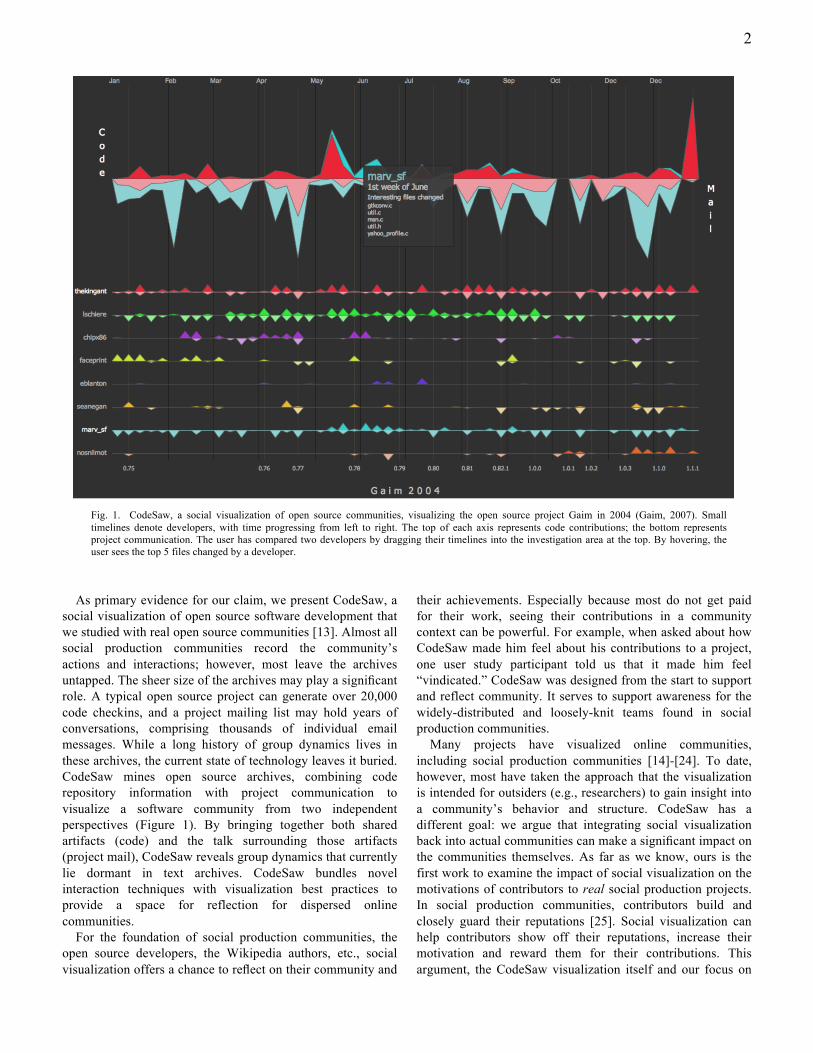
Fig. 2. The entire life of a numerical analysis open source project. Developers in this project have visual signatures: the green developer, for
example, codes in periodic bursts separated by month-long silences. The project generated a significant amount of activity in its first few months, but interest wanes considerably towards the end.
5
iterations, many people said that they would not need to go
back to CVS to see the things that CodeSaw told them.
E. Design Implications for reflective social visualiztions
We feel it is important to note that CodeSaw explicitly aims
to reflect a community for that community, not for an external
researcher. For example, a researcher might be interested who
brokers power in various types of open source projects, who
sets the agenda or who enforces norms. A social network
visualization of various projects might serve this goal.
CodeSaw is different. It seeks to reflect the community in a
way that members of that community care about. All of the
design implications stem from this fundamental goal.
For this reason, CodeSaw eliminates unnecessary
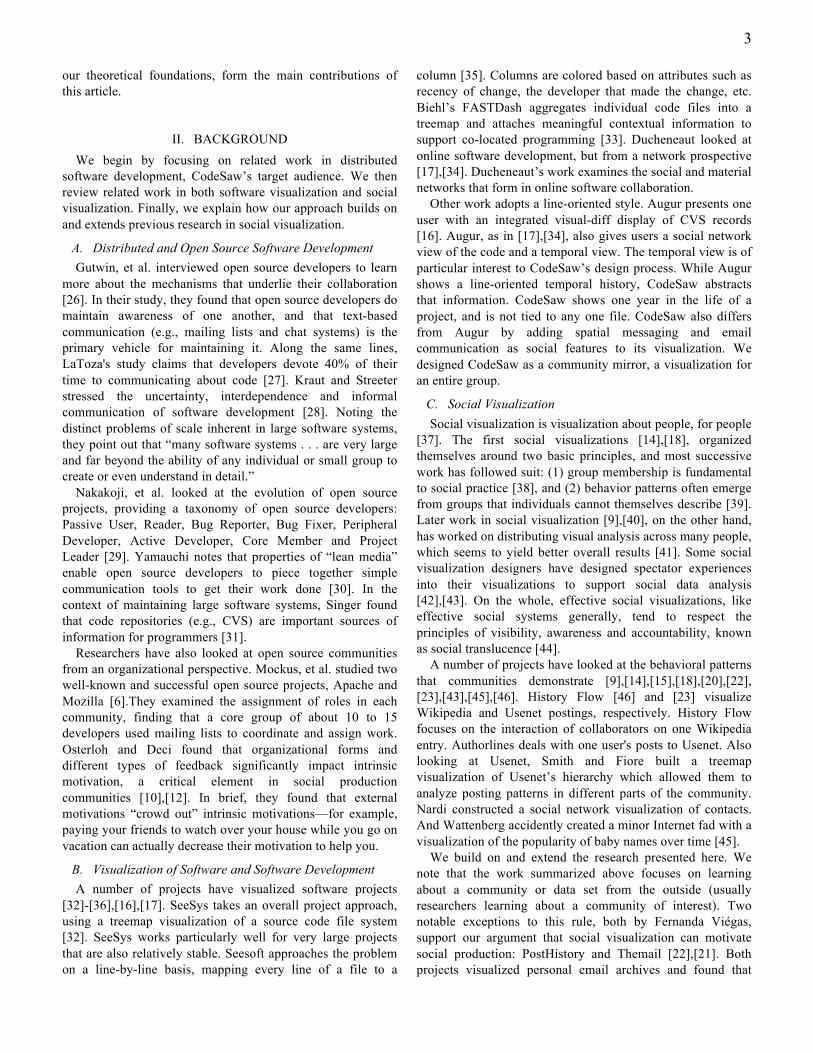
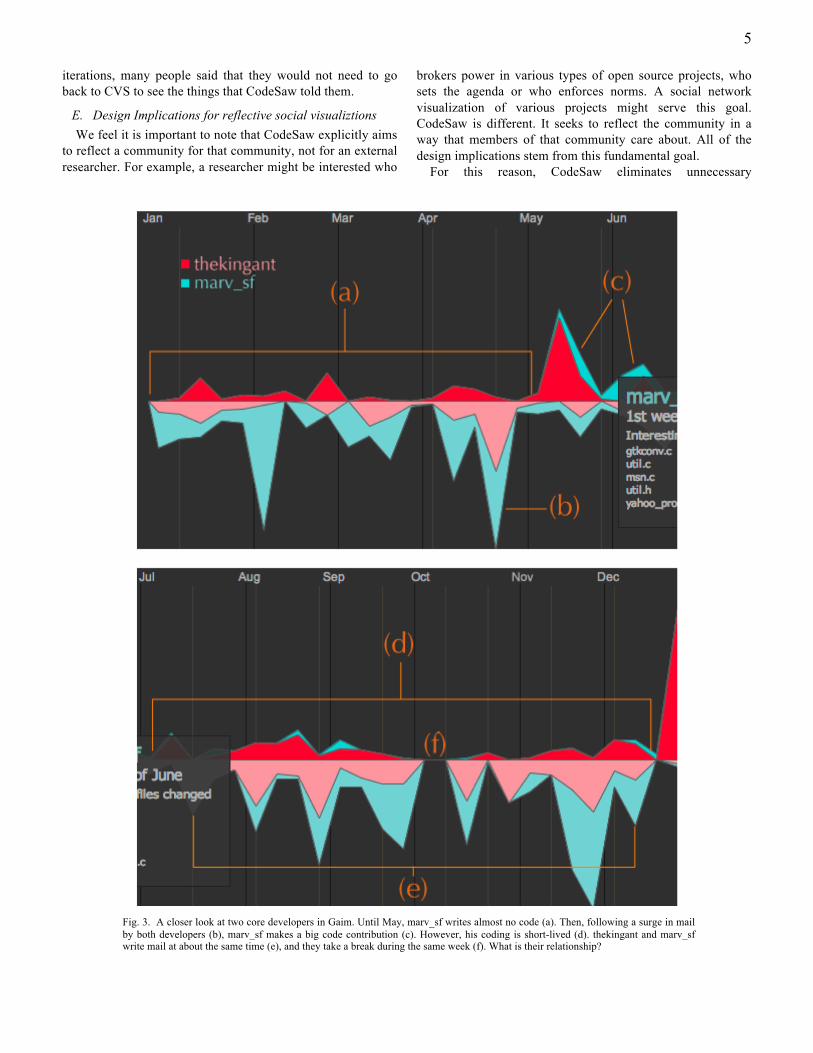
Fig. 3. A closer look at two core developers in Gaim. Until May, marv_sf writes almost no code (a). Then, following a surge in mail
by both developers (b), marv_sf makes a big code contribution (c). However, his coding is short-lived (d). thekingant and marv_sf write mail at about the same time (e), and they take a break during the same week (f). What is their relationship?
6
complications like complex models of performance. Some
would argue that this represents a step in the wrong direction.
For years, the software engineering literature has established
heaps of benchmarks to evaluate code. However, we take a
distinctly different point of view. The coders know what their
code means; CodeSaw does not need to interpret it for them. It
allows users to explore instead of summarizing. When
designing future reflective interfaces for social production, we
argue that simpler is usually better—let the members of the
community make the interpretations. But also provide a space
in which they can do it.
IV. USING CODESAW TO FIND TRENDS AND ROLES
As a demonstration of CodeSaw’s capabilities, we turn now
to using the visualization to find trends and roles in a real open
source community. CodeSaw can illuminate the trends of a
project, as well as the roles that individuals assume in
collaboration. In the example that follows we applied
CodeSaw to the popular open source project Gaim1 [47].
Figure 1 shows Gaim broadly, looking at all core developers
over the year 2004. Figure 3, on the other hand, shows a
detailed view of two developers. Both views give us insight
into the community.
A glance at Figure 1 tells us that Gaim was very active in
2004. A closer look, however, shows us that one or two people
do the majority of the work. We have seen this trend in all 20
open source projects we have analyzed with CodeSaw. A
handful of leaders emerge who keep the project moving.
Looking at the two major contributors, Figure 3 offers
insights into their behavior patterns. Until May, marv_sf wrote
only mail (a). In the last few weeks of April, marv_sf and
thekingant write a large amount of mail corresponding to a
project release (b). CodeSaw denotes a project release by a
thin gray line. Almost directly after April's mail surge,
marv_sf starts coding for the first time, backed up by
thekingant (c). marv_sf makes significant contributions to
Gaim during these couple of months. Did thekingant convince
marv_sf to code for Gaim?
By July, marv_sf has stopped coding for the most part. He
contributes almost no code for the rest of the year, in fact (d).
We can also see that thekingant and marv_sf tend to peak in
project mail at the same times, usually connected to a release
(e). In the first week of October, right before a release, both
developers go silent--no code or mail (f). The project did not
go down because other people contributed. Did both
developers happen to take a break at the same time? Do they
know each other personally?
Viewing CodeSaw from the outside, we can try to project a
story onto the visualization. Did the surge in production by the
thekingant inspire marv_sf? Did marv_sf finish a hard
semester at school and suddenly find a lot of time on his
hands? However, CodeSaw is primarily designed as a
community mirror. From the outside we can learn important
things about a project, but we do not get the critical context
1 Gaim has now changed its name to Pidjin (http://www.pidgin.im/).
that only the community itself can provide. In this respect, we
feel that CodeSaw achieves a good balance between revealing
private information to the world and leaving enough of it
ambiguous so as to not invade privacy.
V. CODESAW’S ONLINE FIELD STUDY
We distributed CodeSaw via the web to open source
developers around the world. We wanted developers to
integrate CodeSaw into their regular routines and projects,
which we could not accomplish in the lab. We recruited by
targeting project mailing lists and lead developers of open
source projects. The projects were all hosted on
SourceForge.net. In total, nearly 500 recruitment messages
were sent over the course of one month. Subjects received a
$20 gift certificate to an online retailer for their participation
in the study.
Our approach allowed developers to see their own project
history visualized. After interacting with CodeSaw from
somewhere between 30 minutes to one hour, participants
completed an online survey. We asked users to complete the
survey no more than one hour after they finished using
CodeSaw. Participants were free to continue using CodeSaw
after completing the survey.
Because we wanted to do an in situ study, and the
participants were scattered across the world, we could not do
interviews. So we replaced interviews with the best thing we
could: an in-depth online survey. The survey asked
participants about their satisfaction and enjoyment with
CodeSaw. In addition, the survey asked participants about the
effectiveness of CodeSaw in visualizing their community.
Participants and their Projects
Nine participants took part in the evaluation of CodeSaw.
Two were female and seven were male. The subjects ranged in
age from 19 to 61. Five came from open source projects; four
belonged to the same project at a research laboratory. The four
from the research laboratory spent about half of their time in
the same office and about half at a distance. They used email
on the project mailing list to coordinate work. The research
project had been ongoing for three years at the time of the
study. In terms of code, the project consisted of 801 source
code files.
Each of the five open source participants worked on a
distinct project. Each project was among the top 200 most
active projects hosted on SourceForge.net [48]. The duration
of the projects ranged from one to four years. In terms of code,
the projects ranged from 376 source files to 1785 source files,
with a mean of 980. We chose these projects because they are
representative of open source projects generally. Each
participant had developed software for more than three years.
Six of the nine participants had used CVS for more than three
years; the other three participants had used it for between one
and three years.
We would like to point out that open source developers are
extremely busy people—people who already volunteer
substantial time to their projects. They are quite difficult to
7
recruit. While more participants would have yielded more, and
potentially richer data, we argue that the authenticity of these
users more than makes up for the number of participants.
VI. RESULTS
Overall, participants enjoyed using CodeSaw to investigate
their project's history. When asked, using a 5-point Likert
scale, how easy CodeSaw was to use, participants responded,
on average 1.6 (1 being the most and 5 being the least). Not
including watching a one minute introductory video, 8 of 9
participants said that it took them 10 minutes or less to get
comfortable with CodeSaw, validating our design goal of a
visualization that novices can access quickly. When asked
how often they would use CodeSaw if it were deployed into
their community, 7 of 9 said they would use it on a monthly
basis or at release time. Since many projects go through 5 to
20 releases a year, we feel that this result is positive.
Furthermore, two developers continued to use CodeSaw for
one month after the study. We discovered this when we shut
down the databases that supported their projects. However, we
do not have any concrete data to present as to their
motivations for their continued use.
A. Group Dynamics
Many of the participants reported seeing confirming and
surprising aspects of their community in CodeSaw:
“It was interesting to see the contributions over time in an
easy graphical interface. I am not sure it was surprising, rather
confirming.”
“It gave me a better idea about what the overall community
is doing.”
“I found some surprises - some developers were not
attributed as working on the code I *thought* they were
working on in a given period. Others were not contributing
much code during periods when I thought they should have
been.”
Other participants noted that CodeSaw exposed roles in the
community:
“It confirmed my long-held suspicions about the community.
It was easy to see who was doing the development and who
was doing the commentary. Often they were not the same
people.”
“It accurately reflected the fact that I was a project
manager/PI, not a coder.”
“It was interesting. At first I felt as though I had not
contributed much, but then I realized that I had a 'surrogate'. I
was working closely with another developer who committed the
changes to the code base.”
Two participants that worked on projects with less than 5
developers commented on the loneliness that CodeSaw
engendered:
“I feel a bit lonely. It doesn't reflect the community in a
whole. There's a lot of people passing by in the forums. People
sending bug reports and patches are not taken into account.”
“Viewing/visualizing the [anonymous] traffic on the forums
and the lists would be great.”
The participant behind the first comment above said, “I
don't feel like using it again. As I'm almost the only
contributor, it doesn't make much sense.” The Spatial
Messaging section specifically addresses these feelings of
loneliness.
B. Impact on Motivation
Participants remarked on the incentives CodeSaw provides
to developers:
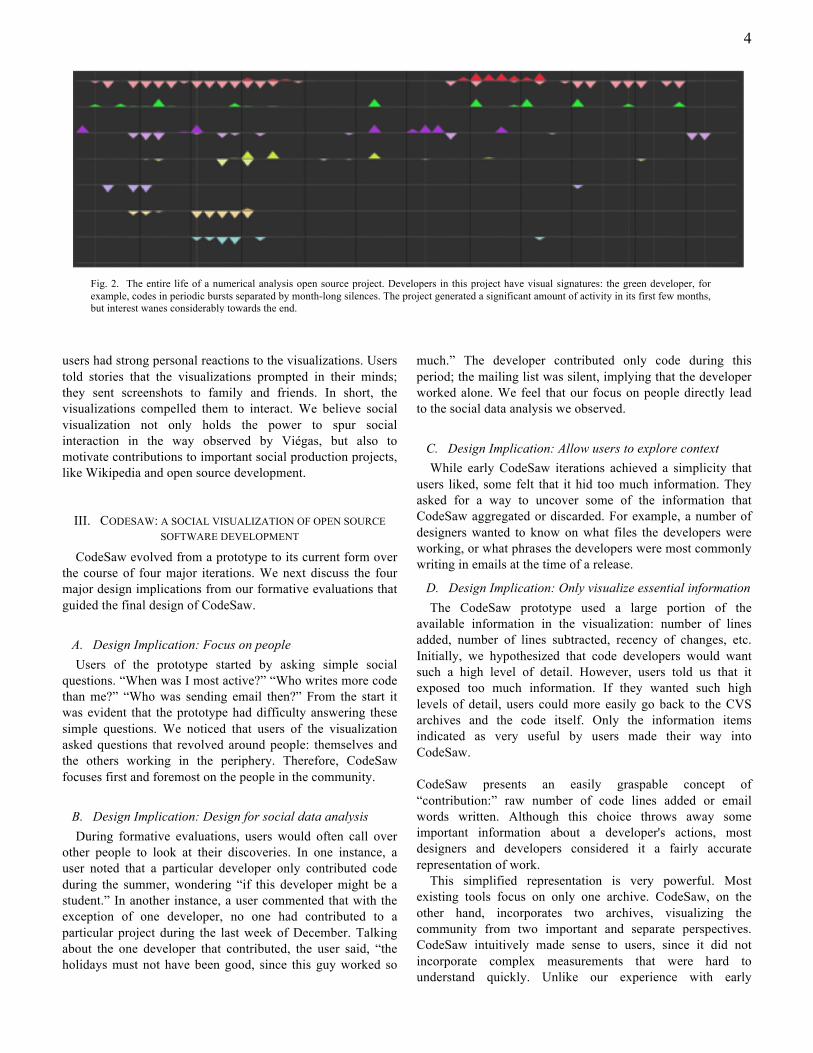
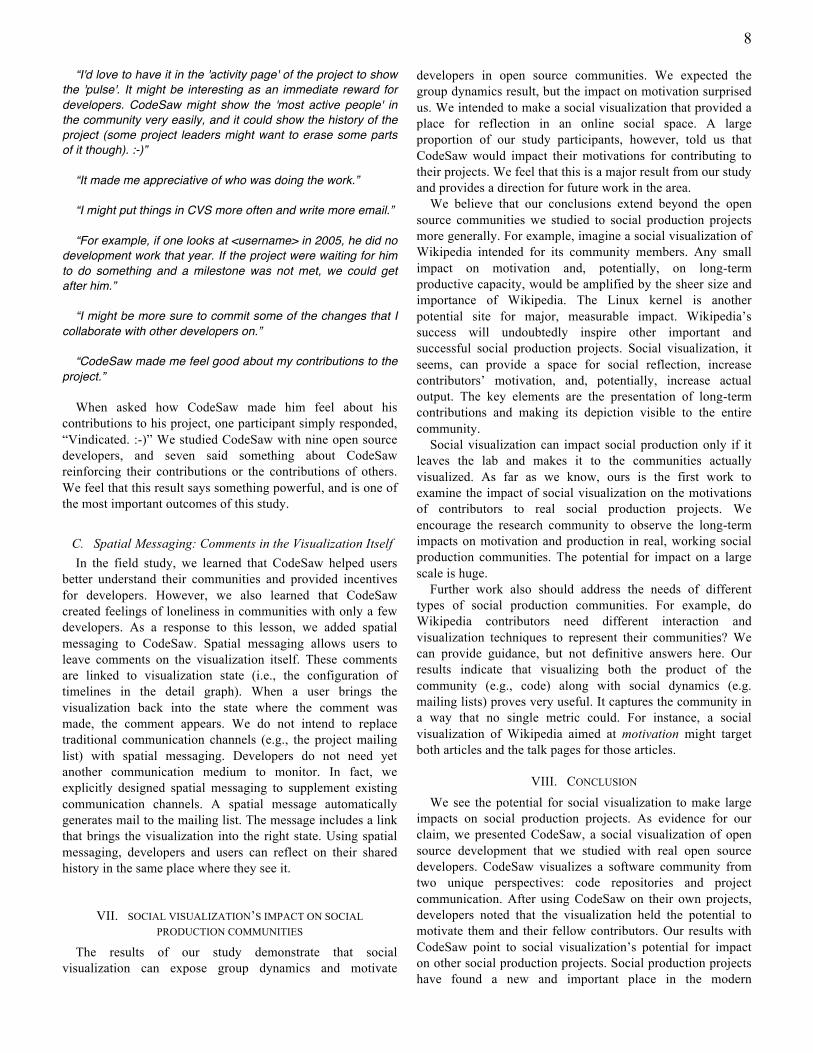
Fig. 4. Three developers’ contributions in context. The progression of
images shows the iterative addition of each developer in the CodeSaw interface. By adding the yellow developer in (b), the mail contributions from (a) nearly disappear. By adding the blue developer in (c), the mail
contributions of both yellow and red shrink further, while red’s code contributions now have more context.
8
“I'd love to have it in the 'activity page' of the project to show
the 'pulse'. It might be interesting as an immediate reward for
developers. CodeSaw might show the 'most active people' in
the community very easily, and it could show the history of the
project (some project leaders might want to erase some parts
of it though). :-)”
“It made me appreciative of who was doing the work.”
“I might put things in CVS more often and write more email.”
“For example, if one looks at <username> in 2005, he did no
development work that year. If the project were waiting for him
to do something and a milestone was not met, we could get
after him.”
“I might be more sure to commit some of the changes that I
collaborate with other developers on.”
“CodeSaw made me feel good about my contributions to the
project.”
When asked how CodeSaw made him feel about his
contributions to his project, one participant simply responded,
“Vindicated. :-)” We studied CodeSaw with nine open source
developers, and seven said something about CodeSaw
reinforcing their contributions or the contributions of others.
We feel that this result says something powerful, and is one of
the most important outcomes of this study.
C. Spatial Messaging: Comments in the Visualization Itself
In the field study, we learned that CodeSaw helped users
better understand their communities and provided incentives
for developers. However, we also learned that CodeSaw
created feelings of loneliness in communities with only a few
developers. As a response to this lesson, we added spatial
messaging to CodeSaw. Spatial messaging allows users to
leave comments on the visualization itself. These comments
are linked to visualization state (i.e., the configuration of
timelines in the detail graph). When a user brings the
visualization back into the state where the comment was
made, the comment appears. We do not intend to replace
traditional communication channels (e.g., the project mailing
list) with spatial messaging. Developers do not need yet
another communication medium to monitor. In fact, we
explicitly designed spatial messaging to supplement existing
communication channels. A spatial message automatically
generates mail to the mailing list. The message includes a link
that brings the visualization into the right state. Using spatial
messaging, developers and users can reflect on their shared
history in the same place where they see it.
VII. SOCIAL VISUALIZATION’S IMPACT ON SOCIAL
PRODUCTION COMMUNITIES
The results of our study demonstrate that social
visualization can expose group dynamics and motivate
developers in open source communities. We expected the
group dynamics result, but the impact on motivation surprised
us. We intended to make a social visualization that provided a
place for reflection in an online social space. A large
proportion of our study participants, however, told us that
CodeSaw would impact their motivations for contributing to
their projects. We feel that this is a major result from our study
and provides a direction for future work in the area.
We believe that our conclusions extend beyond the open
source communities we studied to social production projects
more generally. For example, imagine a social visualization of
Wikipedia intended for its community members. Any small
impact on motivation and, potentially, on long-term
productive capacity, would be amplified by the sheer size and
importance of Wikipedia. The Linux kernel is another
potential site for major, measurable impact. Wikipedia’s
success will undoubtedly inspire other important and
successful social production projects. Social visualization, it
seems, can provide a space for social reflection, increase
contributors’ motivation, and, potentially, increase actual
output. The key elements are the presentation of long-term
contributions and making its depiction visible to the entire
community.
Social visualization can impact social production only if it
leaves the lab and makes it to the communities actually
visualized. As far as we know, ours is the first work to
examine the impact of social visualization on the motivations
of contributors to real social production projects. We
encourage the research community to observe the long-term
impacts on motivation and production in real, working social
production communities. The potential for impact on a large
scale is huge.
Further work also should address the needs of different
types of social production communities. For example, do
Wikipedia contributors need different interaction and
visualization techniques to represent their communities? We
can provide guidance, but not definitive answers here. Our
results indicate that visualizing both the product of the
community (e.g., code) along with social dynamics (e.g.
mailing lists) proves very useful. It captures the community in
a way that no single metric could. For instance, a social
visualization of Wikipedia aimed at motivation might target
both articles and the talk pages for those articles.
VIII. CONCLUSION
We see the potential for social visualization to make large
impacts on social production projects. As evidence for our
claim, we presented CodeSaw, a social visualization of open
source development that we studied with real open source
developers. CodeSaw visualizes a software community from
two unique perspectives: code repositories and project
communication. After using CodeSaw on their own projects,
developers noted that the visualization held the potential to
motivate them and their fellow contributors. Our results with
CodeSaw point to social visualization’s potential for impact
on other social production projects. Social production projects
have found a new and important place in the modern
9
networked information economy; the potential for impact is
immense.
ACKNOWLEDGMENTS
We thank the very busy developers in our study for
donating their time to us. We also thank our group for their
helpful feedback during the design process.
REFERENCES
[1] E. Moglen. Anarchism Triumphant: Free Software and the Death of Copyright. First Monday, 4(8), 1999.
[2] Y. Benkler. The Wealth of Networks: How Social Production
Transforms Markets and Freedom. Yale University Press. 2006. [3] NASA. Clickworkers results. http://clickworkers.arc.nasa.gov/results.
Retrieved May 15, 2007. [4] E. Orgell. More Than 1.1 Million Developers In North America Now
Working On Open Source Projects. 2004.
http://evansdata.com/n2/pr/releases/DPS2004.shtml. Retrieved May 16, 2007.
[5] BBC News. (2005, June 2, 2005). Brazil adopts open-source software.
http://news.bbc.co.uk/1/hi/business/4602325.stm. [6] A. Mockus, R. T. Fielding, & J. D. Herbsleb. Two case studies of open
source software development: Apache and Mozilla. ACM Trans. Softw.
Eng. Methodol., 11(3), 309-346, 2002. [7] J. D. Herbsleb, & R. E. Grinter, R. E. Splitting the organization and
integrating the code: Conway's Law revisited. Paper presented at the
21st Annual Conference on Software Engineering (ICSE 99). 1999. [8] SourceForge.net. http://sourceforge.net. Retrieved May 16, 2007. [9] F. Viégas & M. Wattenberg, M. Many Eyes: A Site for Visualization at
Internet Scale. InfoVis2007. Proceedings of the 2007 IEEE Symposium
on Information Visualization. 2007. [10] M. Osterloh, & B. S. Frey. Motivation, Knowledge Transfer, and
Organizational Forms. Organization Science, 11(5), 538-550, 2000. [11] Y. Benkler. Coase's Penguin,or Linux and the Nature of the Firm. Yale
Law Journal, 112, 2002.
[12] E. L. Deci, R. Koestner, & R. M. Ryan. A Meta-Analytic Review of Experiments Examining the Effects of Extrinsic Rewards on Intrinsic Motivation. Psychological Bulletin, 125(6), 627-668, 1999.
[13] E. Gilbert, & K. Karahalios. CodeSaw: A Social Visualization of Distributed Software Development. Paper presented at INTERACT 2007, 2007.
[14] J. S. Donath. Visual Who: animating the affinities and activities of an electronic community. Paper presented at the third ACM international
conference on Multimedia. 1995.
[15] D. Fisher & P. Dourish. Social and temporal structures in everyday collaboration. Paper presented at the SIGCHI conference on Human
factors in computing systems. 2004.
[16] J. Froehlich & P. Dourish. Unifying Artifacts and Activities in a Visual Tool for Distributed Software Development Teams. Paper presented at the 26th International Conference on Software Engineering. 2004.
[17] Y. E. Medynskiy, N. Ducheneaut, & A. Farahat. Using hybrid networks for the analysis of online software development communities. Paper presented at the SIGCHI conference on Human Factors in computing
systems. 2006. [18] W. Sack, W. Discourse Diagrams: Interface Design for Very Large-
Scale Conversations. Paper presented at the 33rd Hawaii International
Conference on System Sciences-Volume 3, 2000. [19] M. Smith, M. Invisible Crowds in Cyberspace: Measuring and Mapping
the Social Structure of USENET. In Communities in Cyberspace,
Routledge Press. 1999. [20] M. A. Smith & A. T. Fiore. Visualization components for persistent
conversations. Paper presented at the SIGCHI conference on Human
factors in computing systems. 2001. [21] F. B. Viégas, S. Golder, & J. Donath. Visualizing email content:
portraying relationships from conversational histories. Paper presented at the SIGCHI conference on Human Factors in computing systems.
2006. [22] F. B. Viégas, D. H. Nguyen, J. Potter, D. Boyd, & J. S. Donath. Digital
artifacts for remembering and storytelling: PostHistory and social
network fragments. Paper presented at Hawaii International Conference
on System Sciences 2004.
[23] F. B. Viégas, & M. Smith. Newsgroup crowds and authorlines: Visualizing the activity of individuals in conversational cyberspaces. Paper presented at Hawaii International Conference on System Sciences
2004. [24] F. B. Viégas, M. Wattenberg, J. Kriss, & F. van Ham. Talk Before You
Type: Coordination in Wikipedia. Paper presented at Hawaii
International Conference on System Sciences 2007. [25] C. M. Kelty. Free Software/Free Science. First Monday, 6(12). 2001. [26] C. Gutwin, R. Penner, & K. Schneider. Group awareness in distributed
software development. Paper presented at the 2004 ACM conference on
Computer supported cooperative work. 2004. [27] T. D. LaToza, G. Venolia, & R. DeLine. Maintaining mental models: a
study of developer work habits. Paper presented at the 28th international
conference on Software engineering. 2006. [28] R. E. Kraut & L. A. Streeter. Coordination in software development.
Commun. ACM, 38(3), 69-81, 1995. [29] K. Nakakoji, Y. Yamamoto, Y. Nishinaka, K. Kishida, & Y. Ye.
Evolution patterns of open-source software systems and communities.
Paper presented at the International Workshop on Principles of Software Evolution. 2002.
[30] Y. Yamauchi, Y, M. Yokozawa, T. Shinohara, & T. Ishida.
Collaboration with Lean Media: how open-source software succeeds. Paper presented at the 2000 ACM conference on Computer Supported
Cooperative Work. 2000.
[31] J. Singer. Practices of Software Maintenance. Paper presented at the International Conference on Software Maintenance. 1998.
[32] M. J. Baker & S. G. Eick. Space Filling Software Visualization. Paper
presented at the Journal of Visual Languages and Computing. 1995. [33] J. T. Biehl, M. Czerwinski, G. Smith, & G. G. Robertson, G. G.
FASTDash: a visual dashboard for fostering awareness in software
teams. Paper presented at the SIGCHI conference on Human factors in
computing systems. 2007. [34] N. Ducheneaut. Socialization in an Open Source Software Community:
A Socio-Technical Analysis. Comput. Supported Coop. Work, 14(4), 323-368. 2005.
[35] S. G. Eick, J. Steffen, & E. Sumner. Seesoft: A Tool for Visualizing
Line-Oriented Software Statistics. Paper presented at the IEEE
Transactions on Software Engineering. 1992. [36] B. Kerr, L. T. Cheng, & T. Sweeney. Growing bloom: design of a
visualization of project evolution. Paper presented at the CHI '06
extended abstracts on Human factors in computing systems. 2006. [37] K. Karahalios and F. Viégas. Social Visualization: Exploring Text,
Audio, and Video Interaction. Extended Proceedings of ACM Computer-
Human Interaction, 2006. [38] G. Simmel, G. On Individuality and Social Forms. Chicago: The
University of Chicago Press. 1971. [39] W. Whyte. City: Rediscovering the Center. New York: Doubleday.
1988.
[40] J. Heer, F. B. Viégas, & M. Wattenberg. Voyagers and voyeurs: supporting asynchronous collaborative information visualization. Paper presented at the SIGCHI conference on Human factors in computing
systems. 2007.
[41] P. J. Ludford, D. Cosley, D. Frankowski, & L. Terveen. Think different: increasing online community participation using uniqueness and group dissimilarity. Paper presented at the SIGCHI conference on Human
factors in computing systems. 2004. [42] S. Reeves, S. Benford, C. O'Malley, & M. Fraser. Designing the
spectator experience. Paper presented at the SIGCHI conference on
Human factors in computing systems. 2005. [43] M. Wattenberg. Baby names, visualization, and social data analysis.
Paper presented at the Information Visualization, 2005. INFO VIS 05.
Proceedings of the 2005 IEEE Symposium on Information Visualization. [44] T. Erickson & W. A. Kellogg. Social translucence: an approach to
designing systems that support social processes. ACM Trans. Comput.-
Hum. Interact., 7(1), 59-83, 2000. [45] B. A. Nardi, S. Whittaker, E. Isaas, M. Creech, J. Johnson, & J.
Hainsworth. ContactMap: Integrating Communication and Information
Through Visualizing Personal Social Networks. Communications of the
ACM, 2001. [46] F. B. Viégas, M. Wattenberg, & K. Dave. Studying cooperation and
conflict between authors with history flow visualizations. Paper presented at the SIGCHI conference on Human factors in computing
systems. 2004.
10
[47] Gaim. http://gaim.sourceforge.net. Retrieved May 16, 2007. [48] SourceForge.net. http://sourceforge.net/top/mostactive.php?type=week.
Retrieved May 16, 2007. [49] E. R. Tufte. The Visual Display of Quantitative Information: Graphics
Press. 1983.
[50] B. B. Bederson & J. D. Hollan. Pad++: a zooming graphical interface for exploring alternate interface physics. Paper presented at the 7th annual ACM symposium on User interface software and technology. 1994.
Eric Gilbert (M'08) is a third-year PhD candidate in the Department of Computer Science at the University of Illinois at Urbana-Champaign. He
obtained his B.S. in mathand computer science from University of Illinois at Urbana-Champaignin 2001.
He is currently a member of Prof. Karahalios's Social Spaces group at
UIUC. Before attending graduate school, he taught for two years as part of Teach For America Chicago, and built an online science community for high school students as part of Fermi National Accelerator Laboratory. His current
research interests include social media, visualization and the places where the two intersect.
Mr. Gilbert is also a member of ACM and ACM SIGCHI. He recently won
the Best Paper award at CHI 2008 for his empirical work on rural social media use.
Karrie Karahalios (M’04) is an assistant professor in the Department of Computer Science at the University of Illinois at Urbana-Champaign where she runs the Social Spaces group. She completed a S.B. (1994) in electrical
engineering, an M.Eng. (1995) in electrical engineering and computer science, and an S.M. (1997) and Ph.D (2004) in media arts and science at the Massachusetts Institute of Technology.
Her work focuses on the interaction between people and the social cues they perceive in networked electronic spaces. Of particular interest are interfaces for pubic online and physical gathering spaces such as chatrooms,
cafes, parks, etc. The goal is to create interfaces that enable users to perceive conversational patterns that are present, but not obvious, in traditional communication interfaces.
Prof. Karahalios is a member of ACM and a committee member for IEEE TableTop 2006-2008. She has received the NSF Career Award, IBM Young Faculty Award, Microsoft Young Faculty Award, and the Microsoft A.
Richard Newton Breakthrough Research Award.