
Experiment Design and Administration for Computer Clusters ...
Upload
burak-himmetogluCategory
view
38download
0
Things you can do with R (+RStudio)
Computational (base R + libraries)• Statistics • Simulations • Data Analysis • Predictive analysis, machine learning • …
All other cool stuff (RStudio)• Projects (R packages, Github, …) • Web pages, presentations (Knitr, …) • Web applications (Shiny,…) • …

Question: My R solution is taking too long on my computer, what can I do?
Possible answers:
• Use specialized packages for performance 😀 • Try simple (shared memory) parallel tools 😀 • Run your R code in a remote cluster 😀/😐
• Large datasets that don’t fit your computer’s memory • Divide and Conquer
• Try (distributed memory) parallelism, or Hadoop solutions 😬/😱
• Write C/C++ extensions for R 😬/😱

R on a remote computer cluster
• Almost all computer clusters run Linux 😎/😩• You can’t use RStudio interactively on a cluster 😩• Need to be submitted to a queuing system 😕
• Fire and forget: Submit many calculations! • Access to a large memory (> 40 GB, up to 1 TB)
Possible drawbacks
Advantages

Examples in this seminar
If you have an account on Knot:export PATH=“/sw/csc/R-3.2.3/bin:$PATH”
Download the exercises from the command line:svn checkout https://github.com/bhimmetoglu/talks-and-
lectures/trunk/CSC-UCSB
All exercises are online:https://github.com/bhimmetoglu/talks-and-lectures
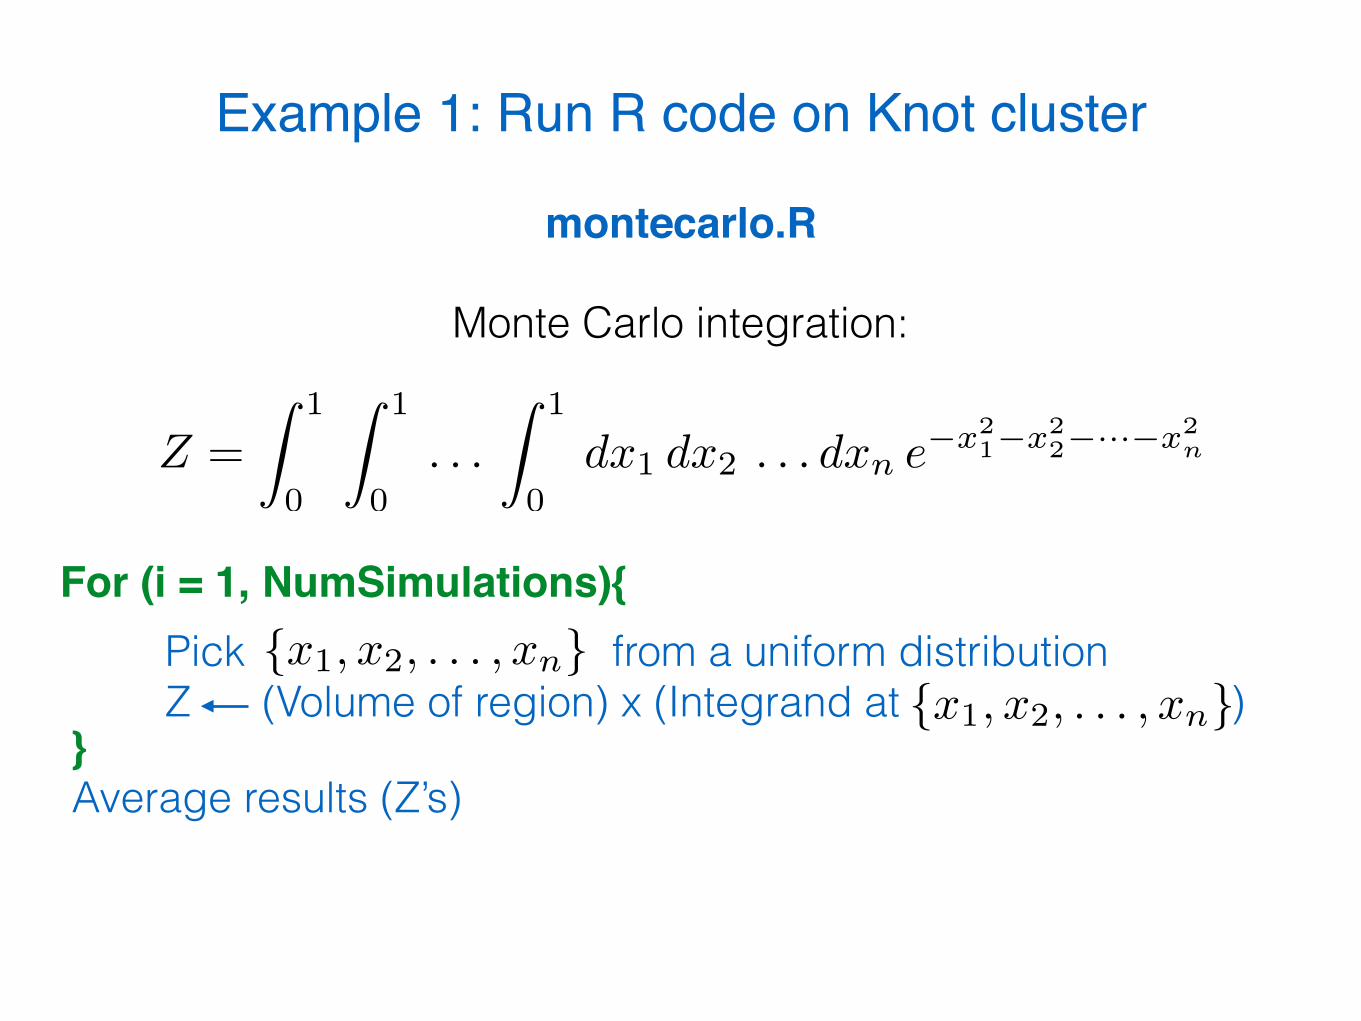
Example 1: Run R code on Knot cluster
Z =
Z 1
0
Z 1
0. . .
Z 1
0dx1 dx2 . . . dx
n
e
�x
21�x
22�···�x
2n
Monte Carlo integration:
Pick from a uniform distribution Z (Volume of region) x (Integrand at ){x1, x2, . . . , xn}
For (i = 1, NumSimulations){
}Average results (Z’s)
montecarlo.R
{x1, x2, . . . , xn}

Example 1: Run R code on Knot cluster• Remember: No RStudio to experiment with! • Make sure that your R code runs from start to end • Perform tests on your computer first
#!/bin/bash #PBS -l nodes=1:ppn=12 #PBS -l walltime=01:00:00 #PBS -N MonteCarlo #PBS -V
cd $PBS_O_WORKDIR
Rscript --vanilla montecarlo.R > output
A simple script (text file) can be used to submit to the queue:
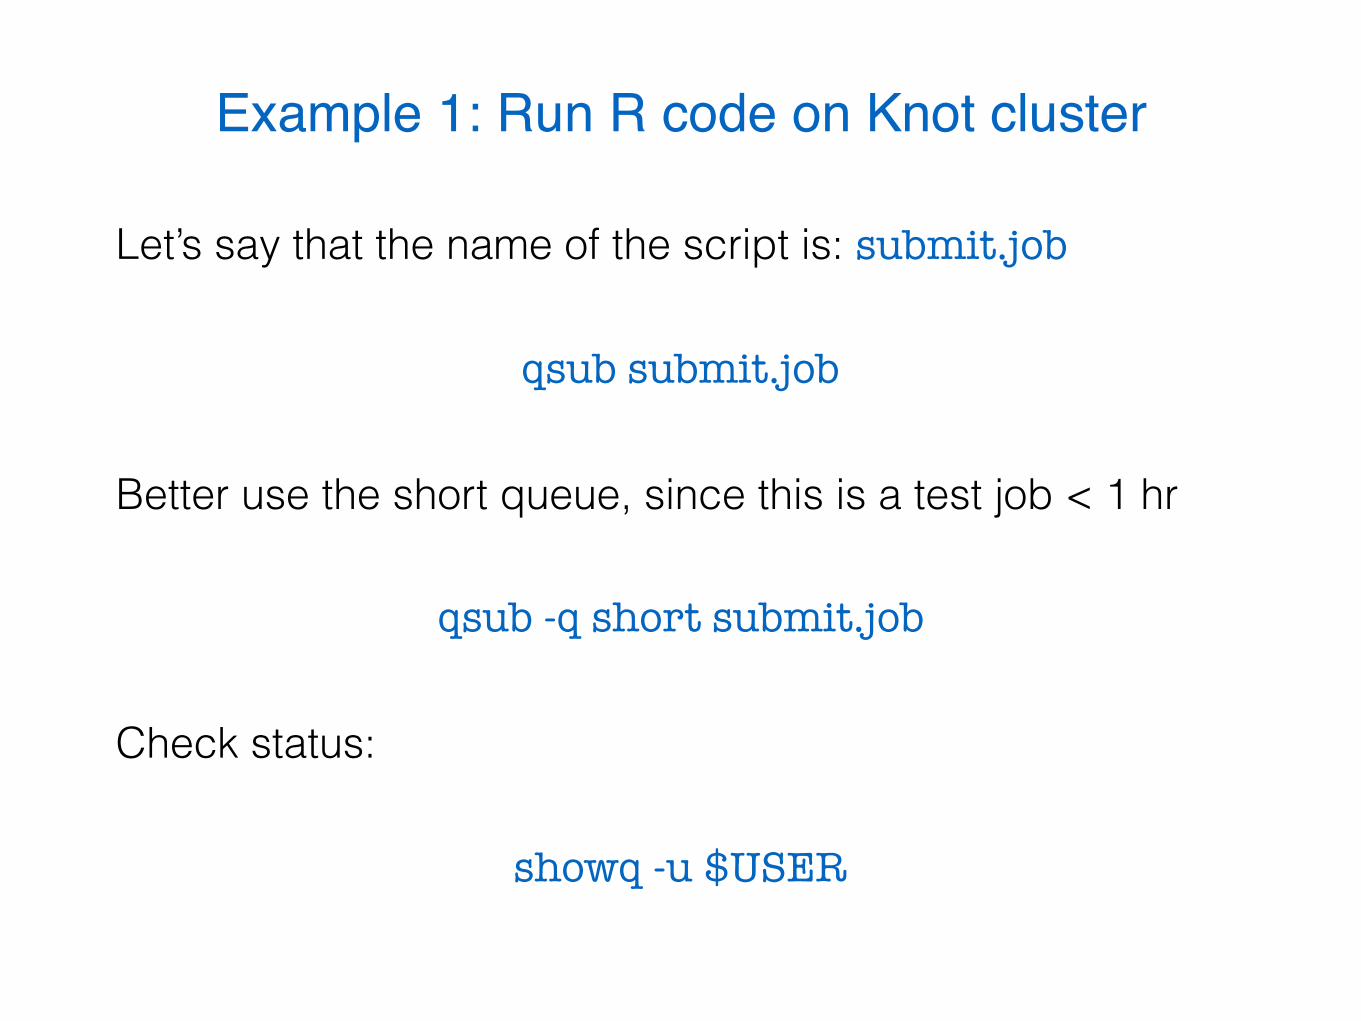
Example 1: Run R code on Knot cluster
qsub submit.job
Let’s say that the name of the script is: submit.job
Better use the short queue, since this is a test job < 1 hr
qsub -q short submit.job
Check status:
showq -u $USER
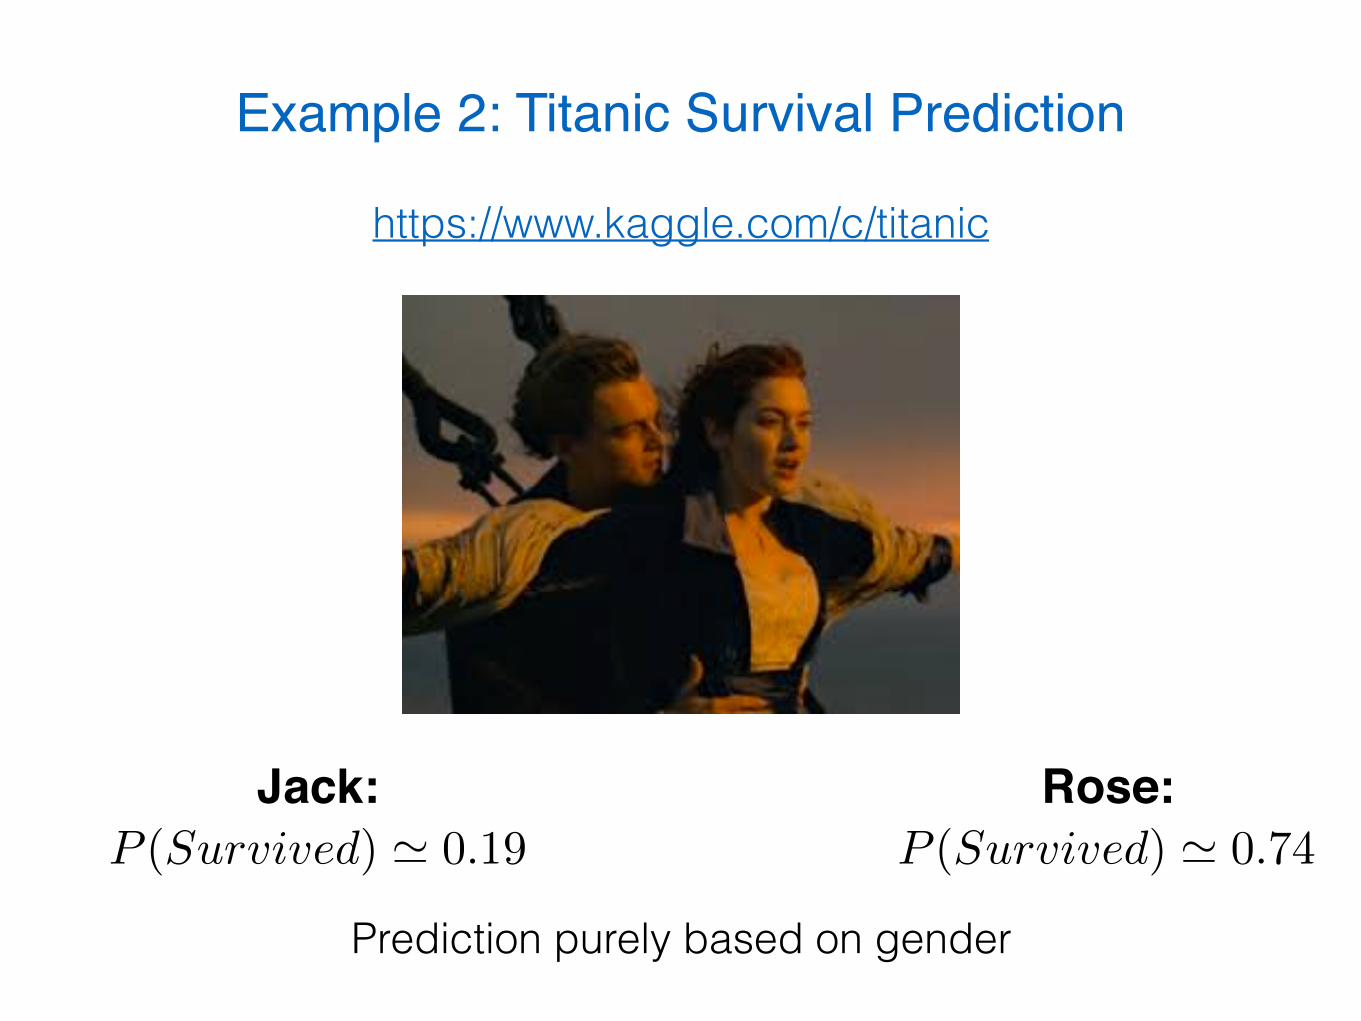
Example 2: Titanic Survival Prediction
P (Survived) ' 0.74P (Survived) ' 0.19Jack: Rose:
Prediction purely based on gender
https://www.kaggle.com/c/titanic
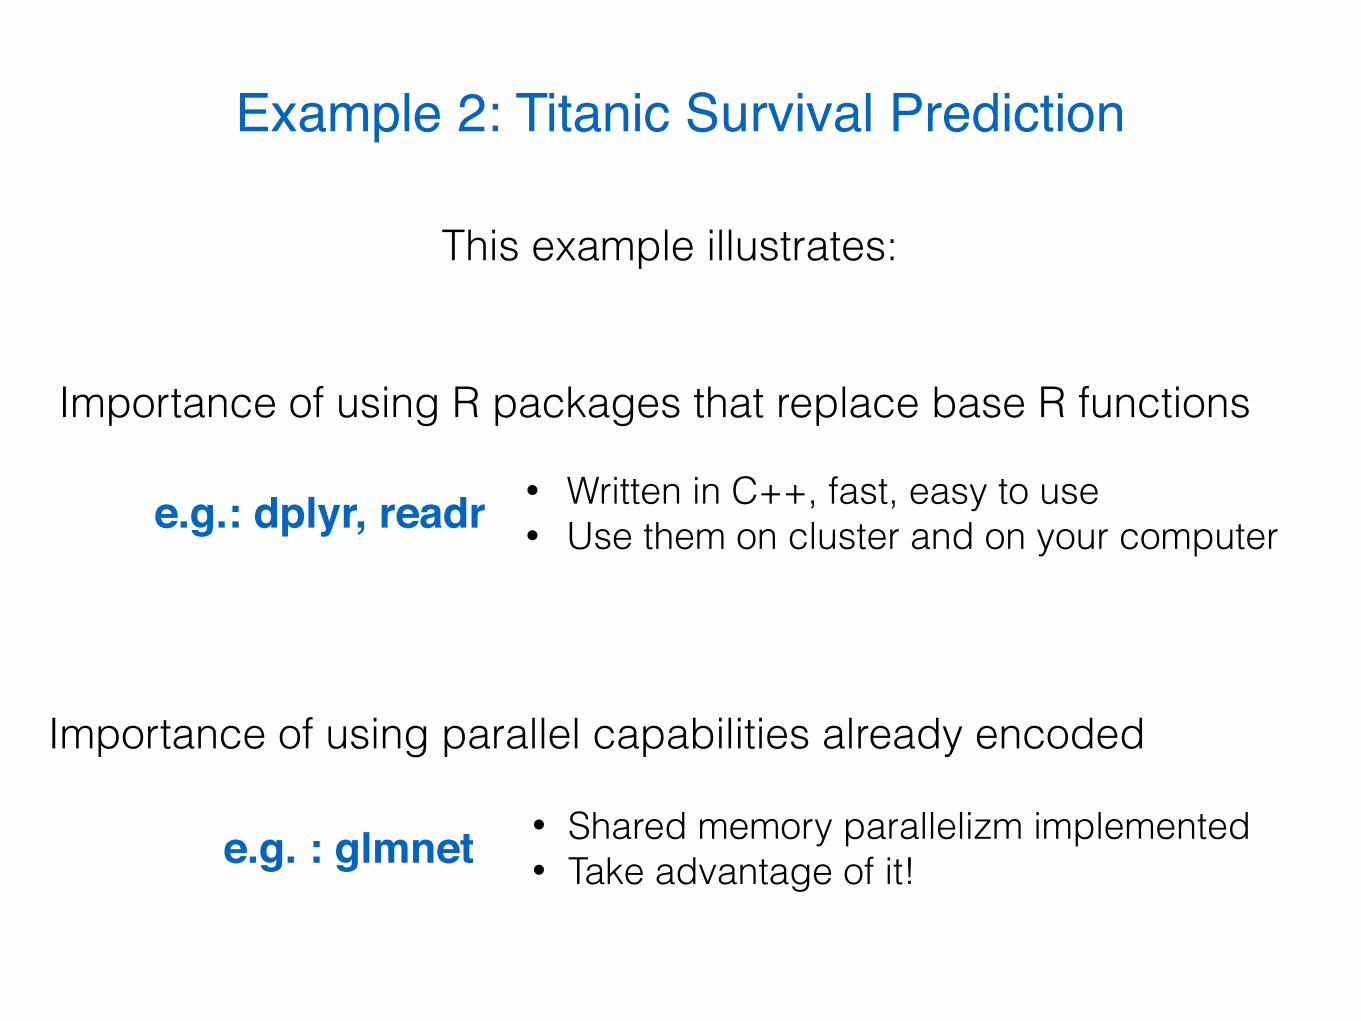
Example 2: Titanic Survival Prediction
Importance of using R packages that replace base R functions
e.g.: dplyr, readr • Written in C++, fast, easy to use • Use them on cluster and on your computer
Importance of using parallel capabilities already encoded
e.g. : glmnet • Shared memory parallelizm implemented • Take advantage of it!
This example illustrates:

Why dplyr?Proportion of survived passengers by gender
P_Surv_M <- sum(train[train$Sex == "male",]$Survived)/length(train[train$Sex == "male"])
P_Surv_F <- sum(train[train$Sex == "female",]$Survived)/length(train[train$Sex == "female"])
Base R way:
dplyr way:
train %>% group_by(Sex) %>% summarize(survivalRate = sum(Survived == TRUE)/n() )
• Intuitive • Efficient and fast • Less memory • Complicated chain of tasks in a simple line of code

Why dplyr?

Model Matrices• We need to convert all factor variables into numeric ones • In general, values cannot be compared • E.g. States in U.S, Gender, City etc.
Id Pclass Age
1 1 45
2 2 50
3 2 22
4 3 18
5 1 65
6 2 34
Id Pclass2 Pcalss3 Age
1 0 0 45
2 1 0 50
3 1 0 22
4 0 1 18
5 0 0 65
6 1 0 34
model.matrix() sparse.model.matrix()

Logistic Regression
ypred, i =1
1 + e�zizi = �0 + �T
1 · xi
• Linear model for classification
Survived
X0
1
Survived
X0
1
1/2

• Parameters optimized to yield small error • Overfitting problem: LASSO and Ridge regression • by cross-validation (parallel part in glmnet)
Logistic Regression (Regularization)
�0,�1
↵,�
min�0,�
1
N
NX
i=1
l(yi,�0 + �
Txi) + �
⇥(1� ↵)||�||22/2 + ↵||�||1
⇤
This is the optimization problem:
# Functions to use: cv.glmnet() # Determines by cross-validation glmnet() # Determines by optimization
�
�0,�1
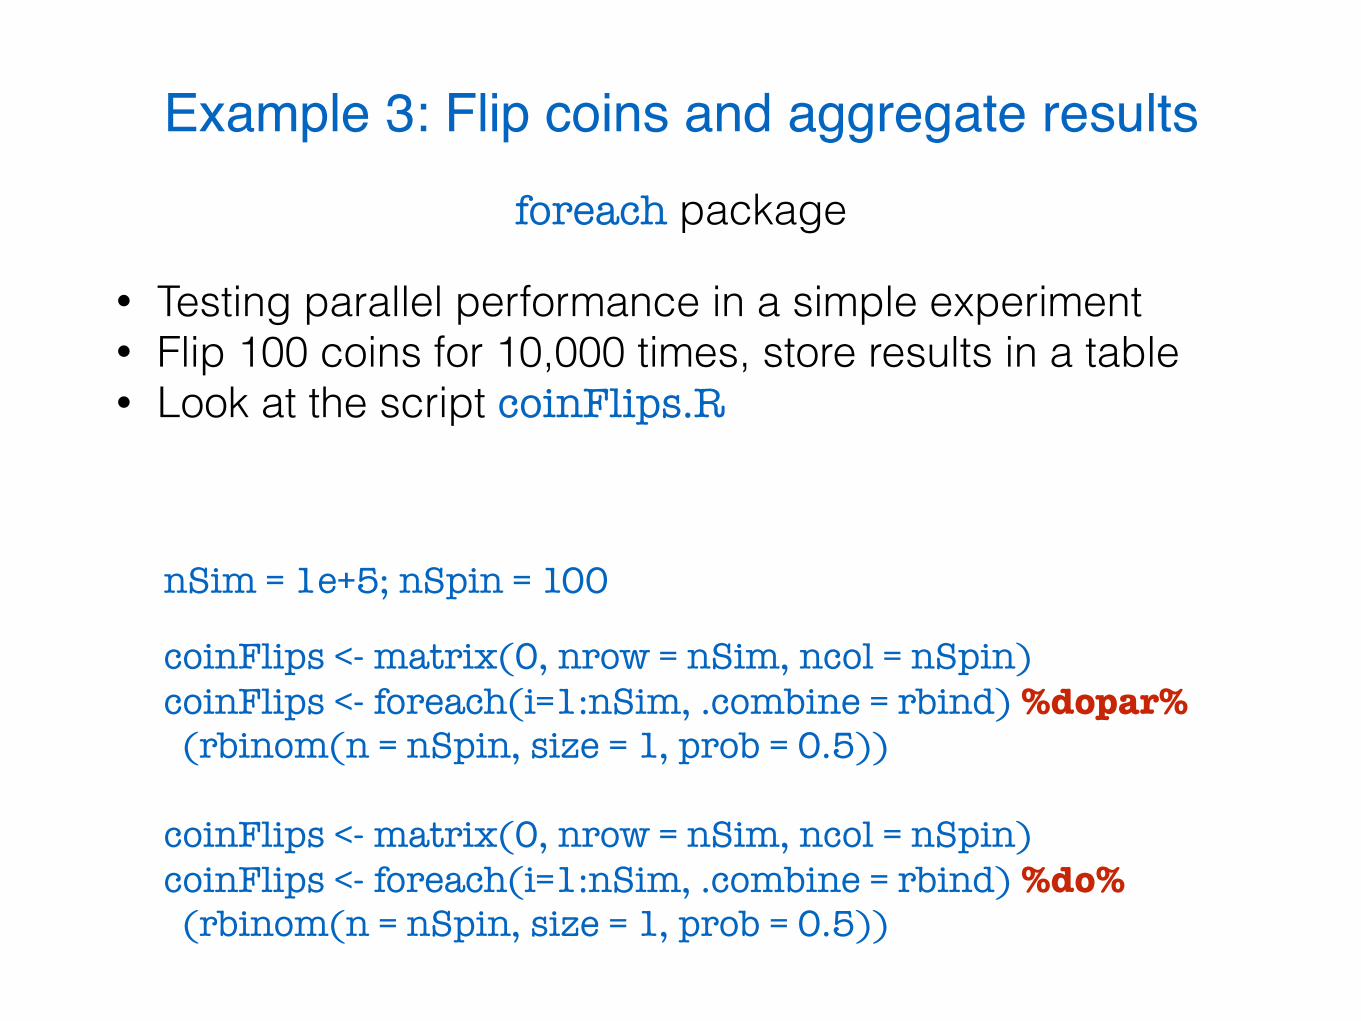
Example 3: Flip coins and aggregate results
• Testing parallel performance in a simple experiment • Flip 100 coins for 10,000 times, store results in a table • Look at the script coinFlips.R
foreach package
coinFlips <- matrix(0, nrow = nSim, ncol = nSpin) coinFlips <- foreach(i=1:nSim, .combine = rbind) %dopar% (rbinom(n = nSpin, size = 1, prob = 0.5))
coinFlips <- matrix(0, nrow = nSim, ncol = nSpin) coinFlips <- foreach(i=1:nSim, .combine = rbind) %do% (rbinom(n = nSpin, size = 1, prob = 0.5))
nSim = 1e+5; nSpin = 100

More Exercises
Compare the timing in the scripts:
1. montecarlo.R 2. montecarloSer.R 3. montecarloPar.R
Which one runs the fastest and why?
Resources for learning R
• swirl package • Coursera : https://www.coursera.org/learn/r-programming • LeanPub: https://leanpub.com/rprogramming • Lynda : Up and Running with R
Introduction to Statistical Learningwith applications in R
http://www-bcf.usc.edu/~gareth/ISL/
Resources for high performance computing with R
• Rcpp • data.table • snow, Rmpi • H2O • RHadoop • Rhipe • …
https://cran.r-project.org/web/views/HighPerformanceComputing.html
Packages: