Using PI ProcessBook
225
Copyright © OSIsoft, Inc Version 4.6 Using PI ProcessBook The Visuals
-
Upload
giacomo-birney -
Category
Documents
-
view
251 -
download
18
description
Using PI ProcessBook. The Visuals. Introductions. Instructor Students Tell us about your PI System What is your role with PI? What skills do you need to learn?. Course Overview. Length: 1 day Interactive course: Theory 50% Exercises and examples 50%. Objectives. - PowerPoint PPT Presentation
Transcript of Using PI ProcessBook

Copyright © OSIsoft, Inc
Version 4.6
Using PI ProcessBook
The Visuals

Copyright © OSIsoft, Inc
Introductions
Instructor Students
Tell us about your PI System What is your role with PI? What skills do you need to learn?
2

Copyright © OSIsoft, Inc
Course Overview
Length: 1 day Interactive course:
Theory 50% Exercises and examples 50%
3

Copyright © OSIsoft, Inc
Objectives
Understand the fundamentals of PI technology Learn to access data in the PI server Become familiar with the use of PI
ProcessBook
Please ask questions as they arise!
4

Copyright © OSIsoft, Inc
Course Content
Introduction to PI Common Dialog Windows PI Tags Data Flow PI Time Format PI ProcessBook
5

Copyright © 2008 OSIsoft, Inc
1.0 Introduction to PI

Copyright © OSIsoft, Inc
OSIsoft is a Trusted Partner
> $188M Revenues Over 20% reinvested in R&D Approaching 50% revenue from outside N. America
25+ Year History Founded 1980, ~630 professionals HQ San Leandro, CA
Recognized Global Leader Dominant market position across
industries
Recognized
Experienced
Knowledgeable
14,000+ Customer Installations 40% of Fortune 1000 process and
manufacturing companies use the PI System 65% of Global 500 process and manufacturing
companies use the PI System
Strategic Partnerships Microsoft, SAP, Cisco, Intel Rockwell, Emerson
14,000+ Customers,110+ countries
7

Copyright © OSIsoft, Inc
Calgary, Alberta
San Leandro, CA
Phoenix, AZ
Houston and Longview,TX
Frankfurt, Germany
Perth, Australia
Sydney, Australia
Singapore
São Paulo, Brazil
Tokyo, Japan
Manama, Bahrain
Beijing, China Montréal, Québec
Philadelphia, PA
Cleveland, OH
Johnson City, TN
Savannah, GA
OSIsoft Offices
Naucalpan, México
KwaZulu, Natal, South Africa
New Plymouth, New Zealand
Moscow, Russia
Shanghai, China
Czech Republic
Madrid, Spain
Paris, France
Global Presence
Copyright © 2010 OSIsoft, LLC
1.0 PI Basics
9

Copyright © 2010 OSIsoft, LLC
1.1 What is a PI System?

Copyright © OSIsoft, Inc
The PI System 2010
11
PI System 2010
Virtualization
High availability
Windows integrated security
Real-time Interfaces
PI Server
PI Asset Framework PI Archives
PI Notifications PI Analytics
PE Totalizer PI ACE
64-bit product
IT DataIT MONITOR
Custom DataAPIs / SDKs
Relational Data OLEDB / ODBC
SQL SERVER / ORACLE
Web ServicesSOA / EXTERNAL DATA
LEGACY APPS
Real-Time DataDCS / PLC / SCADA / OPC
HISTORIANS / INTERFACES

Copyright © OSIsoft, Inc
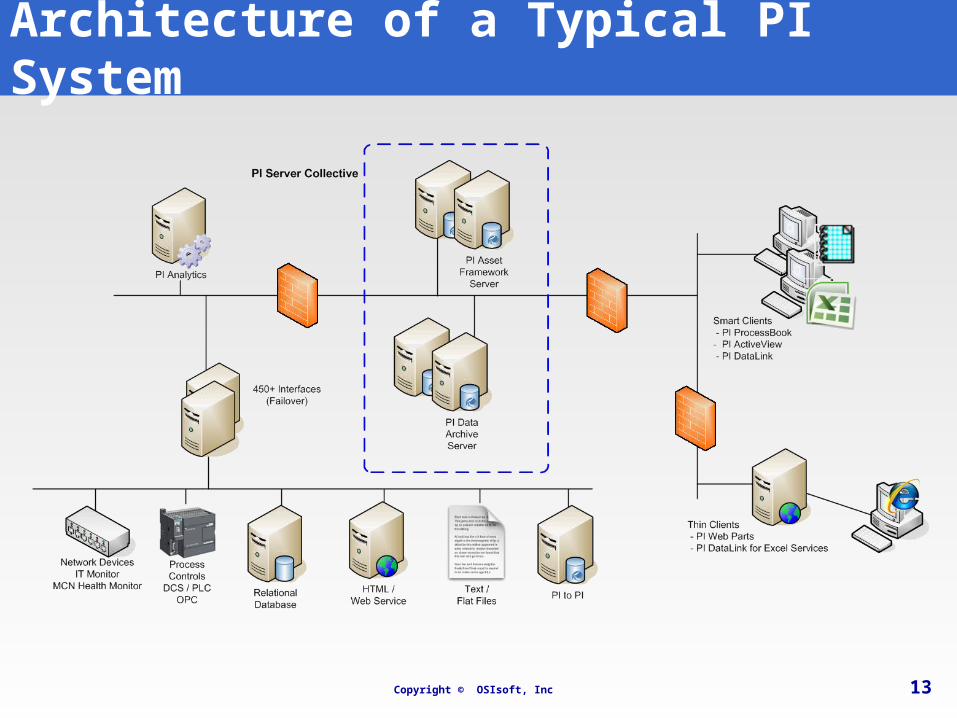
Basic Parts
12
Interface Node
PI Server
`
Client PC
Data Source
Copyright © OSIsoft, Inc
Architecture of a Typical PI System
13

Copyright © 2010 OSIsoft, LLC
1.2 PI Tags
14

Copyright © OSIsoft, Inc
What is a PI Tag?
It is a unique storage point for data in the PI system. It is simply a single point of measurement.
15
Examples A flow rate from a flowmeter A controller’s mode of operation The batch number of a product Text comments from an operator The results of a totalizer or calculation

Copyright © OSIsoft, Inc
PI Tag Attributes
Each PI Tag has a set of attributes for: Describing the tag to a User/Client Application
o “How is the information displayed?” Describing the tag to the Control System Interface
o “How is the information found?” Describing the tag to the PI Server
o “How is the information stored?”
16

Copyright © OSIsoft, Inc
PI Tag Attributes – Display
Tag name: unique name of the PI point Descriptor: PI tag description EngUnits: Engineering units PointType: type of variable stored Zero, Span and Typical value: minimum, range
and typical values Point source: allows grouping of PI tags by data
interface (DCS,PLC, or other sources)
17

Copyright © 2008 OSIsoft, Inc
1.2 Data Flow

Copyright © OSIsoft, Inc
Data Tests
Every value can go through 2 data screeningtests before being archived:
Exception Test “Send only significant changes in data to the
server”
Compression Test“Store only data needed to reliably represent
process behavior”
19

Copyright © OSIsoft, Inc 20
Data Flow
New Value (scan or
exception based)
Exception Test Snapshot
PI Compression Algorithm
PI Archives
Data acquisition node
PI server

Copyright © OSIsoft, Inc
Raw Data - Example
Raw values scanned on the data source. Without Exception and Compression tests, these
would all be archived
Time
Tem
per
atu
re
21

Copyright © OSIsoft, Inc
Exception Test (Interface Level)
Exception Test:
ExcMax (time)
+ ExcDev
- ExcDevCurrent Snapshot
• New values outside the box violate the Exception test.
• The Exception Test is performed by the interface• When a value violates the Exception test, this value
and the previous one are sent to the PI Server.
22

Copyright © OSIsoft, Inc
Exception Test
When a value passes this test, that value and the previous value are reported. Why? To have a better representation of the actual tag behavior
Snapshot value
+/- ExcDev
Trend if previous value
is not sent
Previous value
Trend if previous
value is sent
Tem
per
atu
re
Time
passes the exception test
23

Copyright © OSIsoft, Inc
Exception Test - Example
Time
Tem
per
atu
re
P
E
P
P
P
E
E
E
EE
E E
E E
E: Exception P: Previous
E
24

Copyright © OSIsoft, Inc
Exception Test - Results
Time
Tem
per
atu
re
Successive values sent to the PI Server.When a value is sent, it becomes the new snapshot.
25

Copyright © OSIsoft, Inc
Directed Exercise
Time Value Snapshot Time Current Snapshot
10:00:00 70.3 10:00:00 70.3
10:01:00 67.1
10:02:00 71.4
10:03:00 70.1
10:04:00 68.2
10:05:00 66.0
10:06:00 65.8
10:07:00 64.2
10:08:00 60.0
10:09:00 63.1
Consider the following parameters: ExcDevPercent: 2 Span; 200 ExcMax: 180
The current snapshot value and timestamp are: 70.3 10:00:00
Which pass the exception test (not including previous values):
26

Copyright © OSIsoft, Inc
Turning Off Exception?
Behavior of ExcDev = 0, ExcMax = 0, is that Exception Test is turned off All values are sent to PI. This will increase the traffic between the data
collection node and the server.
27

Copyright © OSIsoft, Inc
Compression Test (PI Server)
Compression Test:
Last archived value
• If a value between the last archive event and the current snapshot is outside the box, the current snapshot violates the compression test. In this case, the value previous to the current snapshot will be archived.
• The Compression Test is done by the PI Server• Compression can be turned off with the Compressing attribute
+ CompDev
- CompDev
Currentsnapshot
< CompMax (s)
28

Copyright © OSIsoft, Inc
Compression Test – Example
Time
Tem
per
atu
re
A: Archived Value
A A
A
AA
A
A
The compression algorithm is performed on new snapshots to determine which data is kept in the PI archives
29

Copyright © OSIsoft, Inc
Compression Results
Time
Tem
per
atu
re
When the user requests a tag-time for which the value is interpolated, the difference can be no greater than
±CompDev
Values kept in the PI archives
30

Copyright © OSIsoft, Inc
Compression Results
After CompressionressionAfter ExceptionRaw values scanned
Tem
per
atu
re
Time
31

Copyright © OSIsoft, Inc
Turning Off Compression?
Behavior of Compression Compressing set to Off: all exceptions are archived
(no compression) Better Compressing set to ON, CompDev set to 0:
successive identical values (or values aligning perfectly) are not archived. This is much more efficient
32

Copyright © OSIsoft, Inc
Data Flow
The exception and compression specifications should be adjusted to achieve efficient archive storage without losing significant data.
Disk space and Performance vs Data accuracy
33

Copyright © OSIsoft, Inc
Exception and Compression Attributes
Each PI Tag can be individually configured for its exception reporting and compression
Exception ReportingAttributes
CompressionAttributes
ExcDev or ExcDevPercent
ExcMax ExcMin
CompDev or CompDevpercent
CompMax CompMin Compressing
34

Copyright © OSIsoft, Inc
Recommended Data Compression Specifications
Set the Compression Deviation to the minimum change that is measurable by the instrument.
Set the Exception Deviation to ½ of the compression deviation
Note: these are starting point recommendations.
Note: ExcMin, ExcMax, CompMin and CompMax are in SECONDS
35
Copyright © 2008 OSIsoft, Inc
1.3 PI Time Format

Copyright © OSIsoft, Inc
PI Time Format
Absolute (a specific point in time) * : (NOW) t : 00:00:00 on the current day (TODAY) 18-feb-05 16:00:00
Relative (time is offset from another time) +8h : + 8 hours
Combined t+8h : today + 8 hours
37

Copyright © OSIsoft, Inc
Absolute Time
dd-mmm-yy HH:mm:ss.00000dd Daymmm Month (Jan, Feb, Mar, Apr, May, …)yy YearHH Hours in 24 hour formatmm Minutesss Seconds00000 Milliseconds
Example:
18-feb-05 10:43:29.323
38

Copyright © OSIsoft, Inc
Absolute Time
dd-mmm-yy HH:mm:ss
"Date" fields default to the current date"Time" fields default to 00.
Expression Meaning
25 00:00:00 on the 25th of the current month
25-Aug-03 00:00:00 on that date
8: 08:00:00 on the current date
25 8 08:00:00 on the 25th of the current month
21:30:01.02 9:30:01.0200 PM on the current date
39

Copyright © OSIsoft, Inc
Absolute Time – Other Formats
Symbol Meaning
* Current time
t 00:00:00 on the current day (TODAY)
y 00:00:00 on the previous day (YESTERDAY)
Monday, Tuesday, Wednesday, Thursday, Friday, Saturday. Sunday
00:00:00 on the most recent of that day of the week
Absolute time formats
40

Copyright © OSIsoft, Inc
Relative Time
Syntax Meaning
+2d + two days
-1.5h - One hour and a half
+32m + 32 minutes
-15 s - 15 seconds
Number of: Hours (h) Minutes (m) Seconds (s)
Leading sign (+ or -) is required. No default time unit: must specify d, h, m, s, w, mo, or y Can use fractions only for Hours, Minutes and Seconds
+2.5h, -0.5m Relative time is most often part of a Combined time
Years (y) Months (mo)
Weeks (w) Days (d)
41

Copyright © OSIsoft, Inc
Combined Formats
Syntax Meaning
*-8h 8 hours ago
T-7d 00:00:00, 7 days ago
Y+11h Yesterday at 11:00:00 AM
Monday + 14.5h 02:30:00 PM on the most recent Monday
Uses both an absolute and a relative time The absolute part of the time can be *, T, Y, or a day of
the week
42

Copyright © OSIsoft, Inc
Directed Exercise
PI Time Express the following timestamps using the absolute time
format: Tuesday-2d 1 6: y+8h *-30m
Express the following times in valid PI timestamps: Today at 6:00 AM The 4th of the current month at 16:00 12 hours ago
43

Copyright © OSIsoft, Inc
What are the two filtering tests that each event that is read on the data source can go through before being archived in the PI Server?
Which of the following are invalid PI times? a. 4 6 d. y-1y
b. 22 22: e. *-Monday
c. t-1.5d f. 09-Jun-06 22:45:35.0943
Group Recap Question (optional)
44

Copyright © 2008 OSIsoft, Inc
2.0 Common Dialog Windows

Copyright © OSIsoft, Inc
PI Connection Manager Viewing Connection Information
Use the check boxes to connect / disconnect from the available PI servers
Connection settings
Connection information
46

Copyright © OSIsoft, Inc
PI Connection Manager Editing Connection Settings
The connection settings can de edited
Click the Save button to apply the changes
To change the default PI server, select Tools > Options
47
Copyright © OSIsoft, Inc
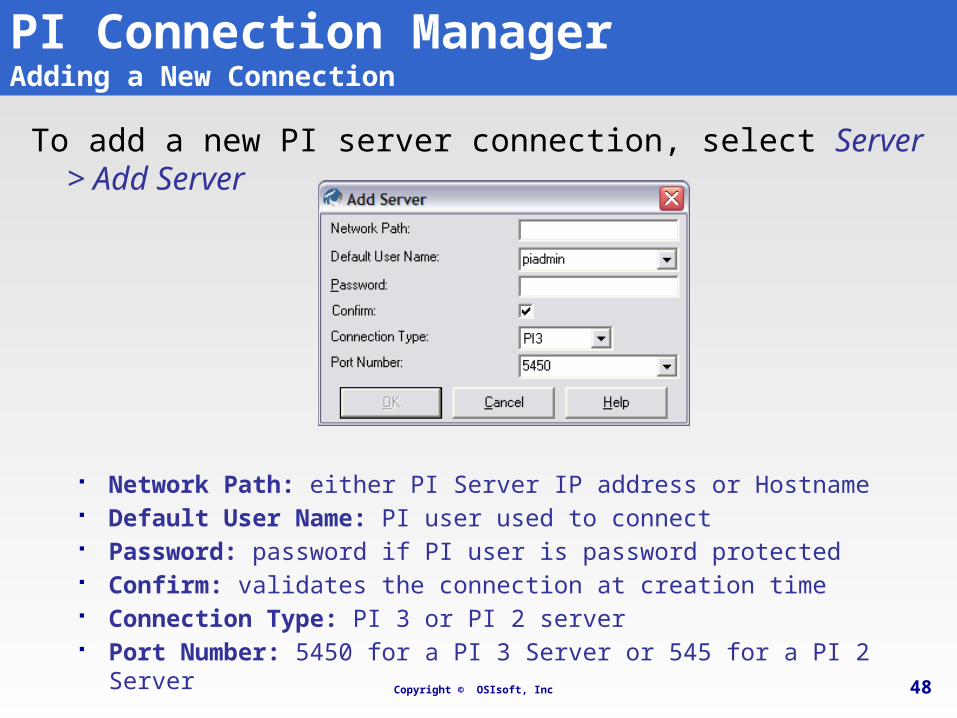
PI Connection Manager Adding a New Connection
To add a new PI server connection, select Server > Add Server
Network Path: either PI Server IP address or Hostname Default User Name: PI user used to connect Password: password if PI user is password protected Confirm: validates the connection at creation time Connection Type: PI 3 or PI 2 server Port Number: 5450 for a PI 3 Server or 545 for a PI 2 Server
48

Copyright © OSIsoft, Inc
PI Connection ManagerChanging Passwords
A PI user can change is own password from the PI Connection Manager Select Tools > Change Password
49

Copyright © OSIsoft, Inc
Directed Exercise
Connecting to PI:• Learn about connecting to PI with the PI SDK• Discover the IP address and computer name of your
PI Server
50

Copyright © OSIsoft, Inc
Tag Search Window – Basic Search
51
Start searching according to the
criteria
Display the attributes/values for selected
tags
Tag search results
Look for a specific value/status/attrib
ute
Look for a specific point
type/class/source
Tag name mask
Select PI Server(s) to
search through
Validate selectio
n

Copyright © OSIsoft, Inc
Tag Search Strategies
Tag Search using wildcards: Use * to replace any number of charactersExample: flow* = flow_meter1, flow_meter2, flow_meter3
Use ? to replace one character Example: tank?_level = tankA_level, tankB_level
Note 1: Search criteria are not case sensitive
Note 2: Search criteria can be combined Example: Look for Tag Mask = flow* and Point Source = o
52

Copyright © OSIsoft, Inc
Tag Search Window – Advanced Search
53
SQL-like query based on user-defined conditions
1- Define condition2- Click 'Add'…3- Click 'Search

Copyright © OSIsoft, Inc
Tag Search Window – Alias Search
54
Search through aliases in the PI ModuleDB (described later)

Copyright © OSIsoft, Inc
Tag Information Windows
55
Pt. Attr... Pt. Values...

Copyright © OSIsoft, Inc
Directed Exercise – Searching for tags
Tag Mask: BA*
Tag Mask: *158*
Descriptor: *end*
Advanced Search:
PIpoint.Span > 100 AND
PIpoint.CompDevPercent > 1
Save this search as a favorite.
56

Copyright © OSIsoft, Inc
What information needs to be specified when creating a new connection to a PI server?
What are the two wildcard characters available in a tag search?
Group Recap Question (optional)
57

Copyright © 2008 OSIsoft, Inc
3.0 PI ProcessBook

Copyright © 2008 OSIsoft, Inc
Objectives Learn how to use workbooks Learn how to visualize process information Be able to create workbooks and displays Be able to use PI calculation and ODBC data sets Be able to use AF data set
PI ProcessBook
59

Copyright © 2008 OSIsoft, Inc
3.1 What is PI ProcessBook?

Copyright © OSIsoft, Inc
What is PI ProcessBook?
Standalone software that allows users to create dynamic, interactive graphical displays featuring real-time PI and non-PI data.
Displays can show: Schematic or realistic process flow diagrams Values Trends and plots And more
PI ProcessBook also includes Visual Basic for Application (VBA) as a development environment Users can write scripts to automate displays and trends,
such as alarm scripts or flashing alarm indicators.
61

Copyright © OSIsoft, Inc
Standard Windows Structure
PI ProcessBook uses a standard Windows type environment that make functions accessible from: Menus Toolbars
62

Copyright © OSIsoft, Inc
File Menu
63
Standard File menu functions and manage PI Server connections

Copyright © OSIsoft, Inc
Edit and View Menus
64
Standard Edit menu functions, formatting symbols, configure display appearance and behavior and modify symbols behaviors
Change the appearance of the ProcessBook, manage toolbars, zoom in/out, manage layers, modify the time range, add trend cursors and more

Copyright © OSIsoft, Inc
Insert and Tools Menus
65
Add elements in the ProcessBook (Workbook)
Change Mode, perform Tag Search and show point attributes, configure Data sets, use and create macro, manager add-in and configure PI ProcessBook and add-in behaviors

Copyright © OSIsoft, Inc
Draw and Arrange Menus
66
Position, stack and group symbols
Add static and dynamic symbols

Copyright © OSIsoft, Inc
Window and Help Menu
67
Navigation among many opened windows
Access to PI ProcessBook User Guide, the VBA Reference language and many others

Copyright © OSIsoft, Inc
Main Toolbars
Select toolbars from View >Toolbar menu Used in top of page or as floating palettes
68
Copyright © OSIsoft, Inc
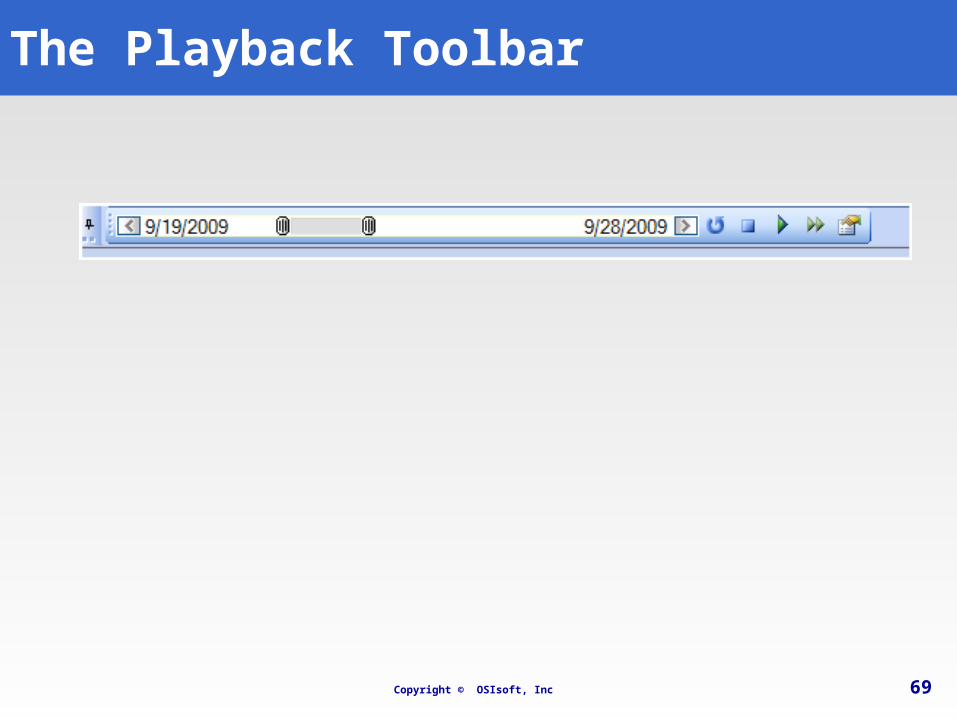
The Playback Toolbar
69

Copyright © OSIsoft, Inc
Toolbar Creation
You can create your own toolbar using any of the buttons on the toolbars or any of the menu options
1. Select View > Toolbars > New
2. Select the Commands tab and drag and drop buttons or menu options in your toolbar
70

Copyright © OSIsoft, Inc
PI ProcessBook Modes
71
Run Mode
Build Mode
• Browse PI ProcessBook (Workbook) elements
• Visualize already created displays
• Display Navigation
• Change mode by selecting Tools > Run or clicking on ( ) of the
Drawing toolbar.
• Build or Edit PI ProcessBook (Workbook) elements
• Add or Modify elements to/from a display
• Change mode by selecting Tools > Build or clicking on ( ) of the
Drawing toolbar.

Copyright © 2008 OSIsoft, Inc
3.2 Use a display

Copyright © OSIsoft, Inc
Display
Main unit for creating presentations of data in PI ProcessBook
Displays contain a variety of individual items: static elements, buttons, OLE objects, and dynamic elements to represent an operational environment using real-time, production data from PI or data from other sources
A display may stand on its own into a file (extension .PDI or.SVG)
73

Copyright © 2008 OSIsoft, Inc
3.2.1 Trend Navigation

Copyright © OSIsoft, Inc
Trend Viewing Options
These functions can used only in Run ( ) mode only Full screen graphic display Zoom In/Out on a trend Change the vertical axis scale Change the time period
displayed Trend cursors Show/Hide data traces Tooltip statistics Show Details and Annotations Revert to original configuration
75

Copyright © OSIsoft, Inc
Full Screen
Double-Click in Run ( ) mode to activate Double-Click again to deactivate
76
Too small?Double-Click on it
( Run mode only)

Copyright © OSIsoft, Inc
Zoom
Drag a rectangle within the trend boundary
Use revert ( ) to return to original definition
77
( Run mode only)

Copyright © OSIsoft, Inc
Vertical Axis Scale
The Zoom function previously described does change the vertical axis
To manually change the vertical axis scale: Select View > Trend Scale Double-click on the vertical axis
78
( Run mode only)

Copyright © OSIsoft, Inc
Change Time Range
Zoom function previously described
“One time period forward – backward” functions at the bottom of the trend: Browses one time period forward or backward and
accesses the appropriate archived data
Use the scroll bar:
79
( Run mode only)

Copyright © OSIsoft, Inc
Change Time Range
Select View > Time Range or click on ( )
Uses absolute or relative time format For automatic updates
o The value of the To parameter must be * (now)o The time range must be less than or equal to 24 hours
(configurable)
80
( Run mode only)
Copyright © OSIsoft, Inc
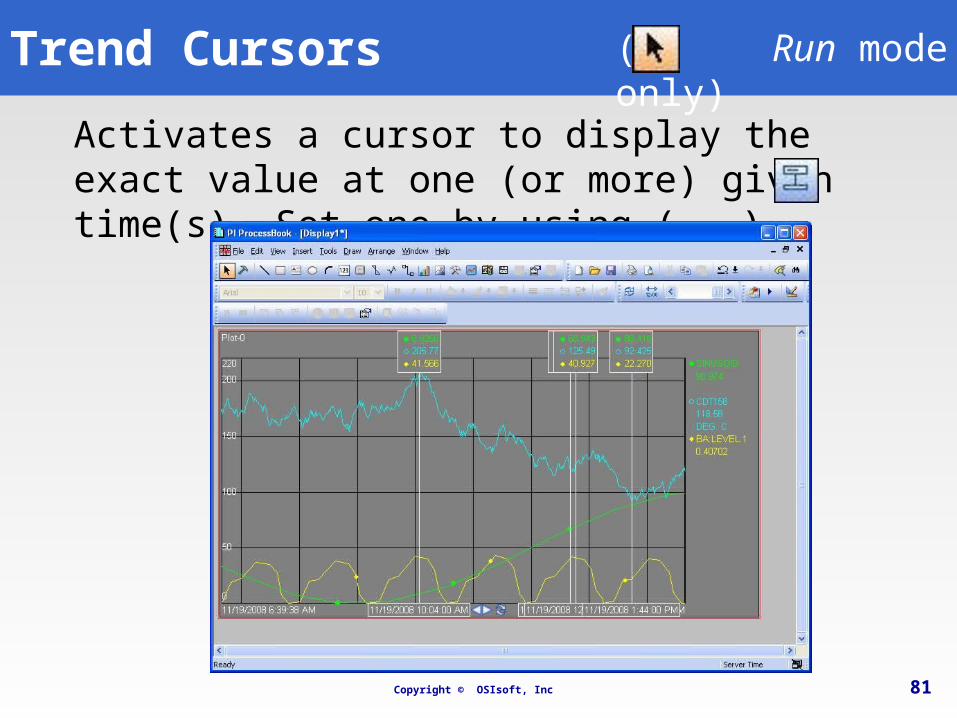
Trend Cursors
Activates a cursor to display the exact value at one (or more) given time(s). Set one by using ( ).
81
( Run mode only)

Copyright © OSIsoft, Inc
Data Traces
82
( Run mode only)
Traces can shown or hidden by clicking on the tag name in the legend or Right-click on Trend > Trend Traces
Traces can shown or hidden individually or all at once

Copyright © OSIsoft, Inc
Revert to Original Configuration
Select View > Revert or click on the ( ) button to get back to the original display
The changes made in View mode are only temporary and will not change the original configuration
83
( Run mode only)

Copyright © 2008 OSIsoft, Inc
3.2.2 Navigation within the application

Copyright © OSIsoft, Inc
Viewing Options on Multiple Items
It is possible to select more than one item at a time Hold the CTRL or the SHIFT key and click on the desired
items Selected items are framed with a red rectangle
Most view functions will apply to all items that are selected If none selected, the changes will be applied to all items on
the display These functions will make any dynamic elements
present on the display show values in the past
85

Copyright © OSIsoft, Inc
Temporary Trends (Ad-Hoc)
In Run mode, there are 2 ways to create a trend: In the current window, select one or many values, click
on ( ) then draw a rectangle to display the trend
In a new window, select one or many values, then click on ( ) to create an Ad-Hoc trend
It is possible to save the new window as a Display
86
( Run mode only)

Copyright © OSIsoft, Inc
Unavailable Data
Render of unavailable data through elements Trend shows nothing Dynamic Value shows No Data Trend Cursor shows No Data Bar Graph shows diagonal lines Multi-state symbol shows the user defined Bad data
color
87

Copyright © OSIsoft, Inc
Status Bar
The status bar at the bottom of the window shows:1. Time Zone
2. Layers
3. Status Report
4. Default Line / Fill / Background color for an element
88
1 2 3 4

Copyright © OSIsoft, Inc
Status Report
A status report can be accessed on the status bar at the bottom of the screen
89
Double-click on this icon to access the status report
All of the dynamic elements on the display are updating
At least one dynamic element in the display is reporting bad data (or a shutdown status)

Copyright © OSIsoft, Inc
Status Report
The status report presents all of the dynamic elements on the display along with their associated tag
An error message will appear for every dynamic element in error
90

Copyright © OSIsoft, Inc
Statistics
Hovering the mouse cursor over an objects presents tooltip statistics
Present statistics for the longest time range specified by an element in your display
91
Statistics are: Average Minimum and
Maximum Count Range Pop. Std Deviation
( Run mode only)

Copyright © OSIsoft, Inc
Show Details and Annotations
At any moment you can visualize: compressed data statistics point attributes annotations
from a dynamic element presented on your display
Data, statistics or attributes can be exported to a file or copied to clipboard
Write annotation directly from a display
Details window is driven by selections in your display
92
( Run mode only)

Copyright © OSIsoft, Inc
Show Details and Annotations - Data
Select the Data option
1. Refresh data grid
2. Increase or decrease fonts from data grid
3. Export data to .TXT or .CSV file
4. Copy to clipboard
5. Select point to get data from among the list of all points belonging to the current display
93
1 2 3 4
5

Copyright © OSIsoft, Inc
Show Details and Annotations - Annotations
You can write many annotations for a specific event1. Enter you annotation2. Determine the type, it can be:
String Integer Float Array File And more
3. Enter a description4. Save the annotation5. Delete selected annotation6. Import/Export a file into/from the
annotation
94
1 2 3
4 5 6

Copyright © OSIsoft, Inc
Show Details and Annotations - Statistics
Select the Statistics option to visualize results Statistics are calculated for
a time range Elements presenting a
single value use a time range equals to :
The outermost past time boundary of all elements belonging to current display
To now
95

Copyright © OSIsoft, Inc
Directed Exercise
Visualize statistics: Learn how to visualize statistics from display
elements
96

Copyright © OSIsoft, Inc
Directed Exercise
Create an annotation: Learn how to visualize data from a selected
element belonging to a display Learn how to add an annotation to a specific
event in time Learn how to export data to file
97

Copyright © OSIsoft, Inc
Exercise PB1
Objectives Familiarize yourself with the Common Dialog
Windows Familiarize yourself with the PI ProcessBook
environment Learn how to manipulate a trend display using an
existing PI ProcessBook Learn how to export data Learn how to add an annotation
98
Basics

Copyright © OSIsoft, Inc
Notifications
PI ProcessBook integrates PI Notifications related to your current user (Windows user)
Select View > Notifications
99

Copyright © OSIsoft, Inc
What is PI Notifications?
Component of the PI System for building and maintaining real-time PI System notifications
Allows a user to define a set of criteria that upon which the PI Notifications Service can trigger a notification to a configurable set of subscribers
Allows different delivery channel (Email, Web service)
Triggering conditions can be simple or complex All triggered conditions are recorded in the PI Server
for historical purposes.
100

Copyright © OSIsoft, Inc
Notifications Window
Visualize Active, Recent or Time Range period for notifications
The ( ) button stops the update mechanism The ( ) button opens a automatically generated display
containing a trend with the tag associated with the notification (associated display)
101

Copyright © OSIsoft, Inc
Notifications menu
Add Comment with the notification Modify the time range of displays based on the time when the
notification has started Associated display All opened displays
102

Copyright © OSIsoft, Inc
Notifications menu
Can be acknowledged Acknowledging a subscription indicates that you have received a
notificationo Acknowledged only by the subscriber himselfo It may trigger an acknowledgment of the instance (based on the configuration)
Acknowledging an instance indicates that you want that no further notification be sent to all subscribers.
o Escalation is haltedo Used when you have taken some actions as a result of the notification
Visualize the notification rule Open the associated display
103

Copyright © 2008 OSIsoft, Inc
3.3 Build a display
Copyright © OSIsoft, Inc
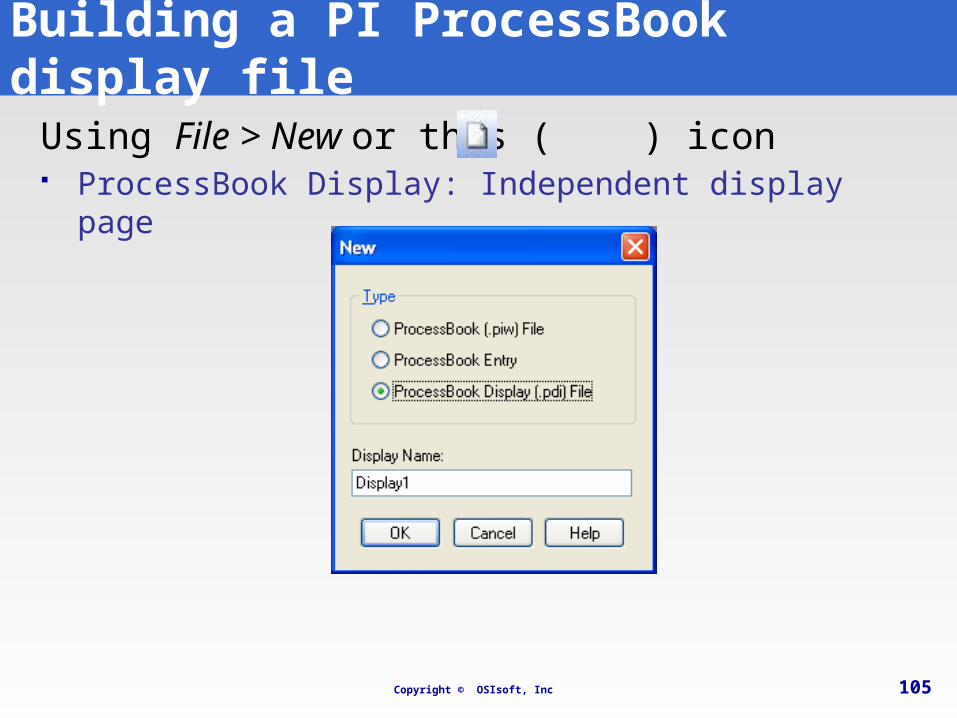
Building a PI ProcessBook display file
Using File > New or this ( ) icon ProcessBook Display: Independent display page
105

Copyright © OSIsoft, Inc
The Draw Menu
Lists elements that can be added to the display Static Elements Dynamic Elements
1. In Build ( )mode, select the desired element
2. Draw it on the display
3. Define its configuration when prompted.
106

Copyright © 2008 OSIsoft, Inc
3.3.1 Chart elements

Copyright © OSIsoft, Inc
Trend Building
In Build ( ) mode: Select Draw > Trend or click on the button ( ) Draw a rectangle with the mouse to define the size
of the trend A design window with 4 different tabs allows
configuration of the trend: General, Display Format, Trace Format and Layout
108
( Build mode only)

Copyright © OSIsoft, Inc
Trend Building - General Tab
109

Copyright © OSIsoft, Inc
Trend Building – Display Format Tab
110
Copyright © OSIsoft, Inc
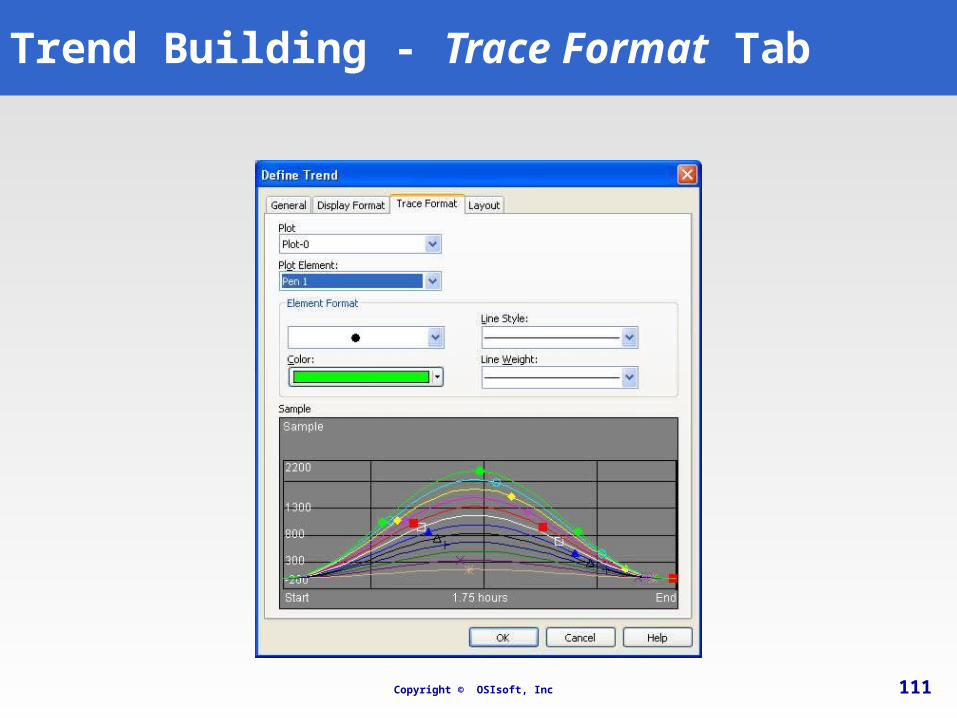
Trend Building - Trace Format Tab
111

Copyright © OSIsoft, Inc
Format Trend using Toolbar
You can use toolbar to quickly set the Trend: Font Font size Font style Trend background
Use the Format paintbrush to recopy the formatting properties to another trend

Copyright © OSIsoft, Inc
Vertical Trend
Time axis will be placed on the left with the enhanced time analysis tools
Legend area will be placed under the chart area
Can show time axis moving: Upward Downward

Copyright © OSIsoft, Inc
Trend Linear Regression
Regression line is added individually to each trace
Tooltip statistics will return the slope and offset coefficient
Copyright © OSIsoft, Inc
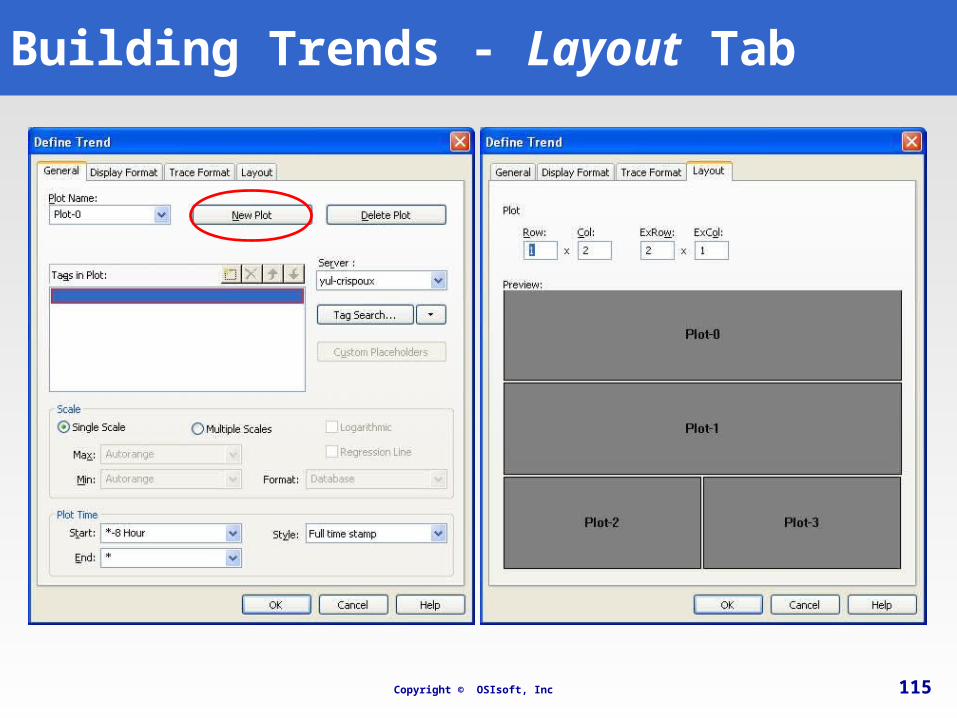
Building Trends - Layout Tab
115

Copyright © OSIsoft, Inc
Multi-Trends Creation - Example
Simultaneous creation of 5 trends
Row Col ExRow ExCol
2 2 1 1
Total: 2 x 2 + 1 x 1 = 5
Line and column Bottom Section
Extra line and column Top Section
116

Copyright © OSIsoft, Inc
XY Plots
Scatter plots Used to show relationships between value
sets Values on horizontal scale (X-Axis) represent the
values of a PI point rather than time
117

Copyright © OSIsoft, Inc
Selecting the Base Tag
118

Copyright © OSIsoft, Inc
Selecting Comparison tag(s)
119

Copyright © OSIsoft, Inc
Statistics Window
To access the statistics window, double-click on the top part of the XY plot element
120
Double-click in this area

Copyright © OSIsoft, Inc
Trend Modification
Select a trend, and click on Edit > Selected Item ( ) Double-click on the trend in Build mode
The ( )button is used to modify the selected trend’s font This button is only accessible in Build mode
121
( Build mode only)

Copyright © OSIsoft, Inc
♦ What are the two ProcessBook viewing functions/tools that allow you to visualize your historical data?
♦ Which one of these statements is not true:a. In run mode, we can change both the vertical scale and
the time scale of a trend element.
b. After changing the display in run mode, if we don’t use the Revert ( ) function before saving the file, the modifications will be saved.
c. The status report will indicate all tags used in the display that are in error and their associated ProcessBook element.
Group Recap Question (optional)
122

Copyright © OSIsoft, Inc
♦ What type of information can be saved within an annotation?
♦ True or False, Can you see any PI Notifications defined in the system from the PI Notifications add-in in PI ProcessBook?
Group Recap Question
123
Copyright © OSIsoft, Inc
Exercise PB2
Objective Build trends Familiarize yourself with the different trend building
options
124
Building Trends

Copyright © 2008 OSIsoft, Inc
3.3.2 Static elements

Copyright © OSIsoft, Inc
Static Shapes
You can use…
Shapes can be…
126
Rectangles Ellipses/Circles
Lines/Polylines
Polygons Arcs Connectors
TextsGraphics from
Symbol Library
Graphics from Imported
Image Files
Grouped Colored Connected Multi-state
Copyright © OSIsoft, Inc
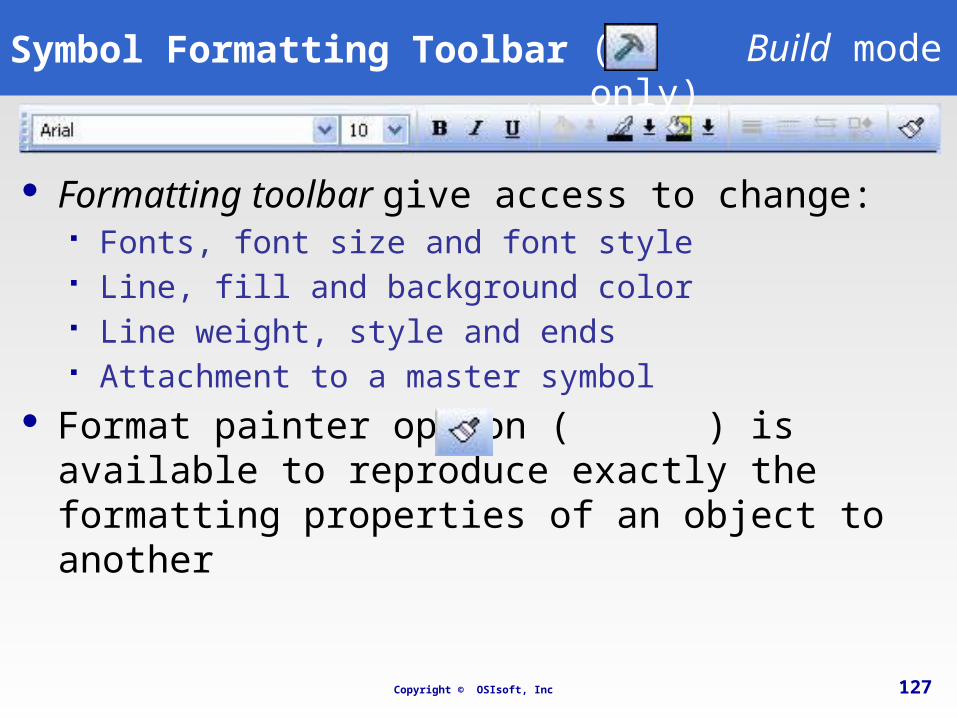
Symbol Formatting Toolbar
Formatting toolbar give access to change: Fonts, font size and font style Line, fill and background color Line weight, style and ends Attachment to a master symbol
Format painter option ( ) is available to reproduce exactly the formatting properties of an object to another
127
( Build mode only)

Copyright © OSIsoft, Inc
Line and Color Properties
In the Formatting toolbar
Change line properties with ( ) Change color properties with ( )
Apply changes to Selected element(s) If none selected, default
properties for new objects
128
Lines
Colors
( Build mode only)

Copyright © OSIsoft, Inc
The ( ) button allows access to a library of symbols
Symbol Library
129
( Build mode only)

Copyright © OSIsoft, Inc
Import an image file in a display Use the button ( ) or select Draw > Graphic
Importing Graphic Files
130
( Build mode only)
Copyright © OSIsoft, Inc
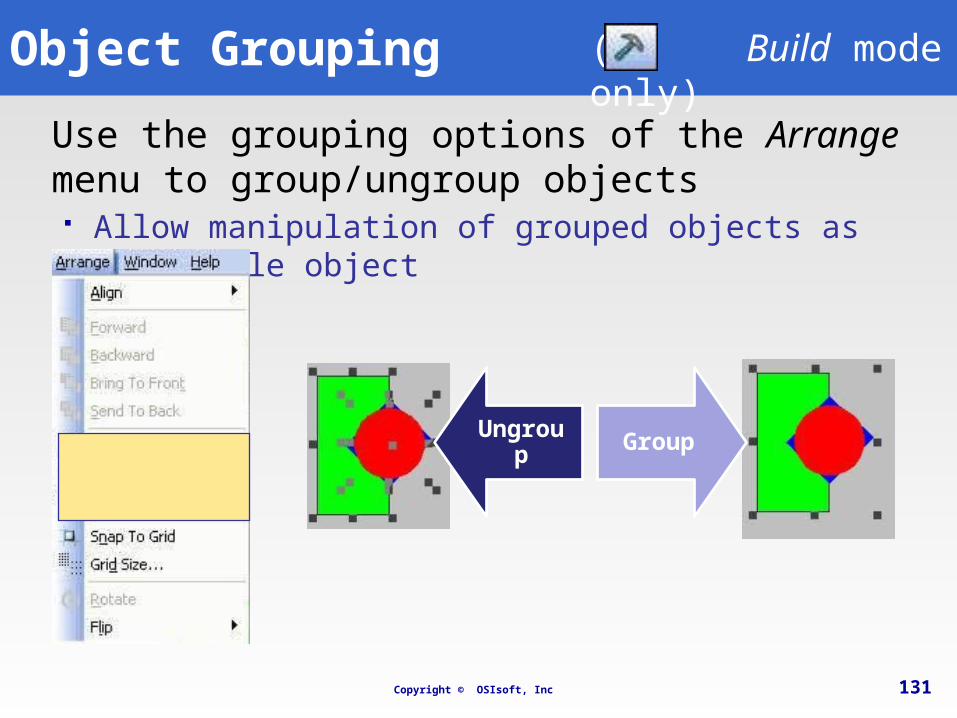
Object Grouping
Use the grouping options of the Arrange menu to group/ungroup objects Allow manipulation of grouped objects as one single object
131
Ungroup
Group
( Build mode only)

Copyright © OSIsoft, Inc
Symbol Attachments
PI ProcessBook elements can be attached to one another using the Symbol Attachments… option from the Edit menu or clicking on the ( ) button on the toolbar
132
When a master element is moved on a display, all of its attached elements will follow
Each element in the group retains its identity
( Build mode only)
Copyright © OSIsoft, Inc
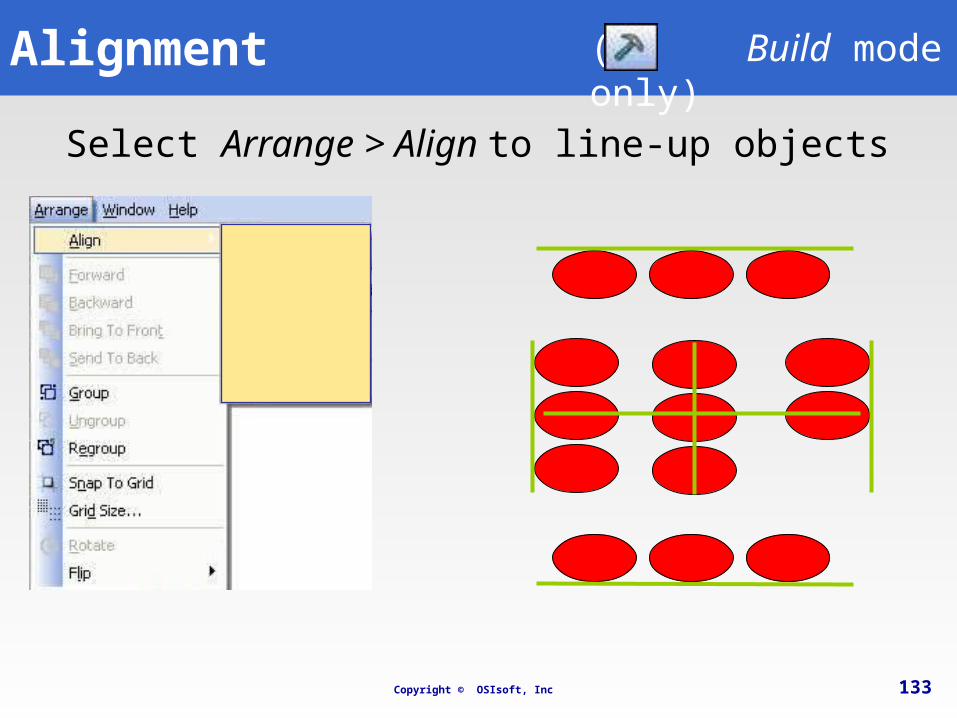
Alignment
Select Arrange > Align to line-up objects
133
( Build mode only)

Copyright © OSIsoft, Inc
Stack Objects
Use the options Forward, Backward, Bring to Front and Send To Back in the Arrange menu to determine the layering of objects
134
Bring to Front or
Forward
Send To Back
or Backward
( Build mode only)

Copyright © OSIsoft, Inc
Rotation
Use Rotate to rotate an object and Flip to reverse it, either horizontally or vertically
Use Snap To Grid to force the objects to align to a grid as you draw them
Use Grid Size to modify the spacing of the grid
135
( Build mode only)

Copyright © OSIsoft, Inc
Exercise PB3
Objectives Insert and integrate static elements in a display
entry.
136
Inserting static elements in displays
Copyright © 2008 OSIsoft, Inc
3.3.3 Dynamic elements

Copyright © OSIsoft, Inc
Dynamic Elements
The following dynamic elements can be added to a display:
138
Trends
X-Y Plots
Bar Graphs
Dynamic Values
Multi-State Symbols

Copyright © OSIsoft, Inc
Dynamic Elements
The dynamic elements will change in real time according to the value of their associated tag
139
Level: 31.22 11/ 05/ 2006 10:56:15 AM Level: 92.63 11/ 05/ 2006 10:58:07 AM

Copyright © OSIsoft, Inc
Dynamic Elements - Bars and Values
140

Copyright © OSIsoft, Inc
Examples of a Bar Graph
141
Background color
Fill color

Copyright © OSIsoft, Inc
Bar Graphs
A Bar Graph shows tag’s current or past value as compared to a specified range of values. To show past values at least one Trend symbol is required in your display.
Can be horizontal or vertical Use customized colors Minimum and maximum values are based
on:o The PI point's zero and span attributes or;o User-defined minimum and maximum values.
It is unscaled but using the scale symbol from symbol library and text labels gives you one
142
( Build mode only)

Copyright © OSIsoft, Inc
Dynamic Values
A Dynamic Value shows the tag’s current or past value. To show past values at least one Trend symbol is required in your display
Show or not the tag name (and where) Show or not the timestamp (and where) Show or not the engineering units
143
( Build mode only)
Copyright © OSIsoft, Inc
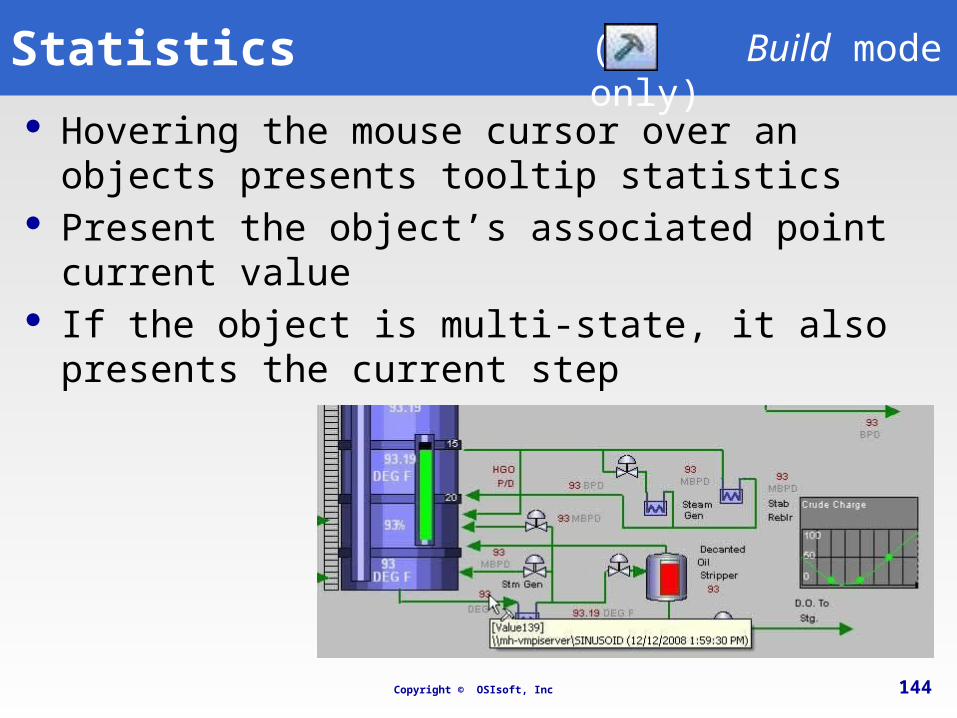
Statistics
Hovering the mouse cursor over an objects presents tooltip statistics
Present the object’s associated point current value If the object is multi-state, it also presents the
current step
144
( Build mode only)

Copyright © OSIsoft, Inc
Data favorites
Provides a way to configure symbols in PI ProcessBook by dropping a PI tag name (or other data reference) from a list onto the symbol. Can create Bar, Trend, Dynamic
Value and XY Plot when a data reference is dropped
Traces are added when data references are added to an existent Trend or XY Plot
Can create multiple items at a time
145
( Build mode only)

Copyright © OSIsoft, Inc
Data favorites
1. Default symbol to create Bar Trend Dynamic Value XY Plot
2. Tag mask to search
3. List the tags respecting the mask
4. Call the Tag Search Dialog box
5. Result list from which you can right-click on one or multiple tags to add to the favorites
146
12
3 45
Copyright © OSIsoft, Inc
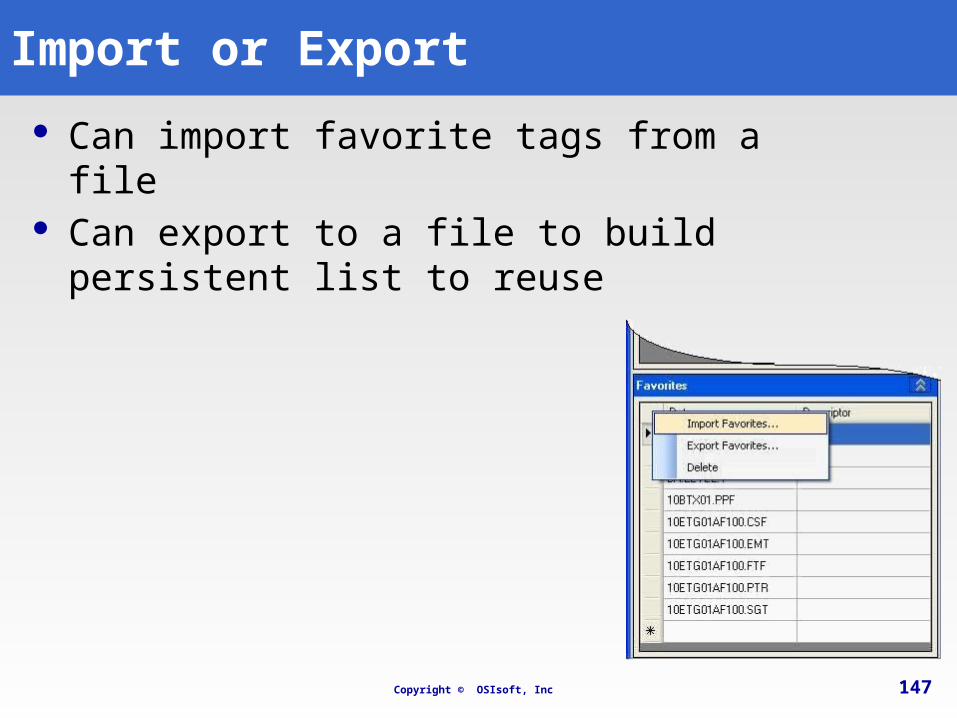
Import or Export
147
Can import favorite tags from a file Can export to a file to build persistent list to
reuse

Copyright © OSIsoft, Inc
Import or Export
148
Can import favorite tags from any application supporting drag and drop like MS Excel, MS Word, etc.
Copyright © OSIsoft, Inc
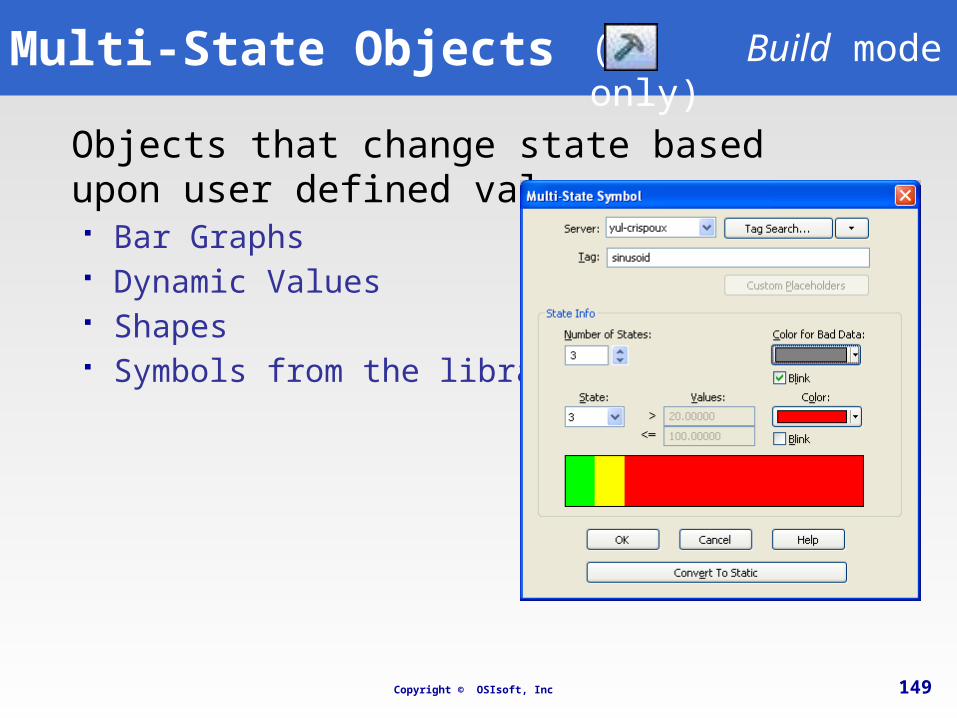
Multi-State Objects
Objects that change state based upon user defined values. Bar Graphs Dynamic Values Shapes Symbols from the library
149
( Build mode only)

Copyright © OSIsoft, Inc
Command Buttons
Launch any operating system command or recognized file type.
Launch any VBA-developed macro Can be used for internal navigation scheme
150
( Build mode only)

Copyright © OSIsoft, Inc
Directed Exercise
Create a display showing a realistic process layout giving feedback to operator by using the picture representing the process located on the class disk Add multi-state objects Add dynamic values Add trends Add bar graphs
151
Copyright © OSIsoft, Inc
Exercise PB4
Objectives Learn how to enhance your displays by adding live
elements whose properties change in time. These elements consist of the following ProcessBook objects:o Bar Grapho Value of a PI Tago Multi-State Symbolo Command Button
152
Inserting dynamic elements in displays

Copyright © OSIsoft, Inc
♦ How can we change default line and color properties of the ProcessBook elements?
♦ Building six trends all at once in ProcessBook, what need to be the Row, Col, ExRow and ExCol settings in the layout tab to have them displayed this way:
Group Recap Question (optional)
153

Copyright © 2008 OSIsoft, Inc
3.4 Organize your displays

Copyright © OSIsoft, Inc
Organize
A ProcessBook (workbook) is a collection of individual displays of data and analysis
Organize data from the PI System and other sources in the same workspace OS Command Hyperlink to file or URL like:
o A PI DataLink reporto A security procedure to followo Etc.
Linked display or ProcessBook A ProcessBook and its displays are stored in a
single file
155
Copyright © OSIsoft, Inc
What’s the Value to You
Easier sharing of displays across the enterprise
Can manage displays by tasks or by roles Less files to manage Incorporate other needful contents
156

Copyright © OSIsoft, Inc
Opening elements froma workbook
Double-click to open an item Use the New or Open button
New creates a new window for every click; it can open multiple copies
Open always refers to the same window
157
Multiple copies
( Run mode only)

Copyright © OSIsoft, Inc
View Modes
158
Outline• Selected from View >
Outline
Book• Selected from View >
Book
PI ProcessBook has 2 view modes

Copyright © OSIsoft, Inc
Outline View
1. In Run ( ) mode, you can choose the number of displayed levels with the numbers or use the + and – symbols to expand or collapse a section
2. + and – symbols do the same as in 1.
3. In Build ( ) mode, arrows are used to change an object’s level or to move it up and down
159
123

Copyright © OSIsoft, Inc
Building a PI ProcessBook file
Using File > New or the ( ) icon ProcessBook (.piw) File:
ProcessBook Workbook ProcessBook Entry: PI
ProcessBook elements or displays
160
Notes:
An asterisk (*) beside the name of the file in the title bar means:
• That the document has not been saved
• Has been modified since the last save

Copyright © OSIsoft, Inc
ProcessBook file entries
Five (5) types of ProcessBook (workbook) entries: Display Linked Display Operating System Command Linked ProcessBook Text
161

Copyright © OSIsoft, Inc
ProcessBook Text Entry
Title to organize the ProcessBook document In Build mode select File > New > ProcessBook
Entry
or
In Build mode select Insert >Text)
162

Copyright © OSIsoft, Inc
ProcessBook Display Entry
Main elements of a ProcessBook document In Build mode select File > New > ProcessBook
Entry
or
In Build mode select Insert > Display)
163

Copyright © OSIsoft, Inc
ProcessBook Linked Entries
References to objects already existing Linked Display, Linked ProcessBook
164

Copyright © OSIsoft, Inc
ProcessBook OS Command Entry
Open external files and launch external applications Calculator, Notepad Excel Spreadsheet, Word Document, Access Database Web site in Internet Explorer
165

Copyright © OSIsoft, Inc
Exercise PB5
Objectives Learn how to build and modify a PI ProcessBook Learn the differences between the Run mode and
the Build mode Understand the PI ProcessBook entries hierarchy Use the Book and Outline views to visualize and
modify a PI ProcessBook
166
Building a PI ProcessBook

Copyright © OSIsoft, Inc
♦ When creating a new ProcessBook entry in a workbook, what option needs to be set to display that entry as a separate tab?
♦ Name the five dynamic elements that can be created in a ProcessBook display.
Group Recap Question (optional)
167
Copyright © 2008 OSIsoft, Inc
3.5 Derived data
Copyright © OSIsoft, Inc
Data Sets
Provide a means of displaying some data that was originally derived from raw process values or other relational data.
Data sets can be: A PI Calculation (summary or expression) ODBC Data AF Data AF2 Data
A PI Calculation Data set uses the PI Performance Equation (PE) syntax
Data set results must be used in a dynamic display element to be viewed.
169

Copyright © 2008 OSIsoft, Inc
3.5.1 PI Calculation

Copyright © OSIsoft, Inc
PI Performance Equation Syntax
Numbers – no single/double quotes 0, 0.125, 34.56
Tag names - in single quotes Retrieves the current value ‘cdt158' , ‘temp_tank_1', 'FIC5821.PV'
Timestamps - in single quotes '*' , '14-nov-04', 't-8h'
Strings - in double quotes "This is a string"
171

Copyright © OSIsoft, Inc 172
Mathematical Functions and Operators
PI Performance Equation Syntax
Mathematical operators
+
-
*
/
^
Mathematical functions
cos()
sin()
tan()
log()
log10()
Mathematical functions
exp()
abs()
int()
atn()
sqr()
sgn()
And more…
Expressions can use…

Copyright © OSIsoft, Inc 173
Built-in Functions
PI Performance Equation Syntax
• % of time tag has good valuesPctGood()• Range of min to maxRange()• Time-weighted standard deviationStDev()• Time-weighted averageTagAvg()• Event-weighted averageTagMean()• Maximum value in periodTagMax()• Minimum value in periodTagMin ()• Time integral over a periodTagTot()
Examples of built-in functions:

Copyright © OSIsoft, Inc
Operators in Performance Equation
174
An expression can use If-Then-Else, relational and logical operators Syntax: IF expr0 THEN expr1 ELSE expr2 Example: IF ‘Tag1’ >= 50 AND ‘Tag2’ < 125 THEN “under limit” ELSE “good”
Notes: You must include the IF, THEN and ELSE keywords The NoOutput() PE function can be used in the THEN or
ELSE clause It is possible to nest if-then-else expressions

Copyright © OSIsoft, Inc
Data Sets Dialog Box
175
• Tools > Data Sets… > New > PI Calculation
1. In PI ProcessBook 1

Copyright © OSIsoft, Inc
PI Calculation Data Sets
176
• Set PE equation
2. Define calculation
• Use predefined interval or,
• Set a custom interval
3. Set Calculation interval
4. Set Column Name
5. Define refresh interval
2
3
4 5

Copyright © OSIsoft, Inc
PI Calculation Data Sets
177
Common Calculations
User Entered Calculation

Copyright © OSIsoft, Inc
PI Calculation Data Set
178
Column Label appears as the first selection in the available calculations.

Copyright © OSIsoft, Inc
Using Data Sets
179

Copyright © OSIsoft, Inc
More about Data sets
Elements which include data from a data set are updated automatically
Many elements of a ProcessBook can use the same data set simultaneously
Different ProcessBooks can include the same Data set
Modification of a data set will only affect elements of the current ProcessBook (.PIW) and display (.PDI)
180

Copyright © OSIsoft, Inc
Modify a Data set Important to verify which elements use a Data set
prior to modifying it The Show Use button of the Data Sets screen shows the
list of elements using a given data set To modify a data set, use the Edit button.
Modifications will affect all elements using this Data set
181
Copyright © OSIsoft, Inc
Copy a Data Set
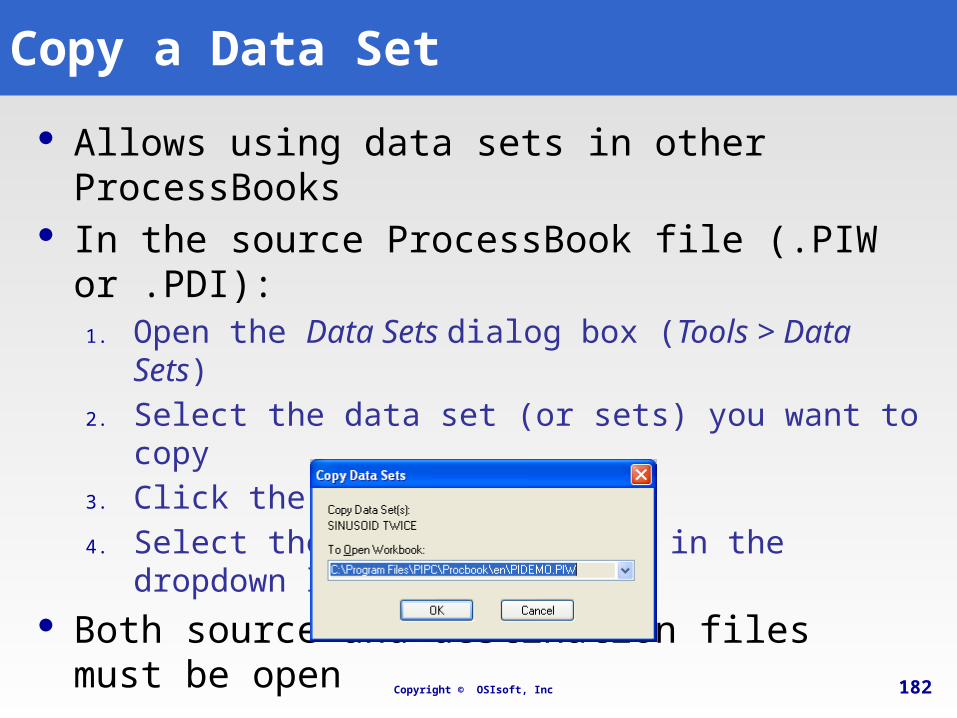
Allows using data sets in other ProcessBooks In the source ProcessBook file (.PIW or .PDI):
1. Open the Data Sets dialog box (Tools > Data Sets)
2. Select the data set (or sets) you want to copy
3. Click the Copy… button
4. Select the destination file in the dropdown list Both source and destination files must be open
182

Copyright © OSIsoft, Inc
Show Percent Good
There is no pre-calculation check like in Performance Equations for data set calculations
Inserted as a Dynamic Value
183

Copyright © OSIsoft, Inc
Exercise PB6
Objectives Learn how to use dynamic elements based on data
sets Learn how to obtain statistics from PI data archives Learn how to define equations with PI points
184
PI Calculation Data Sets

Copyright © 2008 OSIsoft, Inc
3.5.2 ODBC Data Set
Copyright © OSIsoft, Inc
ODBC Data Sets
186
Used to derive data from external, relational databases
Here are some of the databases that are compliant with Microsoft’s ODBC standard:
o Microsoft Accesso Oracleo Microsoft SQL Servero Sybaseo Microsoft Excelo OSI PI Server

Copyright © OSIsoft, Inc
Create ODBC Data Sources
Start Menu > Settings > Control Panel >
Administrative Tools > Data Sources (ODBC)
System DSN > Add… > Choose Driver >
Configure Data Source
187
OR

Copyright © OSIsoft, Inc
Create ODBC Data Sets
188
• Tools > Data Sets… > New > ODBC
1. In PI ProcessBook
2. Name it
3. Choose Data Source
4. Type or Design SQL Query
1
2
3
4

Copyright © OSIsoft, Inc
Exercise PB7
Objective Demonstrate the ability to construct an ODBC
connection and Data Set
189
ODBC Data Sets

Copyright © 2008 OSIsoft, Inc
3.5.3 AF2 Data Set

Copyright © OSIsoft, Inc
What is AF Asset Model?
191
Allows users to organize and structure PI data and other data (like reactors, transformers, meters, etc.)
Is based on Element representing a user-oriented object
Element can contain attributes All information are stored in the PI
Analysis Framework Database (AF) Permits to use AF as a common
source of data, properties and configuration
Information from AF are available through AF2 Data Set in PI ProcessBook

Copyright © OSIsoft, Inc
ProcessBook Dynamic elements
192
The dynamic elements will change in real time according to the value of their associated element’s attribute Instead of referencing a point it uses a AF2
element’s attribute Result will be modified by the unit of measure
(UOM) chosen

Copyright © OSIsoft, Inc
AF2 Data Set
193
Use AF2 Data Set to present data from your model
AF2 property / attribute can be used with: Trends XY plot Multi-State shapes Dynamic values Bars

Copyright © OSIsoft, Inc
Dynamic Elements using AF2 Data Set
194
• Choose AF2 Data Set instead of Tag Search one
1. Change to AF Data Set
• Browse the hierarchy or use the search dialog box
2. Find the element
• Select the attribute• Modify the UOM• Set the Use the PIPoint
directly option
3. Choose the attribute
• Formatting the number• Show name• Show timestamp
4. Format the display
1
2
34

Copyright © OSIsoft, Inc
Exercise PB9
Objective Demonstrate the ability to display data taken from
an AF database
195
AF2 Data Sets

Copyright © OSIsoft, Inc
♦ Name four of the ten columns (a.k.a. types of calculations) available when using a PI calculation data set.
♦ What needs to be configured on the client machine before using an ODBC data set?
♦ Where are stored the data sets?
Group Recap Question (optional)
196

Copyright © OSIsoft, Inc
Recap Exercise PB1
Build a PI ProcessBook Display to: Show two pumps in parallel Display the flow rate for each pump (use CDT158
and SINUSOID tags) Include a trend of the 10-minute average of the
total of the two pumps’ flow rates, for the last 5 hours
Display a small flashing circle when SINUSOID tag is lesser than 25
197
ProcessBook (optional)

Copyright © 2008 OSIsoft, Inc
5.0 PI Module Database

Copyright © 2008 OSIsoft, Inc
Objectives Describe the PI Module Database structure Integrate the PI Module Database in PI ProcessBook
PI Module Database
199

Copyright © OSIsoft, Inc
PI Module Database
Each PI Server has its own PI Module Database (PI ModuleDB)
The PI ModuleDB is used to organize an enterprise’s information streams into logical sub-areas
The path to a certain area is called a context If the context (plant, unit, etc) is changed, the
referenced PI points will change, without having to search again for their tag names
200

Copyright © OSIsoft, Inc
PI ModuleDB – Physical Model
Department
Unit
Enterprise The structure of the PI ModuleDB allows the information to be stored hierarchically in relation to a physical model, a business model or an application model.
Division
Location
Equipment
Equipment Class
201

Copyright © OSIsoft, Inc
PI Module DB – PI Modules
Each module has: Configurable information – PI Properties Linked tags – PI Aliases Dated versions - Revision number, Version number,
Effective Date, Obsolete Date and Query Date System assigned information – UniqueID, Owner,
Parent list, etc. Sub-Modules with the same characteristics – PI
Modules
202

Copyright © OSIsoft, Inc 203
PI Module DB – PI Properties
PI Properties are collections of named values that can store information related to a PI module
A PIProperty has a name and a value The Value can be nearly any type: string,
numeric, date, etc. PIProperties are used to store information about
a module, example: Serial number Installation date Name of the technician who performed the installation

Copyright © OSIsoft, Inc
PI ModuleDB – PI Properties
PI Properties can also be hierarchical
204

Copyright © OSIsoft, Inc
PI ModuleDB – PI Aliases
PI Aliases let you configure common names to access real time information => PI tags
205
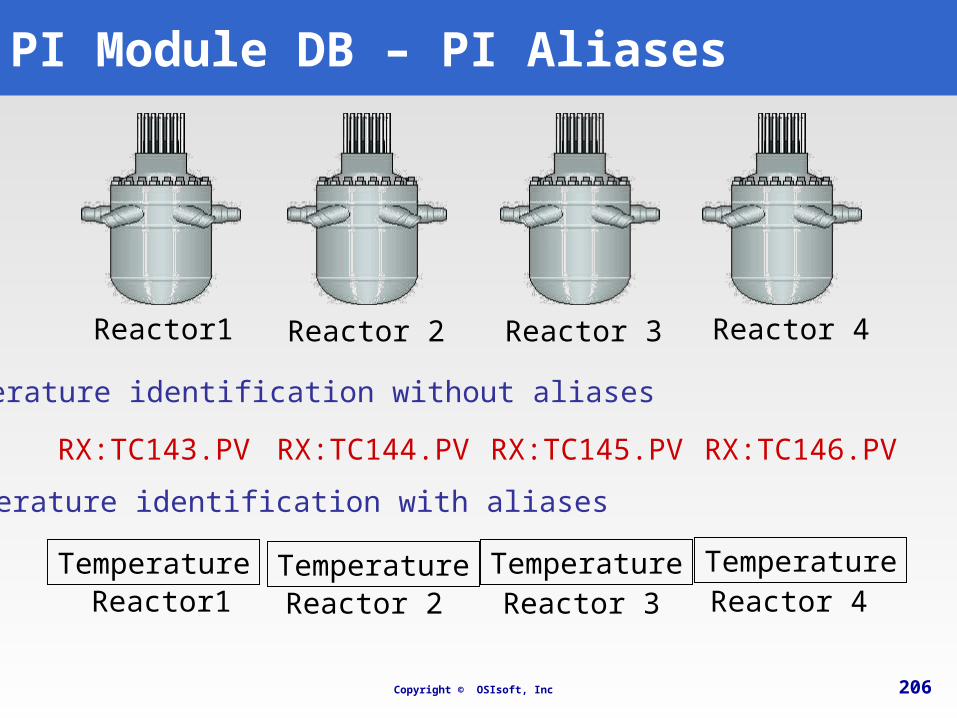
Copyright © OSIsoft, Inc 206
PI Module DB – PI Aliases
Temperature identification without aliases
RX:TC143.PV RX:TC144.PV RX:TC145.PV RX:TC146.PV
Temperature identification with aliases
Temperature Temperature Temperature TemperatureReactor1 Reactor 2 Reactor 3 Reactor 4
Reactor1 Reactor 2 Reactor 3 Reactor 4

Copyright © OSIsoft, Inc
Tag Search Window – Alias Search
Search by browsing the PI ModuleDB or specifying search criteria
You can filter by context, module name, alias, heading set and heading
The result pane shows the underlying tags for the aliases found
207

Copyright © OSIsoft, Inc
Module Relative PI ProcessBook Displays
208
Problem• A site has 100 units,
exactly the same• Need to monitor each
one• PB requires the creation
of a display for each unit
Solution• Define the units as
modules with aliases• Select a “template” unit• Design the display
using aliases from the “template”
• Shift the context from one unit to another
• One display can be used to monitor all 100 units

Copyright © OSIsoft, Inc
Accessing PI ModuleDB in PI ProcessBook
To add modules to a display, go in
Tools > Module Context > Add Module
209

Copyright © OSIsoft, Inc
Accessing PI ModuleDB in PI ProcessBook
210
Choose Modules that you wish to be included in the display
They will then be available in that display for reference

Copyright © OSIsoft, Inc
Accessing PI ModuleDB in PI ProcessBook
211
3. Choose the item you want to display and click OK
2. You will see a list of all the aliases and properties defined in the current
context
1. Click Module Context in the dropdown list beside the Tag Search
button
1.
3.
2.

Copyright © OSIsoft, Inc
The result: a streamlined approach
One display for multiple modules!
212

Copyright © OSIsoft, Inc
Displaying the Current Context
You can display the current context being used with a value symbol
213

Copyright © OSIsoft, Inc
What needs to be done in a PI ProcessBook display in order to access the information contained in the PI ModuleDB?
Group Recap Question (optional)
214

Copyright © 2008 OSIsoft, Inc
7.0 PI ActiveView

Copyright © 2008 OSIsoft, Inc
Objectives: Use and configure PI ActiveView
PI ActiveView
216
Copyright © OSIsoft, Inc
PI ActiveView
An ActiveX control that shows fully functional ProcessBook display (.pdi). VBA, SQC Charts, BatchView application
The content of the display remains in the .pdi file
Requires direct access to the PI Server (TCP Port 5450)
Better suited for an Intranet environment
217

Copyright © OSIsoft, Inc
PI ActiveView Connection
Data flowPI-SDK/ PI API
TCP Port 5450
myPage.htm
mydisplay.pdi
218
Web Server
DataArchive
PI Server

Copyright © OSIsoft, Inc
PI ActiveView Control
Drop the PI ActiveView activeX control (pbdctrl.ocx) in any supported activeX container and configure it
219

Copyright © OSIsoft, Inc
PI ActiveView Control – Example in Word
Save the Word document as a web page (*.htm;*.html)
220

Copyright © OSIsoft, Inc
PI ActiveView Control – Example in Word
Use the right-click menu of the PI ActiveView control to visualize historical data
221

Copyright © OSIsoft, Inc
The Export Display Special .pdi file with VBA code Breaks complete ProcessBook .piw files
All pages in independent .pdi files Sample .htm files, to browse through the pages
222

Copyright © OSIsoft, Inc
What is the purpose of the export display that comes with PI ActiveView?
Group Recap Question (optional)
223

Copyright © OSIsoft, Inc 224
Conclusion
“By using PI, we have been able to see what we guessed was happening. We have been able to validate our ideas and turn them into substantive savings. In our case, 10% of our operations budget.”
Chilkoot Ward Director of UtilitiesUniversity of Alaska (Power Generation)

Copyright © OSIsoft, Inc
Questions
225