Using performance-based budgeting in health... - Sabina Nuti, Italy
45
Using performance-based budgeting in health: The performance evaluation system adopted in Tuscany and in a network of Italian Regions Prof. Sabina Nuti, Laboratory of Management and Healthcare, Institute of Management, Scuola Superiore Sant’Anna, Pisa (Italy)
-
Upload
oecd-governance -
Category
Government & Nonprofit
-
view
207 -
download
0
Transcript of Using performance-based budgeting in health... - Sabina Nuti, Italy
Using performance-based budgeting in health: The performance evaluation system adopted in Tuscany and in a network of Italian Regions
Prof. Sabina Nuti, Laboratory of Management and Healthcare, Institute of Management, Scuola Superiore Sant’Anna, Pisa (Italy)
From evaluation to governance support
Evaluation Governance
The Italian healthcare system
It ‘s a Beveridge-like model: Universal, Comprehensive (almost),Free, Financed
by general taxation.
It is organized in three levels :
– The national level is responsible for national health planning, including
general aims and annual financial resources and for ensuring a uniform
level of services, care and assistance (LEA).
– The regional level has the responsibility for planning, organizing and
managing its health care system through LHA’s activities in order to meet
the needs of their population.
– The local level (Local Health Authorities): provides care through public
and/or private hospitals, primary care and prevention services.
Sabina Nuti

Regions involved in the performance evaluation system:
•Veneto•Toscana• Liguria• Umbria•PA Trento• PA Bolzano• Marche• Basilicata•Emilia Romagna•Friuli Venezia Giulia
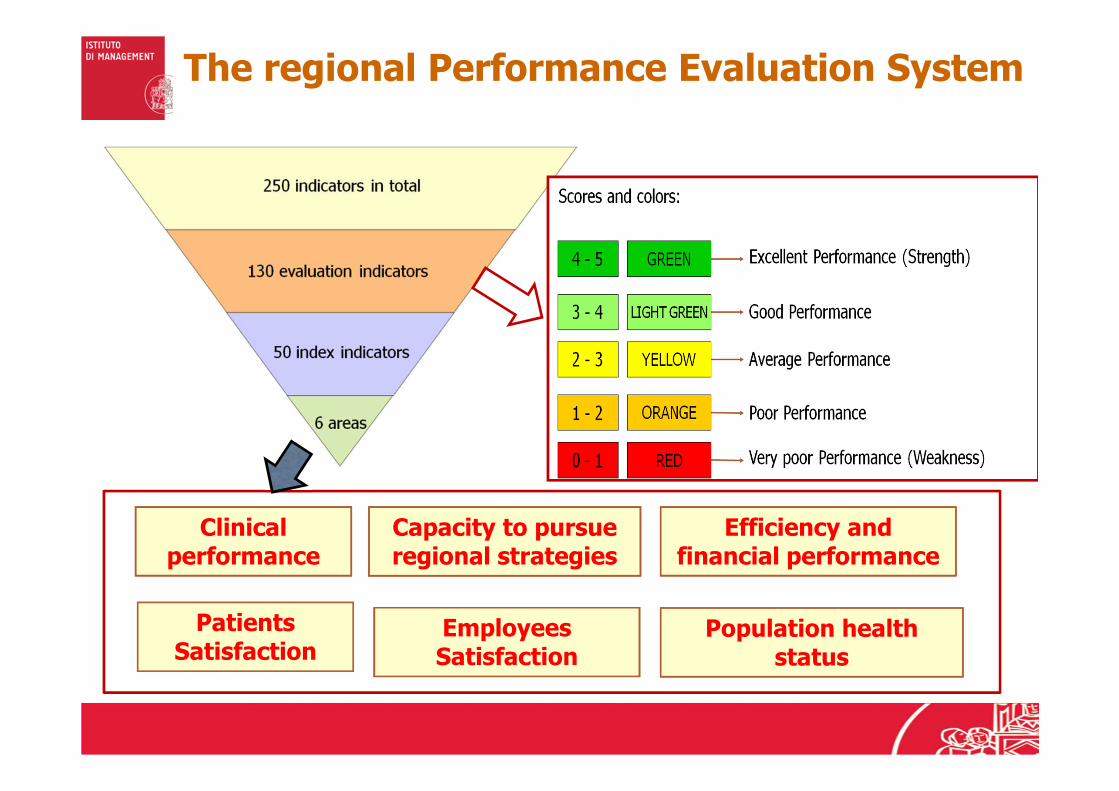
The regional Performance Evaluation System
Efficiency and financial performance
Employees Satisfaction
Patients Satisfaction
Clinical performance
Capacity to pursue regional strategies
Population health status


7
The reference criteria for the assessment bands
1. International standards, if existing based on EBM
2. Regional standards set out by the Regional
Governments;
3. The inter-regional mean, standardized by several
factors to allow comparisons across Health Authorities
and Regions
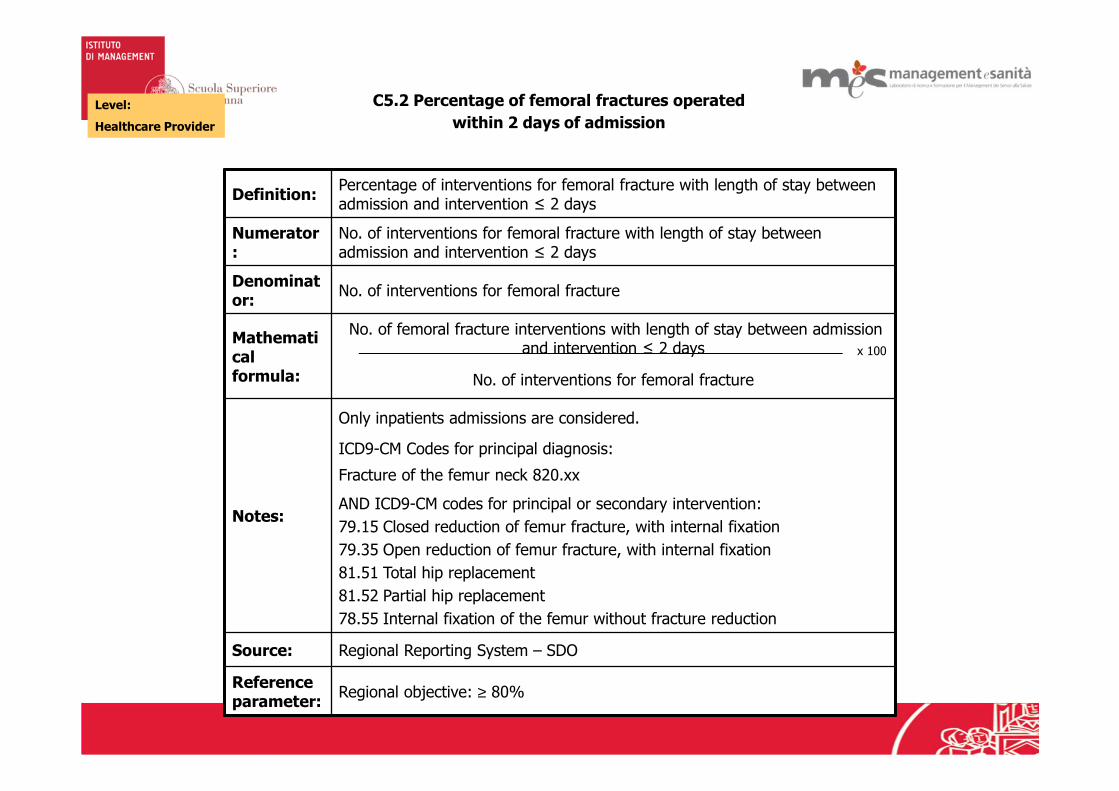
C5.2 Percentage of femoral fractures operated
within 2 days of admission
Definition:Percentage of interventions for femoral fracture with length of stay between admission and intervention ≤ 2 days
Numerator:
No. of interventions for femoral fracture with length of stay between admission and intervention ≤ 2 days
Denominator:
No. of interventions for femoral fracture
Mathematical formula:
No. of femoral fracture interventions with length of stay between admission and intervention ≤ 2 days
No. of interventions for femoral fracture
Notes:
Only inpatients admissions are considered.
ICD9-CM Codes for principal diagnosis:
Fracture of the femur neck 820.xx
AND ICD9-CM codes for principal or secondary intervention:
79.15 Closed reduction of femur fracture, with internal fixation
79.35 Open reduction of femur fracture, with internal fixation
81.51 Total hip replacement
81.52 Partial hip replacement
78.55 Internal fixation of the femur without fracture reduction
Source: Regional Reporting System – SDO
Reference parameter:
Regional objective: ≥ 80%
x 100
Level:
Healthcare Provider
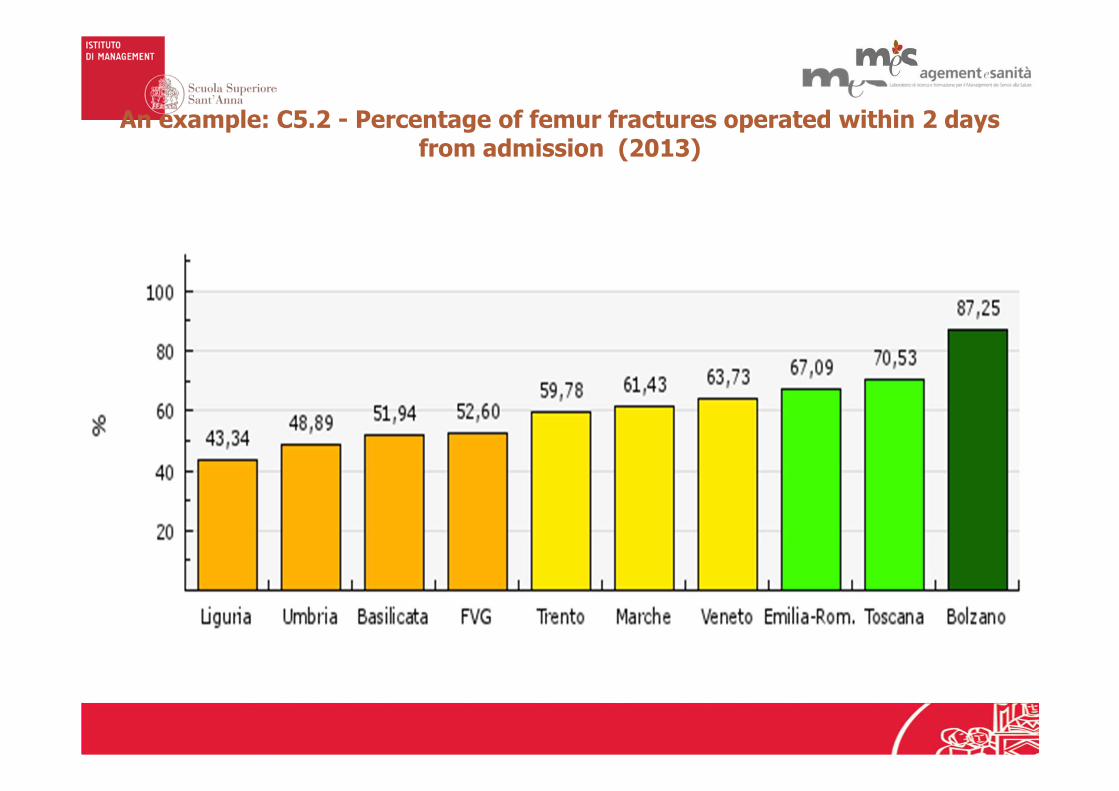
An example: C5.2 - Percentage of femur fractures operated within 2 days from admission (2013)
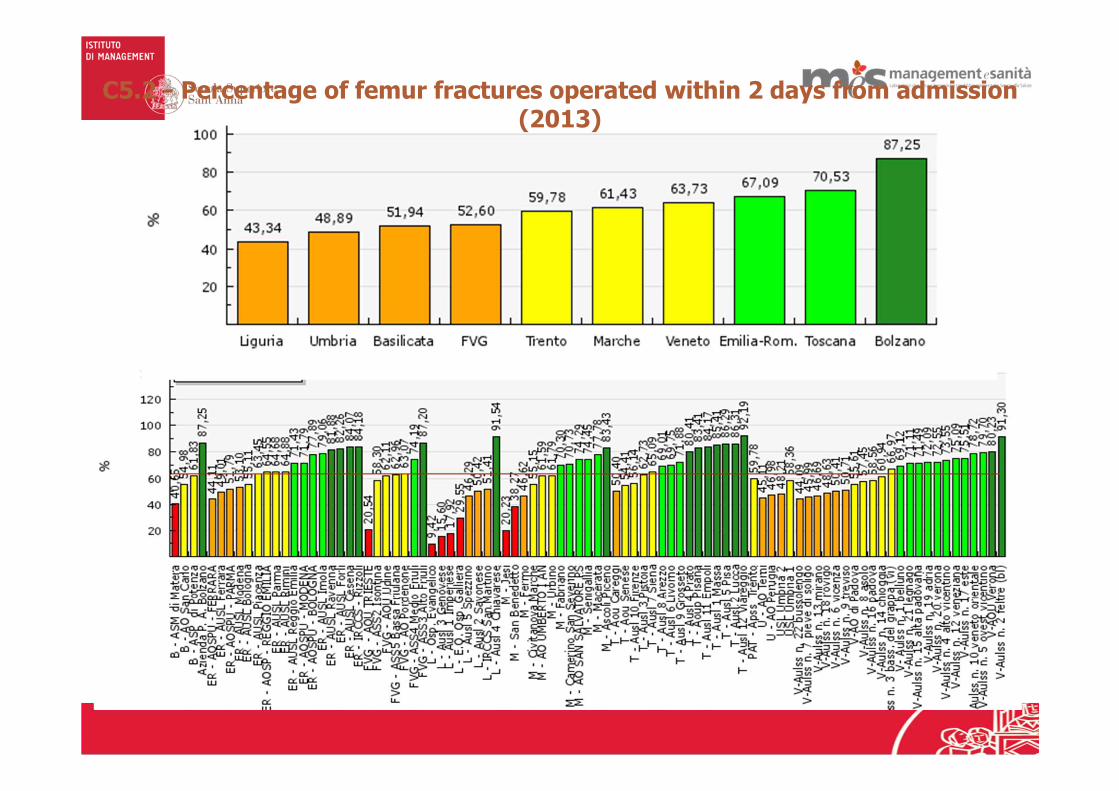
C5.2 - Percentage of femur fractures operated within 2 days from admission (2013)

C7.1 - Percentage of caesarean births (NTSV) 2013

D18 - % of patients that leave the hospital against the medical advice
(2013)
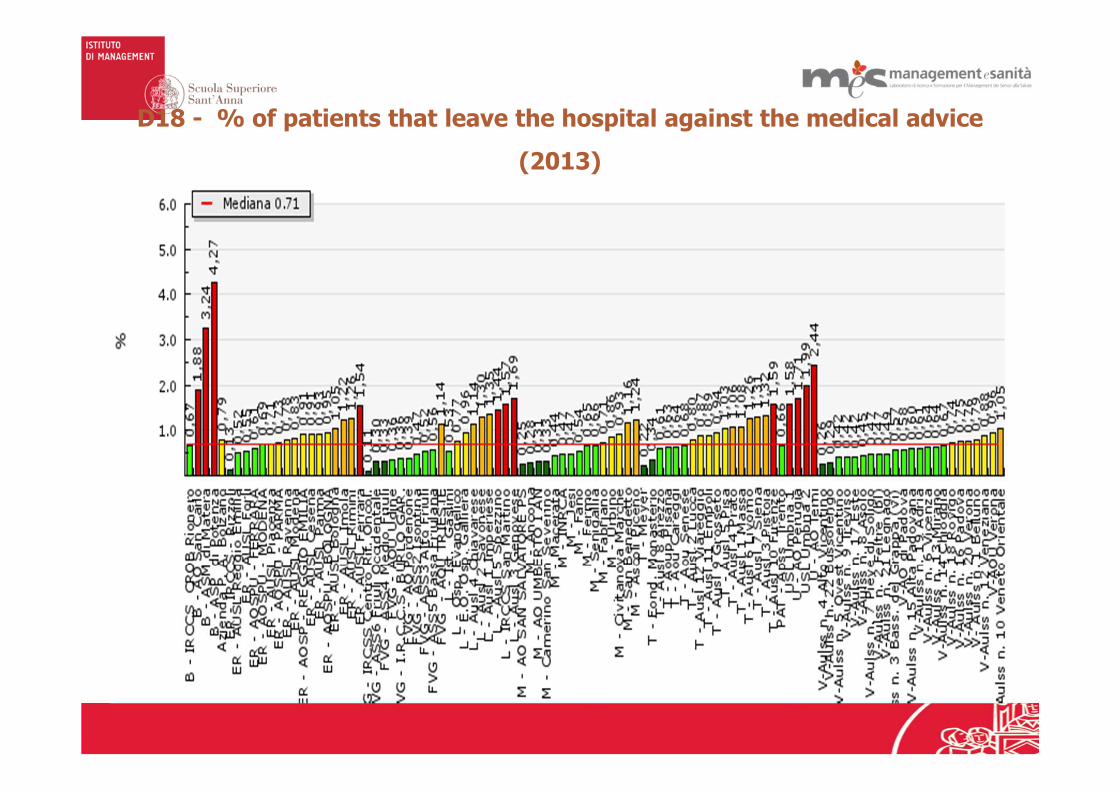
D18 - % of patients that leave the hospital against the medical advice
(2013)

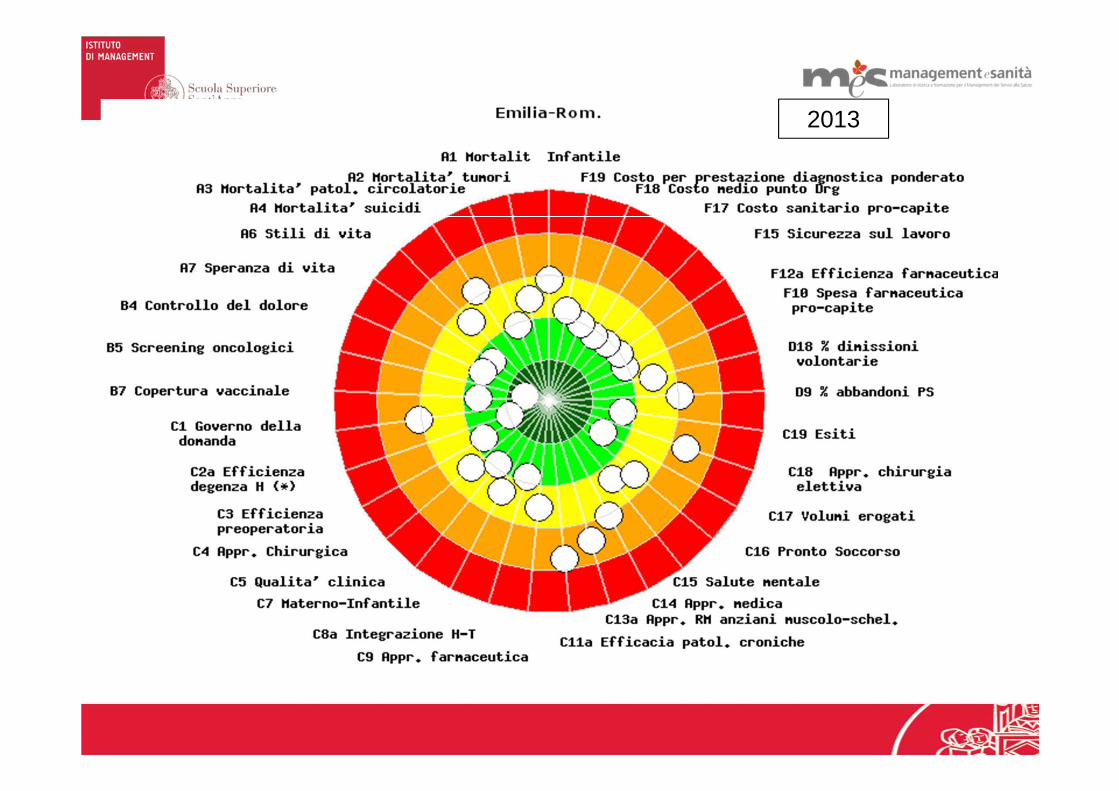
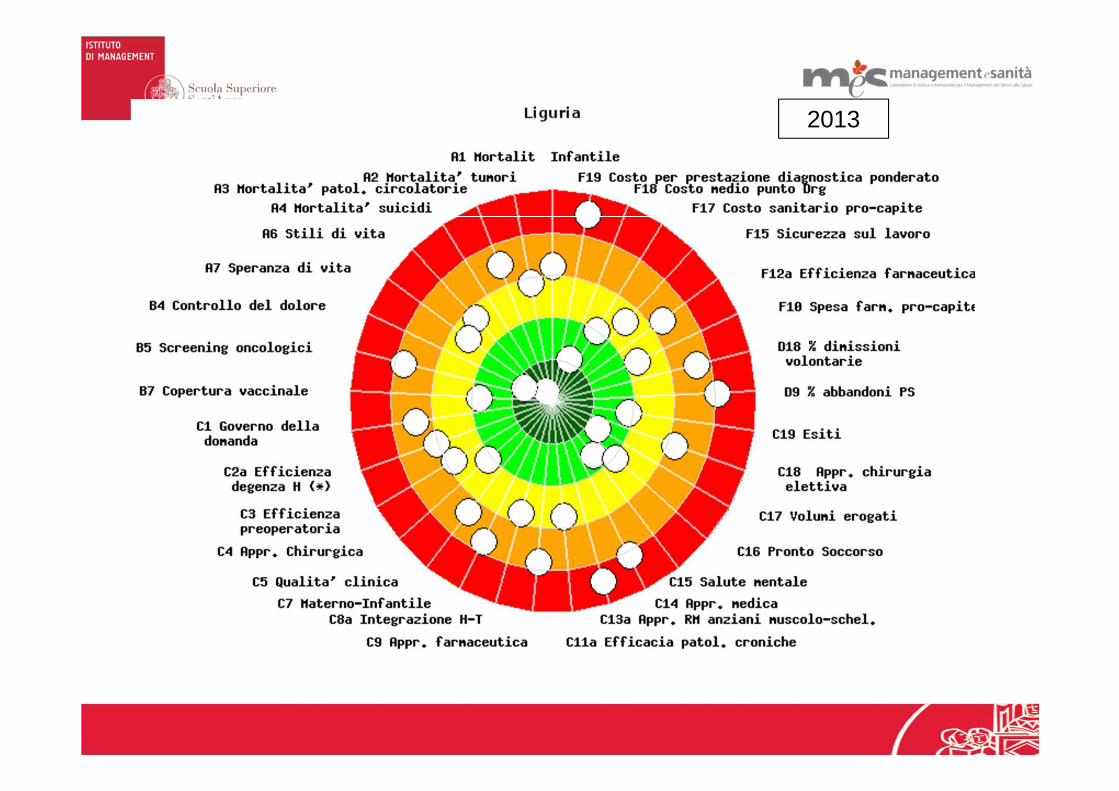
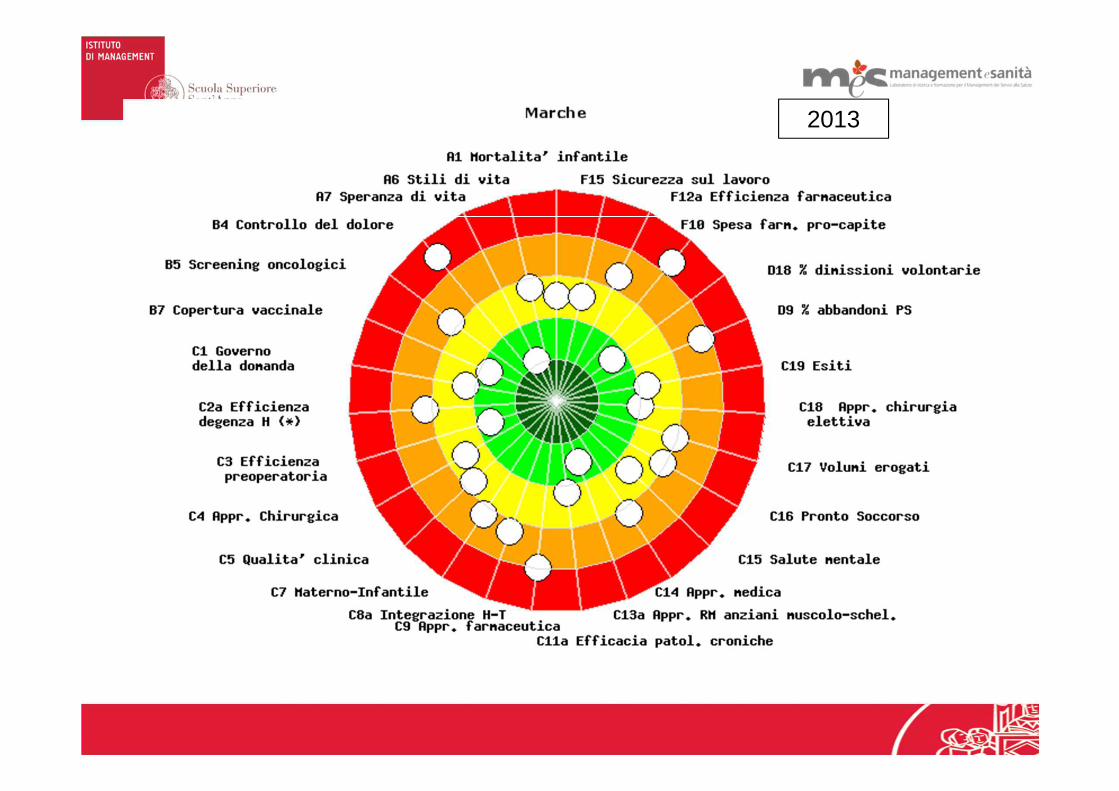
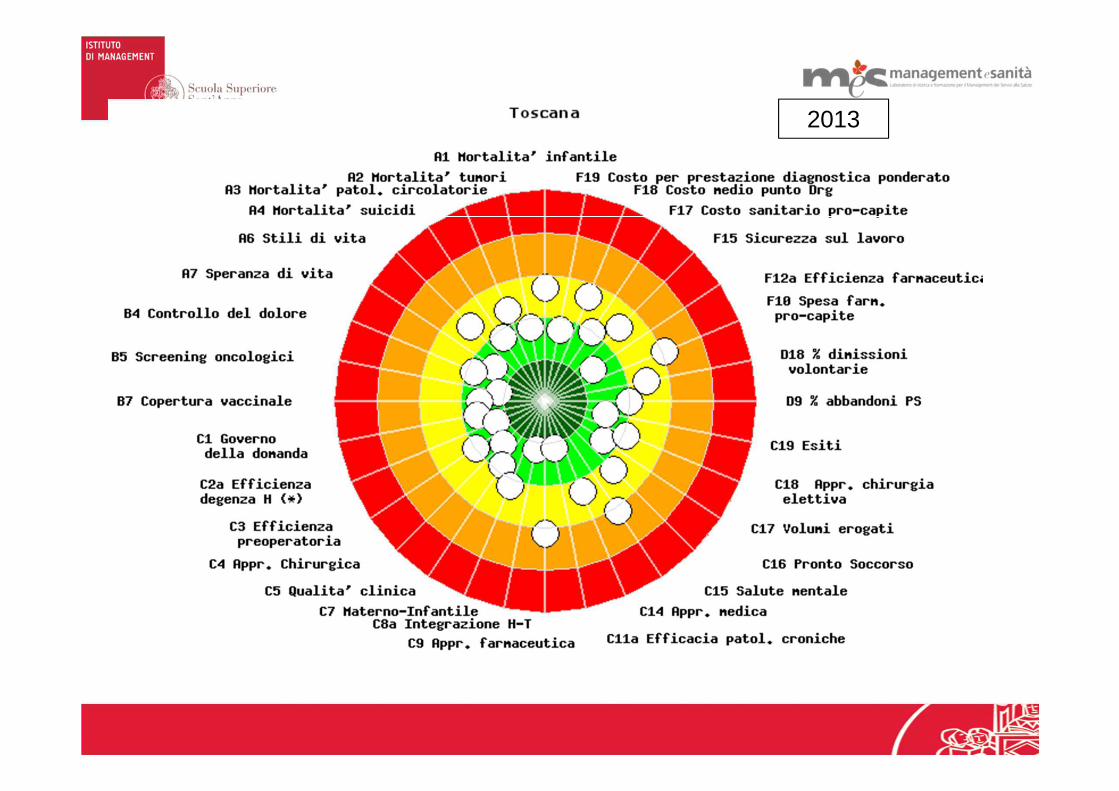
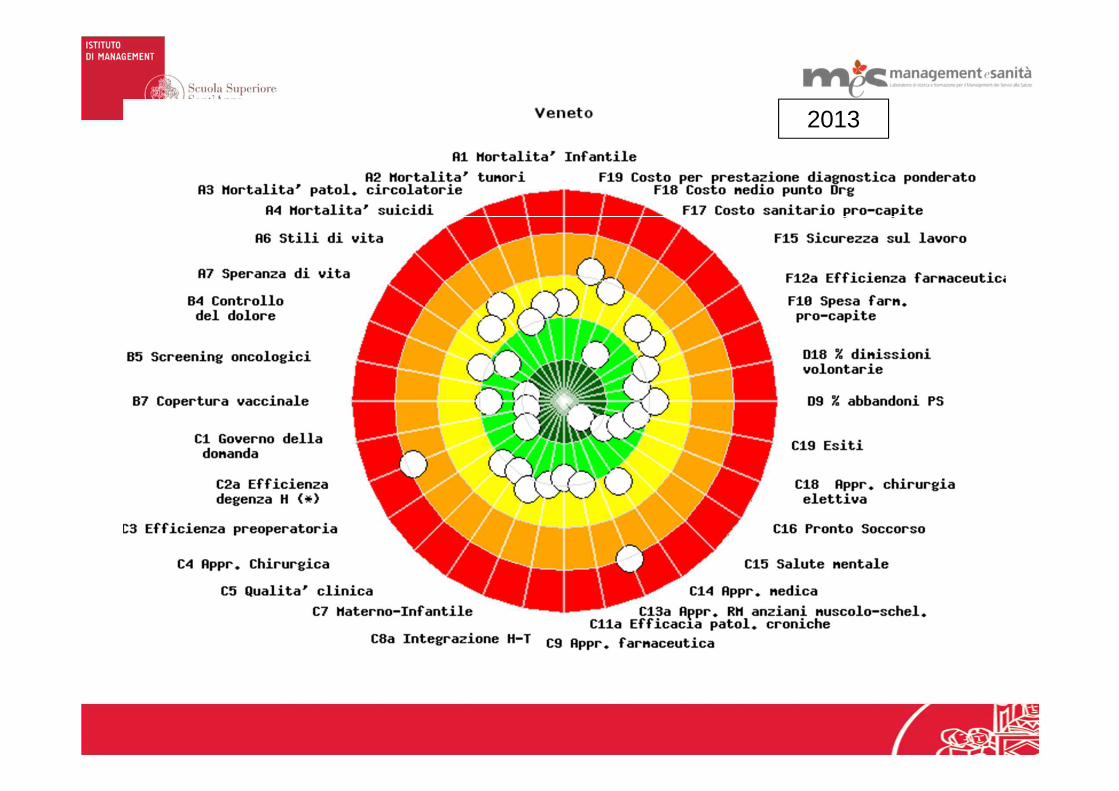
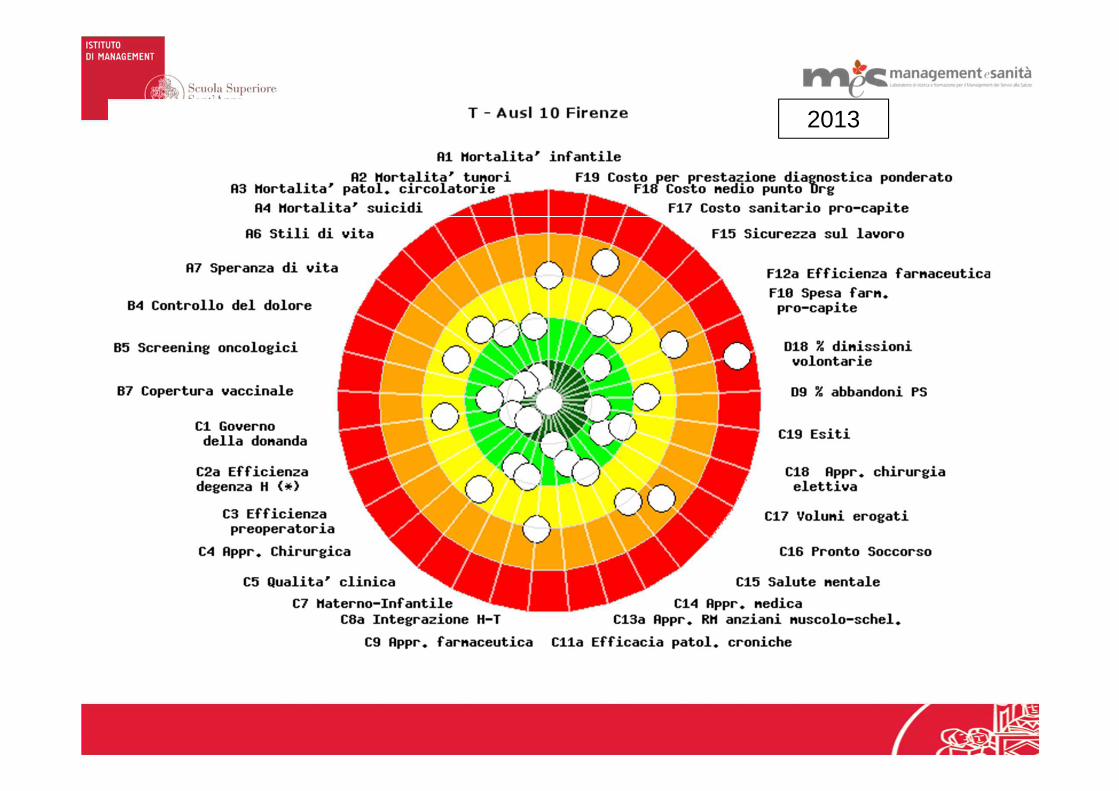
To visually represent the results of the six areas, each Region & Health Authority has a personal “target” diagram, divided in five assessment bands.
The more the Region/Health Authority is able to reach objectives and obtain good results in each of the six areas, the nearer the performance indicator is to the centre.
The DARTBOARD!

2013
2013

2013
2013
2013

2013

2013
2013

2013
2013
2013
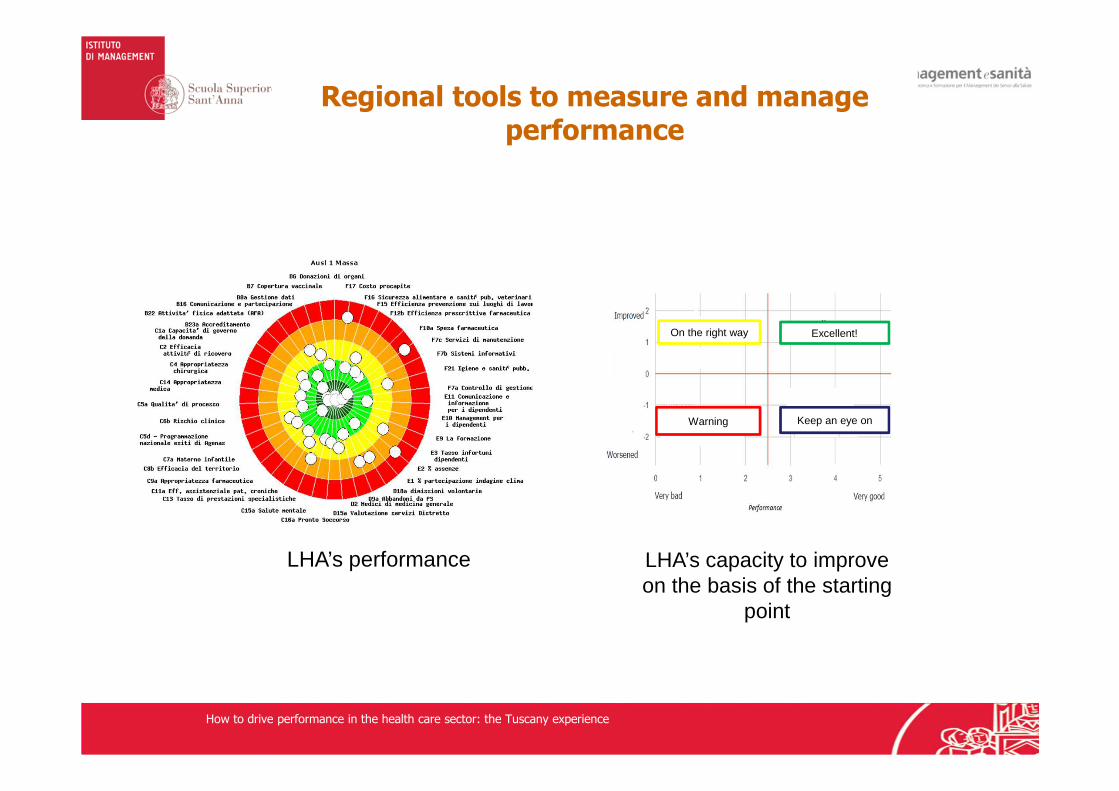
Regional tools to measure and manageperformance
LHA’s performance LHA’s capacity to improveon the basis of the starting
point
How to drive performance in the health care sector: the Tuscany experience
On the right way
Keep an eye onWarning
Excellent!

Hospital strategic map
On the right way
Keep an eye onWarning
Excellent!
GoodBad
Wor
sene
dIm
prov
ed
Evolution of Performance Management in Italy
Ausl Massa – Anno 2013
Measuring resultsand setting goals…
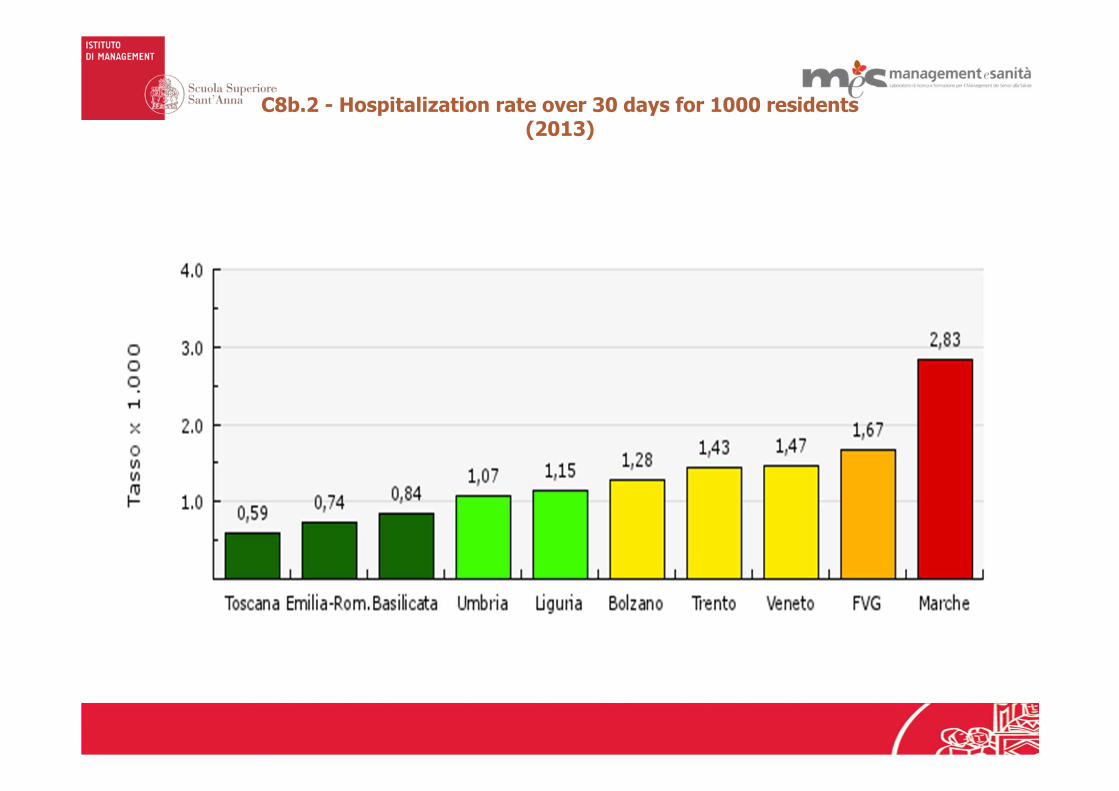
C8b.2 - Hospitalization rate over 30 days for 1000 residents(2013)

C8b.2 - Hospitalization rate over 30 days for 1000 residents(2013)
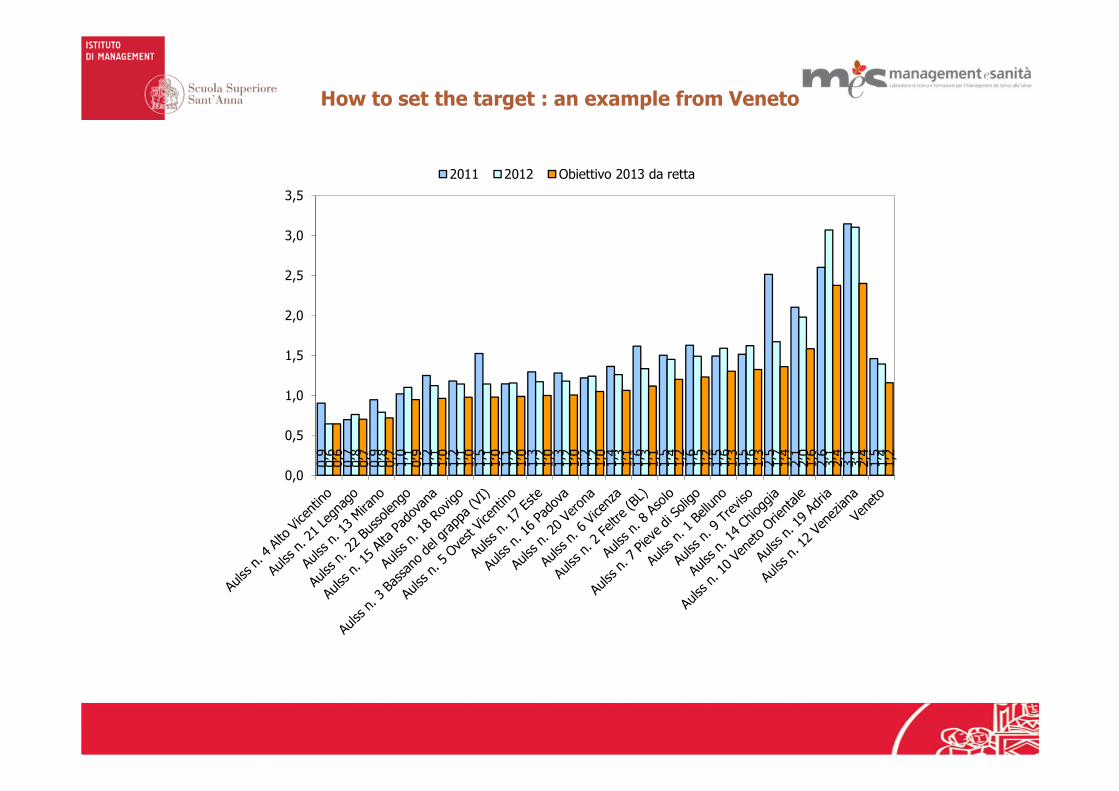
How to set the target : an example from Veneto
0,9
0,7
0,9
1,0
1,2
1,2
1,5
1,1
1,3
1,3
1,2
1,4
1,6
1,5
1,6
1,5
1,5
2,5
2,1
2,6
3,1
1,5
0,6
0,8
0,8
1,1
1,1
1,1
1,1
1,2
1,2
1,2
1,2
1,3
1,3
1,4
1,5
1,6
1,6
1,7
2,0
3,1
3,1
1,4
0,6
0,7
0,7
0,9
1,0
1,0
1,0
1,0
1,0
1,0
1,0
1,1
1,1
1,2
1,2
1,3
1,3
1,4
1,6
2,4
2,4
1,2
0,0
0,5
1,0
1,5
2,0
2,5
3,0
3,5
2011 2012 Obiettivo 2013 da retta

The reward system in the Tuscany Region
INTRINSIC
HEALTH PROFESSIONALS
Professional reputation
public disclosure of results
peer review mechanism
EXTRINSIC
CEO (managers)
Financial incentives
(that can achieve the 20% of the salary)
CEO’s rewarding system added emphasis on the Tuscan PES: incentivized indicators improve 2.7 times than other PES indicators. Moreover the results of a second model on 2008-2010 data show that incentivized indicators that keep into account the baseline performance
improve more than the others (OR 1.5).Due to this empirical evidence, in 2011 every Health Authority receives personalized target for each indicator of the Tuscan PES in order to gather the financial reward related to the overall
indicator.
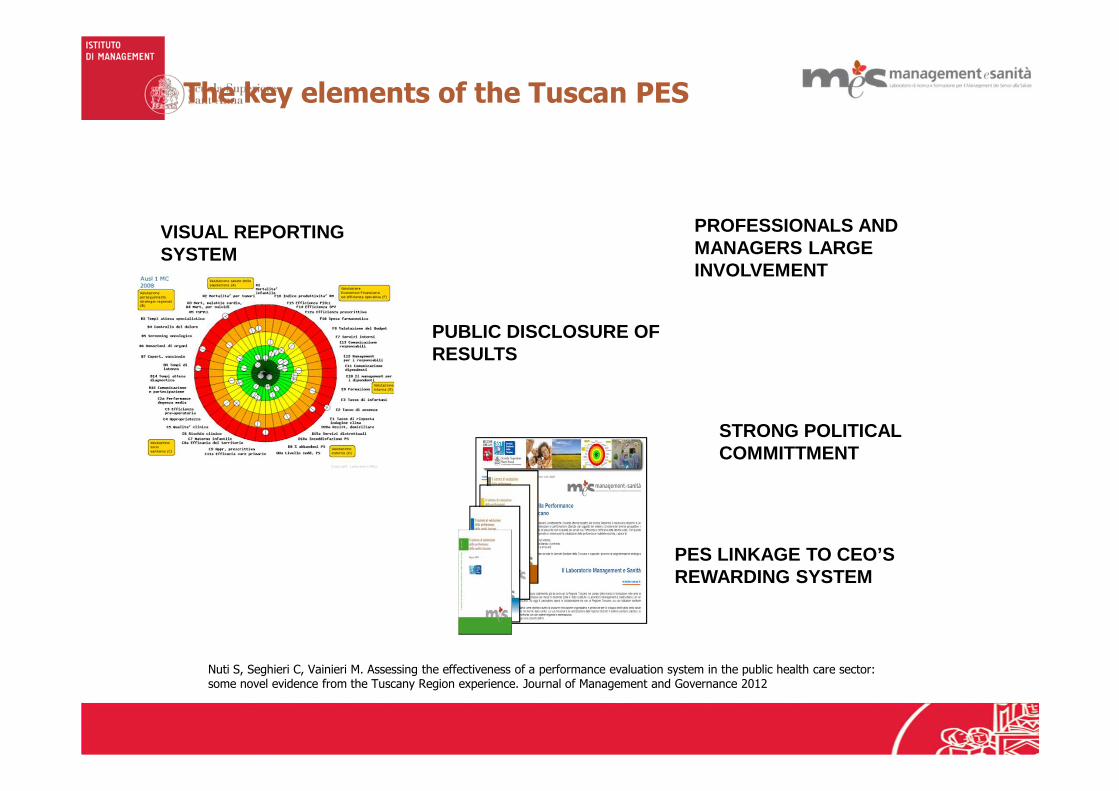
The key elements of the Tuscan PES
VISUAL REPORTING SYSTEM
PUBLIC DISCLOSURE OF RESULTS
PROFESSIONALS AND MANAGERS LARGE INVOLVEMENT
STRONG POLITICAL COMMITTMENT
PES LINKAGE TO CEO’S REWARDING SYSTEM
Nuti S, Seghieri C, Vainieri M. Assessing the effectiveness of a performance evaluation system in the public health care sector:some novel evidence from the Tuscany Region experience. Journal of Management and Governance 2012
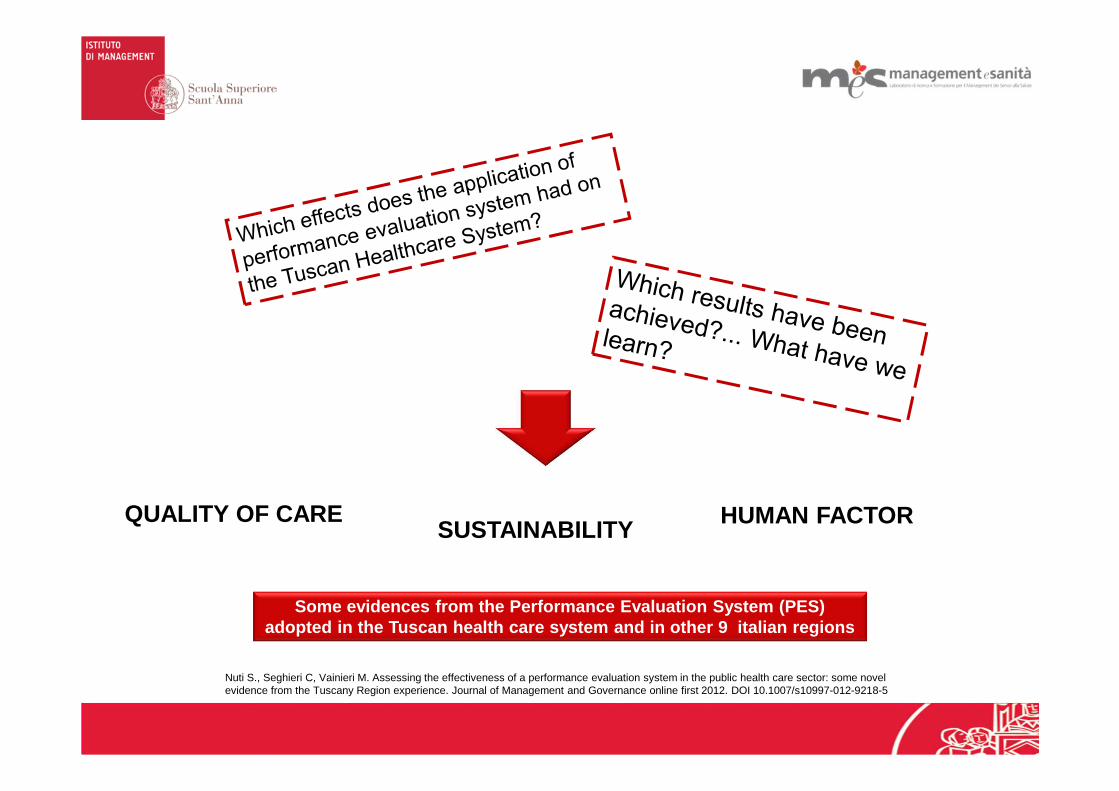
Some evidences from the Performance Evaluation Syst em (PES) adopted in the Tuscan health care system and in oth er 9 italian regions
Nuti S., Seghieri C, Vainieri M. Assessing the effectiveness of a performance evaluation system in the public health care sector: some novel evidence from the Tuscany Region experience. Journal of Management and Governance online first 2012. DOI 10.1007/s10997-012-9218-5
QUALITY OF CARESUSTAINABILITY
HUMAN FACTOR

Pinnarelli L., Nuti S,Sorge C, Davoli M.Fusco D,Agabiti N, Vainieri M, Perucci CA, 2012What drives hospital performance? The impact of comparative outcome evaluation of patients admitted for hip fracture in two Italian regions.BMJ Quality and Safety Vol.2
Strategies and results…

% improved indicators(2012-2013)
Basilicata: 84 indicators Emilia-Romagna: 95 indicators Liguria: 94 indicators
Veneto: 76 indicatorsToscana: 95 indicatorsTrento: 93 indicators

Plot per capita cost vs % overall performances (Tuscany, 2007-2013): quality comes first!
Correlation coeff. = - 0.38
P < 0.001
1400
1600
1800
2000
2200
cost
o pr
o-ca
pite
0 20 40 60 80performance
MORE QUALITY … MORE FINANCIAL SUSTAINABILITY
1.5
22.
53
3.5
perf
orm
anc
e m
edia
1400 1600 1800 2000 2200 2400costo sanitario pro - capite
SAME RESULT FOR ALL THE NETWORK

BENCHMARKING… FOR RESOURCES RE-ALLOCATION
The analysis based on benchmarking the performance of the LHAs allows the identification of the “possible” spaces of action with different
degrees of complexity.
Estimation of the resources that can be re-allocated to other services in the medium-long term
Priority of intervention in each
LHA
0
1
2
3
4
5
D1
5.2
D1
5.3
E6
.2D
3.3
E6
.1D
4.1
D2
.1D
4.2
D1
5.1
D3
.4E
7.2
E6
.3D
16
D1
7B
7.1
D3
.2B
4.2
D3
.1E
4.1 E9
E4
.2D
2.2 B3
E7
.3 F7
E7
.1E
4.3 E8
F8
B1
3E
5.1
E5
.3E
5.2
C5
.2F
15
B8
C4
.2D
10
aC
4.3 E2
B1
4D
8a
E1
F1
2a
.5B
9.1
.1F
14
.1B
4.1 E3
C7
.1 D9
C9
.2C
9.3
C1
1.2
F1
3C
7.2
C4
.1C
11
.3 C3
F1
2a
.6C
2a
B6
.2F
12
a.2
C9
.4B
6.1
F1
0C
11
.1C
5.1
F1
2a
.1C
4.4
C9
.1C
7.5
C5
.3C
7.3
C1
1.4
B7
.2F
12
a.4
F1
2a
.3
Va
luta
zio
ne
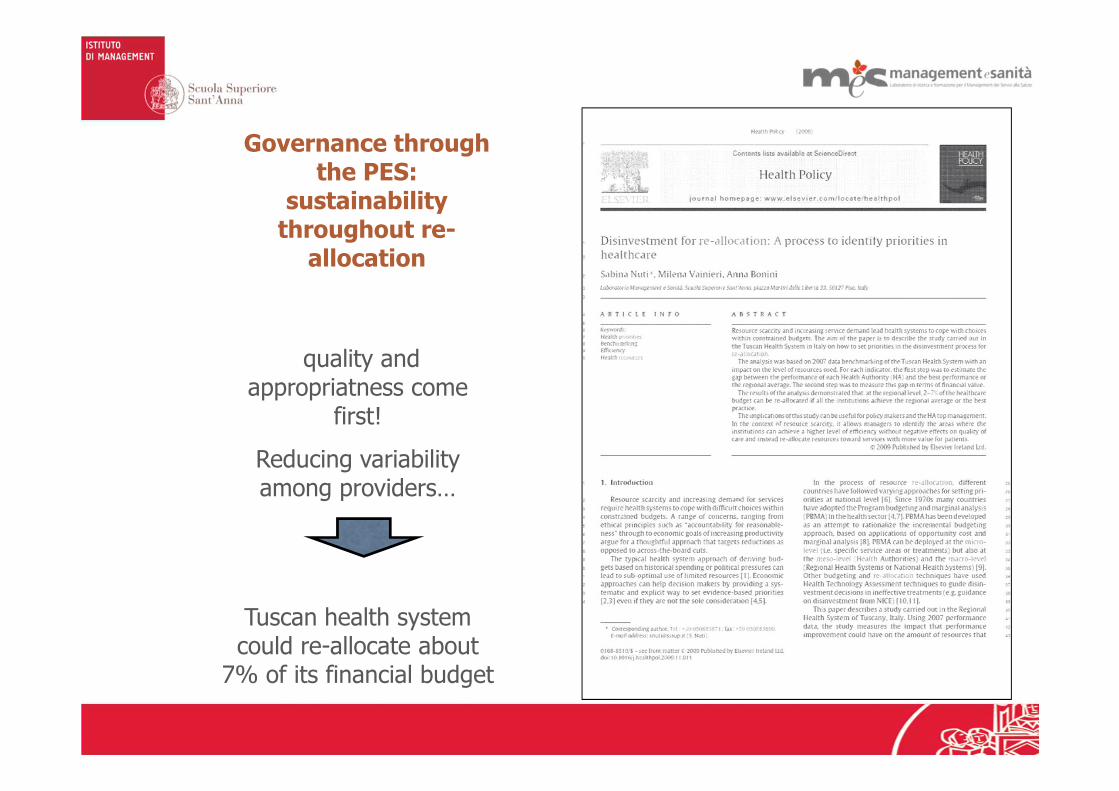
quality and appropriatness come
first!
Reducing variabilityamong providers…
Tuscan health systemcould re-allocate about
7% of its financial budget
Governance through the PES:
sustainability throughout re-
allocation
The performance evaluation system is able to drive improvement… but is it
also a tool to achieve equity?
The Pes shows that there is large variation not only between north and
south but also in each region.
Variation management across and within the regions should be included in the
governance system as a strategic tool at each level.

Including variation management in the governance tools…
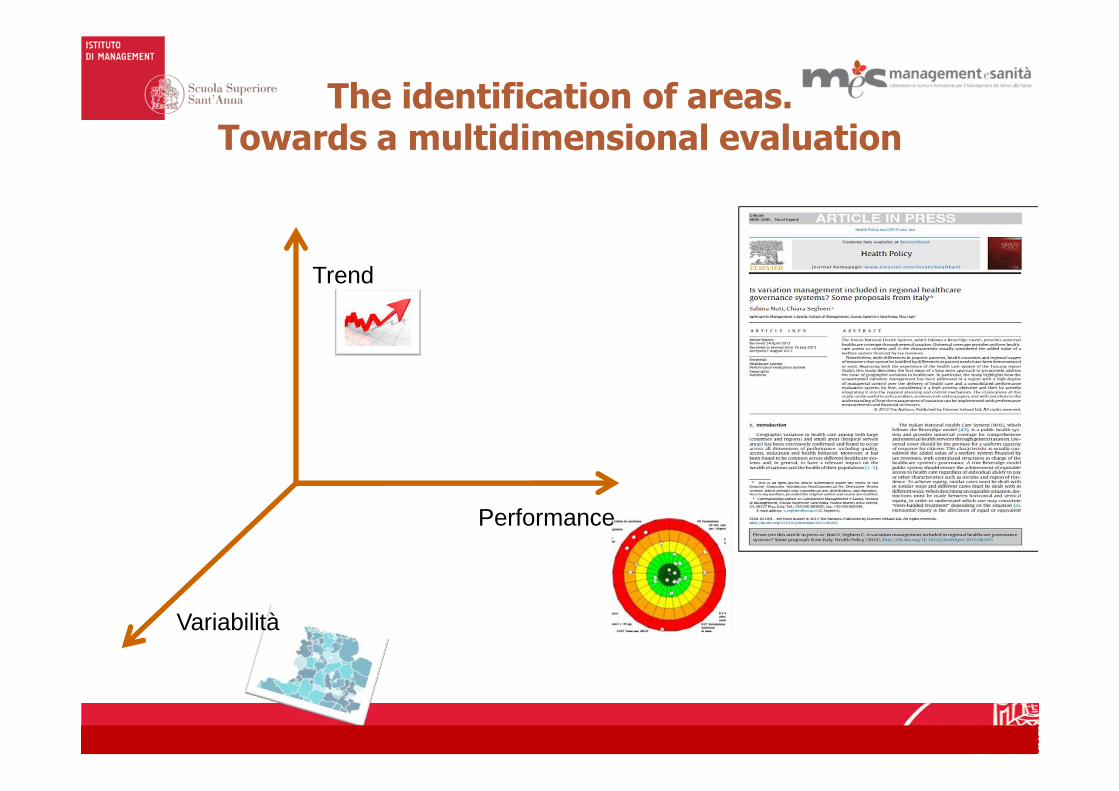
The identification of areas. Towards a multidimensional evaluation
Performance
Trend
Variabilità
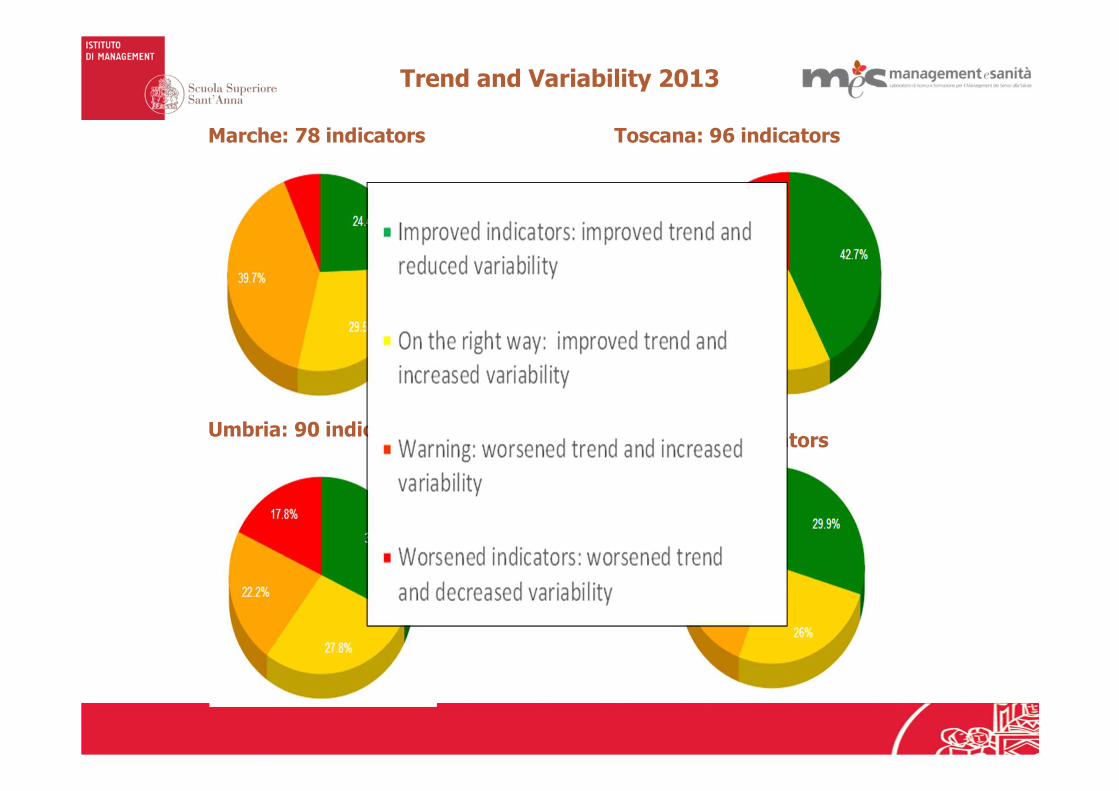
Marche: 78 indicators Toscana: 96 indicators
Umbria: 90 indicatorsVeneto: 77 indicators
Trend and Variability 2013
There are only three common elements to healthcare systems thathave improved on cost and quality over time
1. A public, specific statement of goals for improvement with a plan for reaching these goals
2. Public reporting of results with a clear link to improvement plans that become part of the strategy
3. Strong physician & clinical leadership of improvement efforts aligned to improvement goals, again supported by useful data
Strategies that fail to include these elements will fail an appeal to intrinsic incentives
Brown AD, Baker GR, Closson T, Sullivan TS. The journey towards high
performance and excellent quality. Healthcare Quartely, 2012;15

1. Murante A.M., Vainieri M., Rojas D.C., Nuti S. (2014), Does feedback influence patient - professional communication? Empirical evidence from Italy., Health Policy, Vol. 116, Issues 2–3, pp. 273–280.
2. Nuti S., Seghieri C. (2014), Is variation management included in regional healthcare governance systems? Some proposals from Italy , Health Policy, Vol. 114 , pp. 71–78.
3. Nuti S., Vainieri M. (2012), Managing waiting times in diagnostic medical imagining, British Medical Journal Open 2012;2:e001255.
4. Nuti S., Seghieri C., Vainieri M. (2012), Assessing the effectiveness of a performance evaluation system in the public health care sector: some novel evidence from the Tuscany Region experience, The Journal of Management and Governance, May 2012, n. pag. 10.
5. Nuti S., Seghieri C., Vainieri M., Zett S. (2012), Assessment and improvement of the Italian Healthcare system: first evidences from a pilot National performance evaluation system, Journal of Healthcare Management, Vol. 57, No. 3, pp. 182-199.
6. Pinnarelli L., Nuti S., Sorge C., Davoli M., Fusco D., Agabiti N., Vainieri M., Perucci C. (2012), What drives hospital performance? The impact of comparative outcome evaluation of patients admitted for hip fracture in two Italian regions., British Medical Journal BMJ Quality and Safety, Vol. 21, No. 2, pp. 127-134.
7. Nuti S., Daraio C., Speroni C., Vainieri M. (2011), Relationships between technical efficiency and the quality and costs of health care in Italy, International Journal for Quality in Health Care, Vol. 23, No. 3, pp. 324-330.
8. Report of Tuscany PES in english: www.meslab.sssup.it/en/index.php?page=report-2010
Bibliography