Using Mahalanobis Distance Measures for Bias Reduction · 6/5/2013 1 Using Mahalanobis Distance...
13
6/5/2013 1 Using Mahalanobis Distance Measures for Bias Reduction Melissa Cominole, Andy Peytchev, Dan Pratt, Bryan Shepherd, Peter Siegel, David Wilson, Jennifer Wine RTI International 2
Transcript of Using Mahalanobis Distance Measures for Bias Reduction · 6/5/2013 1 Using Mahalanobis Distance...

6/5/2013
1
Using Mahalanobis Distance
Measures for Bias Reduction
Melissa Cominole, Andy Peytchev, Dan Pratt, Bryan
Shepherd, Peter Siegel, David Wilson, Jennifer Wine
RTI International
2

6/5/2013
2
Overview
• Approach
– Use Mahalanobis distance measure to identify cases among
nonrespondents most unlike those who have already responded
– Offer treatments/interventions to targeted cases
• Rationale
– Strategic use of resources to focus on “bias-contributing” cases
3
Research Questions
1. Are treatments effective in increasing response among
targeted cases (as identified by Mahalanobis)?
2. How does the distribution of the Mahalanobis distance
measure change over the course of data collection?
3. Is there a reduction in nonresponse bias as a result of
this approach?
4
6/5/2013
3
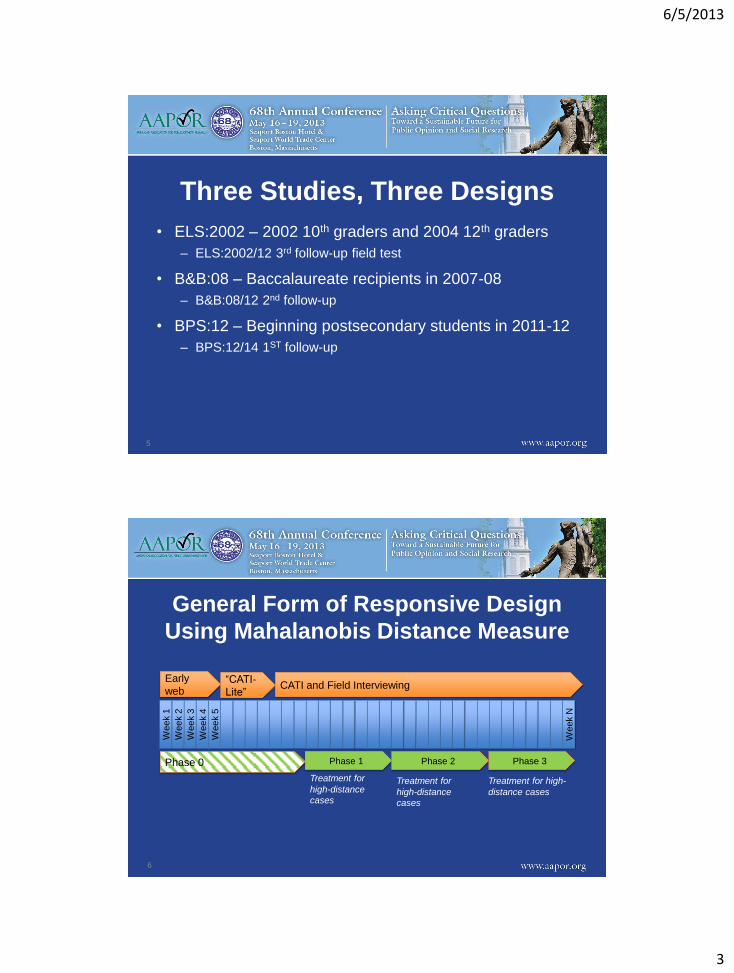
Three Studies, Three Designs
• ELS:2002 – 2002 10th graders and 2004 12th graders
– ELS:2002/12 3rd follow-up field test
• B&B:08 – Baccalaureate recipients in 2007-08
– B&B:08/12 2nd follow-up
• BPS:12 – Beginning postsecondary students in 2011-12
– BPS:12/14 1ST follow-up
5
Week 1
Week 2
Week 3
Week 4
Week 5
Week N
Early
web “CATI-
Lite” CATI and Field Interviewing
Phase 1
General Form of Responsive Design
Using Mahalanobis Distance Measure
Phase 2 Phase 3
6
Treatment for
high-distance
cases
Treatment for
high-distance
cases
Treatment for high-
distance cases
Phase 0
6/5/2013
4
Responsive Design Using Mahalanobis:
Variations Across Studies
• Nature of population
– Heterogeneity of population
– How responsive to survey
– Ease of locating
• Mahalanobis model
– Input variables
– Sample distributions of M
• Timing of phases
– When to implement first
phase
– Length of phases
• Sequential treatments
– Increased incentives
– Prepaid incentives
– Contacting strategies
– Abbreviated interview
– Field interviewing
7
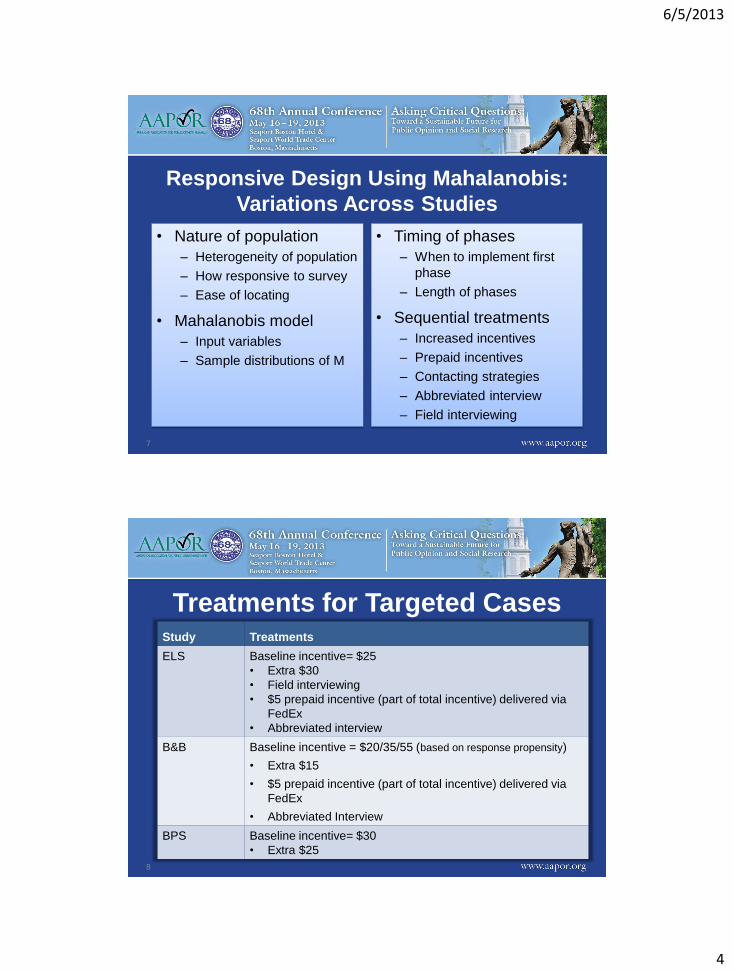
Treatments for Targeted Cases Study Treatments
ELS Baseline incentive= $25
• Extra $30
• Field interviewing
• $5 prepaid incentive (part of total incentive) delivered via
FedEx
• Abbreviated interview
B&B Baseline incentive = $20/35/55 (based on response propensity)
• Extra $15
• $5 prepaid incentive (part of total incentive) delivered via
FedEx
• Abbreviated Interview
BPS Baseline incentive= $30
• Extra $25
8
6/5/2013
5
9
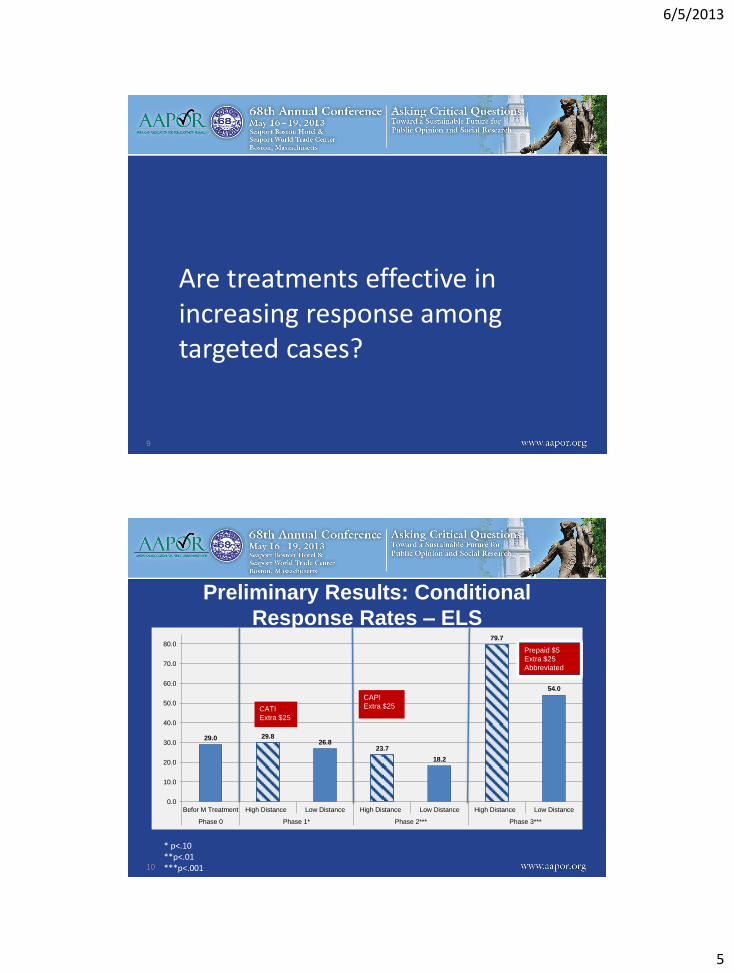
Are treatments effective in increasing response among targeted cases?
Preliminary Results: Conditional
Response Rates – ELS
10
29.0 29.8 26.8
23.7
18.2
79.7
54.0
0.0
10.0
20.0
30.0
40.0
50.0
60.0
70.0
80.0
Befor M Treatment High Distance Low Distance High Distance Low Distance High Distance Low Distance
Phase 0 Phase 1* Phase 2*** Phase 3***
CATI
Extra $25
CAPI
Extra $25
Prepaid $5
Extra $25
Abbreviated
* p<.10 **p<.01 ***p<.001

6/5/2013
6
Preliminary Results: Conditional
Response Rates – B&B
11
Extra $15
Prepaid
$5, FedEx Abbreviated
Interview
* p<.10 **p<.01 ***p<.001
Preliminary Results: Response
Rates – BPS (through Phase 1)
12
Extra $25
36.3
8.8
6.6
9.7
0.0
5.0
10.0
15.0
20.0
25.0
30.0
35.0
40.0
High Distance treatment(n=340)
High Distance Control(n=300)
Low Distance (n=1,500)
Before M Treatment Phase 1
Extra $25
p >.05

6/5/2013
7
13
How does the Mahalanobis distance distribution change over time?
ELS B&B
0
10
20
30
40
50
60
70
0 2000 4000 6000
Distribution of M Among Remaining
Nonrespondents at Beginning of Phase 1
BPS
0
10
20
30
40
50
60
70
0 500 1000 1500 2000 2500
14
0
10
20
30
40
50
60
70
1 2001 4001 6001 8001 10001

6/5/2013
8
Distribution of M Over Time: ELS
6.6 6.9 7.1
6.8 7.1
6.1
11.3
8.6
6.6
0.0
2.0
4.0
6.0
8.0
10.0
12.0
Phase 1 Phase 2 Phase 3
Average M for respondents
Average M for all nonrespondents
Average M for high distance casesselected for treatment
15
Distribution of M Over Time:
B&B
4.5 4.5 4.5
6.1 6.0 5.9
0.0
2.0
4.0
6.0
8.0
10.0
12.0
Phase 1 Phase 2 Phase 3
Average M for respondentsAverage M for all nonrespondentsAverage M for high distance treatment nonrespondentsAverage M for high diastance control nonrespondents
16

6/5/2013
9
Ranked Distribution of M by Phase: B&B
17
0
100
200
300
400
500
600
700
800
900
Phase 1Treatment(n=820)
Phase 1 toPhase 2
Respondent(n=130)
Phase 2Treatment(n=630)
Phase 2 toPhase 3
Respondent(n=110)
Phase 3Treatment(n=530)
Phase 3 to EndDC
Respondent(n=140)
Cases R
an
ked
by M
Valu
e
q1
min
median
max
q3
Distribution of M Over Time: BPS
18
8.1 7.8
9.4 8.9
12.3
11.2
12.6
11.5
0
2
4
6
8
10
12
14
Phase 1 Phase 2
Average M for respondents Average M for all nonrespondents
Average M for high distance control nonrespondents Average M for high distance treatment nonrespondents

6/5/2013
10
19
Is there a reduction in nonresponse bias as a result of this approach?
Analysis Plans
• Estimate nonresponse bias for a variety of
estimates using all respondents
• Did the amount of nonresponse bias change
when the targeted respondents were included?
20
6/5/2013
11
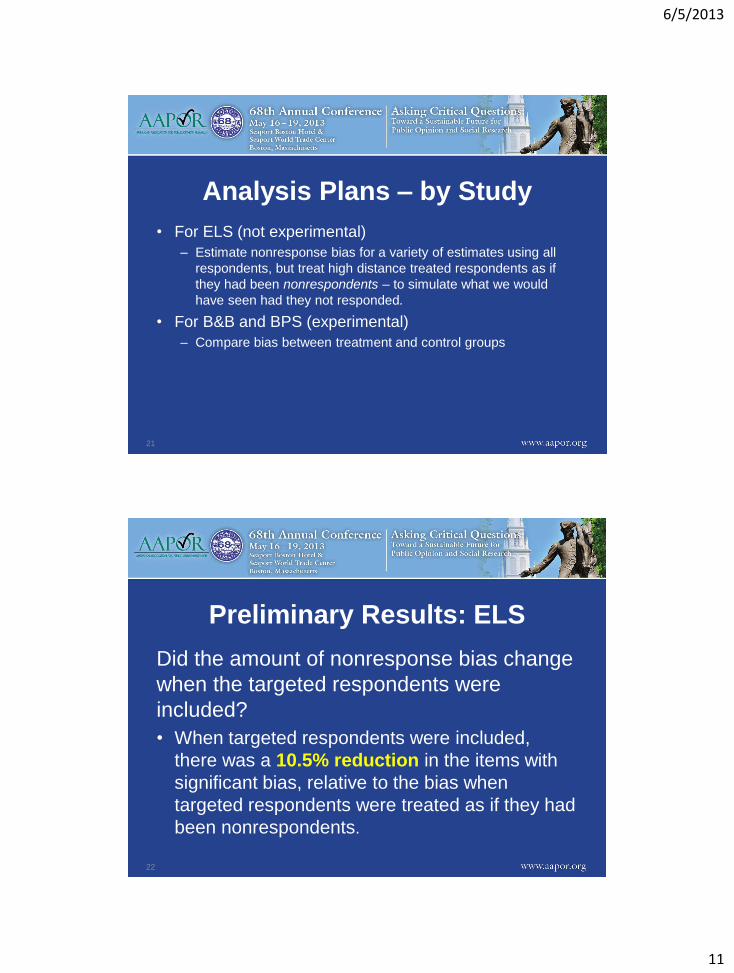
Analysis Plans – by Study
• For ELS (not experimental)
– Estimate nonresponse bias for a variety of estimates using all
respondents, but treat high distance treated respondents as if
they had been nonrespondents – to simulate what we would
have seen had they not responded.
• For B&B and BPS (experimental)
– Compare bias between treatment and control groups
21
Preliminary Results: ELS
Did the amount of nonresponse bias change
when the targeted respondents were
included?
• When targeted respondents were included,
there was a 10.5% reduction in the items with
significant bias, relative to the bias when
targeted respondents were treated as if they had
been nonrespondents.
22
6/5/2013
12
Practical considerations
• This approach is adaptable to many types of studies
• Know your sample
• Model building requires careful consideration
• Budget
• Schedule
• Treatment options
23
Future Directions
• Continuing to explore alternative approaches and
implementations
• Propensity-based measure that focuses on substantive
data
• Investigate differential impacts of treatments for targeted
cases
24

6/5/2013
13
Conclusion • We can identify, target, and increase response
among high distance cases.
• The difference between average M among high
distance nonrespondents and respondents can
be reduced over the course of data collection.
• Work still to be done to evaluate whether bias
was reduced.
25
Contact Information
Melissa Cominole
RTI International
919-990-8456
26