Using firm-level micro data for evidence based policy making
22
Using Firm-level micro data for evidence-based policy making OECD Productivity Network Juan Rebolledo October, 2016 1
-
Upload
structuralpolicyanalysis -
Category
Economy & Finance
-
view
304 -
download
1
Transcript of Using firm-level micro data for evidence based policy making

Using Firm-level micro data for evidence-based
policy making
OECD Productivity Network
Juan Rebolledo
October, 20161
Research based on ENAPROCE’s policy-relevant data.
Understanding the Productivity gaps across
firms, sectors, and economic regions in Mexico.
Mexico’s National Micro, Small and Medium Enterprise
Productivity and Competitiveness Survey, the first effort to
measure “hard-to-observe” skills at the Firm-level.
INDEX
2

Productivity and low economic growth in Mexico
Total Factor Productivity decline in Mexico
(1990-2014)***
(***) Source: INEGI.
90
92
94
96
98
100
102
1990
1991
1992
1993
1994
1995
1996
1997
1998
1999
2000
2001
2002
2003
2004
2005
2006
2007
2008
2009
2010
2011
2012
2013
2014
Average Growth in GDP and Productivity
(Annual growth rate, 1980-2014)
(*) Source: Penn World Table 8.1 (1980-2011) and The Conference Board (2011-2014).
(**) Source: Penn World Table 8.1 (1980-1990) and INEGI (1990-2015), based on KLEMS methodology.
6.4%
4.0%4.6%
2.5%
1.2%0.6%
-0.2%-0.8%
Korea* Ireland* Chile* Mexico**
GDP Productivity
Total Factor Productivity (TFP) has declined
since 1990. In 2014 it was 7.8% lower than in 1990, an
annual fall of 0.4%, on average.
3

National
AGS
BCBCS
CHI
CH
COA
COL
DF
DURGUA
GUE
HID
JAL
MEX MICMOR
NAY
NL
OAX
PUE
QRO
QR
SLPSIN
SON
TAB
TAM
TLAX
VERYUCZAC
70
170
270
370
470
570
670
0 5 10 15 20 25 30 35L
abo
ur
pro
duct
ivit
y (G
DP
/E
mp
loye
d p
op
ula
tio
n)
% of population living in extreme poverty
Labour productivity and poverty
Productivity gaps and poverty by state
In 2014,
11/32states were above the national
average.
The 5 most productive states were
3xmore productive than the
5 least productive states.
National Average
Source: INEGI and CONAPO. 4

0.5 times the national average
0.6 times the national average
0.7-0.8 times the national average
0.9 times the national average
Above the national average
In Mexico, the Northern border is 2.5x more productive than the
South and has 2x more formal employment.
Labour productivity by state
Source: INEGI.
57.20%
40.43%
80.07%
National Average Northern Border South
Informality (% of working population)
2x
The inefficient allocation of factors of
production results in wide productivity gaps In Mexico,
employment in
manufactures
along the northern
border (20.4%) is
more than twice
that of the south
(9.4%).
5

Firm-endogenous factors may also
explain low productivityManagerial practices
Innovation
Production chain integration
TrainingMSME
productivity
Financing
However, recent literature
suggests that other non-given
firm-level characteristics,
such as:
managerial practices,
training,
use of ICTs,
financial access,
better capital or innovation
also influence firm-level
productivity2.
1For example: La Porta and Shleifer (2008), Gennaioli (2013) and Hurst and Pugsley (2011).2 Bloom et al (2010).
(*) Informality could be considered either endogenous or exogenous, or both.
Most of the empirical
evidence that explains the
low productivity of firms
across countries, especially
among MSMEs, has
studied exogenous factors
that influence firm
productivity, such as the
quality of infrastructure,
informality*, government
regulations, trade policies,
and levels of human
capital1.
6
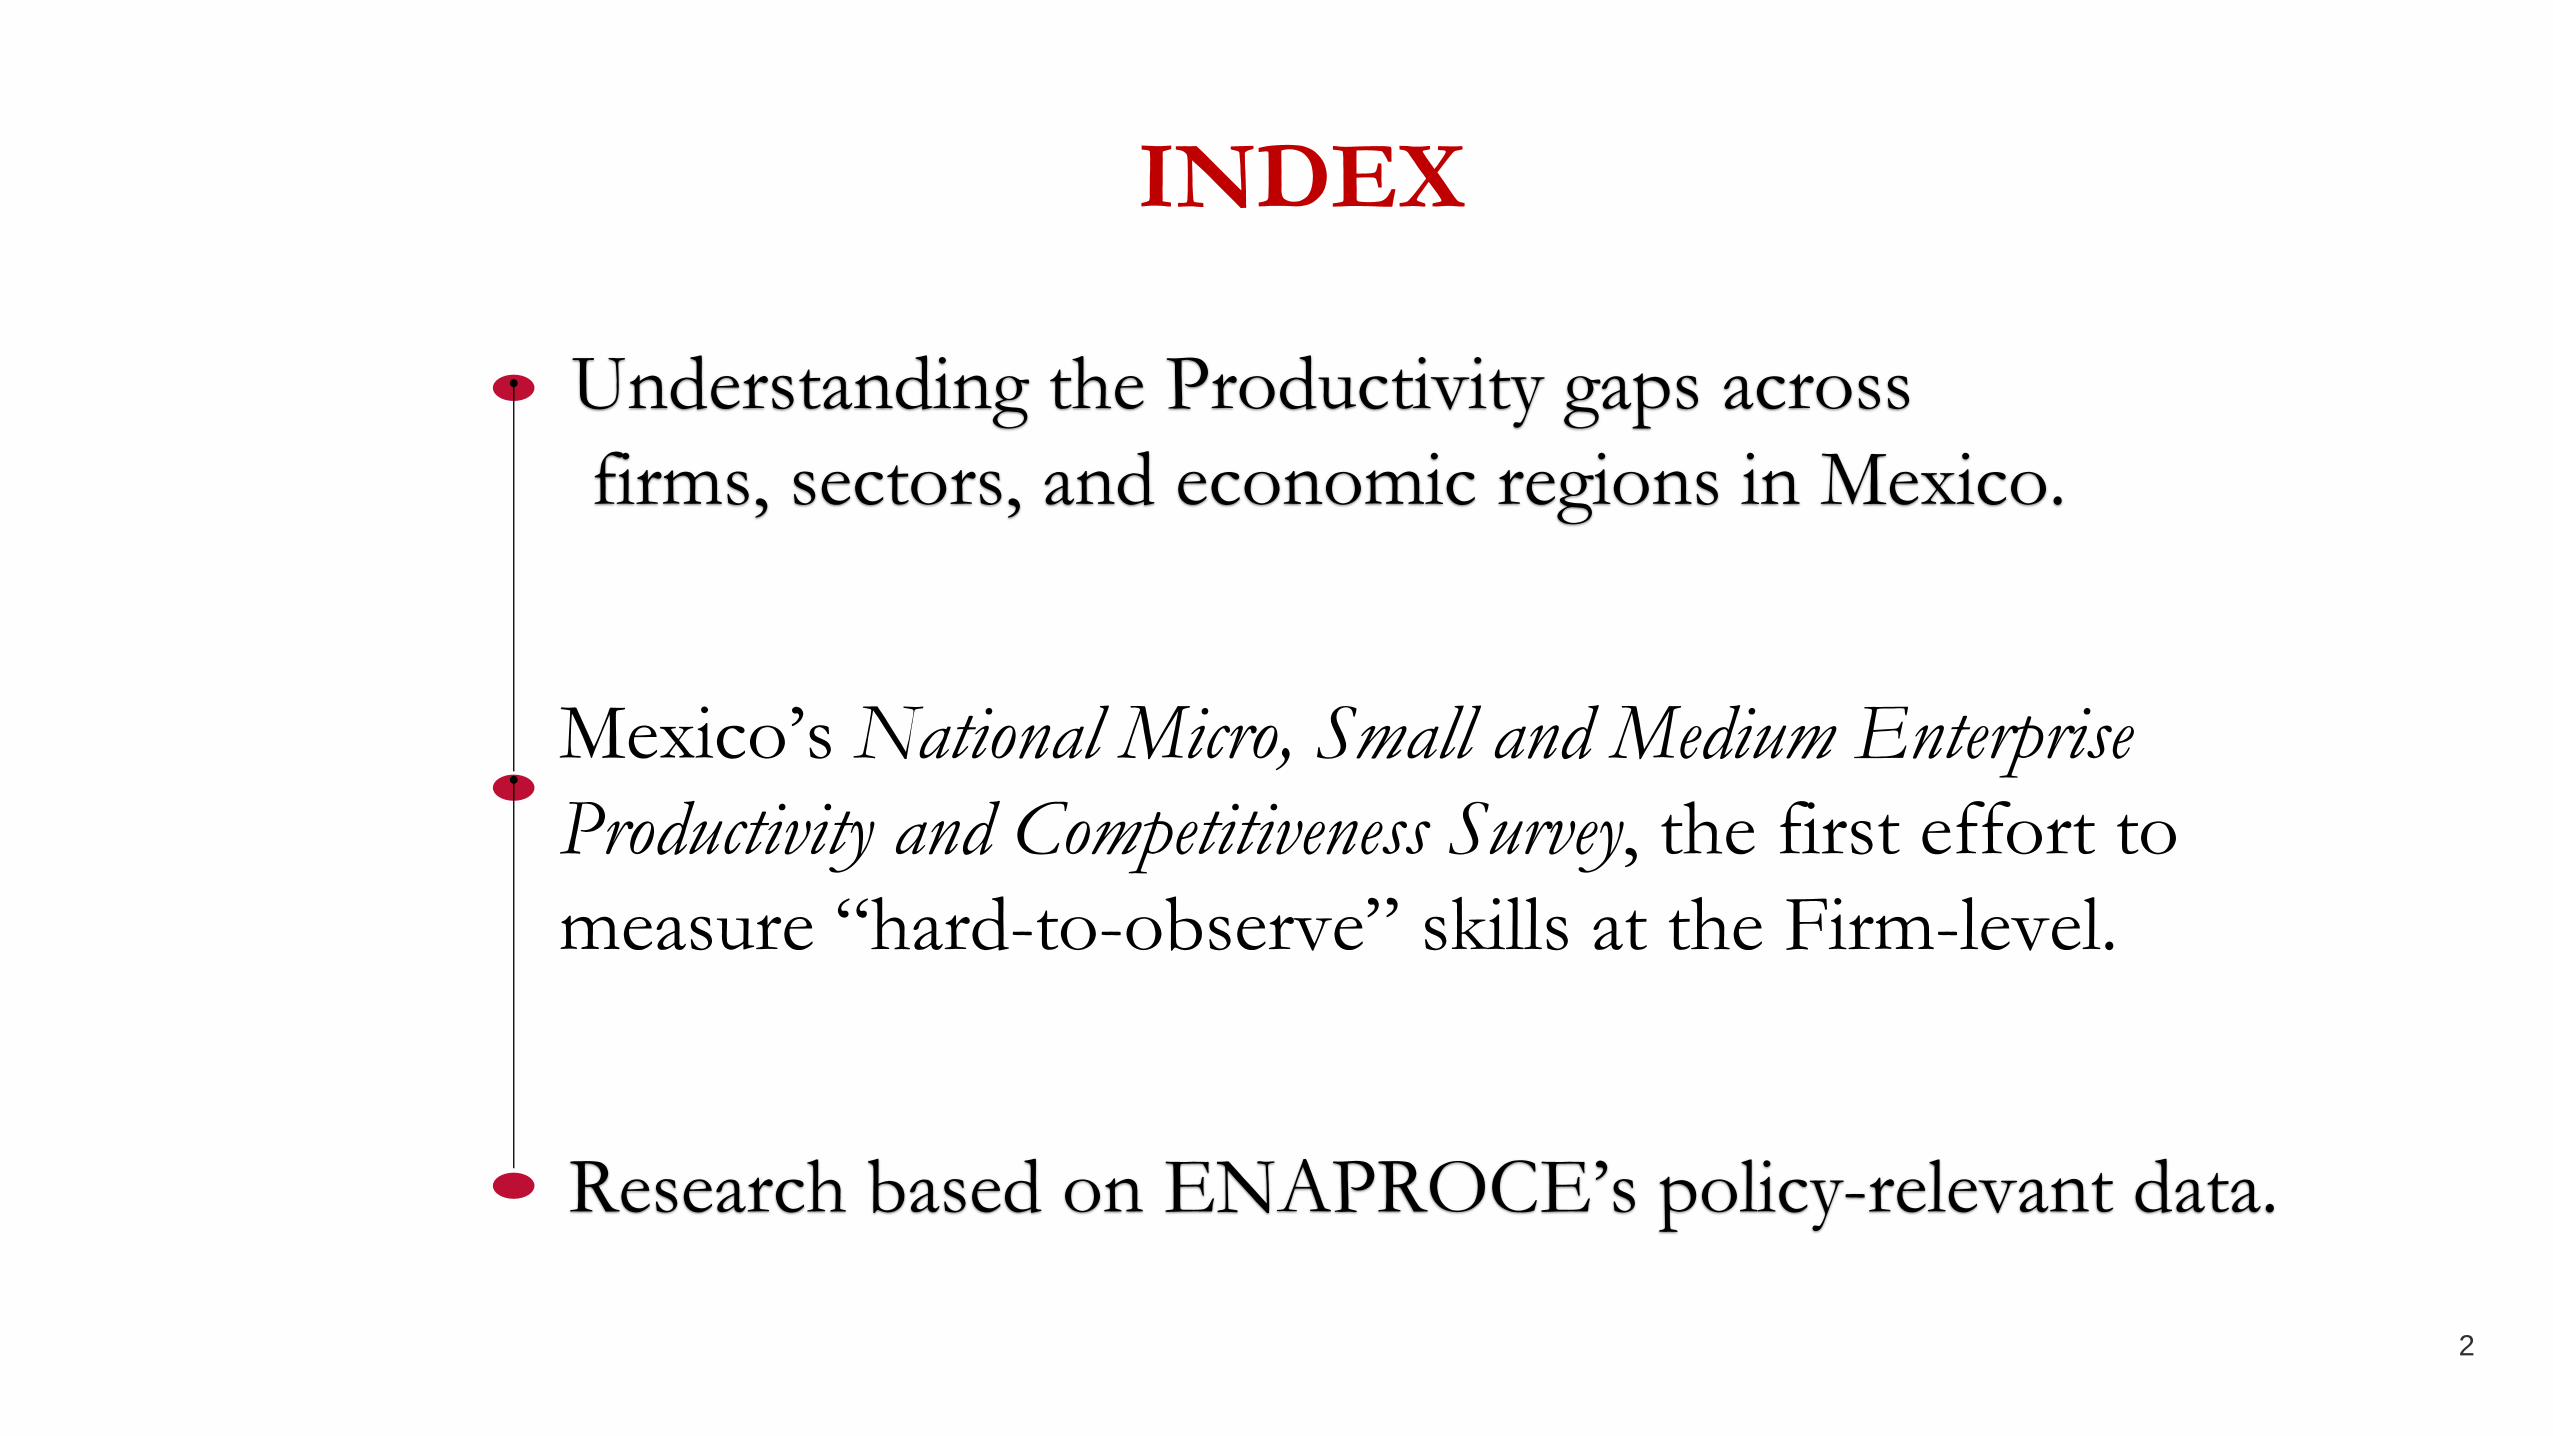
The productivity of Firms in developing countries
appears to be extremely low and disperse
Management
PracticesPoor management practices
have a substantial negative
impact on productivity in
developing countries. Latin
American countries have
significantly lower average
management scores. In
India, training on basic
management practices led
to a 50% reduction in
quality defects in 3 months1.
Delegation of
Decision MakingThe lack of delegation of
decision making negatively
impacts the productivity of
firms in developing
countries. In some, a sign-
off from owners is required
for every purchase, while
managers in Japan and the
US can make investments
of up to $50,000 directly1.
Human Capital
Firms in cities with small
growth rates in their college
graduate populations miss
out on potential human
capital externalities and have
lower productivity rates after
controlling for firms’ actual
levels of human capital2.
1Bloom et al. (2010)2Moretti (2004) 3Suresh De Mel, McKenzie, and Woodruff (2007a); Banerjee and Duflo (2008)4De Fuentes et al. (2004)
*KIBS refers to Knowledge-intensive based services.
ENAPROCE is a recent effort by the Mexican government to provide firm-level micro
data precisely on these factors that may explain productivity.
Relevant evidence points to the following factors:
Financial Constraints
Micro and small enterprises in
developing countries have
difficulty accessing formal
financial resources, despite
their marginal returns being
higher than average interest
rates. An experiment in Sri
Lanka found a causal
relationship between firms’
access to finance and growth
in their profits or sales3.
Innovation
An IDB discussion paper
finds that only 13.7% of
Mexican firms surveyed
reported having innovated.
This was lower for firms in
the services (6.6%) and KIBS
(10.5%) sectors*. It also
found intensive investment in
innovation has a positive
effect on labour productivity
and is unrelated to firm size4.
7

96% Response RateStratification by sector,
region, and firm size25,456 firms in sample
ENAPROCE characteristics — 2015 baseline for panel dataThe information provided by ENAPROCE enables researchers to study the determining factors
behind the lagging productivity of MSMEs in the country.
managerial practices financing
government support
innovation
training
Main themes
use of ICTs
Source: ENAPROCE 2015.
production chain integration
business atmosphere
Productivity measurement: Törnqvist changing-weight index
A Törnqvist formula expresses the
change in multifactor productivity as
the difference between the rate of
change in output and the weighted
average of the rates of change in the
shares and prices of inputs.
human capital
8

ENAPROCE representativeness
Source: ENAPROCE and World Bank.
• Large sectors
(industry, retail and
services)
• Size
• Strategic sectors*
**Regions are defined as follows:
North: Baja California, Baja California Sur, Sinaloa, Sonora, Coahuila, Chihuahua, Durango, Nuevo León and Tamaulipas West:
Aguascalientes, Colima, Guanajuato, Jalisco, Michoacán, Nayarit, San Luis Potosí and Zacatecas
Center: Distrito Federal, Hidalgo, México, Morelos, Querétaro and Tlaxcala;
South: Campeche, Chiapas, Guerrero, Oaxaca, Puebla, Quintana Roo, Tabasco, Veracruz and Yucatán
State
Level
National
Level
Regional
Level**
• SMEs
• Strategic sectors*
• Micro enterprises
• Strategic sectors*
Observation unit:
Firm
Some firms have one or more
establishments under the same
business name. To account for
location, the parent company or
the establishment with the biggest
number of employees is
considered.
*Strategic sectors:
• Electrical appliances
• Communication and electronics equipment
• Ground transportation equipment
• Medical equipment
• Textile industry
• Plastics and rubber
• Wood products
• Construction products
• Business support services
• Tourism services
• Pharmaceutical products
• Chemical industry
• R&D services
9

Firm heterogeneity by size
305%
200%
274%
Retail Manufactures Services
Total Factor Productivity heterogeneity by sector
(Gap between percentile 10 and percentile 90)Total Factor Productivity Kernel density by firm size
Micro
Small
Medium
Large
Source: ENAPROCE and World Bank.
10

Preliminary data analysis
- Relatives as owners of businesses
- Relatives as firm decision-makers
Family business practices
- Target-based planning
- Incentives and salaries
- Employee monitoring
Managerial practices
- Share of uneducated workers
- Share of workers with various levels of
educational attainment
Higher education
Innovation
- Patent registration
- Use of ICTs
- Presence of innovation spending
- Innovation spending per worker
- Presence of certifications
- Presence of financing
- Sources of financing
- Costs of financing
Financing
11

Firm characteristics prevalent in Mexico are
associated with higher productivity
Family
business
These practices are negatively
correlated with higher firm
productivity. Their presence
reduces firm productivity by almost
Dependent variable: ln(TFP) (1) (2) (3) (4) (5)
Firm characteristics
Share of workers with HE0.0004
(0.0000)***
0.0004
(0.0000)***
0.0005
(0.0001)***
.0004
(.0000)***
.0004
(.0000)***
Family practices-0.15
(0.0230)***
-0.19
(0.0473)***
-.15
(.0230)***
-.14
(.0235)***
Survey indices
Managerial practices z-score0.11
(0.0166)***
Financing z-score.04
(.0081)***
Innovation z-score.09
(.0089)***
Note: all regressions control for K, L, and the state in which the firm is established.15%The various indices are constructed using factor analysis. Firm weights
were utilized, and in all cases, only the first factor was considered. The
factor analysis strongly suggests that the indices are accurate
representations of the underlying variables.
Small and Medium Firms
12
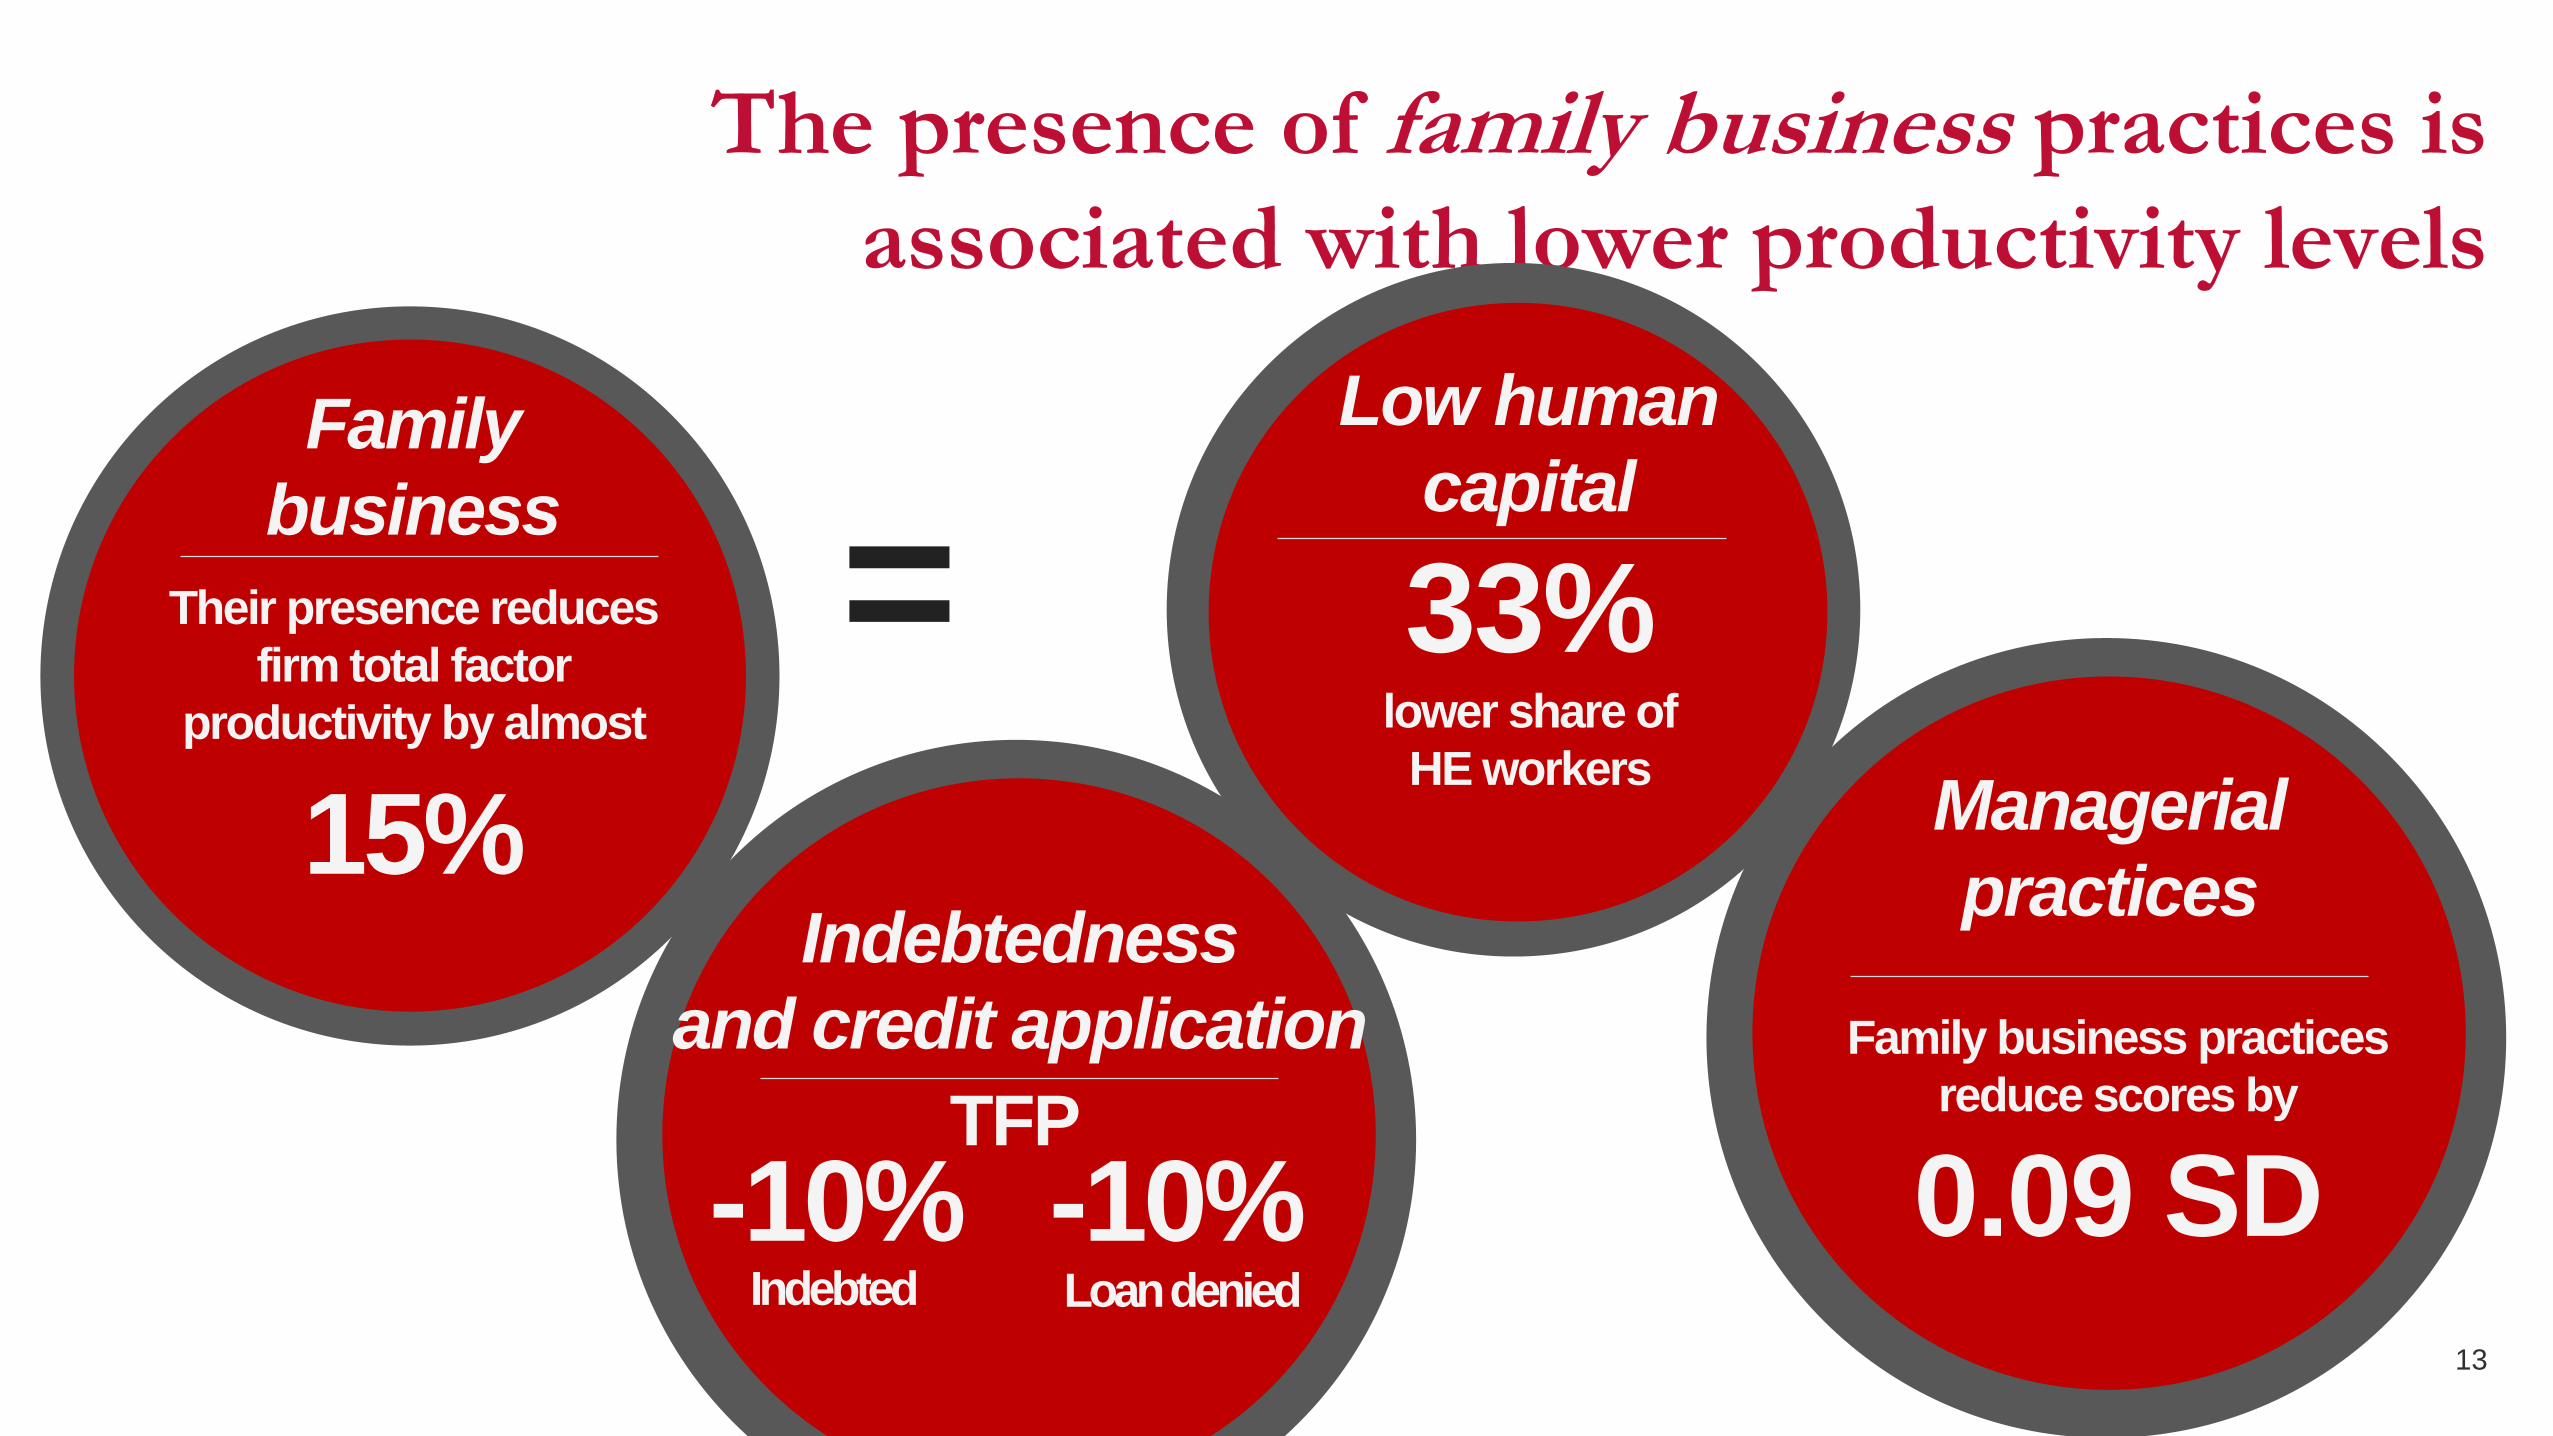
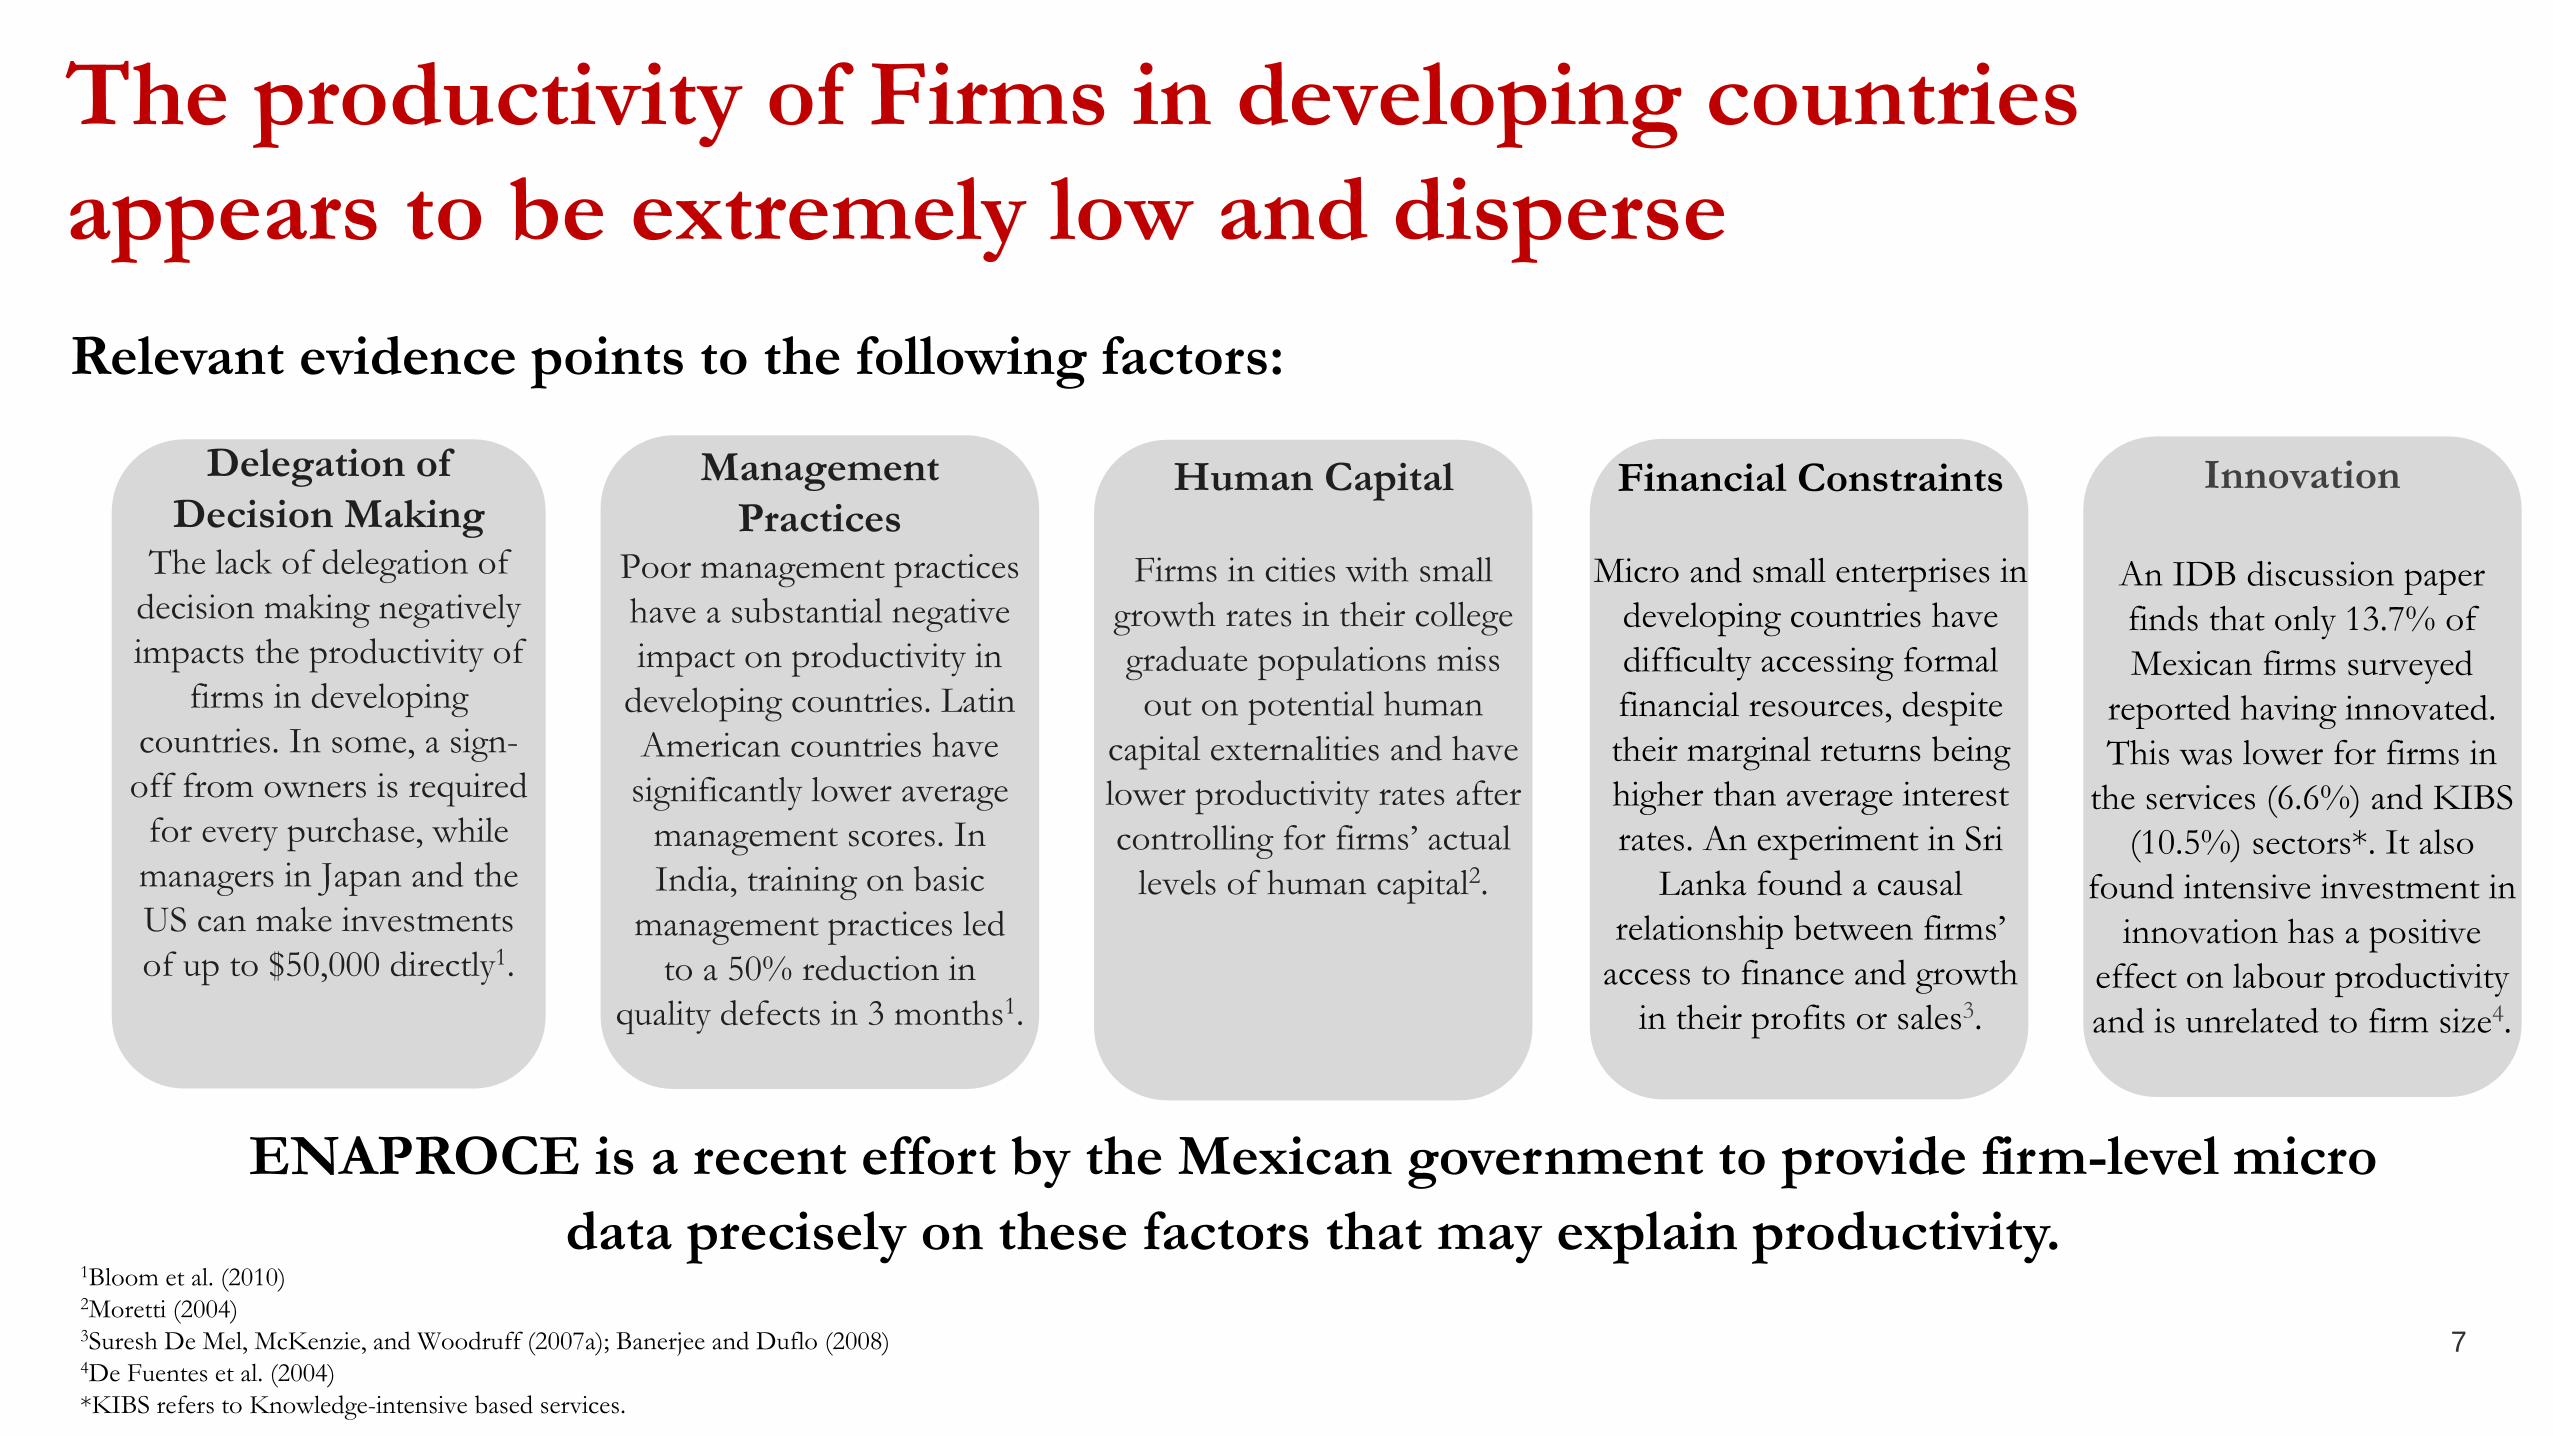
Family
business
Their presence reduces
firm total factor
productivity by almost
The presence of family business practices is
associated with lower productivity levels
Low human
capital
33% lower share of
HE workers
Indebtedness
and credit application
TFP
-10%
=15%
Indebted
Family business practices
reduce scores by
0.09 SD
Managerial
practices
-10%Loan denied
13

0
0.2
0.4
0.6
0.8
1 2 3 4 5 6 7 8 9 10
Pro
duct
ivit
y
Managerial practices decile
Productivity by managerial practices score decile
Relationship between managerial practices, innovation
and productivity
Firms that score higher on the managerial practices index tend to be more
productive and spend more on innovation per worker.
Source: ENAPROCE and World Bank.Source: World Management Survey, Management Matters, Manufacturing Report (2014).
Mexico
0%
5%
10%
15%
20%
1 2 3 4 5 6 7 8 9 10
Sh
are
of
firm
s th
at e
xpo
rt
Managerial practices decile
Share of firms that export by managerial practicesscore decile
14
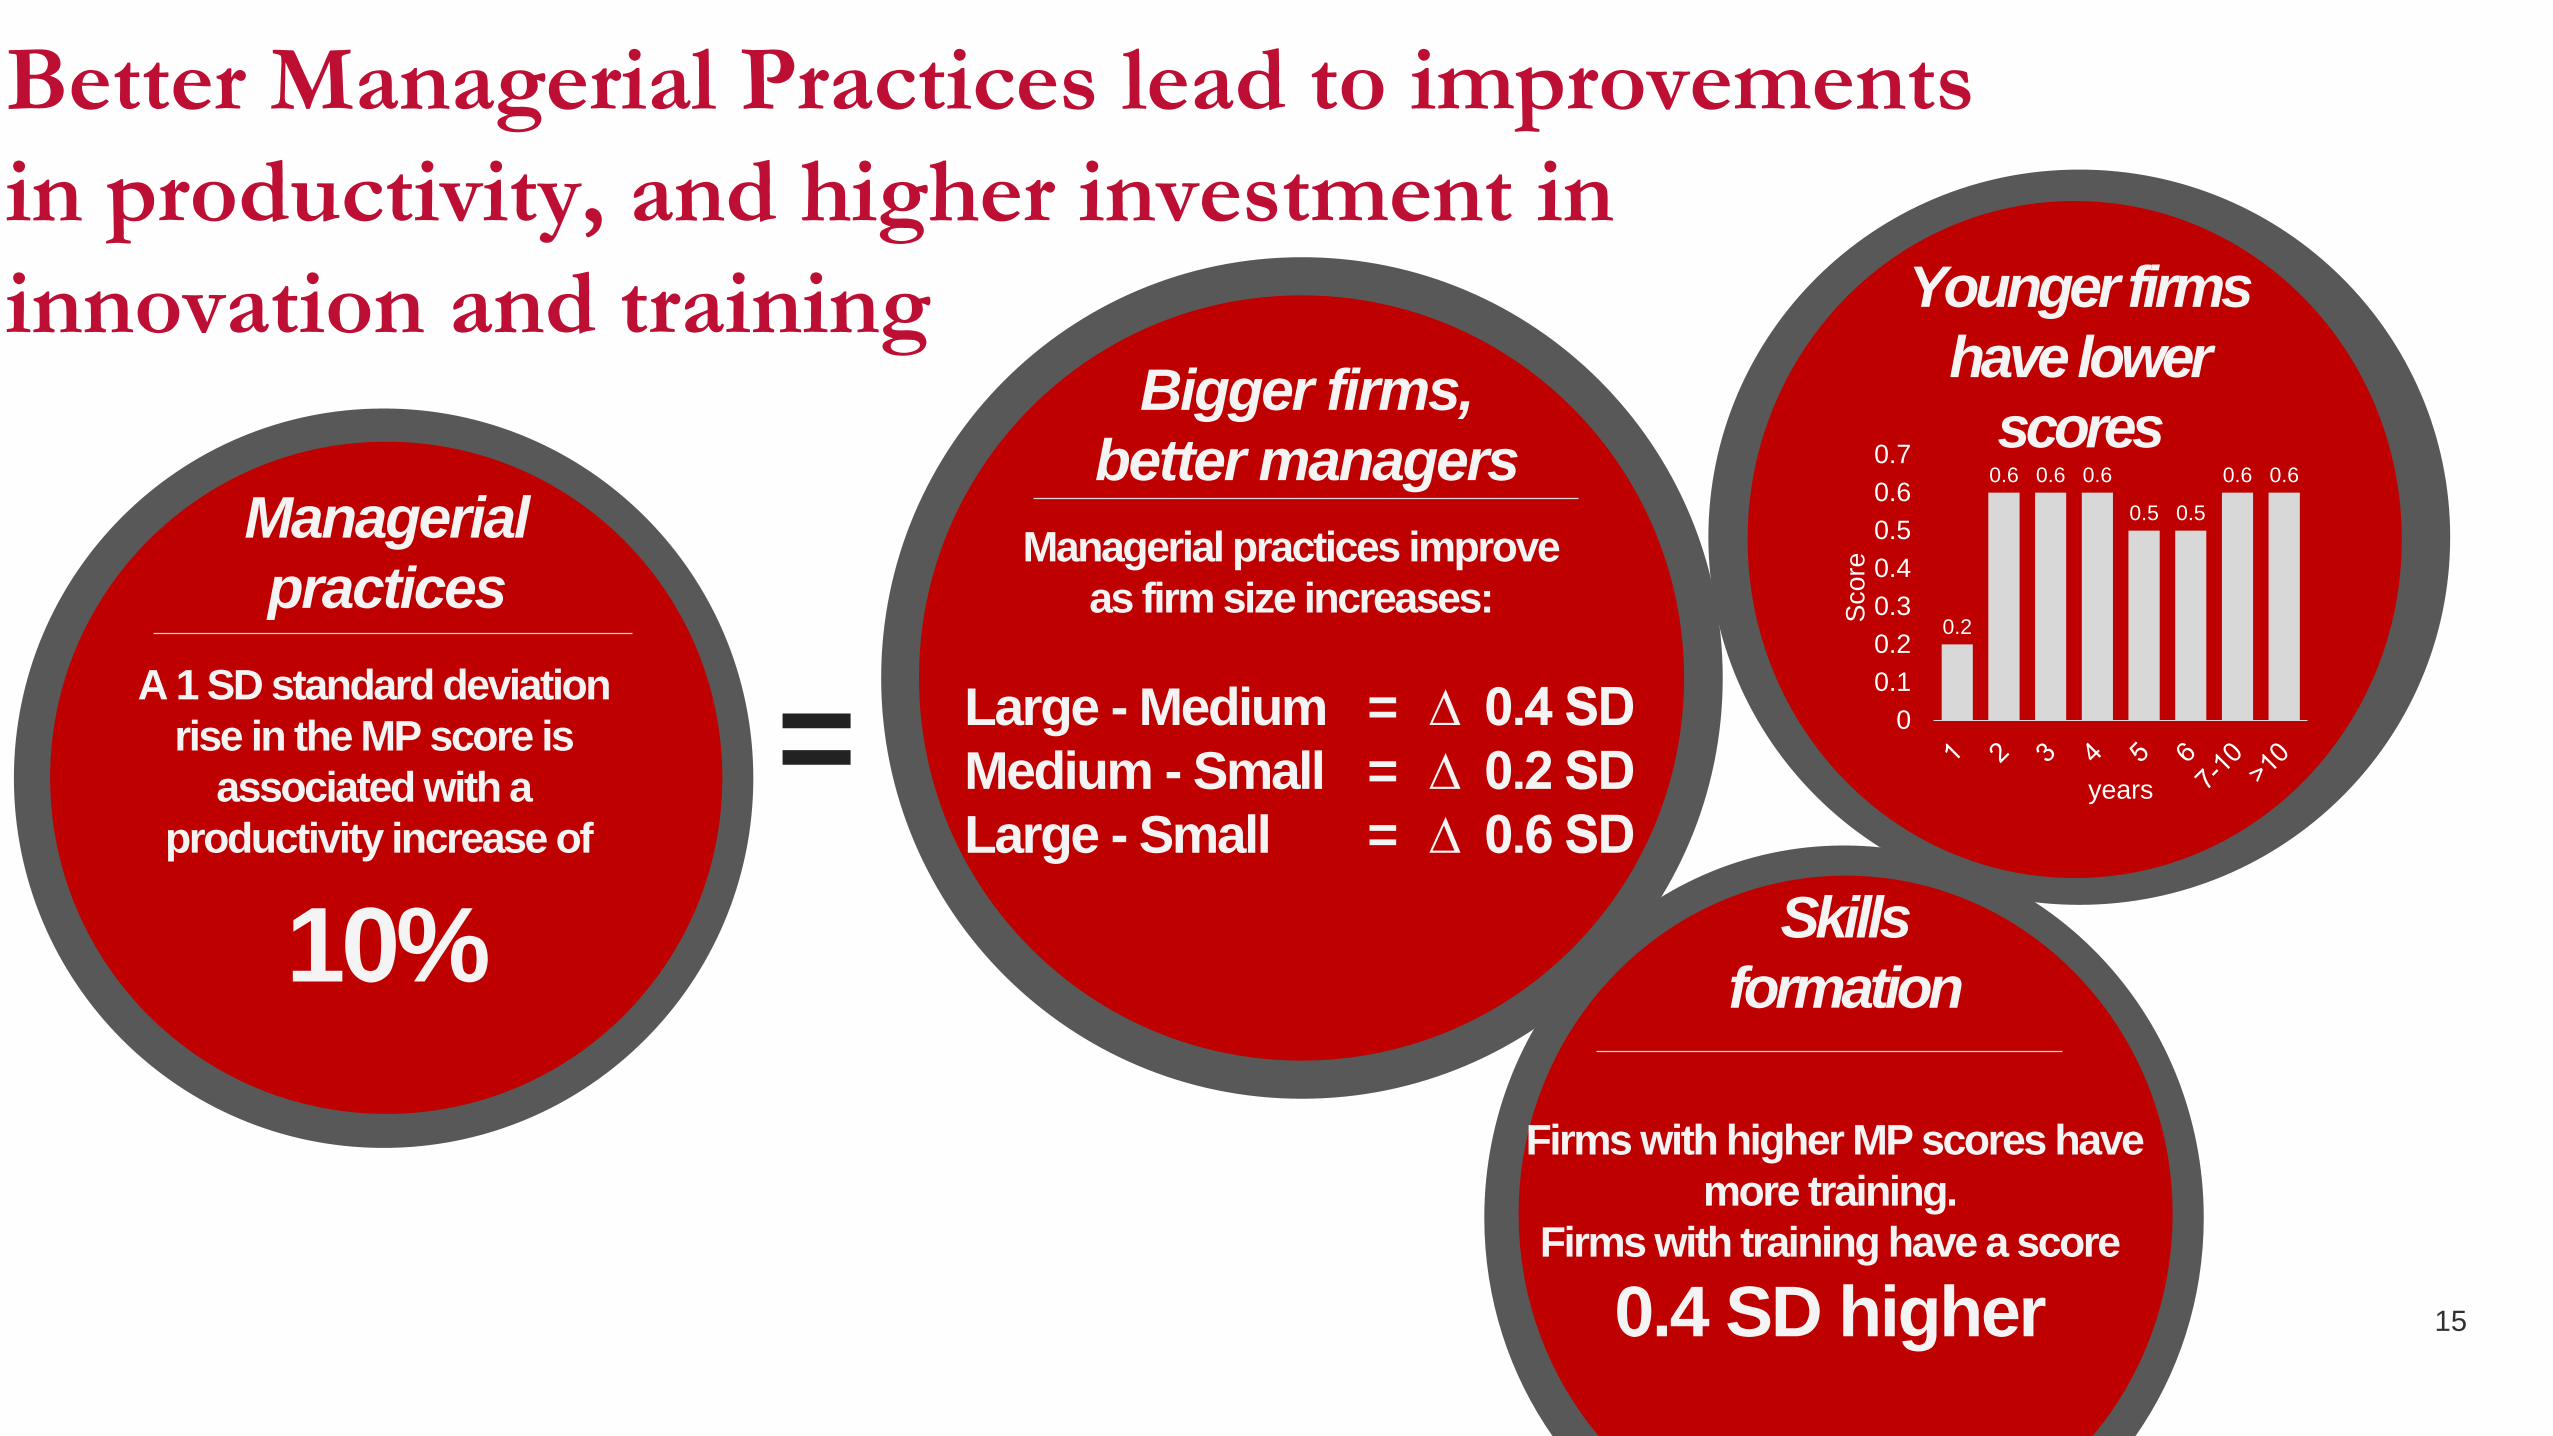
Better Managerial Practices lead to improvements
in productivity, and higher investment in
innovation and trainingBigger firms,
better managers
Managerial practices improve
as firm size increases:
Large - Medium = ∆ 0.4 SD
Medium - Small = ∆ 0.2 SD
Large - Small = ∆ 0.6 SD
Skills
formation
Firms with higher MP scores have
more training.
Firms with training have a score
0.4 SD higher
Managerial
practices
A 1 SD standard deviation
rise in the MP score is
associated with a
productivity increase of
10%
=
Youngerfirms
have lower
scores
0.2
0.6 0.6 0.6
0.5 0.5
0.6 0.6
0
0.1
0.2
0.3
0.4
0.5
0.6
0.7
Score
years
15

Firms with higher innovation scores train their workers
more and experience improvements in productivity
Investment in
innovation increases
dramatically after year 1
=
Innovation
A higher score in the innovation
index is also positively correlated
with increases in productivity.
A 1 SD rise is associated with a
productivity increase of
9%Skills
formation
Firms with higher innovation
scores have more training.
Firms with training have a score
0.5 SD higher
Bigger firms
score higher
Larger firms invest
2x more on innovation
than other firms
0.3
1.11.4
1 0.9
1.9
4.2
0
1
2
3
4
5
1 3 4 5 6 7-10 >10In
novation e
xpenditure
s
(mpp)
Years
16

Financial capacity has mixed results on the
mechanisms that lead to higher productivity
Financing
A 1 SD increase in the financing
index score results in a
productivity rise of
4%
FDI
Financing score is
0.4 SD higher if the firm has FDI
Supplierof
foreignfirms
Supplierof
exporters
Financing score is
0.4 SD lowerif the firm is a supplier to firms that
are exporters
Financing score is
0.4 SD lowerif the firm is a supplier to
foreign firms
=
17

What do we learn from these preliminary results?
1. Family Business
Align incentives for firms to hire professional managers instead of family members to improve corporate governance.
2. Managerial practices
In order to meet the best international managerial practices, design policies aimed to support firms when they find
themselves at their weakest: around the time they are established or when they take out loans.
3. Financing
Given the analysis’s mixed results on financial practices and being a part of the global market, more research should
be done in order to clarify the mechanisms that underlie MSME financing.
According to the scores analyzed, in terms of productivity gains, policies that target family business and
managerial practices offer the highest benefits.
18

Research agenda: moving forward
Exporters and FDI
Look at the characteristics
specific to foreign firms,
firms that export or firms
that have shares of foreign
capital.
Leading and lagging
firms:
Analyze leading and lagging
firms’ productivity and
salaries by sector. Look at
leading and lagging firms’
convergence rate across
sectors and regions.
Stock of Knowledge
and RoR
Observe differing patterns in
terms of technology
adoption and innovation
practices.
Firm Survival
Identify the factors behind
firm survival and the changes
in financing, management
practices and decision-making
over time.
1. 2. 3. 4.
19

OECD Productivity Network
Juan Rebolledo
October, 201620

21

Relationship between managerial practices, innovation
and productivity
Firms that score higher on the managerial practices
index are more likely to export and have FDI.
Source: ENAPROCE and World Bank.Source: World Management Survey, Management Matters, Manufacturing Report (2014)..
0%
2%
4%
6%
8%
10%
12%
14%
1 2 3 4 5 6 7 8 9 10
Sh
are
of
firm
s w
ith
FD
I
Managerial practices decile
Share of firms with FDI by managerial practices score decile
0
1000
2000
3000
4000
1 2 3 4 5 6 7 8 9 10
Inn
ova
toin
spen
din
gp
er
wo
rker
Managerial practices decile
Innovation spending per worker by managerial practices score decile
22