Using Engineered Fuels as a Substitute for Fossil Fuels in...
50
Using Engineered Fuels as a Substitute for Fossil Fuels in Cement Production Nour Awad Advisors: Nickolas J. Themelis, Columbia University Marco J. Castaldi, City College of New York Department of Earth and Environmental Engineering Fu Foundation School of Engineering and Applied Science Columbia University February 2015 Research sponsored by
Transcript of Using Engineered Fuels as a Substitute for Fossil Fuels in...
Using Engineered Fuels as a Substitute for Fossil Fuels in Cement
Production
Nour Awad
Advisors:
Nickolas J. Themelis, Columbia University
Marco J. Castaldi, City College of New York
Department of Earth and Environmental Engineering
Fu Foundation School of Engineering and Applied Science
Columbia University
February 2015
Research sponsored by
2
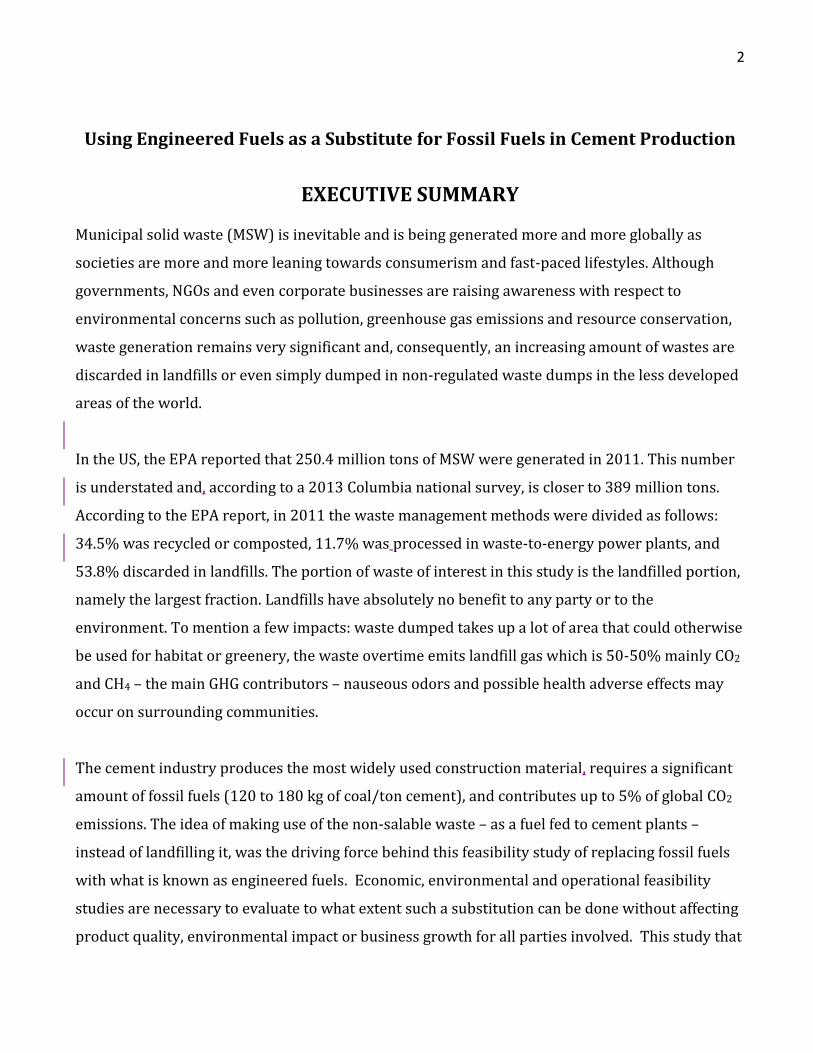
Using Engineered Fuels as a Substitute for Fossil Fuels in Cement Production
EXECUTIVE SUMMARY Municipal solid waste (MSW) is inevitable and is being generated more and more globally as
societies are more and more leaning towards consumerism and fast-paced lifestyles. Although
governments, NGOs and even corporate businesses are raising awareness with respect to
environmental concerns such as pollution, greenhouse gas emissions and resource conservation,
waste generation remains very significant and, consequently, an increasing amount of wastes are
discarded in landfills or even simply dumped in non-regulated waste dumps in the less developed
areas of the world.
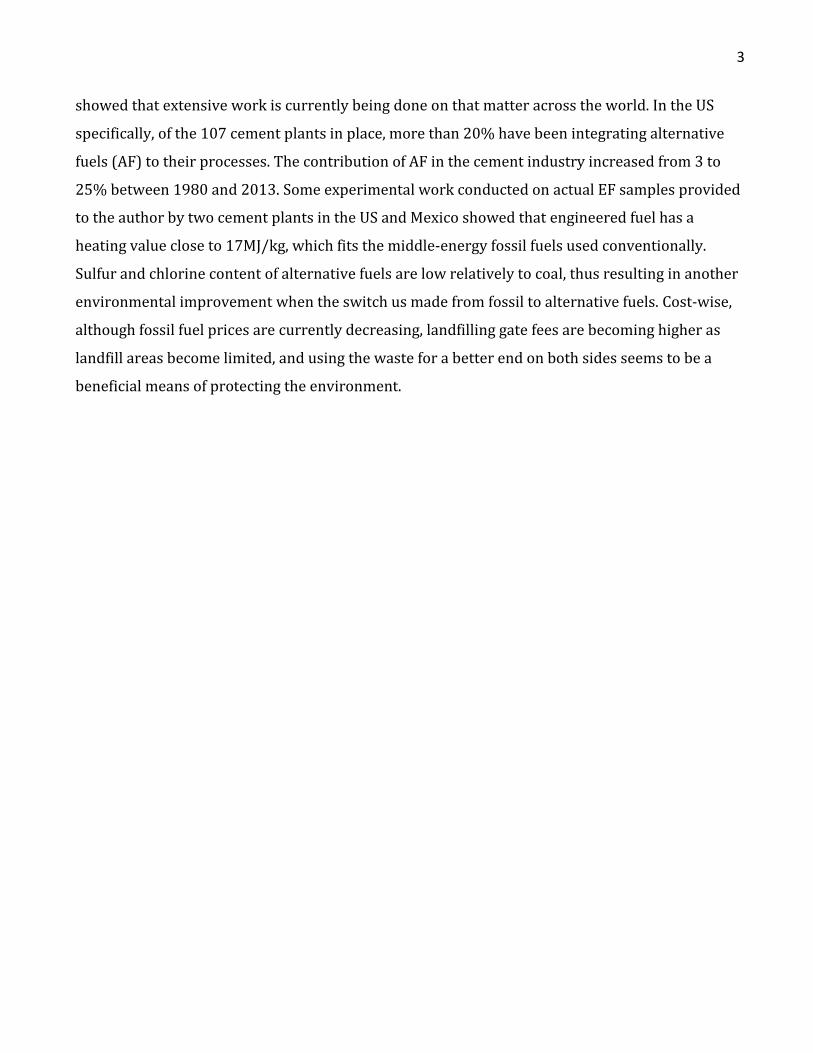
In the US, the EPA reported that 250.4 million tons of MSW were generated in 2011. This number
is understated and, according to a 2013 Columbia national survey, is closer to 389 million tons.
According to the EPA report, in 2011 the waste management methods were divided as follows:
34.5% was recycled or composted, 11.7% was processed in waste-to-energy power plants, and
53.8% discarded in landfills. The portion of waste of interest in this study is the landfilled portion,
namely the largest fraction. Landfills have absolutely no benefit to any party or to the
environment. To mention a few impacts: waste dumped takes up a lot of area that could otherwise
be used for habitat or greenery, the waste overtime emits landfill gas which is 50-50% mainly CO2
and CH4 – the main GHG contributors – nauseous odors and possible health adverse effects may
occur on surrounding communities.
The cement industry produces the most widely used construction material, requires a significant
amount of fossil fuels (120 to 180 kg of coal/ton cement), and contributes up to 5% of global CO2
emissions. The idea of making use of the non-salable waste – as a fuel fed to cement plants –
instead of landfilling it, was the driving force behind this feasibility study of replacing fossil fuels
with what is known as engineered fuels. Economic, environmental and operational feasibility
studies are necessary to evaluate to what extent such a substitution can be done without affecting
product quality, environmental impact or business growth for all parties involved. This study that
3
showed that extensive work is currently being done on that matter across the world. In the US
specifically, of the 107 cement plants in place, more than 20% have been integrating alternative
fuels (AF) to their processes. The contribution of AF in the cement industry increased from 3 to
25% between 1980 and 2013. Some experimental work conducted on actual EF samples provided
to the author by two cement plants in the US and Mexico showed that engineered fuel has a
heating value close to 17MJ/kg, which fits the middle-energy fossil fuels used conventionally.
Sulfur and chlorine content of alternative fuels are low relatively to coal, thus resulting in another
environmental improvement when the switch us made from fossil to alternative fuels. Cost-wise,
although fossil fuel prices are currently decreasing, landfilling gate fees are becoming higher as
landfill areas become limited, and using the waste for a better end on both sides seems to be a
beneficial means of protecting the environment.
4
ACKNOWLEDGEMENTS
First and foremost, I would like to thank my advisors, Professor Nickolas J. Themelis and
Professor Marco J. Castaldi, for their valuable guidance, support and knowledge during the
research process. I would also like to thank Columbia University’ Earth Engineering Center for
funding my research and the National Science Foundation for funding my Master’s program after
being nominated by Professor Themelis as a candidate for the NSF S-STEM Sustainable
Engineering Graduate Scholars Program.
I would like to acknowledge my research teams at Columbia University (WTERT) and CCNY, my
friends and colleagues and Liliana Themelis for their helpful assistance and advice. Last but not
least I would like to thank my family for their enthusiasm, encouragement and continuous support
throughout my academic career.
5
TABLE OF CONTENTS
EXECUTIVE SUMMARY ...................................................................................................................................... 2
ACKNOWLEDGEMENTS ..................................................................................................................................... 4
TABLE OF CONTENTS ......................................................................................................................................... 5
LIST OF FIGURES ................................................................................................................................................. 6
LIST OF TABLES ................................................................................................................................................... 7
1 INTRODUCTION ............................................................................................................................................ 8
2 BACKGROUND OF WASTE MANAGEMENT IN THE U.S ..................................................................... 8 2.1 The Situation of MSW in the U.S and Waste Characterization .............................................. 8 2.2 Waste Management Practices .......................................................................................................... 8
2.2.1 Landfilling ....................................................................................................................................................... 8 2.2.2 Material Recovery ........................................................................................................................................ 9 2.2.3 Waste to Energy ........................................................................................................................................... 9
2.3 Waste Residue: A Potential Resource Instead of Useless Waste ......................................... 9
3 THE CEMENT INDUSTRY IN THE WORLD AND THE U.S ............................................................... 10 3.1 Cement production: facts and figures ........................................................................................ 10 3.2 Cement production process ........................................................................................................... 10
3.2.1 Different types of processes ................................................................................................................. 11 3.2.2 Fuels used and energy requirements ................................................................................................ 14 3.2.3 Emissions ..................................................................................................................................................... 17
4 ENGINEERED FUEL: A PARTIAL SUBSTITUTE FOR CONVENTIONAL FUELS IN CEMENT KILNS .................................................................................................................................................................... 20
4.1 Motivation behind reusing residue ............................................................................................. 20 4.1.1 Economical and environmental drawbacks of landfilling in the US ..................................... 20 4.1.2 Waste management hierarchy ............................................................................................................. 21
4.2 Two case studies ................................................................................................................................ 22 4.2.1 Data from Plants (Tepeaca plant)....................................................................................................... 22 4.2.2 Experimental Testing (Balcones) ....................................................................................................... 32 4.2.3 Comparing both plants ........................................................................................................................... 41
4.3 How did the use of EF evolve and how can it improve? ....................................................... 43 4.3.1 Current use of EF/RDF in cement kilns in the US ........................................................................ 43 4.3.2 A promising future for AF use in the global cement industry ................................................. 46
5 CONCLUSIONS AND RECOMMENDATIONS ........................................................................................ 47
6 REFERENCES ............................................................................................................................................... 48

6
LIST OF FIGURES
Figure 1: Yearly cement production in the world and the US since 2010 ................................................. 10 Figure 9: Weighted average of HHV of EF used in Tepeaca in 2012 and 2013 ........................................ 27 Figure 11: Temperature rise profile from 1 calorimetric run ........................................................................ 34 Figure 13: Typical temperature rise curve and parameters used to calculate HHV .............................. 37

7
LIST OF TABLES
Table 1: Fuel consumption in US cement kilns in 2000 and 2011 ................................................................ 16 Table 2: National emission requirements for air pollutants from cement kilns ..................................... 19 Table 3: Comparison of HHV of EF derived from plant data vs. literature findings ............................... 28 Table 4: Energy in MJ provided by each of type of fuel in Tepeaca in 2012 and 2013 ......................... 29 Table 5: Amount used by fuel type in Tepeaca in 2012 and 2013 ................................................................ 29 Table 6: Difference in HHV calculated for fuels used in Tepeaca in 2012 and 2013 ............................. 30 Table 7: Cement and clinker quantities produced in Tepeaca in 2012 and 2013 .................................. 30 Table 8: Amount of fuel used per ton of product in Tepeaca in 2012 and 2013 ..................................... 31 Table 9: Emissions reported by Tepeaca for 2012 and 2013 compared to EPA standards ................ 31 Table 10: Sample Data Set for one Calorimetry Run .......................................................................................... 33 Table 11: Results for HHVs of several runs on fluff and pellet EF from Balcones .................................. 37 Table 12: Annual emissions reported by Balcones for 2012 and 2013 ...................................................... 40 Table 13: HHV in MJ/kg of EF used in both plants Balcones and Tepeaca ................................................ 42 Table 14: Comparison of emissions reported by Tepeaca and Balcones vs. standards ....................... 42 Table 15: Heating value of fuels used in the U.S. cement production .......................................................... 44
8
1 INTRODUCTION
2 BACKGROUND OF WASTE MANAGEMENT IN THE U.S
2.1 The Situation of MSW in the U.S and Waste Characterization
Municipal Solid Waste (MSW) includes but is not limited to the waste products generated by
households and small businesses. In the U.S, MSW generation has been on an increase for more
than 3 decades; 88.1 MMtons of waste were generated in 1960 and this number and has been
continuously increasing until it reached 250.9 MMton/year in 2012 (EPA, 2012). This is
equivalent to 4.38 lb waste generated per person per day.
Although work is being done to manage this waste as “cleanly” and efficiently as possible,
technologies and infrastructure are still being developed to process the huge amounts of waste
that are increasing at a much faster rate.
2.2 Waste Management Practices
The main waste management practices are: landfilling, recovery and WtE.
2.2.1 Landfilling
Until 2012, more than half, namely 53.8% of the total MSW generated in the U.S ended up being
landfilled (EPA, 2012) – that is buried underground with minimal treatment and/or sanitary
precautions – causing negative consequences on the environment and the surrounding
communities. These consequences include:
1. Increased landfill capacity in the U.S (although number of landfills has decreased)
2. Increased tipping fee: average fee was $44/ton MSW landfilled in 2012
3. Environmental impacts include:
a. Loss of land area resources;
b. Greenhouse Gas (GHG), namely methane (CH4) emissions: landfills were ranked 3rd
largest source of CH4 emissions in the U.S in 2011, with an estimated 103 million
tons generated out of which almost 50% is recovered and combusted for energy
generation;
c. Potential leaching of hazardous substances to groundwater (CCS, 2013).

9
2.2.2 Material Recovery
Material recovery includes recycling and composting. It accounted for 34.5% of total MSW
generated in the U.S in 2012 (EPA, 2012). Organic waste such as food and biomass are recovered
through composting, plastics, metals, papers and paperboard are separated from the waste stream
in Material Recovery Facilities (MRFs) and sent to respective recycling facilities, the residue (non-
recyclable material, or components with no marketable value) is added to the MSW stream that
goes to landfills.
2.2.3 Waste to Energy
Combustion of MSW for electricity generation has been used increasingly in the world and the U.S.
Waste-to-Energy facilities generates a variety of pollutants (CO2, heavy metals, dioxins,
particulates) that contribute to impacts such as climate change, smog, acidification, asthma, and
heart and nervous system damage (CCS, 2013) but are seen as an important way to reduce the
volume of waste that is sent to landfill by 90%: the residual ash that results from burning MSW is
approximately 10% by volume that of the feed waste burnt (75% less by weight). Controversies
regarding emissions reductions and cost effectiveness of this process are being disputed and that
is why the Waste-to-Energy sector in the U.S has been stagnant in the recent years. In 2012, 11.7%
of the total MSW generated in the U.S was sent for incineration and energy recovery (EPA, 2012).
2.3 Waste Residue: A Potential Resource Instead of Useless Waste
Combining the waste that goes directly from collection to landfills with the residual, non-
recoverable residue discarded from MRFs, large amounts of waste can be redirected towards
useful purposes, while avoiding dumping them in landfills. Looking at this ‘waste stream of MSW’
as a valuable resource lead to the creation of ‘Engineered Fuels’ (EF) which results from basic
treatment and processing of these residual streams into fluffs and/or pellets and then sent to be
used as fuels in different industries, namely the cement production process of Portland Cement, a
very energy-intensive process that is flexible with respect to types of fuels injected into its
reactors.

10
3 THE CEMENT INDUSTRY IN THE WORLD AND THE U.S
3.1 Cement production: facts and figures
The economist described cement as ‘as vital a commodity to fast-growing economies as oil or
steel. No other material is as versatile when it comes to building houses, roads and big chunks of
infrastructure. It is a huge business: the world’s cement-makers rake in revenues of $250 billion a
year. Outside China, which accounts for half of global demand and production and is mainly
served by local firms, six vast international firms—Buzzi, Cemex, Heidelberg, Holcim, Italcementi
and Lafarge—together have 40% or so of the market. Yet the business rarely attracts much
attention’ (The Economist, 2013).
Portland cement is the basic ingredient of concrete; the world’s most used construction material.
Figure 1 shows the production of cement in the world and the US over the 2010-2013 period.
Cement production globally have been on an increase in the past decade, however, local
production in the US decreased sharply from 99.3 million tons in 2005 to 63.9 million tons in
2009. It has been slowly increasing after that and reached around 77.8 million tons in 2013 (USGS,
2009; USGS 2012; USGS 2014).
Figure 1: Yearly cement production in the
world and the US since 2010
3.2 Cement production process
Cement is a fine powder, which sets when mixed with water and hardens in a few days into a
strong material. It is mainly used to bind coarse aggregates and fine sand in concrete (Cement
bureau, 2014).
66.5 67.9 74.2 77.2
3,310 3,600
3,800 4,000
0
1,000
2,000
3,000
4,000
5,000
2010 2011 2012 2013Ce
me
nt
pro
du
ctio
n i
n m
illi
on
to
ns
US World
11
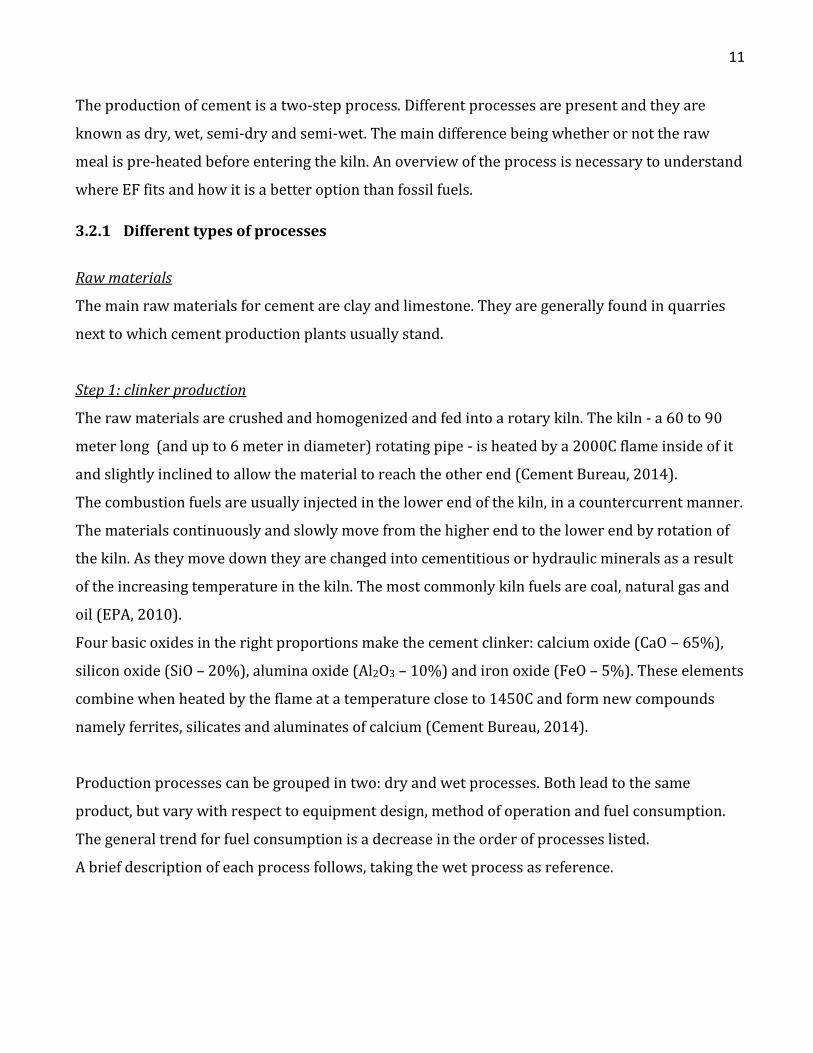
The production of cement is a two-step process. Different processes are present and they are
known as dry, wet, semi-dry and semi-wet. The main difference being whether or not the raw
meal is pre-heated before entering the kiln. An overview of the process is necessary to understand
where EF fits and how it is a better option than fossil fuels.
3.2.1 Different types of processes
Raw materials
The main raw materials for cement are clay and limestone. They are generally found in quarries
next to which cement production plants usually stand.
Step 1: clinker production
The raw materials are crushed and homogenized and fed into a rotary kiln. The kiln - a 60 to 90
meter long (and up to 6 meter in diameter) rotating pipe - is heated by a 2000C flame inside of it
and slightly inclined to allow the material to reach the other end (Cement Bureau, 2014).
The combustion fuels are usually injected in the lower end of the kiln, in a countercurrent manner.
The materials continuously and slowly move from the higher end to the lower end by rotation of
the kiln. As they move down they are changed into cementitious or hydraulic minerals as a result
of the increasing temperature in the kiln. The most commonly kiln fuels are coal, natural gas and
oil (EPA, 2010).
Four basic oxides in the right proportions make the cement clinker: calcium oxide (CaO – 65%),
silicon oxide (SiO – 20%), alumina oxide (Al2O3 – 10%) and iron oxide (FeO – 5%). These elements
combine when heated by the flame at a temperature close to 1450C and form new compounds
namely ferrites, silicates and aluminates of calcium (Cement Bureau, 2014).
Production processes can be grouped in two: dry and wet processes. Both lead to the same
product, but vary with respect to equipment design, method of operation and fuel consumption.
The general trend for fuel consumption is a decrease in the order of processes listed.
A brief description of each process follows, taking the wet process as reference.
12
The wet process requires that raw materials are fed moist to the rotary kiln. On average an
additional 33% of energy input is required to evaporate that water in the kiln. Over the past
decades the US industry have made major efforts to shift to dry processes and almost 93% of the
cement produced in the US is manufactured through dry processes (PCA, 2013). From the
publication ‘US and Canadian Labor-Energy Input Survey 2012’ the cement industry in the US has
improved energy efficient by more than 41% since 1972 (PCA, 2013).
Four dry processes can be distinguished: long dry processes, dry with preheater, dry with
preheater/precalciner and semi-dry process. The have improved thermal energy efficiency and
productive capacity given that moisture content is kept minimal in the raw material feed.
In preheater dry processes, through the addition of preheater vessels, the hot exhaust gases
exiting the kiln pass counter-currently through the downward moving raw materials before they
enter the rotary kiln. As a result, the rate of heat transfer is increased, the degree to which heat is
utilized is increased and the process time in the kiln reduced (EPA, 2010).
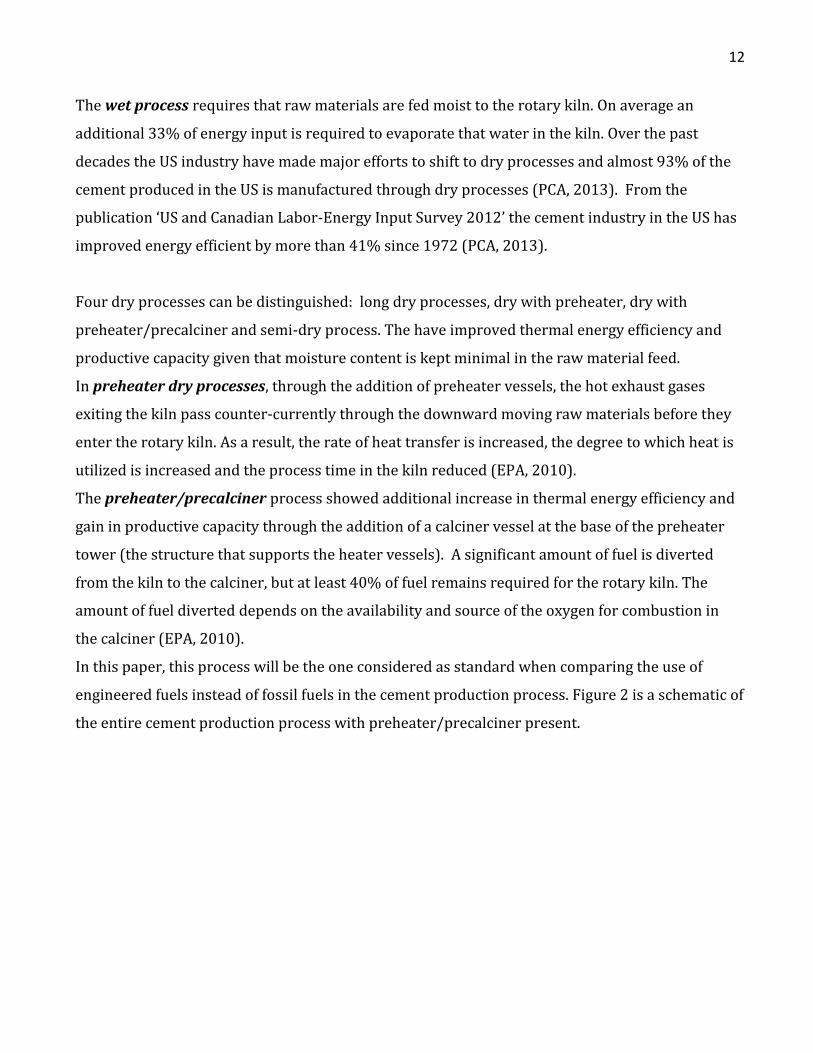
The preheater/precalciner process showed additional increase in thermal energy efficiency and
gain in productive capacity through the addition of a calciner vessel at the base of the preheater
tower (the structure that supports the heater vessels). A significant amount of fuel is diverted
from the kiln to the calciner, but at least 40% of fuel remains required for the rotary kiln. The
amount of fuel diverted depends on the availability and source of the oxygen for combustion in
the calciner (EPA, 2010).
In this paper, this process will be the one considered as standard when comparing the use of
engineered fuels instead of fossil fuels in the cement production process. Figure 2 is a schematic of
the entire cement production process with preheater/precalciner present.
13
The semi-dry process is a variation of the dry process: water is added to the dry raw mix to form
moist pellets which are then conveyed on a moving grate preheater before being fed to the rotary
kiln. The pellets are dried and partially calcined in the grate by hot kiln exhaust gases passing
through the grate (EPA, 2010).
Regardless of the process type, the last part of the first step is the same: the clinker cooler. The
clinker is fed to a cooler (reciprocating grate, planetary or rotary) where 30% of the heat input is
recovered to the kiln system. Desirable products are locked in by freezing mineralogy; the clinker
is cooled from about 1100 to 100 C by ambient air that passes through the clinker and to the
rotary kiln (EPA, 2010).
The final product of this phase is called ‘clinker’.
Step 2: cement production
Gypsum (calcium sulfates) or natural anhydrite (and sometimes other materials – cementitious
like coal fly ash or inert like limestone) is added to the clinker. The constituents are ground to a
fine homogenous powder in a grinding mill, which may be located in a different place than the
(Source: DSMAC, 2014)
Secondary Fuels
Primary Fuels
Figure 2: Schematic of a preheater/precalciner cement production process

14
clinker plant. Cement is stored in silos, and the dispatched in bulk or bagged (Cement Bureau,
2014).
3.2.2 Fuels used and energy requirements
The amount of energy required to produce 1 ton of cement has been approximated at 4.982
million BTUs / ton of cement for US plants. The pyroprocessing step (preheater/precalciner
followed by rotary kiln) accounts for 74.2% of this energy (Choate, 2003).
The Portland Cement Association reported an estimated 4.4 million BTU requirement per ton of
cement produced (PCA, 2013). This is equivalent to 4642 MJ/ton cement produced.
On average, rotary kilns operate with a thermal energy efficiency of 34% (Choate, 2003). This
relatively low number leaves a big opportunity to improve thermal performance. Over the past
decades, the cement industry focused widely on types of fuels being used in the pyroprocessing. A
major shift resulting from federal legislation from petroleum and natural gas based fuels to
petroleum coke and coal has take place (Choate, 2013). Consequently higher CO2 emissions per
BTU consumed resulted since coal combustion generates 1.8 times more CO2 than natural gas and
1.2 times more than residual oil on a BTU basis.
Continuous changes have been occurring in order to:
1. Reduce the BTUs required/ ton of cement produced (energy efficiency)
2. Decrease the amount of pollutants, and mainly CO2, generated for each ton of cement
produced
3. Save the fossil fuel reserves of the planet
Alternative fuels were introduced and as a result not only did they contribute to achieving the
goals mentioned above but also they reduced the amounts of waste that would have otherwise
been landfilled. This combination of improvements
Along these lines benefits such as saving the fossil fuel reserves and safely disposing of waste that
would otherwise be landfilled eventually gained importance as well.
15
Waste co-processing in cement plants:
Waste co-processing into alternative fuels and raw materials in cement plants is a method used
worldwide to process and dispose of waste in a completely safe manner. Two main types of waste
can be processed:
Waste with high energetic content – energetically recovered as an alternative fuel;
Waste with a mineralogical content similar to the traditional raw material or to the
intermediate product (clinker) – materially recovered as alternative raw material.
Regardless of the type of waste, waste co-processing under controlled conditions (from the OH&S,
environmental protection and quality point of views) has various benefits:
Preservation of natural resources by the partial substitution of fossil fuels (coal, oil, gas)
and raw materials (limestone, clay and marl) with alternative ones;
Indirect reduction of gas emissions, which would result from other ways of waste
processing (incineration, landfilling…);
Reduction of cement production costs (mid to long-term) if and only if all the collection,
transport, pre-treatment and co-incineration
Improving energy efficiency:
The cement production process requires huge amounts of electrical and thermal energy.
Energy efficiency, defined as the total thermal energy consumed per ton of clinker produced and
as the total electric energy consumed per ton of cement produced, is almost entirely determined
by the technology applied in the production process.
The improvement of energy efficiency not only reduces production costs, but also positively
contributes to the preservation of natural resources (fuels) and the lowering of greenhouse gas
(CO2) emissions generated by fuel combustion in the cement kilns, as well as by electric energy
production in thermo power plants.
Energy efficiency is also developed by using alternative fuels: besides the fact that this method
allows the disposal of various wastes in an ecological manner, significant decreases in the
conventional fuels consumption are also obtained.

16
Table 1 summarizes the repartition of fuel use for cement manufacturing in the US in 2000
(Choate, 2013) and 2011 (Cement, 2011). The use of alternative fuel clearly increased from 9 to
12% with a major shift in contribution from tires to solids, which include the engineered fuel that
is discussed in this paper.
Table 1: Fuel consumption in US cement kilns in 2000 and 2011
*HHV used to convert from quantity used to energy provided http://www.cementkilns.co.uk/data_waste.html
Because fuel used in the rotary kiln (known as primary fuel) can affect the composition of the final
product, namely the clinker, the composition of the fuel itself is of high importance in the cement
production process. This primary fuel makes up no more than 45% of the total fuel used to feed
the kiln and preheater/precalciner. The secondary fuel, which is the one fed to the
preheater/precalciner in dry processes can be flexible in composition and calorific content given
2000 2011*
MJ/ton clinker % MJ/ton clinker %
Conventional Fuels
Coal 3,148 67% 3,438 68% Pet Coke
803 17% 640 15% Natural Gas
276 6% 414 5% Middle Distillates
42 1% Residual Oils
4 26 0% Gasoline
5 LPG
0 Alternative Fuels
Oils 16 0%
Solvents 266 6%
Tires 122 3% 191 4%
Solids 13 233 8%
EF 8
Fuels total 4,702 100% 4,943 100%

17
that it does not affect the quality of the clinker product. It contributes to up to 55% of the total
energy requirements of the process and therefore presents a major opportunity for energy
efficiency improvement (see Figure 2).
The total calorific amount reported by industry in Table 1 that is provided by fuels to the cement
production process is very compatible with the theoretical value of ±4600 MJ/ton found in
literature (and mentioned in the beginning of this section).
3.2.3 Emissions
3.2.3.1 Emissions from the production process
The main emissions in cement production plants are: Particulate Matter (PM), nitrogen oxides
(NOx), sulfur dioxide (SO2), carbon monoxide (CO) and carbon dioxide (CO2). Other emissions of
concern may include Volatile Organic Compounds (VOCs), hydrogen chloride (HCl), ammonia
(NH3) and chlorine. Emissions may also include residual materials from the feed or raw materials
as well as hazardous products of incomplete combustion (EPA, 2010).
The largest emission source of PM is the kiln and clinker cooler exhaust stacks. Emissions from
Portland cement plants are regulated to limit PM emissions from cement kilns 0.15kg/ton of feed
(dry basis) and to limit PM emissions from clinker coolers to 0.05 kg/ton of feed (dry basis) (EPA,
2010).
Nitrous oxides are generated through two paths. One hand oxidation of chemically bound nitrogen
in the fuel occurs; and the more nitrogen-rich the fuel, the more NOx emitted. On the other hand,
thermal fixation of nitrogen in the combustion air takes place; the higher the temperature of the
flame, the more thermally generated NOx emitted. The type of fuel used and the temperature of
the vessel therefore affect NOx emissions. In the preheater/precalciner dry process, NOx is
produced in both the burning zone of the kiln and the burning zone of the calciner. For example, in
the kiln, low nitrogen fuel such as natural gas combustion with high flame temperatures results in
a larger generation of NOx, compared to combustion of oil or coal which are high nitrogen fuels but
burn at lower temperatures. The opposite may be true in the precalciner. Different plants use
different combinations of fuels, but in recent year the trend of mixing coal and waste fuel has been
18
remarkable (EPA, 2010). The effect of waste fuel use on NOx emissions s not clearly established
but one may hypothesize that because of the variability of waste across regions and seasons as
well as the numerous sources of waste, nitrogen content in the waste fuel would be highly variable
and therefore emissions not necessarily predictable.
Sulfur dioxide may be generated from the sulfur content of the raw materials and the one in the
fuel. Sulfur content of fuel and raw materials vary with each plant and geographic location.
However, the alkaline nature of cement allows absorption of SO2 into the product, hence reducing
the net emissions in the exhaust streams. Absorption ranges from 70 to more than 95%
depending on process type and source of sulfur (EPA, 2010).
Carbon dioxide emissions result from two mechanisms: fuel combustion and calcination of
limestone and other calcareous materials. Calcination refers to the thermal decomposition of
limestone (CaCO3) into calcium oxide (CaO) and CO2. Typically cement contains 63.5% of CaO. A
basic material balance shows that each ton of cement produced generates 0.500 tons of CO2 (EPA,
2010). Another report stated 0.544 tons of CO2/ton of cement (Choate, 2003). Adopting a rough
estimate of 0.5 ton CO2/ton cement seems realistic.
Depending on fuel type, burner choice, burner controls, kiln operation and heat recovery
equipment (Choate, 2003). The total CO2 emissions, including fuel-based CO2 generation, are in
the range from 0.85 to 1.35 tons of CO2 per tons of clinker (EPA, 2010).
As a result of non-complete combustion, other pollutant like VOCs and CO can be emitted in
smaller quantities. High temperatures and long residence time in the kiln provide little
opportunity for CO emissions to occurs in general (Choate, 2013). Specific hazardous pollutants
can be emitted sometimes, at even lower levels.
Metallic emissions can be grouped in three categories:
1. Volatile: mercury (Hg) and thallium (Tl);
2. Semi volatile: antimony (Sb), cadmium (Cd), lead (Pb), selenium (Se), zinc (Zn), potassium
(K) and sodium (Na);
3. Refractory or non-volatile: barium (Ba), chromium (Cr), arsenic (As), nickel (Ni), vanadium
(V), manganese (Mn), copper (Cu) and silver (Ag) (EPA, 2010).
19
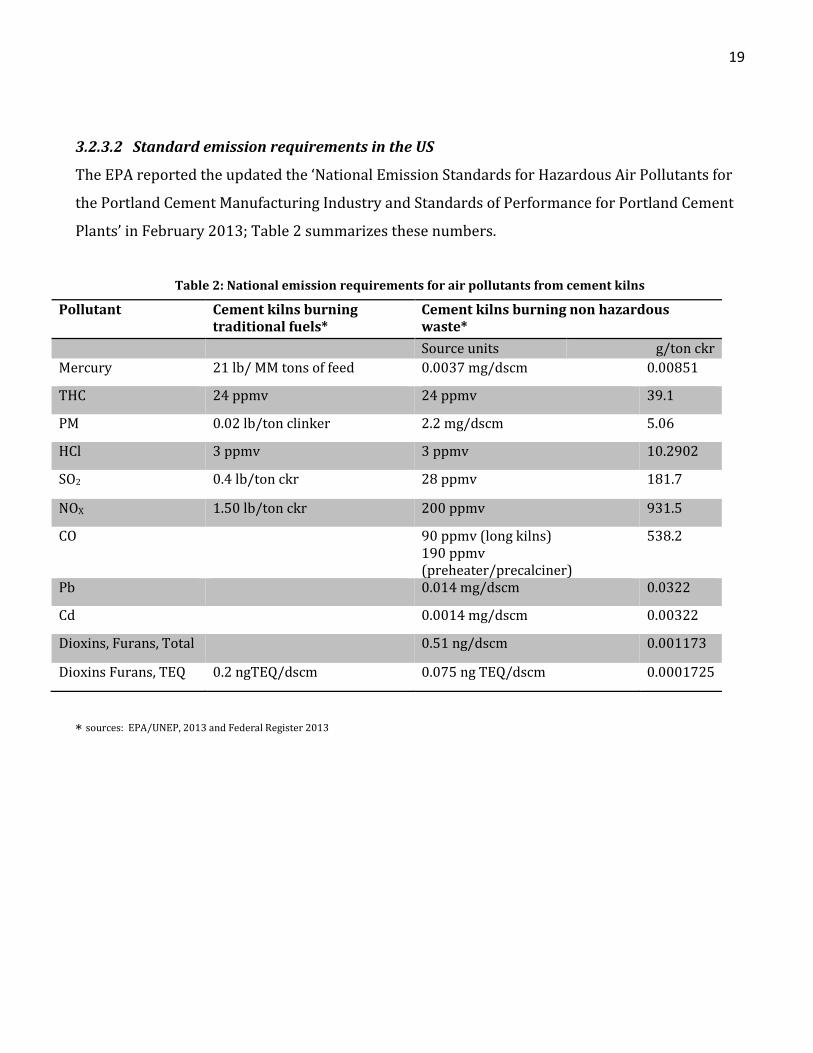
3.2.3.2 Standard emission requirements in the US
The EPA reported the updated the ‘National Emission Standards for Hazardous Air Pollutants for
the Portland Cement Manufacturing Industry and Standards of Performance for Portland Cement
Plants’ in February 2013; Table 2 summarizes these numbers.
Table 2: National emission requirements for air pollutants from cement kilns
* sources: EPA/UNEP, 2013 and Federal Register 2013
Pollutant Cement kilns burning traditional fuels*
Cement kilns burning non hazardous waste*
Source units g/ton ckr
Mercury 21 lb/ MM tons of feed 0.0037 mg/dscm 0.00851
THC 24 ppmv 24 ppmv 39.1
PM 0.02 lb/ton clinker 2.2 mg/dscm 5.06
HCl 3 ppmv 3 ppmv 10.2902
SO2 0.4 lb/ton ckr 28 ppmv 181.7
NOX 1.50 lb/ton ckr 200 ppmv 931.5
CO 90 ppmv (long kilns) 190 ppmv (preheater/precalciner)
538.2
Pb 0.014 mg/dscm 0.0322
Cd 0.0014 mg/dscm 0.00322
Dioxins, Furans, Total 0.51 ng/dscm 0.001173
Dioxins Furans, TEQ 0.2 ngTEQ/dscm 0.075 ng TEQ/dscm 0.0001725
20
4 ENGINEERED FUEL: A PARTIAL SUBSTITUTE FOR CONVENTIONAL FUELS IN CEMENT KILNS
4.1 Motivation behind reusing residue
4.1.1 Economical and environmental drawbacks of landfilling in the US
In 2012, 135 million tons of MSW ended up in landfills. This amount represents 53.8% of the total
MSW generated in the US that year, according to the values reported by the EPA. A study
conducted by Dolly Shin at the Earth Engineering Center at Columbia University proved that the
numbers reported by the EPA regarding MSW generation are smaller than the actual figures
reported in a survey done by Shin over the 51 states for the year 2011. Based on her results, the
total MSW generation amounted to 389 million tons in 2011 instead of the reported value of 250.4
million tons. The actual amount of waste sent to landfills that year was 247 million tons,
corresponding to i.e. 63.5% of MSW generation (Shin, 2014), instead of 134 million tons claimed
by the EPA (i.e. 53.6% of the total figure reported by the EPA). The fact that landfilling has been
the cheapest waste management solution available justifies this high percentage. However, with
increasing waste generation, more landfills are reaching their maximal capacity making the cost of
landfilling gradually increase. Not to mention the additional fees associated with transporting the
waste to landfills away from the cities, where capacity has been reached like in New York City for
example. Landfilling is becoming a more expensive waste management practice (Tsiamis, 2013).
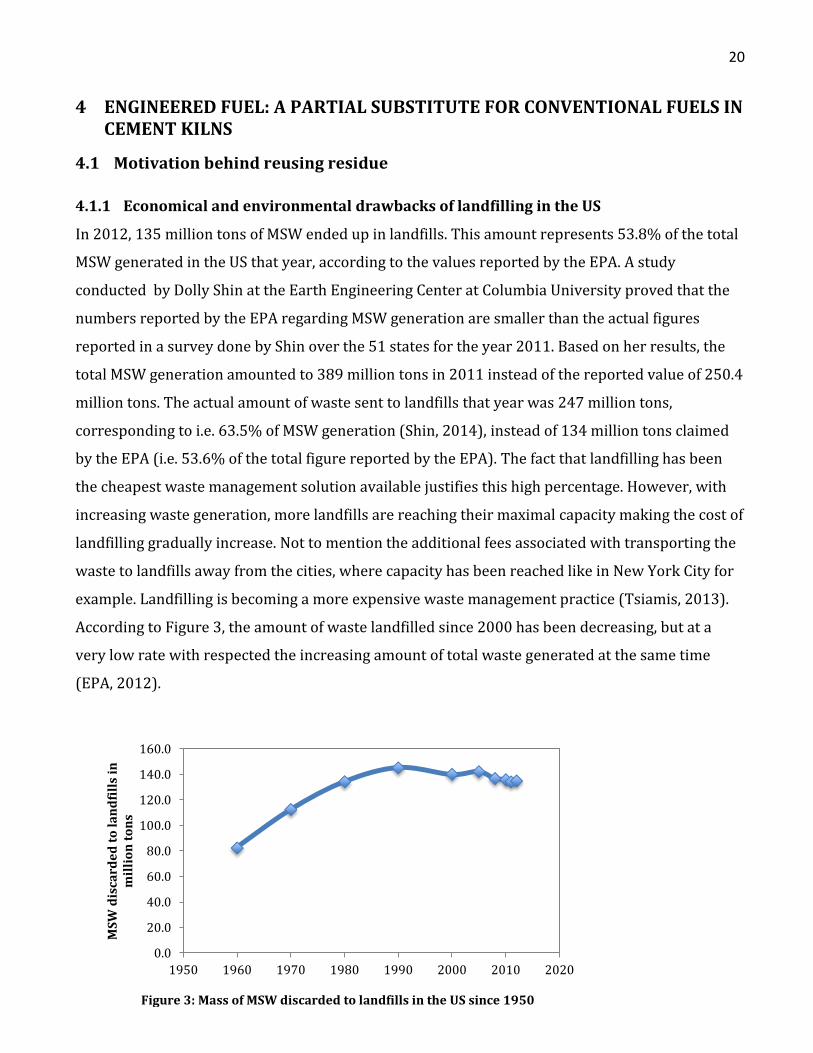
According to Figure 3, the amount of waste landfilled since 2000 has been decreasing, but at a
very low rate with respected the increasing amount of total waste generated at the same time
(EPA, 2012).
0.0
20.0
40.0
60.0
80.0
100.0
120.0
140.0
160.0
1950 1960 1970 1980 1990 2000 2010 2020
MS
W d
isca
rde
d t
o l
an
dfi
lls
in
mil
lio
n t
on
s
Figure 3: Mass of MSW discarded to landfills in the US since 1950
21
Direct consequences of landfills include without being limited to polluting the environment,
reducing green spaces and bothering the surrounding communities aesthetically or even by
threatening their health with disease-causing pathogens if operated improperly. Landfilling is
definitely the least sustainable waste management practice and diversion methods are of major
importance.
The waste in landfills should be seen as a source of energy and material recovery and therefore a
large opportunity for alternative waste management practices such as waste to energy and
recycling.
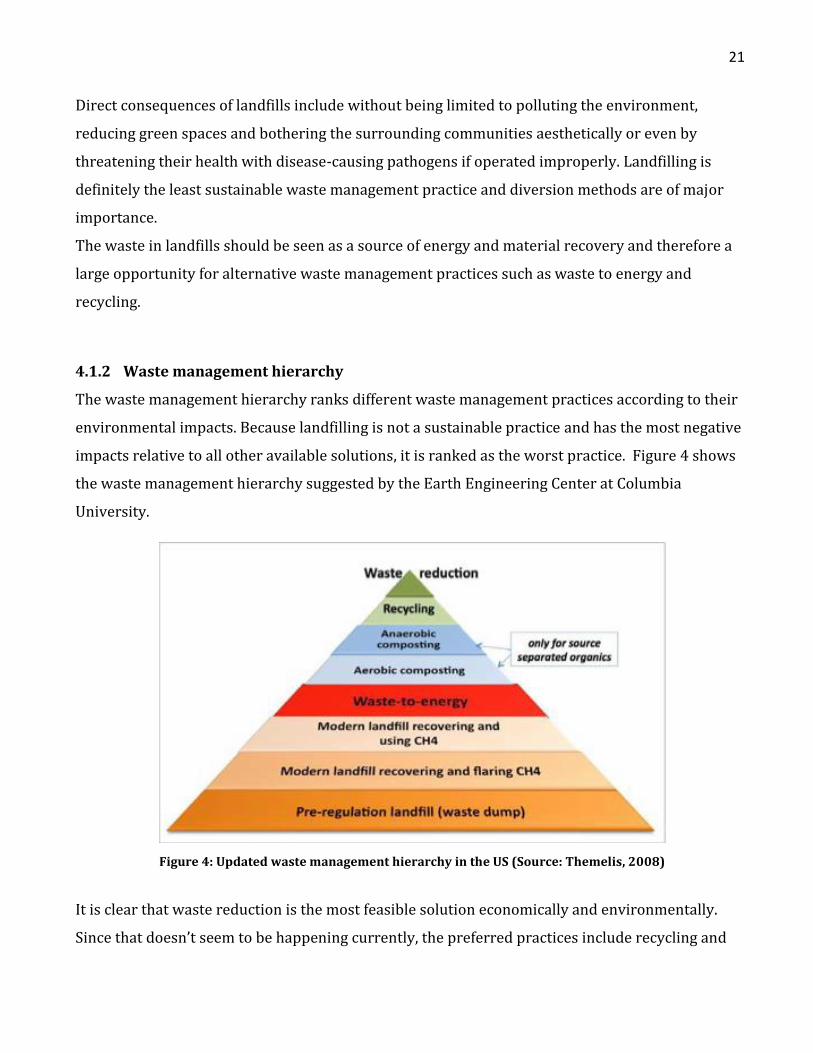
4.1.2 Waste management hierarchy
The waste management hierarchy ranks different waste management practices according to their
environmental impacts. Because landfilling is not a sustainable practice and has the most negative
impacts relative to all other available solutions, it is ranked as the worst practice. Figure 4 shows
the waste management hierarchy suggested by the Earth Engineering Center at Columbia
University.
It is clear that waste reduction is the most feasible solution economically and environmentally.
Since that doesn’t seem to be happening currently, the preferred practices include recycling and
Figure 4: Updated waste management hierarchy in the US (Source: Themelis, 2008)
22
composting of source-separated organic materials. Waste-to-energy refers to all processes that
involve complete combustion of waste as a source of energy for different purposes such as
electricity generation, cement production and other applications. In 2012, the EPA reported that
11.7% of the total MSW generated in the US was used in Waste-to-Energy applications (EPA,
2012).
4.2 Two case studies
The entire CEMEX company counts 61 plants spread over the US and Mexico and ranks 7th
according to globalcement.com in both the top 20 and top 75 cement companies lists from 2011
(Global Cement, 2011). The results are calculated from clinker capacity assuming 95% clinker
factor.
4.2.1 Data from Plants (Tepeaca plant)
4.2.1.1 Who is Tepeaca?
The Tepeaca plant is located in the area of Puebla in Mexico and produces 3.30 million tons of
cement per year. Data on fuel consumption, cement and clinker production as well as emissions
were provided for both years 2012 and 2013. Values were reported on a monthly basis for both
fuel consumption and cement/clinker generation but on an annual basis for emissions.
23
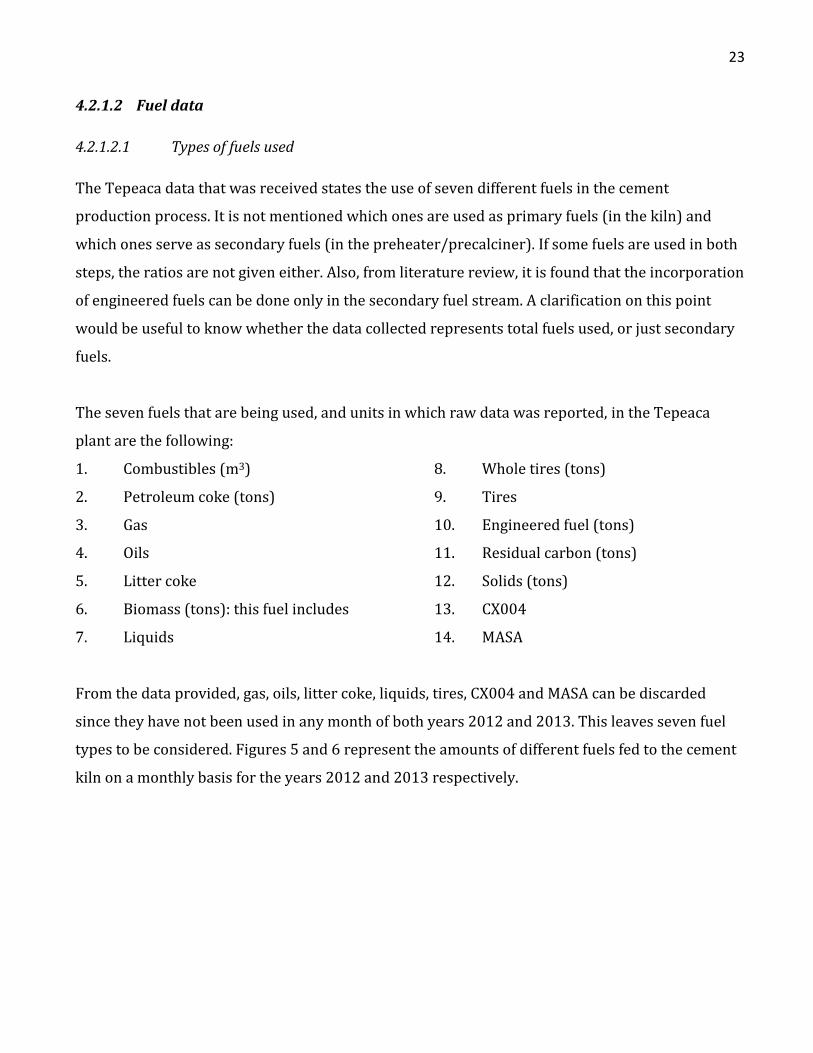
4.2.1.2 Fuel data
4.2.1.2.1 Types of fuels used
The Tepeaca data that was received states the use of seven different fuels in the cement
production process. It is not mentioned which ones are used as primary fuels (in the kiln) and
which ones serve as secondary fuels (in the preheater/precalciner). If some fuels are used in both
steps, the ratios are not given either. Also, from literature review, it is found that the incorporation
of engineered fuels can be done only in the secondary fuel stream. A clarification on this point
would be useful to know whether the data collected represents total fuels used, or just secondary
fuels.
The seven fuels that are being used, and units in which raw data was reported, in the Tepeaca
plant are the following:
1. Combustibles (m3)
2. Petroleum coke (tons)
3. Gas
4. Oils
5. Litter coke
6. Biomass (tons): this fuel includes
7. Liquids
8. Whole tires (tons)
9. Tires
10. Engineered fuel (tons)
11. Residual carbon (tons)
12. Solids (tons)
13. CX004
14. MASA
From the data provided, gas, oils, litter coke, liquids, tires, CX004 and MASA can be discarded
since they have not been used in any month of both years 2012 and 2013. This leaves seven fuel
types to be considered. Figures 5 and 6 represent the amounts of different fuels fed to the cement
kiln on a monthly basis for the years 2012 and 2013 respectively.
24
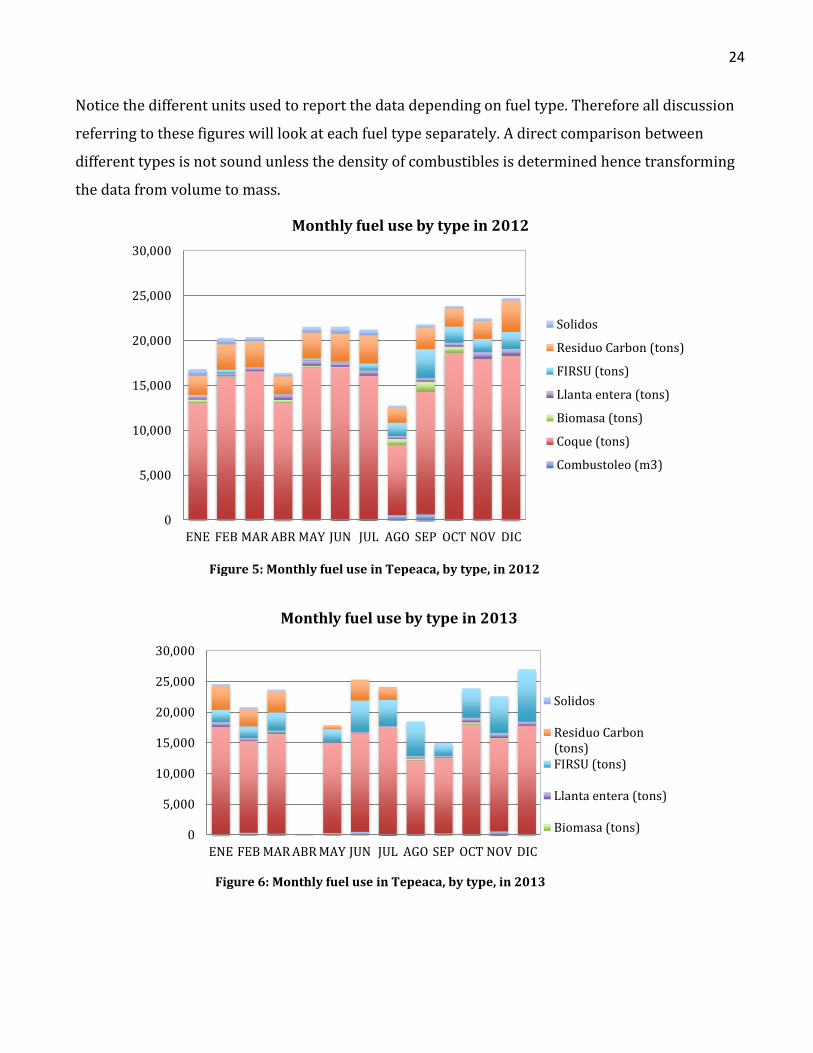
Notice the different units used to report the data depending on fuel type. Therefore all discussion
referring to these figures will look at each fuel type separately. A direct comparison between
different types is not sound unless the density of combustibles is determined hence transforming
the data from volume to mass.
0
5,000
10,000
15,000
20,000
25,000
30,000
ENE FEB MAR ABR MAY JUN JUL AGO SEP OCT NOV DIC
Monthly fuel use by type in 2012
Solidos
Residuo Carbon (tons)
FIRSU (tons)
Llanta entera (tons)
Biomasa (tons)
Coque (tons)
Combustoleo (m3)
0
5,000
10,000
15,000
20,000
25,000
30,000
ENE FEB MAR ABR MAY JUN JUL AGO SEP OCT NOV DIC
Monthly fuel use by type in 2013
Solidos
Residuo Carbon(tons)FIRSU (tons)
Llanta entera (tons)
Biomasa (tons)
Figure 5: Monthly fuel use in Tepeaca, by type, in 2012
Figure 6: Monthly fuel use in Tepeaca, by type, in 2013
25
It is obvious from Figures 5 and 6 that even without knowing the density of combustibles, the
biggest contribution of fuel to the cement kiln is made by pet coke, a 100% fossil fuel. The second
fuel by quantity was the group of residual carbon materials in 2012 compared to engineered fuel
in 2013. This observation is an indication that engineered fuel partially substituted fossil fuels
since quantities of both pet coke and residual carbon decreased making space for engineered
fuels.
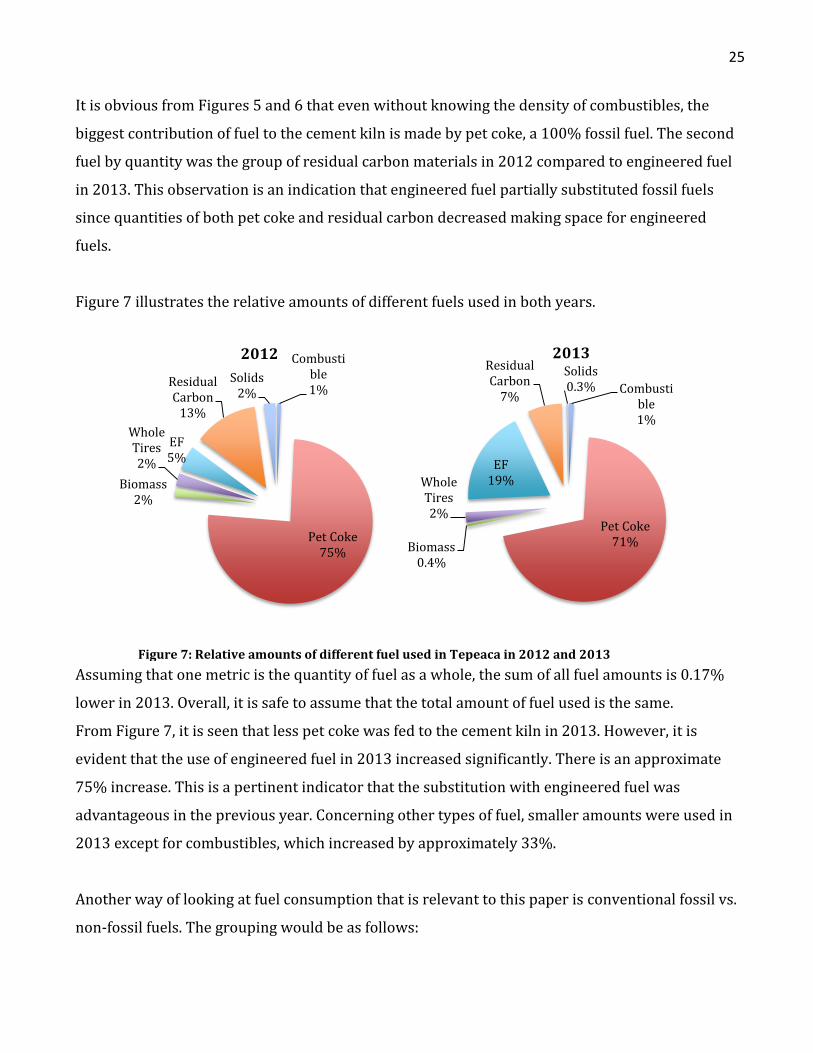
Figure 7 illustrates the relative amounts of different fuels used in both years.
Assuming that one metric is the quantity of fuel as a whole, the sum of all fuel amounts is 0.17%
lower in 2013. Overall, it is safe to assume that the total amount of fuel used is the same.
From Figure 7, it is seen that less pet coke was fed to the cement kiln in 2013. However, it is
evident that the use of engineered fuel in 2013 increased significantly. There is an approximate
75% increase. This is a pertinent indicator that the substitution with engineered fuel was
advantageous in the previous year. Concerning other types of fuel, smaller amounts were used in
2013 except for combustibles, which increased by approximately 33%.
Another way of looking at fuel consumption that is relevant to this paper is conventional fossil vs.
non-fossil fuels. The grouping would be as follows:
Combustible 1%
Pet Coke 75%
Biomass 2%
Whole Tires 2%
EF 5%
Residual Carbon
13%
Solids 2%
2012
Combustible 1%
Pet Coke 71% Biomass
0.4%
Whole Tires 2%
EF 19%
Residual Carbon
7%
Solids 0.3%
2013
Figure 7: Relative amounts of different fuel used in Tepeaca in 2012 and 2013
26
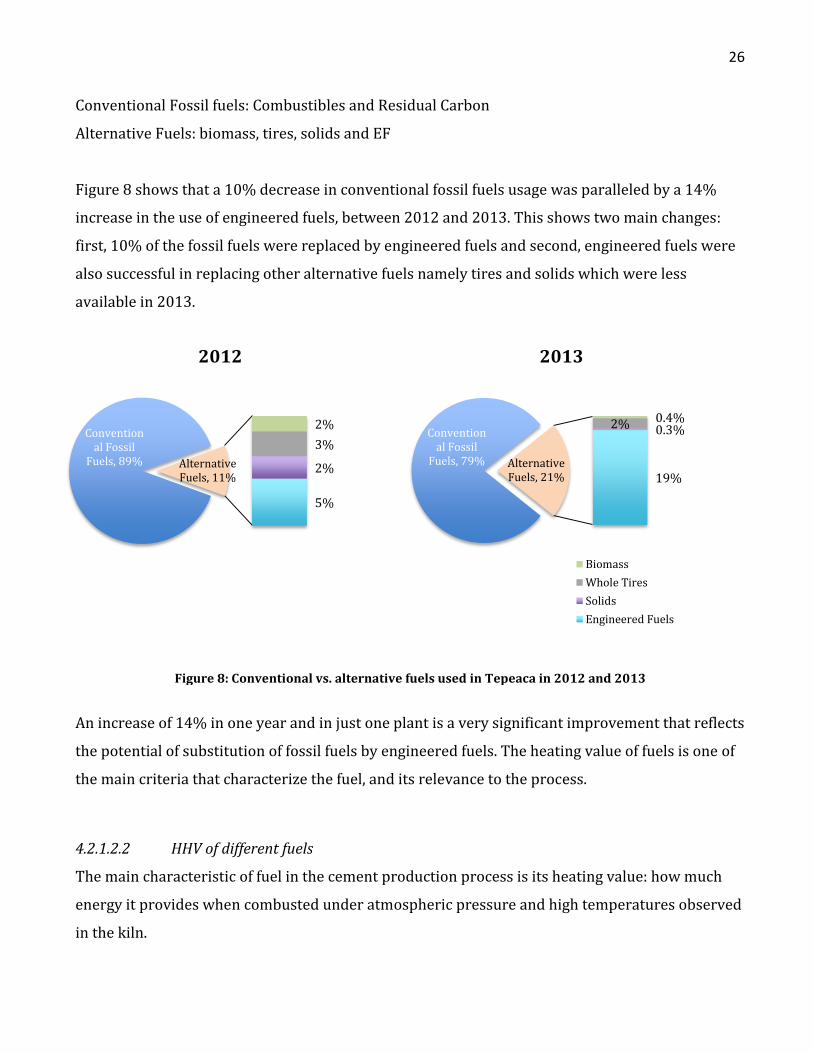
Conventional Fossil fuels: Combustibles and Residual Carbon
Alternative Fuels: biomass, tires, solids and EF
Figure 8 shows that a 10% decrease in conventional fossil fuels usage was paralleled by a 14%
increase in the use of engineered fuels, between 2012 and 2013. This shows two main changes:
first, 10% of the fossil fuels were replaced by engineered fuels and second, engineered fuels were
also successful in replacing other alternative fuels namely tires and solids which were less
available in 2013.
An increase of 14% in one year and in just one plant is a very significant improvement that reflects
the potential of substitution of fossil fuels by engineered fuels. The heating value of fuels is one of
the main criteria that characterize the fuel, and its relevance to the process.
4.2.1.2.2 HHV of different fuels
The main characteristic of fuel in the cement production process is its heating value: how much
energy it provides when combusted under atmospheric pressure and high temperatures observed
in the kiln.
Conventional Fossil
Fuels, 79%
0.4% 2% 0.3%
19% Alternative Fuels, 21%
2013
Biomass
Whole Tires
Solids
Engineered Fuels
Conventional Fossil
Fuels, 89%
2%
3%
2%
5%
Alternative Fuels, 11%
2012
Figure 8: Conventional vs. alternative fuels used in Tepeaca in 2012 and 2013
27
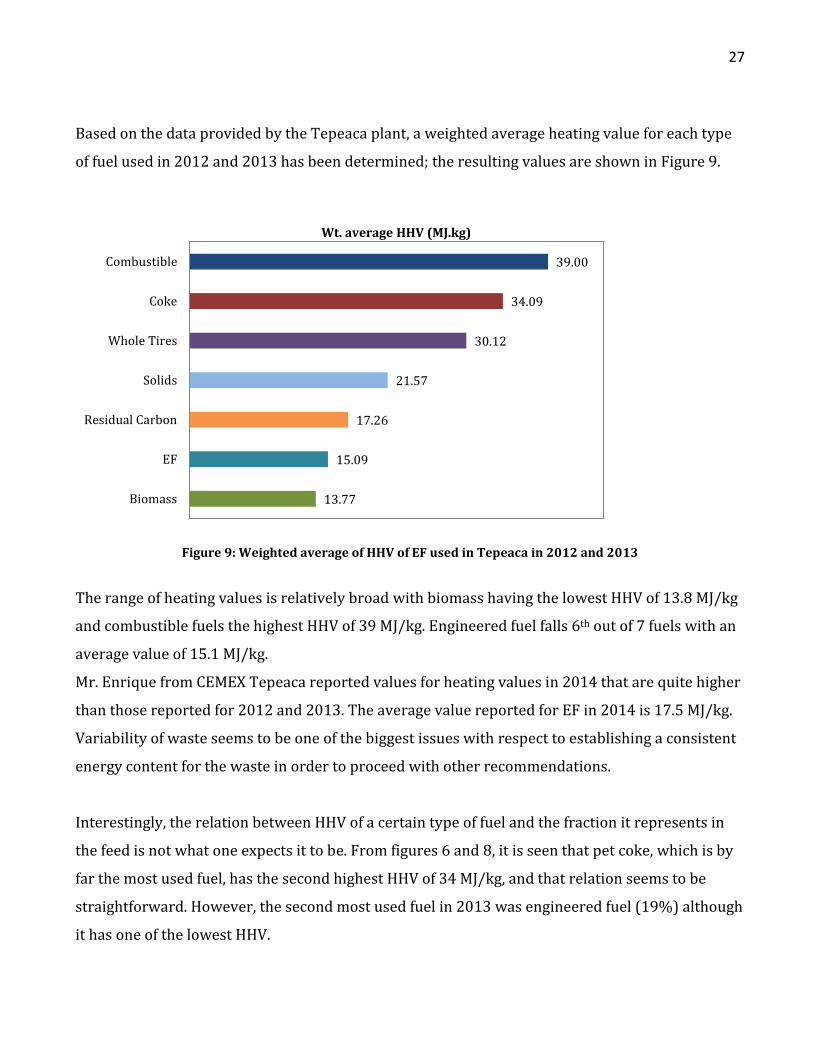
Based on the data provided by the Tepeaca plant, a weighted average heating value for each type
of fuel used in 2012 and 2013 has been determined; the resulting values are shown in Figure 9.
Figure 9: Weighted average of HHV of EF used in Tepeaca in 2012 and 2013
The range of heating values is relatively broad with biomass having the lowest HHV of 13.8 MJ/kg
and combustible fuels the highest HHV of 39 MJ/kg. Engineered fuel falls 6th out of 7 fuels with an
average value of 15.1 MJ/kg.
Mr. Enrique from CEMEX Tepeaca reported values for heating values in 2014 that are quite higher
than those reported for 2012 and 2013. The average value reported for EF in 2014 is 17.5 MJ/kg.
Variability of waste seems to be one of the biggest issues with respect to establishing a consistent
energy content for the waste in order to proceed with other recommendations.
Interestingly, the relation between HHV of a certain type of fuel and the fraction it represents in
the feed is not what one expects it to be. From figures 6 and 8, it is seen that pet coke, which is by
far the most used fuel, has the second highest HHV of 34 MJ/kg, and that relation seems to be
straightforward. However, the second most used fuel in 2013 was engineered fuel (19%) although
it has one of the lowest HHV.
39.00
34.09
30.12
21.57
17.26
15.09
13.77
Combustible
Coke
Whole Tires
Solids
Residual Carbon
EF
Biomass
Wt. average HHV (MJ.kg)
28
This observation is meaningful and promising with respect to the aim of this paper being to prove
the efficiency of using more EF instead of fossil fuels in the process.
It is noteworthy that generally, in US based cement production plants, the main type of fuel used is
coal, which has a relatively lower HHV than pet coke. Coal is found in different grades depending
on its energy content which can be as high as 36 MJ/kg for bituminous coal and as low as 9 MJ/kg
for lignite coal (American Coal Foundation, 2005). The most common type of coal used in the US
for fueling industrial processes that involve burning the coal is subbituminous coal for its lower
sulfur content (which makes it a cleaner burning fuel). Its energy content ranges from 19 to 30
MJ/kg (American Coal Foundation, 2005). By extrapolating to the US cement industry, EF and coal
are therefore comparable with respect to heating content, if the EF used across the country is
assumed to be similar in composition to the one used in Tepeaca.
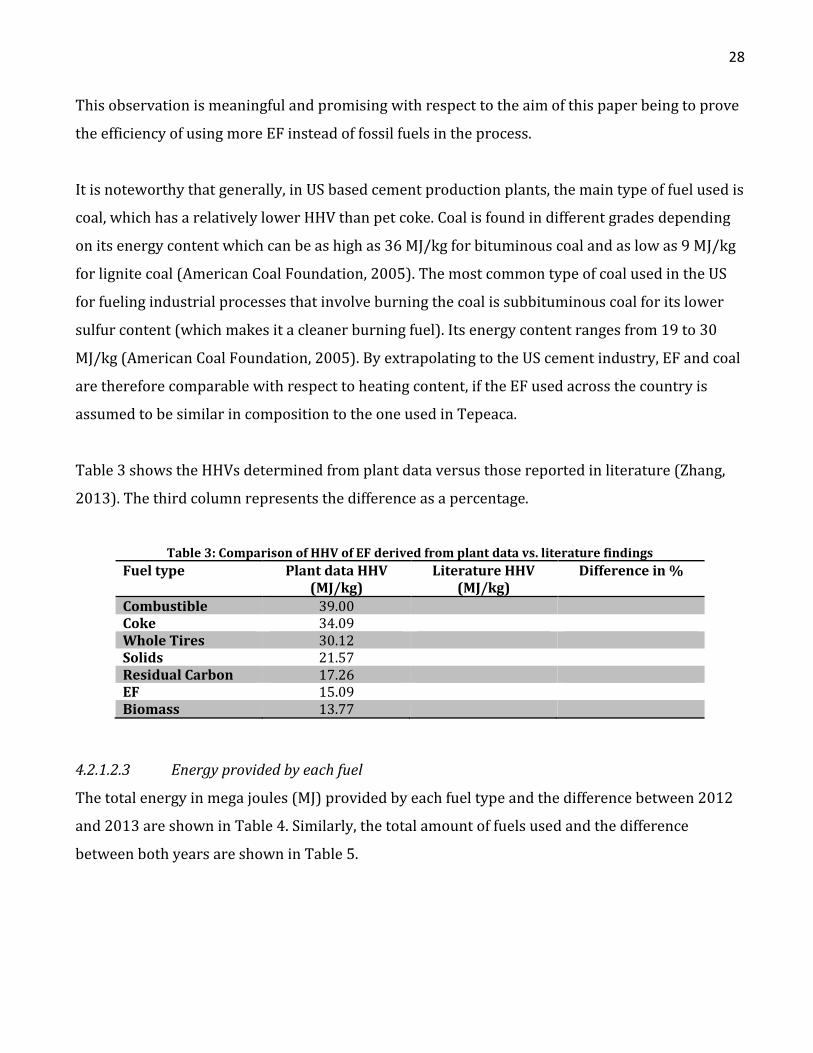
Table 3 shows the HHVs determined from plant data versus those reported in literature (Zhang,
2013). The third column represents the difference as a percentage.
Table 3: Comparison of HHV of EF derived from plant data vs. literature findings
Fuel type Plant data HHV (MJ/kg)
Literature HHV (MJ/kg)
Difference in %
Combustible 39.00 Coke 34.09 Whole Tires 30.12 Solids 21.57 Residual Carbon 17.26 EF 15.09 Biomass 13.77
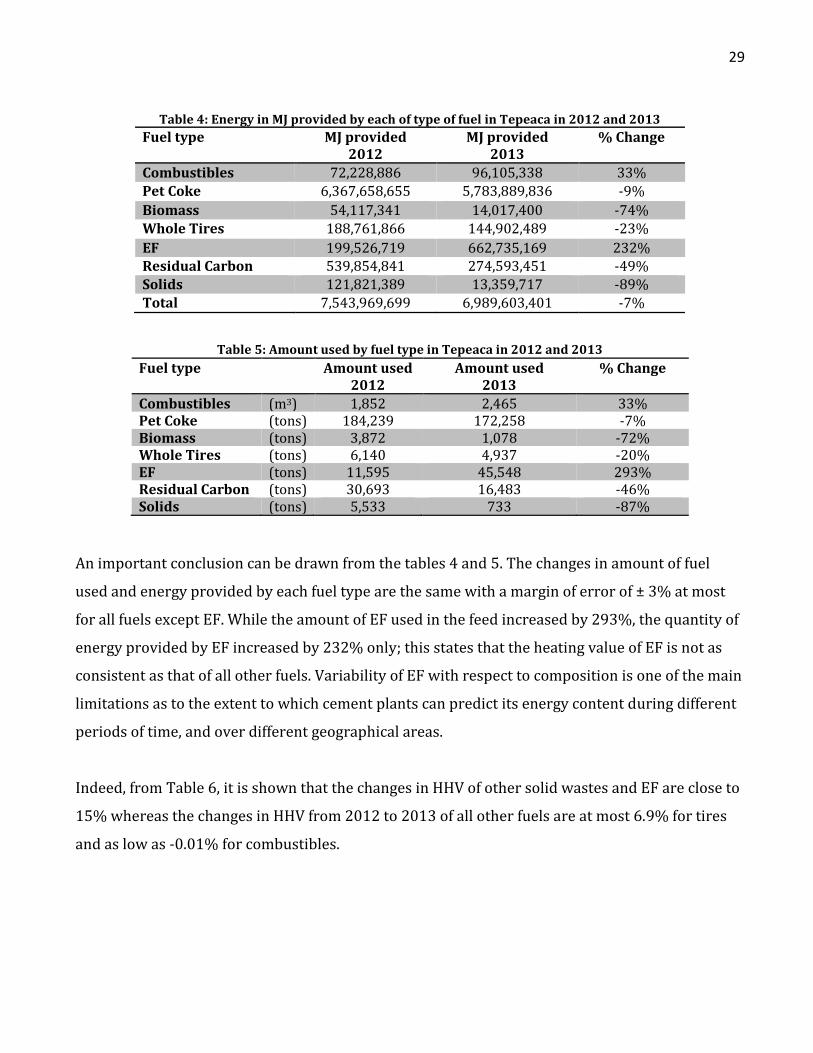
4.2.1.2.3 Energy provided by each fuel
The total energy in mega joules (MJ) provided by each fuel type and the difference between 2012
and 2013 are shown in Table 4. Similarly, the total amount of fuels used and the difference
between both years are shown in Table 5.
29
Table 4: Energy in MJ provided by each of type of fuel in Tepeaca in 2012 and 2013
Fuel type MJ provided 2012
MJ provided 2013
% Change
Combustibles 72,228,886 96,105,338 33% Pet Coke 6,367,658,655 5,783,889,836 -9%
Biomass 54,117,341 14,017,400 -74% Whole Tires 188,761,866 144,902,489 -23%
EF 199,526,719 662,735,169 232% Residual Carbon 539,854,841 274,593,451 -49% Solids 121,821,389 13,359,717 -89% Total 7,543,969,699 6,989,603,401 -7%
Table 5: Amount used by fuel type in Tepeaca in 2012 and 2013
An important conclusion can be drawn from the tables 4 and 5. The changes in amount of fuel
used and energy provided by each fuel type are the same with a margin of error of ± 3% at most
for all fuels except EF. While the amount of EF used in the feed increased by 293%, the quantity of
energy provided by EF increased by 232% only; this states that the heating value of EF is not as
consistent as that of all other fuels. Variability of EF with respect to composition is one of the main
limitations as to the extent to which cement plants can predict its energy content during different
periods of time, and over different geographical areas.
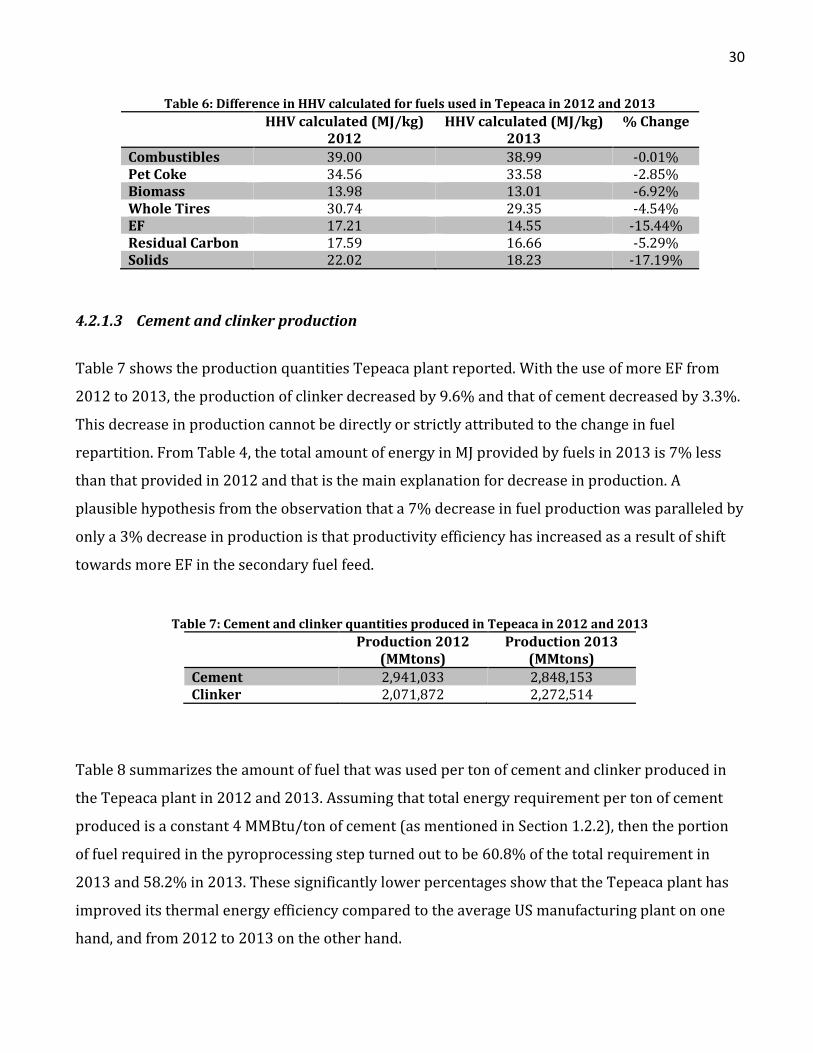
Indeed, from Table 6, it is shown that the changes in HHV of other solid wastes and EF are close to
15% whereas the changes in HHV from 2012 to 2013 of all other fuels are at most 6.9% for tires
and as low as -0.01% for combustibles.
Fuel type Amount used 2012
Amount used 2013
% Change
Combustibles (m3) 1,852 2,465 33% Pet Coke (tons) 184,239 172,258 -7% Biomass (tons) 3,872 1,078 -72% Whole Tires (tons) 6,140 4,937 -20% EF (tons) 11,595 45,548 293% Residual Carbon (tons) 30,693 16,483 -46% Solids (tons) 5,533 733 -87%
30
Table 6: Difference in HHV calculated for fuels used in Tepeaca in 2012 and 2013
HHV calculated (MJ/kg) 2012
HHV calculated (MJ/kg) 2013
% Change
Combustibles 39.00 38.99 -0.01% Pet Coke 34.56 33.58 -2.85% Biomass 13.98 13.01 -6.92% Whole Tires 30.74 29.35 -4.54% EF 17.21 14.55 -15.44% Residual Carbon 17.59 16.66 -5.29% Solids 22.02 18.23 -17.19%
4.2.1.3 Cement and clinker production
Table 7 shows the production quantities Tepeaca plant reported. With the use of more EF from
2012 to 2013, the production of clinker decreased by 9.6% and that of cement decreased by 3.3%.
This decrease in production cannot be directly or strictly attributed to the change in fuel
repartition. From Table 4, the total amount of energy in MJ provided by fuels in 2013 is 7% less
than that provided in 2012 and that is the main explanation for decrease in production. A
plausible hypothesis from the observation that a 7% decrease in fuel production was paralleled by
only a 3% decrease in production is that productivity efficiency has increased as a result of shift
towards more EF in the secondary fuel feed.
Table 7: Cement and clinker quantities produced in Tepeaca in 2012 and 2013
Production 2012 (MMtons)
Production 2013 (MMtons)
Cement 2,941,033 2,848,153 Clinker 2,071,872 2,272,514
Table 8 summarizes the amount of fuel that was used per ton of cement and clinker produced in
the Tepeaca plant in 2012 and 2013. Assuming that total energy requirement per ton of cement
produced is a constant 4 MMBtu/ton of cement (as mentioned in Section 1.2.2), then the portion
of fuel required in the pyroprocessing step turned out to be 60.8% of the total requirement in
2013 and 58.2% in 2013. These significantly lower percentages show that the Tepeaca plant has
improved its thermal energy efficiency compared to the average US manufacturing plant on one
hand, and from 2012 to 2013 on the other hand.
31
Table 8: Amount of fuel used per ton of product in Tepeaca in 2012 and 2013
2012 2013
MMBtu/ton produced % of 4 MMBtu MMBtu/ton produced % of 4 MMBtu Cement 2.43 60.8% 2.32 58.2% Clinker 3.45 86.3% 2.92 72.9%
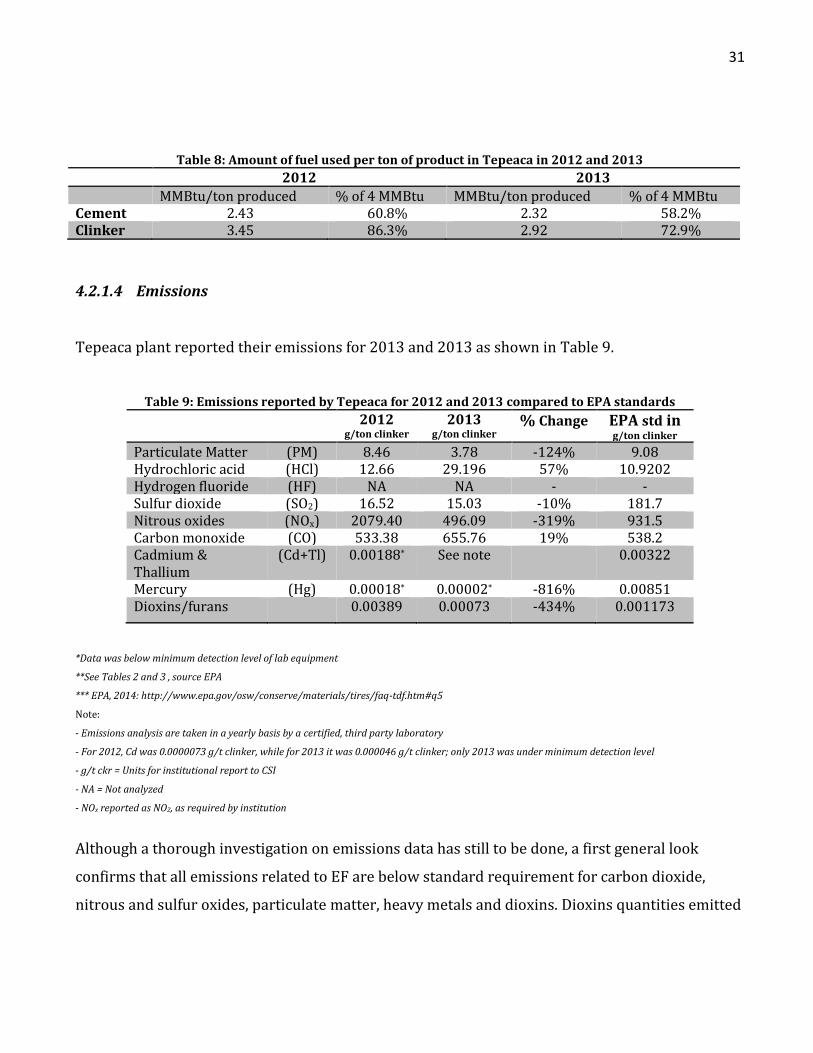
4.2.1.4 Emissions
Tepeaca plant reported their emissions for 2013 and 2013 as shown in Table 9.
Table 9: Emissions reported by Tepeaca for 2012 and 2013 compared to EPA standards
2012 g/ton clinker
2013 g/ton clinker
% Change EPA std in g/ton clinker
Particulate Matter (PM) 8.46 3.78 -124% 9.08 Hydrochloric acid (HCl) 12.66 29.196 57% 10.9202 Hydrogen fluoride (HF) NA NA - - Sulfur dioxide (SO2) 16.52 15.03 -10% 181.7 Nitrous oxides (NOx) 2079.40 496.09 -319% 931.5 Carbon monoxide (CO) 533.38 655.76 19% 538.2 Cadmium & Thallium
(Cd+Tl) 0.00188* See note 0.00322
Mercury (Hg) 0.00018* 0.00002* -816% 0.00851 Dioxins/furans 0.00389 0.00073 -434% 0.001173
*Data was below minimum detection level of lab equipment
**See Tables 2 and 3 , source EPA
*** EPA, 2014: http://www.epa.gov/osw/conserve/materials/tires/faq-tdf.htm#q5
Note:
- Emissions analysis are taken in a yearly basis by a certified, third party laboratory
- For 2012, Cd was 0.0000073 g/t clinker, while for 2013 it was 0.000046 g/t clinker; only 2013 was under minimum detection level
- g/t ckr = Units for institutional report to CSI
- NA = Not analyzed
- NOx reported as NO2, as required by institution
Although a thorough investigation on emissions data has still to be done, a first general look
confirms that all emissions related to EF are below standard requirement for carbon dioxide,
nitrous and sulfur oxides, particulate matter, heavy metals and dioxins. Dioxins quantities emitted
32
from the air pollution control unit of cement plants were reported to be independent of whether
alternative fuels are used or not as fuel in the rotary kiln (EPA, 2014).
4.2.2 Experimental Testing (Balcones)
4.2.2.1 The Balcones cement plant of CEMEX
Based on published information from the CEMEX Balcones Cement Plant, the most updated data
and facts state the plant has been operating since 1980 and earned the energy star - a program
that was established by the EPA in 1992, to "conduct a basic engineering research and technology
program to develop, evaluate, and demonstrate non–regulatory strategies and technologies for
reducing air pollution – in November 2011. It underwent a massive expansion in 2008 after which
its capacity of production of Portland cement reached 2.5 million tons of cement per year (Cemex,
2014).
4.2.2.2 Testing samples for fuel data
4.2.2.2.1 Experimental Setup Description
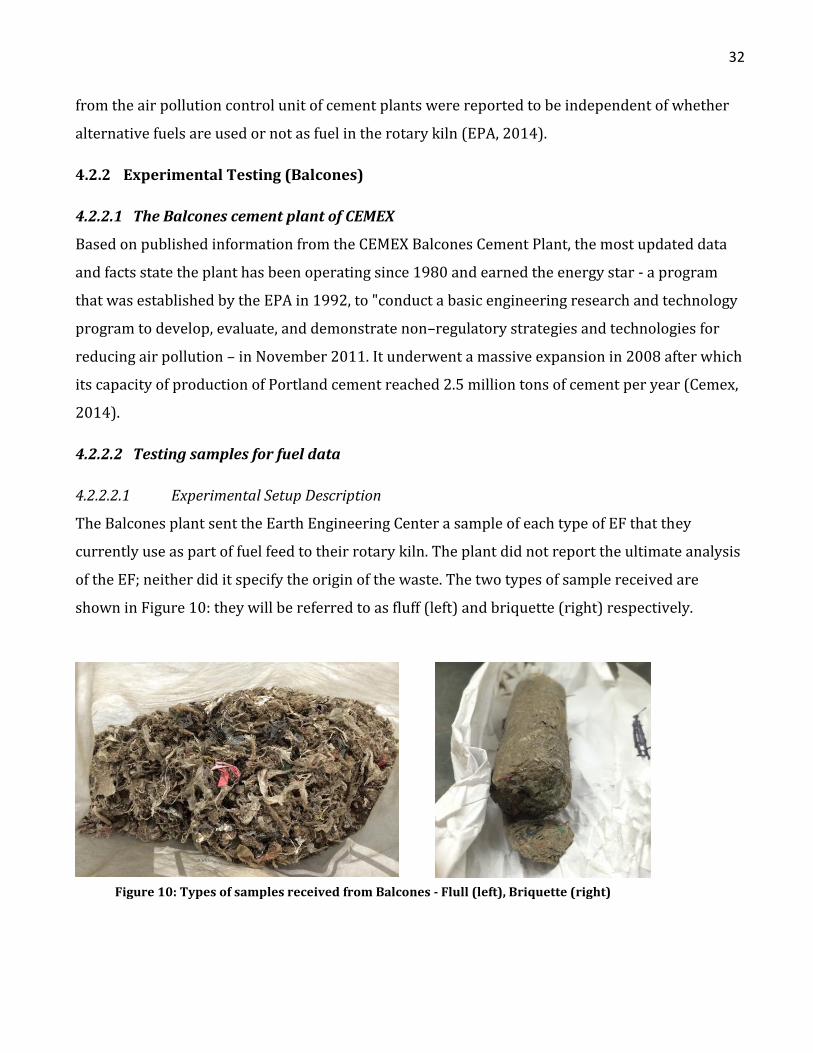
The Balcones plant sent the Earth Engineering Center a sample of each type of EF that they
currently use as part of fuel feed to their rotary kiln. The plant did not report the ultimate analysis
of the EF; neither did it specify the origin of the waste. The two types of sample received are
shown in Figure 10: they will be referred to as fluff (left) and briquette (right) respectively.
Figure 10: Types of samples received from Balcones - Flull (left), Briquette (right)
33
The fluff and the briquette contain exactly the same waste material and have both been processed
in the same way with an additional densifying step for the briquette at the very end of the
processing. Its compact form makes the briquette easier to handle and to transport on the
conveyor belts generally used to feed the fuel to the kiln, preheater and precalciner in cement
production plants.
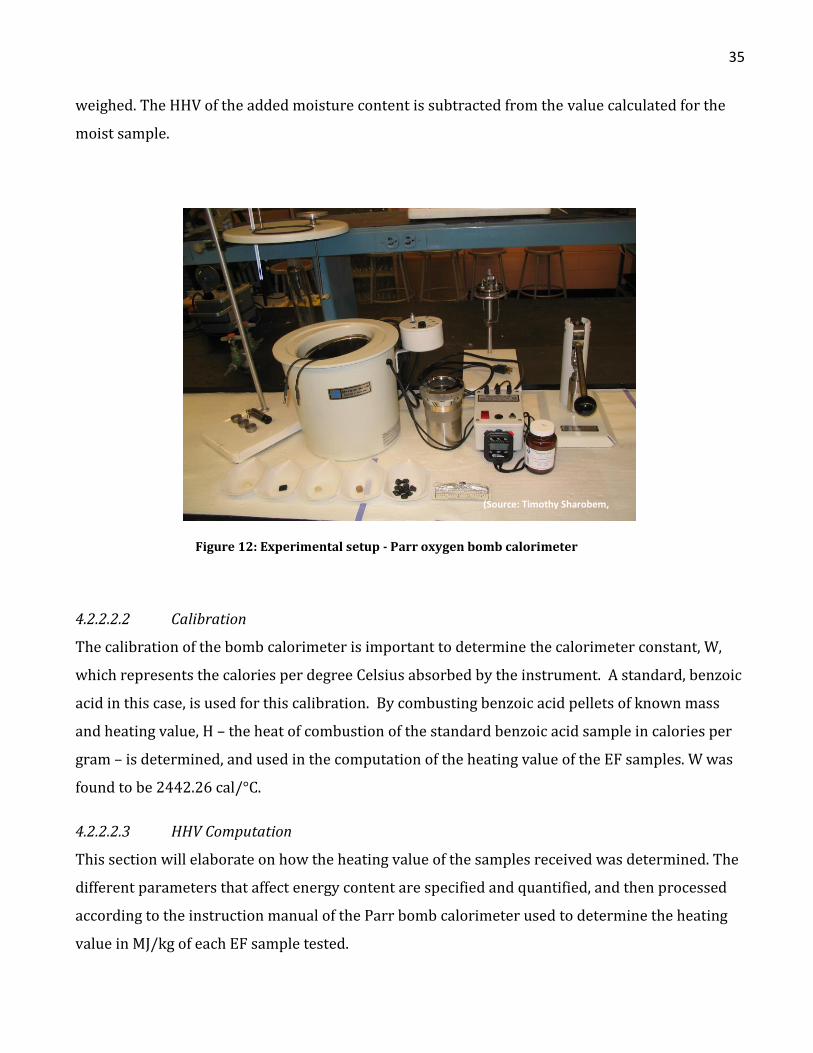
Using a Parr Oxygen Bomb Calorimeter, shown in Figure 12 (Sharobem, 2014), samples of < 0.8
grams were combusted with pure oxygen at 25 atmospheres. The protocol followed is ASTM
D5468-02: “Standard Test Method for Gross Calorific and Ash Value of Waste Material”. The
procedure mainly covers all the required assumptions and error factors to be considered while
determining the calorific value of Refuse-Derived Fuels using a bomb calorimeter. The parameters
considered include but are not limitied to: sulfur and chlorine correction factors, fuse wire,
radiation correction factor, etc. The sample is placed in a crucible where it is put in contact with a
fuse wire. The bomb is securely closed, and filled with O2 to 25 atm. In summary, the oxygen bomb
is placed in a water bucket inside the jacket and closed. A 5-minute pre-stirring period allows the
water temperature to homogenize before starting to record temperature readings. Temperature is
recorded every minute until a stable temperature is observed. Following stable readings for
approximately five minutes, the bomb’s firing button is pressed and held for 5 seconds. The sends
an electric current through the fues wire causing it to heat and ignite the EF sample, which
initiates the combustion process of the entire sample. This causes the temperature to rise quickly
requiring temperature to be recorded every 15 seconds until a stable final temperature is
achieved which is typically about ten minutes. Subsequently measurements are recorded every
minute until the rate of change of temperature becomes null or constant over 5 consecutive 1-
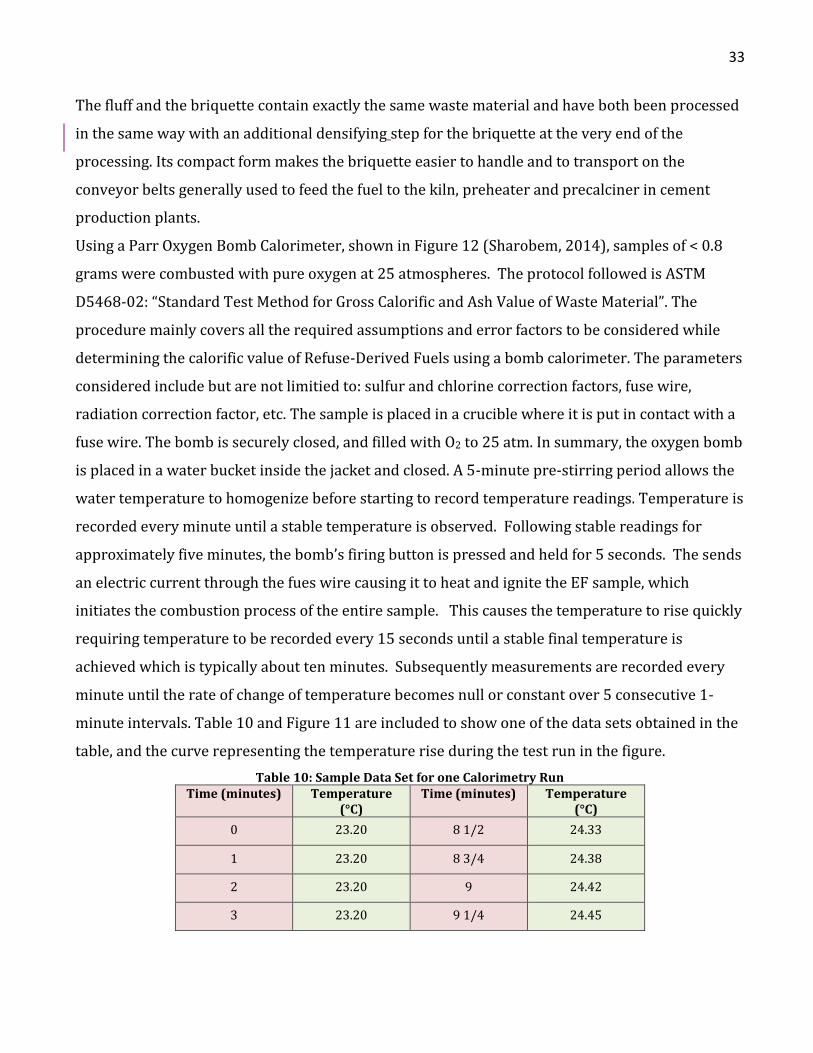
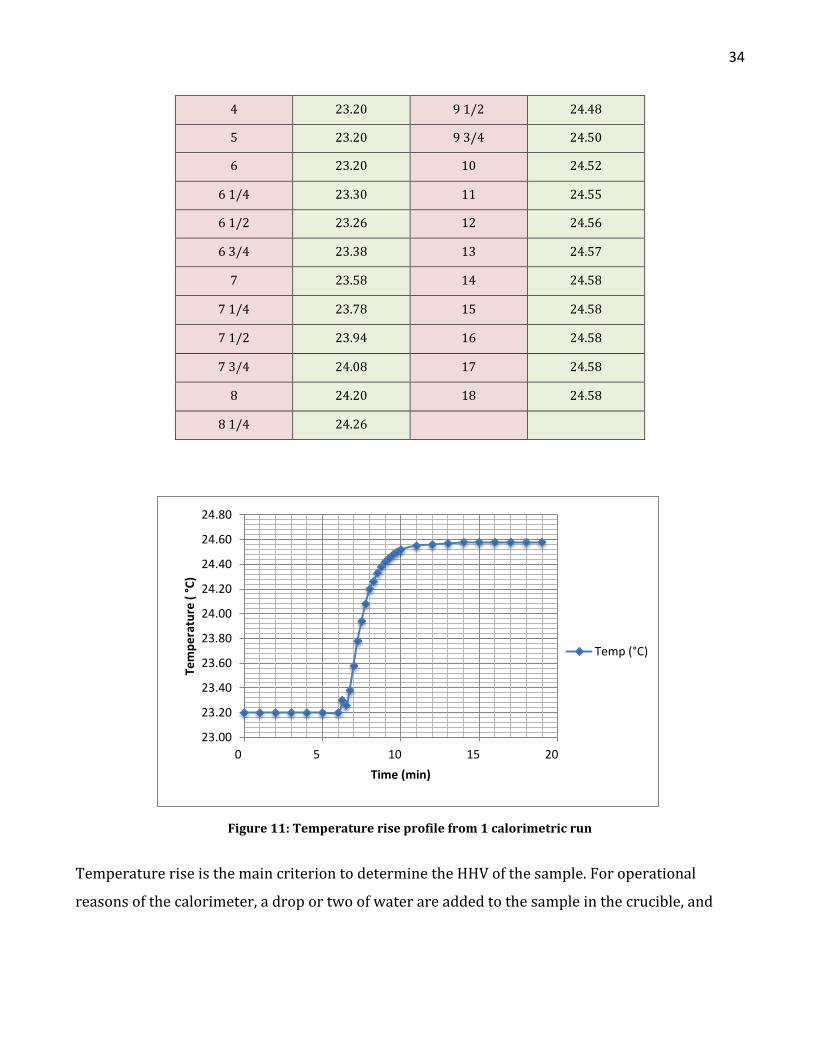
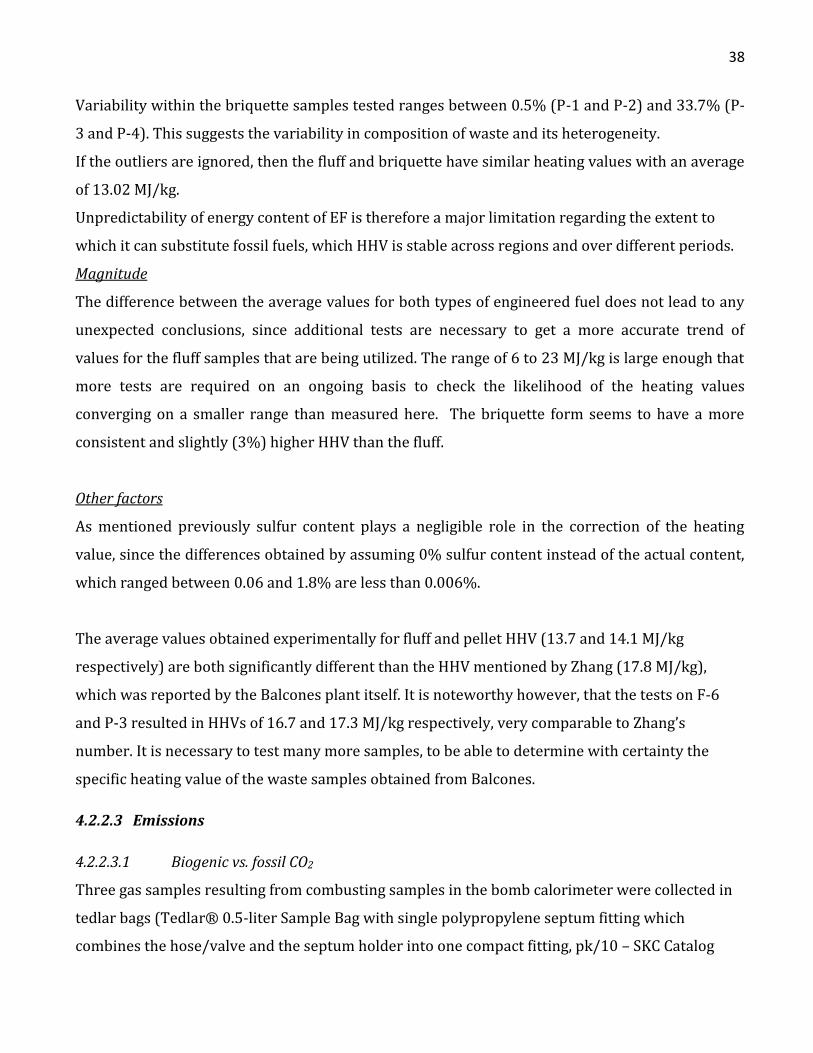
minute intervals. Table 10 and Figure 11 are included to show one of the data sets obtained in the
table, and the curve representing the temperature rise during the test run in the figure.
Table 10: Sample Data Set for one Calorimetry Run Time (minutes) Temperature
(°C) Time (minutes) Temperature
(°C)
0 23.20 8 1/2 24.33
1 23.20 8 3/4 24.38
2 23.20 9 24.42
3 23.20 9 1/4 24.45
34
4 23.20 9 1/2 24.48
5 23.20 9 3/4 24.50
6 23.20 10 24.52
6 1/4 23.30 11 24.55
6 1/2 23.26 12 24.56
6 3/4 23.38 13 24.57
7 23.58 14 24.58
7 1/4 23.78 15 24.58
7 1/2 23.94 16 24.58
7 3/4 24.08 17 24.58
8 24.20 18 24.58
8 1/4 24.26
Figure 11: Temperature rise profile from 1 calorimetric run
Temperature rise is the main criterion to determine the HHV of the sample. For operational
reasons of the calorimeter, a drop or two of water are added to the sample in the crucible, and
23.00
23.20
23.40
23.60
23.80
24.00
24.20
24.40
24.60
24.80
0 5 10 15 20
Tem
pe
ratu
re (
°C
)
Time (min)
Temp (°C)
35
weighed. The HHV of the added moisture content is subtracted from the value calculated for the
moist sample.
4.2.2.2.2 Calibration
The calibration of the bomb calorimeter is important to determine the calorimeter constant, W,
which represents the calories per degree Celsius absorbed by the instrument. A standard, benzoic
acid in this case, is used for this calibration. By combusting benzoic acid pellets of known mass
and heating value, H – the heat of combustion of the standard benzoic acid sample in calories per
gram – is determined, and used in the computation of the heating value of the EF samples. W was
found to be 2442.26 cal/°C.
4.2.2.2.3 HHV Computation
This section will elaborate on how the heating value of the samples received was determined. The
different parameters that affect energy content are specified and quantified, and then processed
according to the instruction manual of the Parr bomb calorimeter used to determine the heating
value in MJ/kg of each EF sample tested.
(Source: Timothy Sharobem, 2014)
Figure 12: Experimental setup - Parr oxygen bomb calorimeter
36
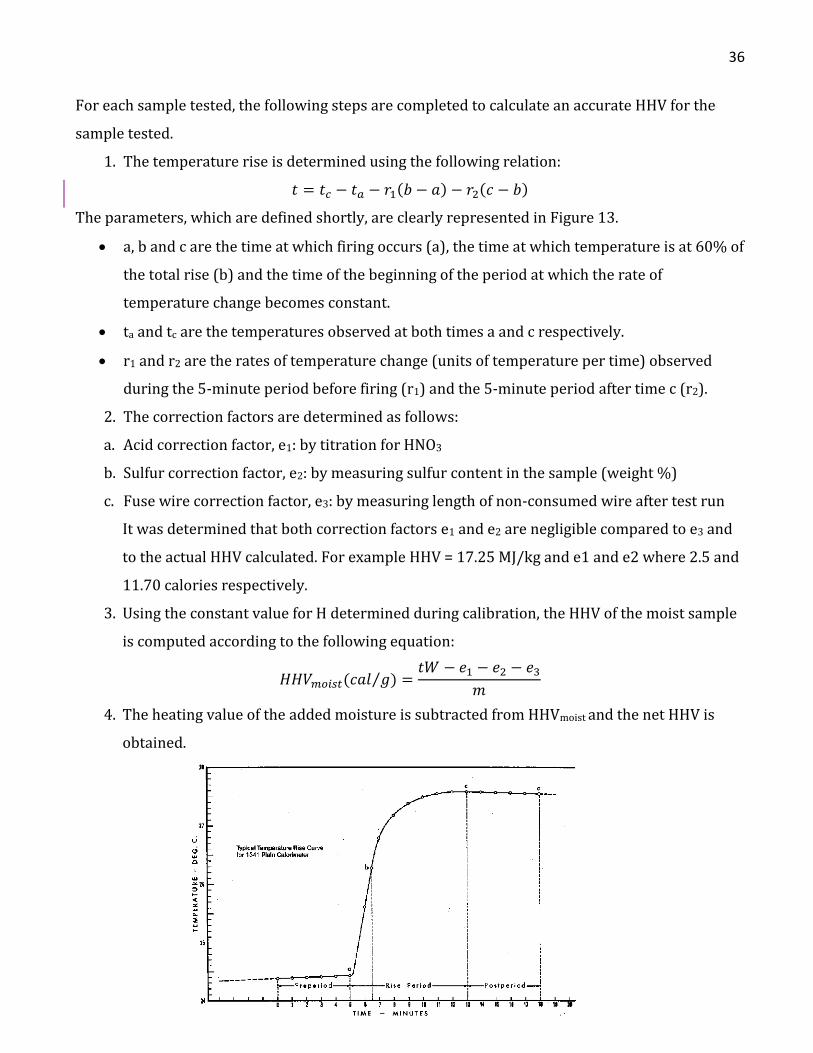
For each sample tested, the following steps are completed to calculate an accurate HHV for the
sample tested.
1. The temperature rise is determined using the following relation:
𝑡 = 𝑡𝑐 − 𝑡𝑎 − 𝑟1(𝑏 − 𝑎) − 𝑟2(𝑐 − 𝑏)
The parameters, which are defined shortly, are clearly represented in Figure 13.
a, b and c are the time at which firing occurs (a), the time at which temperature is at 60% of
the total rise (b) and the time of the beginning of the period at which the rate of
temperature change becomes constant.
ta and tc are the temperatures observed at both times a and c respectively.
r1 and r2 are the rates of temperature change (units of temperature per time) observed
during the 5-minute period before firing (r1) and the 5-minute period after time c (r2).
2. The correction factors are determined as follows:
a. Acid correction factor, e1: by titration for HNO3
b. Sulfur correction factor, e2: by measuring sulfur content in the sample (weight %)
c. Fuse wire correction factor, e3: by measuring length of non-consumed wire after test run
It was determined that both correction factors e1 and e2 are negligible compared to e3 and
to the actual HHV calculated. For example HHV = 17.25 MJ/kg and e1 and e2 where 2.5 and
11.70 calories respectively.
3. Using the constant value for H determined during calibration, the HHV of the moist sample
is computed according to the following equation:
𝐻𝐻𝑉𝑚𝑜𝑖𝑠𝑡(𝑐𝑎𝑙 𝑔⁄ ) =𝑡𝑊 − 𝑒1 − 𝑒2 − 𝑒3
𝑚
4. The heating value of the added moisture is subtracted from HHVmoist and the net HHV is
obtained.
37
Figure 13: Typical temperature rise curve and parameters used to calculate HHV
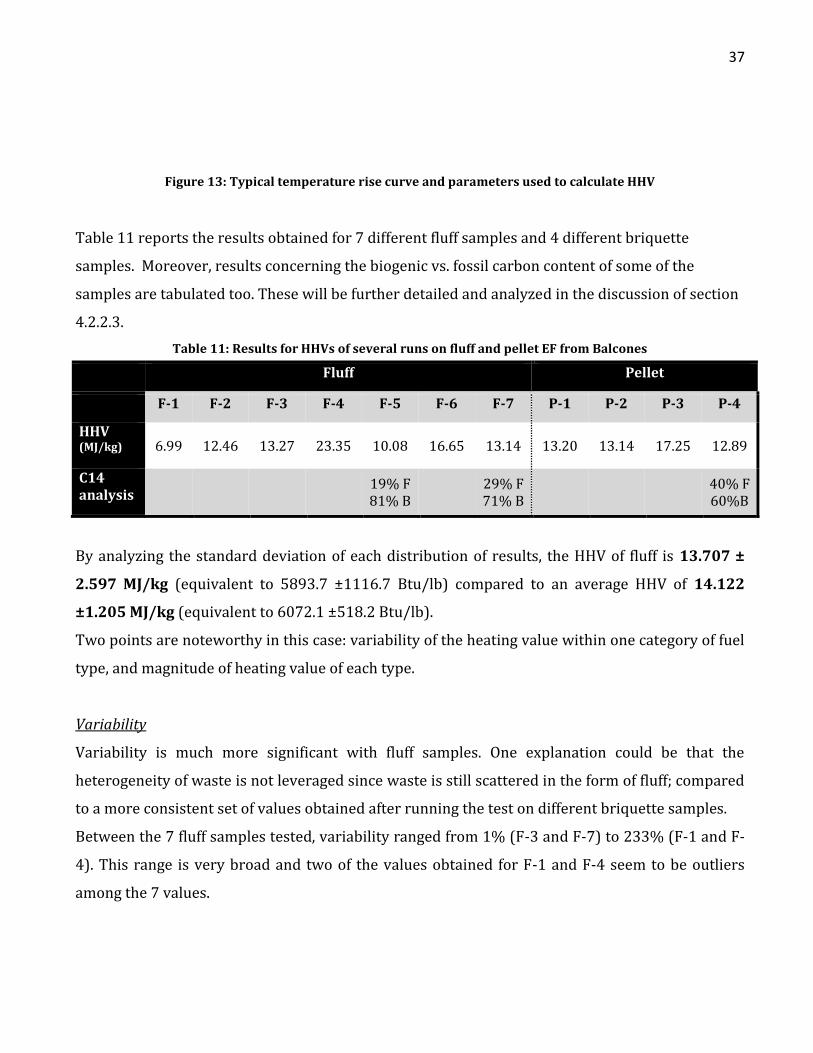
Table 11 reports the results obtained for 7 different fluff samples and 4 different briquette
samples. Moreover, results concerning the biogenic vs. fossil carbon content of some of the
samples are tabulated too. These will be further detailed and analyzed in the discussion of section
4.2.2.3.
Table 11: Results for HHVs of several runs on fluff and pellet EF from Balcones
By analyzing the standard deviation of each distribution of results, the HHV of fluff is 13.707 ±
2.597 MJ/kg (equivalent to 5893.7 ±1116.7 Btu/lb) compared to an average HHV of 14.122
±1.205 MJ/kg (equivalent to 6072.1 ±518.2 Btu/lb).
Two points are noteworthy in this case: variability of the heating value within one category of fuel
type, and magnitude of heating value of each type.
Variability
Variability is much more significant with fluff samples. One explanation could be that the
heterogeneity of waste is not leveraged since waste is still scattered in the form of fluff; compared
to a more consistent set of values obtained after running the test on different briquette samples.
Between the 7 fluff samples tested, variability ranged from 1% (F-3 and F-7) to 233% (F-1 and F-
4). This range is very broad and two of the values obtained for F-1 and F-4 seem to be outliers
among the 7 values.
Fluff Pellet
F-1 F-2 F-3 F-4 F-5 F-6 F-7 P-1 P-2 P-3 P-4
HHV (MJ/kg) 6.99 12.46 13.27 23.35 10.08 16.65 13.14 13.20 13.14 17.25 12.89
C14 analysis
19% F 81% B
29% F 71% B
40% F 60%B
38
Variability within the briquette samples tested ranges between 0.5% (P-1 and P-2) and 33.7% (P-
3 and P-4). This suggests the variability in composition of waste and its heterogeneity.
If the outliers are ignored, then the fluff and briquette have similar heating values with an average
of 13.02 MJ/kg.
Unpredictability of energy content of EF is therefore a major limitation regarding the extent to
which it can substitute fossil fuels, which HHV is stable across regions and over different periods.
Magnitude
The difference between the average values for both types of engineered fuel does not lead to any
unexpected conclusions, since additional tests are necessary to get a more accurate trend of
values for the fluff samples that are being utilized. The range of 6 to 23 MJ/kg is large enough that
more tests are required on an ongoing basis to check the likelihood of the heating values
converging on a smaller range than measured here. The briquette form seems to have a more
consistent and slightly (3%) higher HHV than the fluff.
Other factors
As mentioned previously sulfur content plays a negligible role in the correction of the heating
value, since the differences obtained by assuming 0% sulfur content instead of the actual content,
which ranged between 0.06 and 1.8% are less than 0.006%.
The average values obtained experimentally for fluff and pellet HHV (13.7 and 14.1 MJ/kg
respectively) are both significantly different than the HHV mentioned by Zhang (17.8 MJ/kg),
which was reported by the Balcones plant itself. It is noteworthy however, that the tests on F-6
and P-3 resulted in HHVs of 16.7 and 17.3 MJ/kg respectively, very comparable to Zhang’s
number. It is necessary to test many more samples, to be able to determine with certainty the
specific heating value of the waste samples obtained from Balcones.
4.2.2.3 Emissions
4.2.2.3.1 Biogenic vs. fossil CO2
Three gas samples resulting from combusting samples in the bomb calorimeter were collected in
tedlar bags (Tedlar® 0.5-liter Sample Bag with single polypropylene septum fitting which
combines the hose/valve and the septum holder into one compact fitting, pk/10 – SKC Catalog
39
Number: 232-02) and sent for analysis to Beta Analytic where biogenic versus non biogenic
carbon content was analyzed.
‘A standard has been developed to measure the biomass fraction of refuse-derived fuels and solid
recovered fuels. This standard, EN 15440, determines the biogenic fraction of solid recovered
fuels using radiocarbon dating techniques. EN 15440 is similar to the ASTM D6866 standard in the
U.S. Both standards use the radiocarbon dating technique to distinguish the biogenic fractions of
samples from their fossil-based components’ (Beta Analytic, 2014).
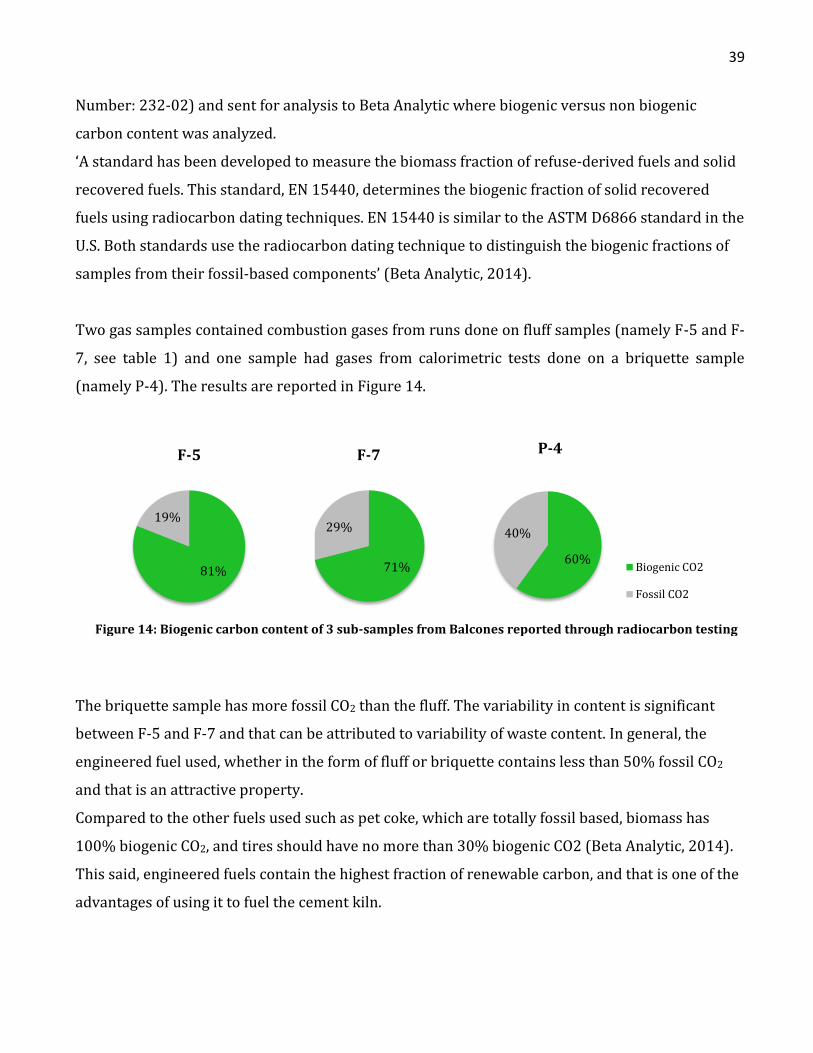
Two gas samples contained combustion gases from runs done on fluff samples (namely F-5 and F-
7, see table 1) and one sample had gases from calorimetric tests done on a briquette sample
(namely P-4). The results are reported in Figure 14.
The briquette sample has more fossil CO2 than the fluff. The variability in content is significant
between F-5 and F-7 and that can be attributed to variability of waste content. In general, the
engineered fuel used, whether in the form of fluff or briquette contains less than 50% fossil CO2
and that is an attractive property.
Compared to the other fuels used such as pet coke, which are totally fossil based, biomass has
100% biogenic CO2, and tires should have no more than 30% biogenic CO2 (Beta Analytic, 2014).
This said, engineered fuels contain the highest fraction of renewable carbon, and that is one of the
advantages of using it to fuel the cement kiln.
71%
29%
F-7
60%
40%
P-4
Biogenic CO2
Fossil CO2
81%
19%
F-5
Figure 14: Biogenic carbon content of 3 sub-samples from Balcones reported through radiocarbon testing

40
The relation between carbon content and heating value is theoretically as follows: higher fossil
carbon content means higher heating value, since fossil carbon is the core of plastics which have
the highest heat content among all fuels. Tires, biomass, organic wastes, which are all made of
biogenic carbon, have lower heating properties than conventional fuels. One interesting point
would be to further understand the effect of biomass on heating value. Because biomass means
higher oxygen content, the heating value of fuels containing more biomass does not vary; and
therefore adding biomass to the alternative fuels used would not be attractive to cement
producers. On the contrary, the amount of mole % of carbon decreases with added biomass
because of the addition of oxygen entailed. Oxygen in fact does not add enthalpy as does carbon
and hydrogen. From Figure 14, it is shown that the biogenic carbon content is higher in fluff than
briquette versions of the same sample; therefore fluff is expected to have a higher heating value
than briquettes. This was not the case in the experimental testing; however one should note that
we did collect gas samples from each fuel sample burnt in the lab. This said, a clear and accurate
conclusion regarding the correlation between heating value and nature of carbon content cannot
be inferred given the partial number of gas samples sent for analysis. Each gas sample contains all
the gases from the bomb at the end of the calorimetric test.
4.2.2.3.2 Other emissions reported
Table 12 summarizes the annual emissions reported by the Balcones plant for 2012 and 2013.
Table 12: Annual emissions reported by Balcones for 2012 and 2013 2012
g/ton clinker
2013
g/son clinker
% Change EPA standards** EPA std in g/ton
clinker
Particulate Matter (PM) NA 20.0180 - 0.02 lb/ton clinker 9.08
Hydrochloric acid (HCl) NA NA - 3 ppmvd
Hydrogen fluoride (HF) NA NA - - -
Sulfur dioxide (SO2) 5.004 5.004 0% 0.5 ppmv
Nitrous oxides (NOx) 1060.953 1000.899 6% 53 ppbv
Carbon monoxide (CO) 375.337 425.382 -13% 9 ppmv
Cadmium (Cd) NA 0.00023521 -
Lead (Pb) NA 0.00105094 -

41
Mercury (Hg) NA NA - 21 lb/ MMton ckr 0.009534
Dioxins/furans
NA
0.004 ng
TEQ/dscm -
0.4ng
TEQ/dscm***
0.4ng
TEQ/dscm***
**See Tables 2 and 3 , source EPA
*** EPA, 2014: http://www.epa.gov/osw/conserve/materials/tires/faq-tdf.htm#q5
The high PM emissions are striking, since their amount is 2 times higher than standard
requirements.
4.2.3 Comparing both plants
4.2.3.1 HHV
The average HHVs of EF used at the Balcones plant and obtained through calorimetric tests are
similar to that reported by the Tepeaca Plant for 2012 and farther than the one for 2013; the
values are shown in Figure 15.
The significantly higher HHV in Tepeaca in 2013 might be due to a change in the composition of
the engineered fuel used. The similarity with the 2012 value might be a coincidence, or the fact
that both plants used EF originating from the same source that year. More information is needed
to interpret these observations. The HHVs were calculated, based on data reported by the Tepeaca
Plant, as a weighted average of monthly amounts of EF used divided by the energy provided over
the 12-month period for each year.
Balcones 2013, Fluff
13.707
Balcones 2013, Briquette
14.122
Tepeaca, 2012 14.550
Tepeaca, 2013 17.208
0
2
4
6
8
10
12
14
16
18
20
HH
V (
MJ/
kg)
Figure 15: Average HHVs of fluff and pellet tested for Balcones vs HHVs of EF reported by Tepeaca
42
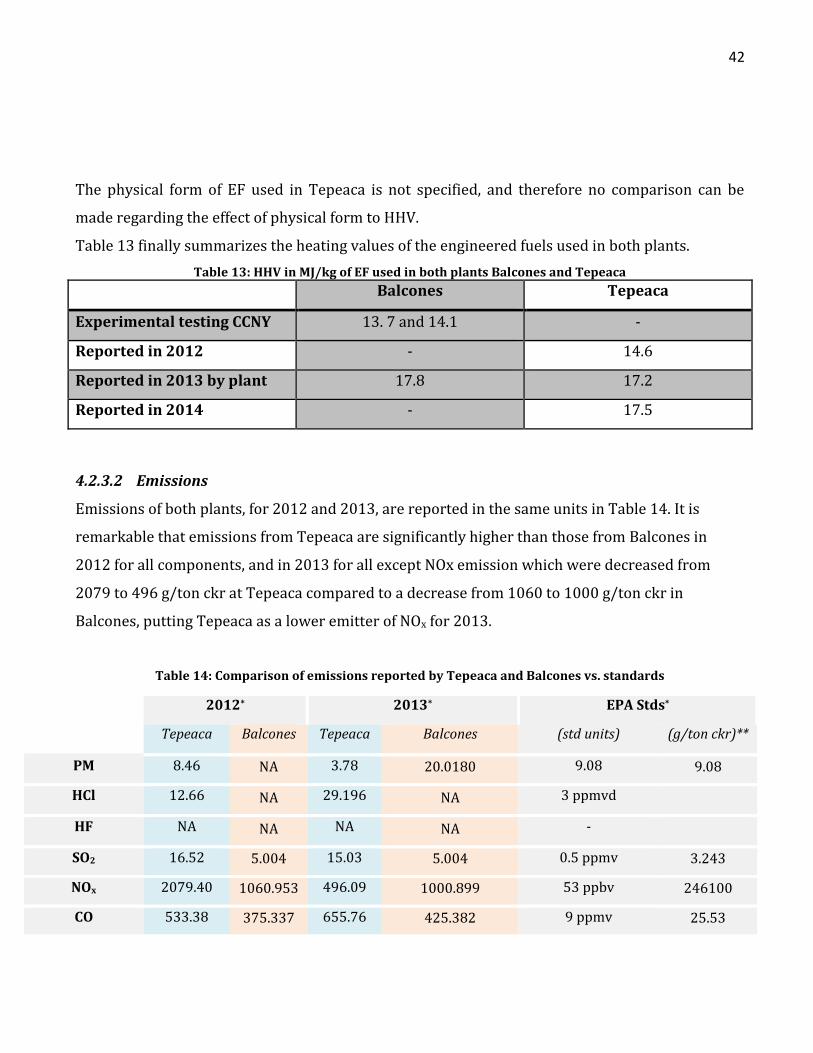
The physical form of EF used in Tepeaca is not specified, and therefore no comparison can be
made regarding the effect of physical form to HHV.
Table 13 finally summarizes the heating values of the engineered fuels used in both plants.
Table 13: HHV in MJ/kg of EF used in both plants Balcones and Tepeaca
Balcones Tepeaca
Experimental testing CCNY 13. 7 and 14.1 -
Reported in 2012 - 14.6
Reported in 2013 by plant 17.8 17.2
Reported in 2014 - 17.5
4.2.3.2 Emissions
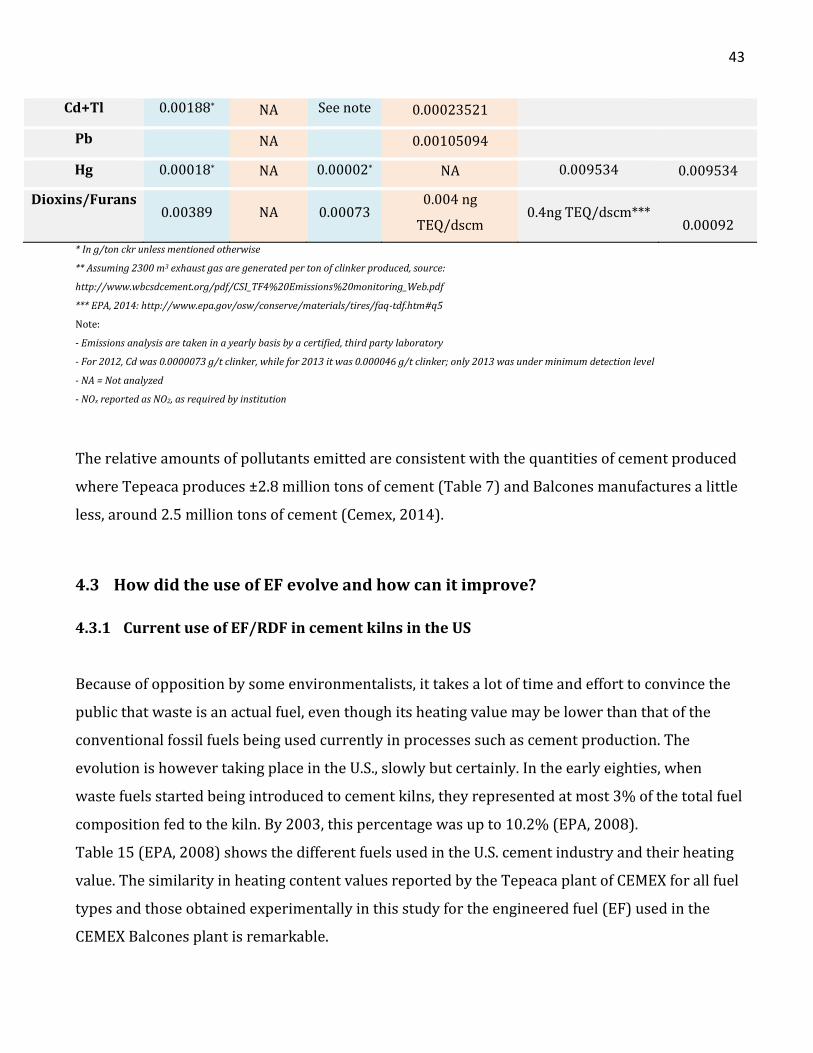
Emissions of both plants, for 2012 and 2013, are reported in the same units in Table 14. It is
remarkable that emissions from Tepeaca are significantly higher than those from Balcones in
2012 for all components, and in 2013 for all except NOx emission which were decreased from
2079 to 496 g/ton ckr at Tepeaca compared to a decrease from 1060 to 1000 g/ton ckr in
Balcones, putting Tepeaca as a lower emitter of NOx for 2013.
Table 14: Comparison of emissions reported by Tepeaca and Balcones vs. standards
2012* 2013* EPA Stds*
Tepeaca Balcones Tepeaca Balcones (std units) (g/ton ckr)**
PM 8.46 NA 3.78 20.0180 9.08 9.08
HCl 12.66 NA 29.196 NA 3 ppmvd
HF NA NA NA NA -
SO2 16.52 5.004 15.03 5.004 0.5 ppmv 3.243
NOx 2079.40 1060.953 496.09 1000.899 53 ppbv 246100
CO 533.38 375.337 655.76 425.382 9 ppmv 25.53
43
* In g/ton ckr unless mentioned otherwise
** Assuming 2300 m3 exhaust gas are generated per ton of clinker produced, source:
http://www.wbcsdcement.org/pdf/CSI_TF4%20Emissions%20monitoring_Web.pdf
*** EPA, 2014: http://www.epa.gov/osw/conserve/materials/tires/faq-tdf.htm#q5
Note:
- Emissions analysis are taken in a yearly basis by a certified, third party laboratory
- For 2012, Cd was 0.0000073 g/t clinker, while for 2013 it was 0.000046 g/t clinker; only 2013 was under minimum detection level
- NA = Not analyzed
- NOx reported as NO2, as required by institution
The relative amounts of pollutants emitted are consistent with the quantities of cement produced
where Tepeaca produces ±2.8 million tons of cement (Table 7) and Balcones manufactures a little
less, around 2.5 million tons of cement (Cemex, 2014).
4.3 How did the use of EF evolve and how can it improve?
4.3.1 Current use of EF/RDF in cement kilns in the US
Because of opposition by some environmentalists, it takes a lot of time and effort to convince the
public that waste is an actual fuel, even though its heating value may be lower than that of the
conventional fossil fuels being used currently in processes such as cement production. The
evolution is however taking place in the U.S., slowly but certainly. In the early eighties, when
waste fuels started being introduced to cement kilns, they represented at most 3% of the total fuel
composition fed to the kiln. By 2003, this percentage was up to 10.2% (EPA, 2008).
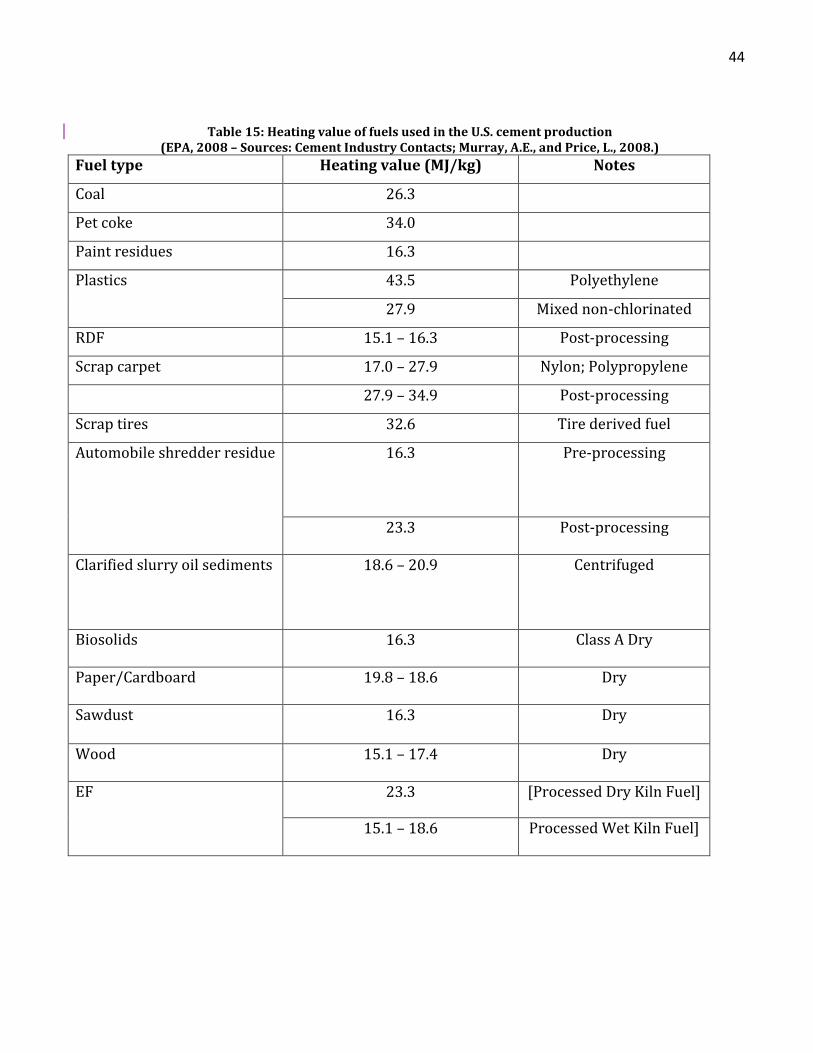
Table 15 (EPA, 2008) shows the different fuels used in the U.S. cement industry and their heating
value. The similarity in heating content values reported by the Tepeaca plant of CEMEX for all fuel
types and those obtained experimentally in this study for the engineered fuel (EF) used in the
CEMEX Balcones plant is remarkable.
Cd+Tl 0.00188* NA See note 0.00023521
Pb NA 0.00105094
Hg 0.00018* NA 0.00002* NA 0.009534 0.009534
Dioxins/Furans 0.00389 NA 0.00073
0.004 ng
TEQ/dscm 0.4ng TEQ/dscm***
0.00092
44
Table 15: Heating value of fuels used in the U.S. cement production (EPA, 2008 – Sources: Cement Industry Contacts; Murray, A.E., and Price, L., 2008.)
Fuel type Heating value (MJ/kg) Notes
Coal 26.3
Pet coke 34.0
Paint residues 16.3
Plastics 43.5 Polyethylene
27.9 Mixed non-chlorinated
RDF 15.1 – 16.3 Post-processing
Scrap carpet 17.0 – 27.9 Nylon; Polypropylene
27.9 – 34.9 Post-processing
Scrap tires 32.6 Tire derived fuel
Automobile shredder residue 16.3
Pre-processing
23.3 Post-processing
Clarified slurry oil sediments 18.6 – 20.9 Centrifuged
Biosolids 16.3 Class A Dry
Paper/Cardboard 19.8 – 18.6 Dry
Sawdust 16.3 Dry
Wood 15.1 – 17.4 Dry
EF 23.3 [Processed Dry Kiln Fuel]
15.1 – 18.6 Processed Wet Kiln Fuel]

45
At the end of March 2014, two updates concerning the fuels used by the cement industry in North
America appeared in the news:
First an example of the changing trends in fossil fuel usage was the announcement by TruStar
Energy of a deal to supply compressed gas to Argos USA (high-quality cement manufacturer,
based in Houston). Another example of using alternative fuels in cement production was the
announcement by the chemical waste firm ChemCare of its 100 million gallon milestone
(379,000m3) of fuel-quality waste supplied to the Lafarge co-processing subsidiary, Systech
Environmental.
Jan Theulen of Heidelberg Cement pointed out another U.S. example during the Global CemFuels
Conference held in Vienna in February 2014. He pointed out that rising landfill prices are
increasing opportunities for alternative fuels, the same was true for the changing US
Environmental Protection Agency (EPA) rules, now permitting for solid recovered fuel. Also,
alternative fuels consultant Dirk Lechtenberg, in an interview with Global Cement Magazine in
February 2014, singled out the US as one country that is developing its use of alternative fuels in
cement production. As he explained, "Even though the fossil fuel prices are quite low in the US, the
industry is developing supply chains for alternative fuels to be more independent with their fuels
sourcing."
This race between cheaper fossil fuels in the US (e.g. shale gas) and increasing use of alternative
fuels is fascinating. Specifically: why is it happening now? Gas prices have fallen and demand for
cement is returning in the US. The annual mean Henry Hub natural gas spot price in the US fell
from US$8.86/million Btu in 2008 to a low of US$2.75/million Btu in 2012. This compares with
prices of up to US$15/million Btu in Japan and US$9/million Btu in Europe.
Public environmental pressure made manifest by the policies of the EPA and generally increased
knowledge about the benefits of co-combustion may be factors for the surge in alternative fuels
investment. Long lead times for alternative fuels schemes may be another. Planners who had to
make a decision about what fuels mix to use in 2008, at the start of the recession, might well have
bet on alternatives to spread their risk. Yet the cause could be something else, as shale gas takes
over higher paying industries, such as electrical generation, and the cement industry continues to
be priced out of the leftovers.
46
Ultimately what burns in a cement kiln comes down to price. Depending on how the shale gas
market plays out in North America, it would be ironic if 'frackers', the bogeymen of current
environmentalists, inadvertently helped the cement industry to use alternative fuels.
"We are committed to responsible waste management for our ChemCare customers, including the
recycling of materials wherever possible. Our 25 year partnership with Systech has been an
outstanding reflection of this, enabling the responsible disposal of waste while providing an
alternative fuel source for cement kilns," said Greg Vas Nunes, vice president of ChemCare. Systech
Environmental added that the arrangement had prevented the generation of 800,000t of CO2.
ChemCare provides waste management service that collects both hazardous and non-hazardous
waste products at customer locations in the US and Canada. It then works with partners in the
waste disposal business to transport these materials to licensed third-party treatment, storage
and disposal facilities. Systech Environmental processes hazardous and non-hazardous industrial
waste for use as fuel in cement kilns. It is actively processing or marketing fuels at 16 cement
plants in the US.
4.3.2 A promising future for AF use in the global cement industry
To date, the main use of alternative fuels is in co-firing with conventional fuels in both cement kiln
and power plants (coal and lignite power plants). Aside from government policy, there are two
reasons why cement producers with access to low cost traditional fuels should consider
alternative fuels: a) independence from fossil fuels and reduction of CO2 emissions and b) securing
waste sources as potential fuel sources for the future. Finding innovative ideas to allow existing
cement kilns to receive larger amounts of alternative fuel, and to burn them as efficiently as fossil
fuels would help municipalities deviate MSW significantly from landfills, and therefore improve
the environmental situation of their communities.
47
5 CONCLUSIONS AND RECOMMENDATIONS In conclusion, the use of alternative fuels in general, and engineered fuels in particular, is a
promising innovation to the cement industry. Operationally, the heating value of engineered fuels
examined in the case studies of this study (the two CEMEX plants in the U.S. and Mexico), along
with figures found in the literature, of about 17 MJ/kg is lower than the 20-30 MJ/kg of coal or pet
coke, respectively; however, both price and environmental emissions of NOx, SOx, and CO2 are
lower, as a result of burning less fossil fuels and more alternative fuels. Also, reduced landfilling is
a second benefit that goes with the use of alternative fuels in cement kilns.
Economically, given that landfill gate fees are on a continuous increase, selling that waste to
cement production facilities, even at a very low price, is a good way to reduce waste management
costs of municipalities and benefit the environment at the same time.
48
6 REFERENCES
Barnett, K. (2013). Final Portland Cement Rule 2013. Retrieved from http://www.unep.org/chemicalsandwaste/Portals/9/RoundTableMercury_6_24-13-final.pdf
Cembureau. (2014). “ Environmental Benefits of Using Alternative Fuels in Cement Production ”. Retrieved from http://www.cembureau.be/about-cement/cement-manufacturing-process
CEMEX USA | PLANTS. (n.d.). Retrieved December 12, 2014, from http://www.cemexusa.com/ce/ce_pl_ba_pp.html
Choate, W. (2003). Energy and Emission Reduction Opportunities for the Cement Industry Energy and Emission Reduction Opportunities for the Cement Industry. Retrieved from http://www1.eere.energy.gov/manufacturing/industries_technologies/imf/pdfs/eeroci_dec03a.pdf
Economics of the US Cement Industry. (2013, May 1). Retrieved October 12, 2014, from http://www.cement.org/for-concrete-books-learning/cement-manufacturing/industry-overview
Frequent Questions on Tire Derived Fuel | Scrap Tires. (n.d.). Retrieved December 12, 2014, from http://www.epa.gov/osw/conserve/materials/tires/faq-tdf.htm#q5 Lechtenberg, M. (2012, December 17). Top 20 global cement companies. Retrieved August 1, 2014, from http://www.globalcement.com/magazine/articles/741-top-20-global-cement-companies Municipal Solid Waste. (2014, October 1). Retrieved October 12, 2014, from http://css.snre.umich.edu/css_doc/CSS04-15.pdf National Ambient Air Quality Standards (NAAQS). (2014, October 21). Retrieved November 3, 2014, from http://www.epa.gov/air/criteria.html
Parr Instrument Company. (2013). Analytical Methods for Oxygen Bombs. Retrieved from http://www.parrinst.com/wp-content/uploads/downloads/2013/02/207M_Parr_Analytical-Methods-Oxygen-Bombs.pdf
Products. (2014, October 1). Retrieved October 12, 2014, from http://www.cement.org/cement-concrete-basics/products Ready-mixed Fortunes. (2013, June 22). The Economist. Refuse-derived Fuels: From Waste to Energy. (n.d.). Retrieved December 12, 2014, from http://www.betalabservices.com/renewable-carbon/refuse-derived-fuels.html
49
Rubenstein, M. (2012, May 9). Emissions from the Cement Industry. Retrieved August 1, 2014, from http://www.globalcement.com/magazine/articles/741-top-20-global-cement-companies
Sand & Cement Cogeneration Plant. (2014, January 1). Retrieved August 1, 2014, from http://www.dscrusher.com/solutions/production-line/sand-cement-cogeneration-production-line.html
Saunders, A. (2013, December 9). Top 75 global cement companies. Retrieved August 1, 2014, from http://www.globalcement.com/magazine/articles/822-top-75-global-cement-companies Scrap Tires and Tire-Derived Fuel. (n.d.). Retrieved December 12, 2014, from http://www.betalabservices.com/renewable-carbon/tire-derived-fuels.html
Shin, D. (2014). Generation!and!Disposition!of!Municipal!Solid!Waste! (MSW)!in!the!United!States!–A!National!Survey ! Retrieved from http://www.seas.columbia.edu/earth/wtert/sofos/Dolly_Shin_Thesis.pdf
Themelis, N. J. (2008). Reducing Landfill Methane Emissions and Expansion of the Hierarchy of Waste Management (pp. 1–9).
Tsiamis, D. (2013). Transforming the Non-Recycled Plastics of New York City to Synthetic Oil Transforming the Non-Recycled Plastics of New York City to Synthetic Oil, (March), 1–118.
Types of Coal. (n.d.). Retrieved December 12, 2014, from http://www.ket.org/trips/coal/agsmm/agsmmtypes.html
US Environmental Protection Agency. (n.d.). Portland Cement Manufacturing.
US Environmental Protection Agency. (2008). Trends in Beneficial Use of Alternative Fuels and Raw Materials Revised. Retrieved from http://www.epa.gov/sectors/pdf/cement-sector-report.pdf
US Environmental Protection Agency. (2012). Municipal Solid Waste Generation , Recycling , and Disposal in the United States : Facts and Figures for 2012 (pp. 1–14).
US Environmental Protection Agency. (2013). Rules and Regulations. Federal Register, 78(29).
USGS. (2008). Cement. Retrieved from http://minerals.usgs.gov/minerals/pubs/commodity/cement/mcs-2008-cemen.pdf
USGS. (2009). Cement. Retrieved from http://minerals.usgs.gov/minerals/pubs/commodity/cement/mcs-2009-cemen.pdf
50
USGS. (2010). Cement. Retrieved from http://minerals.usgs.gov/minerals/pubs/commodity/cement/mcs-2010-cemen.pdf
USGS. (2011). Cement. Retrieved from http://minerals.usgs.gov/minerals/pubs/commodity/cement/mcs-2011-cemen.pdf
USGS. (2011). 2011 Minerals Yearbook.
USGS. (2012). Cement. Retrieved from http://minerals.usgs.gov/minerals/pubs/commodity/cement/mcs-2012-cemen.pdf
USGS. (2013). Cement. Retrieved from http://minerals.usgs.gov/minerals/pubs/commodity/cement/mcs-2013-cemen.pdf
USGS. (2014). Cement. Retrieved from http://minerals.usgs.gov/minerals/pubs/commodity/cement/mcs-2014-cemen.pdf
Williams, P. J. (2010). Pollution Control Technology for the Cement Industry. Retrieved from http://www.babcock.com/library/Documents/BR-1846.pdf
Zhang, J. (2013). Energy , environmental and greenhouse gas effects of using alternative fuels in cement production.