Standard 9: Product Development 9.7 Identify New Product Opportunities.
Using EMIS to Identify Top Opportunities for Commercial Building EfficiencyMAY 2017
Table of Contents
Disclaimer .........................................................................................................................................1
Acknowledgements ..........................................................................................................................1
Glossary of Terms..............................................................................................................................2
Introduction ......................................................................................................................................3Purpose and Best Practices ...............................................................................................................3
Creation and Organization of This Guide ........................................................................................3
Summary of Opportunities and Analyses .........................................................................................4
Complementary Resources ...............................................................................................................6
Scheduling ........................................................................................................................................7Scheduling Overview ........................................................................................................................7
Scheduling Analysis and Examples with EIS Technologies ............................................................8
Scheduling Analysis and Examples with FDD Technologies .......................................................14
Outdoor Air Usage ........................................................................................................................17Outdoor Air Usage Overview ..........................................................................................................17
Outdoor Air Usage Analysis and Examples with FDD Technologies ...........................................18
Simultaneous Heating and Cooling .................................................................................................23Simultaneous Heating and Cooling Overview ...............................................................................23
Simultaneous Heating and Cooling Analysis and Examples with EIS Technologies ..................24
Simultaneous Heating and Cooling Analysis and Examples with FDD Technologies ...............26
Air-side Setpoint Optimization .......................................................................................................29Air-side Setpoint Optimization Overview .......................................................................................29
Air-Side Setpoint Optimization Analysis and Examples with FDD Technologies .......................30
Sensor Errors ..................................................................................................................................34Sensor Errors Overview ....................................................................................................................34
Sensor Errors Analysis and Examples with FDD Technologies .....................................................35
Additional Useful Analyses .............................................................................................................39Overview of Additional Useful Analyses .........................................................................................39
Additional Useful Analyses and Examples with EIS Technology ..................................................40
Appendix: Heating, Ventilating, and Air Conditioning (HVAC) System Types .................................45
Endnotes .........................................................................................................................................49
Learn more at betterbuildingssolutioncenter.energy.gov/alliance/emis
2
DisclaimerThis document was prepared as an account of work sponsored by the United States Government. While this document is believed to contain correct information, neither the United States Government nor any agency thereof, nor The Regents of the University of California, nor any of their employees, makes any warranty, express or implied, or assumes any legal responsibility for the accuracy, completeness, or usefulness of any information, apparatus, product, or process disclosed, or represents that its use would not infringe privately owned rights. Reference herein to any specific commercial product, process, or service by its trade name, trademark, manufacturer, or otherwise, does not necessarily constitute or imply its endorsement, recommendation, or favoring by the United States Government or any agency thereof, or The Regents of the University of California. The views and opinions of authors expressed herein do not necessarily state or reflect those of the United States Government or any agency thereof or The Regents of the University of California.
AcknowledgementsThis work was supported by the U.S. Department of Energy under Contract No. DE-AC02-05CH11231. It was prepared by Guanjing Lin, Rupam Singla, and Jessica Granderson of Lawrence Berkeley National Laboratory (LBNL). The authors thank Hannah Kramer, Claire Curtin, and Samuel Fernandes of LBNL for their input, and Amy Jiron (US Department of Energy), Molly McGuire (Jones Lang LaSalle), Mark Barich (Summa Health), Donna Trovalli (National Energy Solutions) and Pat Lydon (Legacy Health) for their thorough review and feedback.
Learn more at betterbuildingssolutioncenter.energy.gov/alliance/emis
1
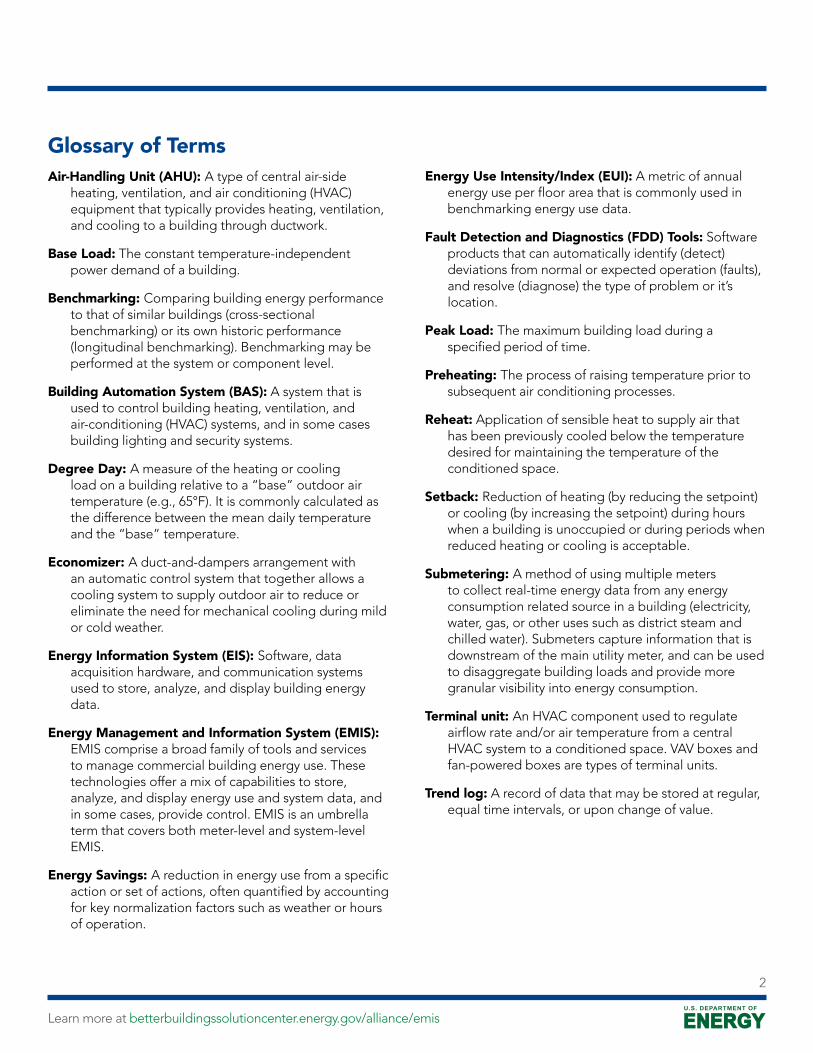
Glossary of TermsAir-Handling Unit (AHU): A type of central air-side
heating, ventilation, and air conditioning (HVAC) equipment that typically provides heating, ventilation, and cooling to a building through ductwork.
Base Load: The constant temperature-independent power demand of a building.
Benchmarking: Comparing building energy performance to that of similar buildings (cross-sectional benchmarking) or its own historic performance (longitudinal benchmarking). Benchmarking may be performed at the system or component level.
Building Automation System (BAS): A system that is used to control building heating, ventilation, and air-conditioning (HVAC) systems, and in some cases building lighting and security systems.
Degree Day: A measure of the heating or cooling load on a building relative to a “base” outdoor air temperature (e.g., 65°F). It is commonly calculated as the difference between the mean daily temperature and the “base” temperature.
Economizer: A duct-and-dampers arrangement with an automatic control system that together allows a cooling system to supply outdoor air to reduce or eliminate the need for mechanical cooling during mild or cold weather.
Energy Information System (EIS): Software, data acquisition hardware, and communication systems used to store, analyze, and display building energy data.
Energy Management and Information System (EMIS): EMIS comprise a broad family of tools and services to manage commercial building energy use. These technologies offer a mix of capabilities to store, analyze, and display energy use and system data, and in some cases, provide control. EMIS is an umbrella term that covers both meter-level and system-level EMIS.
Energy Savings: A reduction in energy use from a specific action or set of actions, often quantified by accounting for key normalization factors such as weather or hours of operation.
Energy Use Intensity/Index (EUI): A metric of annual energy use per floor area that is commonly used in benchmarking energy use data.
Fault Detection and Diagnostics (FDD) Tools: Software products that can automatically identify (detect) deviations from normal or expected operation (faults), and resolve (diagnose) the type of problem or it’s location.
Peak Load: The maximum building load during a specified period of time.
Preheating: The process of raising temperature prior to subsequent air conditioning processes.
Reheat: Application of sensible heat to supply air that has been previously cooled below the temperature desired for maintaining the temperature of the conditioned space.
Setback: Reduction of heating (by reducing the setpoint) or cooling (by increasing the setpoint) during hours when a building is unoccupied or during periods when reduced heating or cooling is acceptable.
Submetering: A method of using multiple meters to collect real-time energy data from any energy consumption related source in a building (electricity, water, gas, or other uses such as district steam and chilled water). Submeters capture information that is downstream of the main utility meter, and can be used to disaggregate building loads and provide more granular visibility into energy consumption.
Terminal unit: An HVAC component used to regulate airflow rate and/or air temperature from a central HVAC system to a conditioned space. VAV boxes and fan-powered boxes are types of terminal units.
Trend log: A record of data that may be stored at regular, equal time intervals, or upon change of value.
Learn more at betterbuildingssolutioncenter.energy.gov/alliance/emis
2

IntroductionEnergy Management and Information Systems (EMIS) comprise a broad family of tools and services to manage commercial building energy use. These technologies offer a mix of capabilities to store, display, and analyze energy use and system data, and in some cases, provide control. EMIS technologies enable 10–20 percent site energy savings in best practice implementations.1
Energy Information System (EIS) and Fault Detection and Diagnosis (FDD) systems are two key technologies in the EMIS family. Energy Information Systems are broadly defined as the web-based software, data acquisition hardware, and communication systems used to analyze and display building energy performance. At a minimum, an EIS provides daily, hourly or sub-hourly interval meter data at the whole-building level, with graphical and analytical capability. Fault Detection and Diagnosis systems automatically identify heating, ventilation, and air-conditioning (HVAC) system or equipment-level performances issues, and in some cases are able to isolate the root causes of the problem. They use computer algorithms to continuously analyze system-level operational data to detect faults and diagnose their causes. Many FDD tools integrate the trend log data from a Building Automation System (BAS) but otherwise are stand-alone software packages; other types of FDD tools are implemented as “on-board” equipment-embedded diagnostics. (This document focuses on the former.) Analysis approaches adopted in FDD technologies span a variety of techniques from rule-based methods to process history-based approaches. FDD tools automate investigations that can be conducted via manual data inspection by someone with expert knowledge, thereby expanding accessibility and breath of analysis opportunity, and also reducing complexity.
Purpose and Best PracticesThis guide presents an overview of the top energy-savings opportunities in commercial buildings and shows how they can be identified using the type of interval meter analytics offered in EIS technologies or using the automated analytics offered in FDD systems. The guide’s target audience is building owners and operators, facility managers, energy and sustainability managers, and others with modest experience in data analysis and performance monitoring.
The complexity or sophistication of EMIS analytics and capabilities should be increased over time and savings opportunities may evolve depending on the initial levels of monitoring and analysis. Users can start with whole-building interval data analysis (based on data availability), move into submetering, and finally, conduct system-specific investigations with FDD tools. This approach recognizes that user insight and skill will increase with time and experience, and that data acquisition and analysis resources can and may need to be expanded gradually, as budgets and time permit. For an organization that is new to EMIS, begin with the features that require existing available data or data that can be obtained with little additional cost and effort. This approach allows for the realization of savings early on, thereby creating evidence of cost-effectiveness that can support approval for further investment.
Creation and Organization of This GuideThis guide was created by synthesizing material from five primary sources: Energy Information Handbook;2 User Guide: OpenEIS Reference Code;3 Metering Best Practices;4 Building Re-tuning Training Guides;5 and Common Opportunities: The Top Five.6 The guide covers nine “top” energy savings opportunities that can be identified by EIS and/or FDD tools; each opportunity is summarized, followed by a description of the EIS and/or FDD (as applicable) analysis methodology, and examples of specific applications. While the principles underlying the opportunity summaries and examples are relevant to most commercial building types, the specific content provided may be most directly applicable to facilities such as offices, schools, and retail with their associated loads
Learn more at betterbuildingssolutioncenter.energy.gov/alliance/emis
3
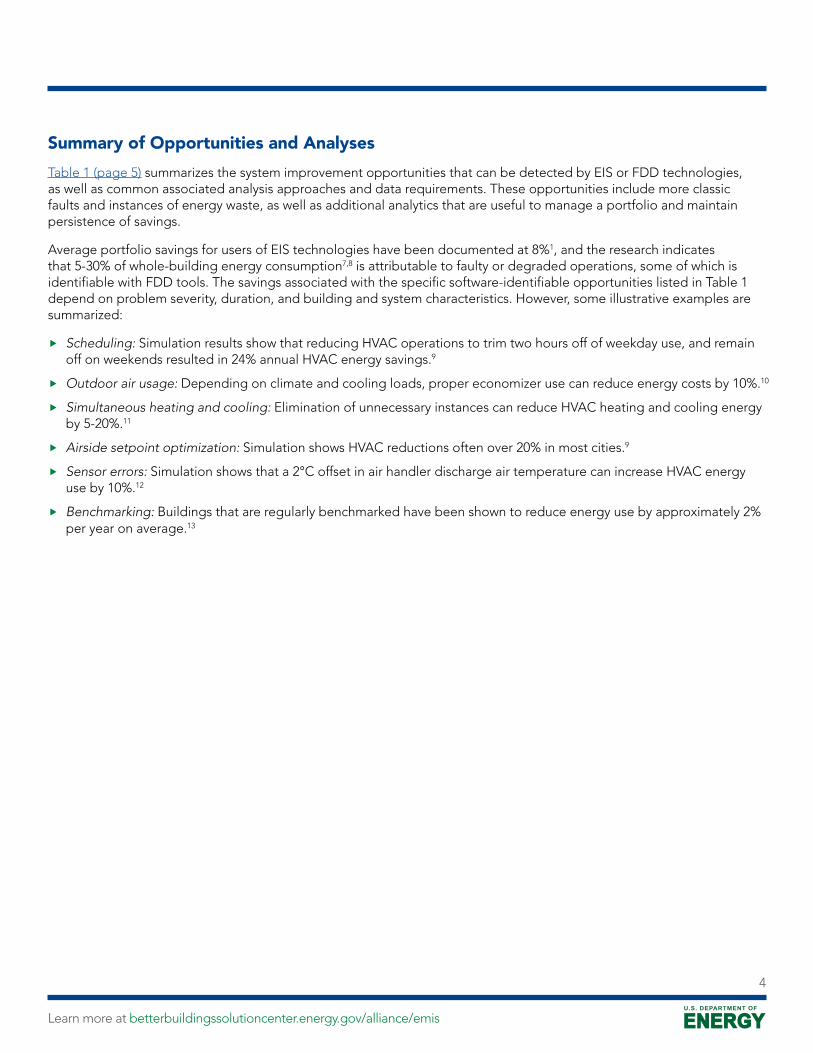
Summary of Opportunities and AnalysesTable 1 (page 5) summarizes the system improvement opportunities that can be detected by EIS or FDD technologies, as well as common associated analysis approaches and data requirements. These opportunities include more classic faults and instances of energy waste, as well as additional analytics that are useful to manage a portfolio and maintain persistence of savings.
Average portfolio savings for users of EIS technologies have been documented at 8%1, and the research indicates that 5-30% of whole-building energy consumption7,8 is attributable to faulty or degraded operations, some of which is identifiable with FDD tools. The savings associated with the specific software-identifiable opportunities listed in Table 1 depend on problem severity, duration, and building and system characteristics. However, some illustrative examples are summarized:
� Scheduling: Simulation results show that reducing HVAC operations to trim two hours off of weekday use, and remain off on weekends resulted in 24% annual HVAC energy savings.9
� Outdoor air usage: Depending on climate and cooling loads, proper economizer use can reduce energy costs by 10%.10
� Simultaneous heating and cooling: Elimination of unnecessary instances can reduce HVAC heating and cooling energy by 5-20%.11
� Airside setpoint optimization: Simulation shows HVAC reductions often over 20% in most cities.9
� Sensor errors: Simulation shows that a 2°C offset in air handler discharge air temperature can increase HVAC energy use by 10%.12
� Benchmarking: Buildings that are regularly benchmarked have been shown to reduce energy use by approximately 2% per year on average.13
Learn more at betterbuildingssolutioncenter.energy.gov/alliance/emis
4
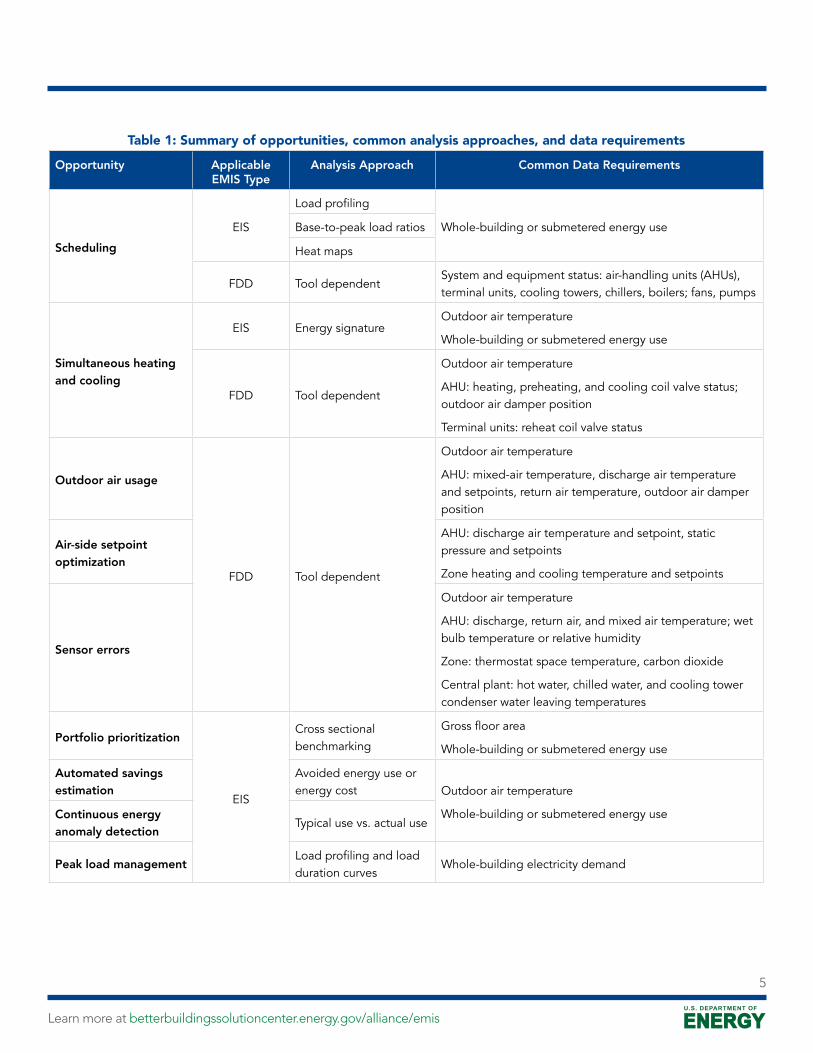
Table 1: Summary of opportunities, common analysis approaches, and data requirements
Opportunity Applicable EMIS Type
Analysis Approach Common Data Requirements
SchedulingEIS
Load profiling
Whole-building or submetered energy useBase-to-peak load ratios
Heat maps
FDD Tool dependentSystem and equipment status: air-handling units (AHUs), terminal units, cooling towers, chillers, boilers; fans, pumps
Simultaneous heating and cooling
EIS Energy signatureOutdoor air temperature
Whole-building or submetered energy use
FDD Tool dependent
Outdoor air temperature
AHU: heating, preheating, and cooling coil valve status; outdoor air damper position
Terminal units: reheat coil valve status
Outdoor air usage
FDD Tool dependent
Outdoor air temperature
AHU: mixed-air temperature, discharge air temperature and setpoints, return air temperature, outdoor air damper position
Air-side setpoint optimization
AHU: discharge air temperature and setpoint, static pressure and setpoints
Zone heating and cooling temperature and setpoints
Sensor errors
Outdoor air temperature
AHU: discharge, return air, and mixed air temperature; wet bulb temperature or relative humidity
Zone: thermostat space temperature, carbon dioxide
Central plant: hot water, chilled water, and cooling tower condenser water leaving temperatures
Portfolio prioritization
EIS
Cross sectional benchmarking
Gross floor area
Whole-building or submetered energy use
Automated savings estimation
Avoided energy use or energy cost Outdoor air temperature
Whole-building or submetered energy useContinuous energy anomaly detection
Typical use vs. actual use
Peak load managementLoad profiling and load duration curves
Whole-building electricity demand
Learn more at betterbuildingssolutioncenter.energy.gov/alliance/emis
5

Complementary ResourcesWhile EIS and FDD are two key technology types within the EMIS family, there is broad diversity in the capabilities of any given EIS or FDD offering. Vendors may provide the ability to identify some, but not all of the opportunities detailed in this guide. For example, an FDD vendor may address equipment failures that could be the root of scheduling, sensor errors, or outdoor air usage improvement opportunities. However, the same vendor may not offer the capability to detect the absence of proper sequences, which can involve reset strategies linked to airside setpoint optimization opportunities or, economizing outdoor air usage. Similarly an EIS vendor may provide functionality to conduct load profiling to identify scheduling and support peak load management, but may not support savings estimation, or benchmarking.
Several complementary resources are available to support readers in the process of understanding the landscape of market offerings, specifying and selecting a technology, making the business case for procurement, integrating the technology into organizational operations, best practice technical uses, and creating high performance sequences of operation. Some of these resources are noted below, and can be used as a complement to the material in this guide.
EMIS technology classification framework: a common reference that can be used to understand key distinguishing factors and core attributes of different solutions within the family of EMIS technologies.
Smart Energy Analytics Campaign, "Find a Product or Service": a representative list of EMIS offerings and service providers, with sample product overviews, compiled in 2016.
A primer on organizational use of Energy Management and Information Systems (EMIS): an introduction to EMIS technology types, and how to plan for and operationalize their use.
EMIS specification and procurement support materials: a template request for proposal (RFP) and EMIS specification, with recommended selection guidance.
Energy information systems (EIS): Technology costs, benefit, and best practice uses: a report and accompanying fact sheet to make the business case for EIS technology adoption.
American Society of Heating, Refrigeration, and Air Conditioning Engineers (ASHRAE) proposed Guideline 36 - High Performance Sequences of Operation for HVAC Systems: a guideline that provides sequences of operation for HVAC systems that are intended to maximize HVAC system energy efficiency and performance, provide control stability, and allow for real-time fault detection and diagnostics.
Learn more at betterbuildingssolutioncenter.energy.gov/alliance/emis
6
SchedulingScheduling Overview The easiest way to save energy from building operation is to shut equipment off if it is not needed and reduce equipment loads where possible. Significant energy reductions in commercial buildings can be realized by properly controlling building systems for specific operational schedules, occupancy and seasonal variability. Systems that often experience scheduling problems include HVAC, lighting, plug and process loads, and garage exhaust fans. Simulation results show that shortening HVAC schedules so that they end two hours earlier on weekdays and remain off all day on Saturdays saved roughly 24 percent of annual HVAC energy use.14 Common measures that can significantly reduce energy consumption during unoccupied periods include the following:
� Shorten operating hours of building systems to better reflect actual building occupancy schedule and service needs (a first-level form of optimal start/stop).
� Implement unoccupied (night, weekend, and holiday) setback strategies in HVAC building automation system to minimize air conditioning during the unoccupied period.
� Minimize or turn off lighting and office equipment when not in use. For example, occupancy sensors can be utilized to automatically turn lights off when occupancy is not detected.
� Implement unoccupied (night, weekend, and holiday) setback strategies to minimize or turn off garage exhaust fans during unoccupied periods.
Scheduling measures are commonly identified using interval meter analytics such as those offered in EIS or with FDD technologies that rely upon trend log data from BAS.
Note that it is not always beneficial to turn off HVAC equipment during unoccupied periods. In extreme climates, shutting off equipment could require a significant amount of ‘recovery’ energy when restarted, or could result in failure. Therefore, in extreme climates, consider setbacks as opposed to complete shutoff.
Learn more at betterbuildingssolutioncenter.energy.gov/alliance/emis
7
Scheduling Analysis and Examples with EIS TechnologiesA variety of visualization and analysis approaches can be used to derive insights from whole-building level or submetered data (hourly or a shorter interval):
� Load profiling: Load profiling can be used daily or weekly to understand the relationship between energy use and time of day. By plotting system or building load against time, load profiling can highlight abnormalities or changes in system operation that could lead to increased energy use. This approach is reviewed in detail in pages 71–79 in the Energy Information Handbook.
� Base-to-peak load ratios: Beyond visual inspection, base-to-peak load ratio can be calculated to quantitatively assess the after-hour setback. This approach is reviewed in detail on page 9 in the User Guide: OpenEIS Reference Code. In offices and similarly operated buildings, the difference in whole-building energy use between the base load and the peak load should be at least 30 percent and as much as 80 percent with aggressive setbacks on nights and weekends.15 A “good” versus “poor” value of base-to-peak load depends on the specific building operations and characteristics; however, ratios less than approximately 0.33 indicate that significant loads are shut off for parts of the day.
� Heat maps: Heat maps are a means of visualizing and presenting the information that is contained in a time series load profile. The maps color-code the size of the load so that “hot spots” and patterns are easily identified. Time of day is plotted on the x-axis, and day or date is indicated on the y-axis (or vice versa).
The following examples illustrate application of the above approaches to identify:
� After-hours setback
� Occupancy-based start-up and shut-down
� Seasonal opportunities
Learn more at betterbuildingssolutioncenter.energy.gov/alliance/emis
8
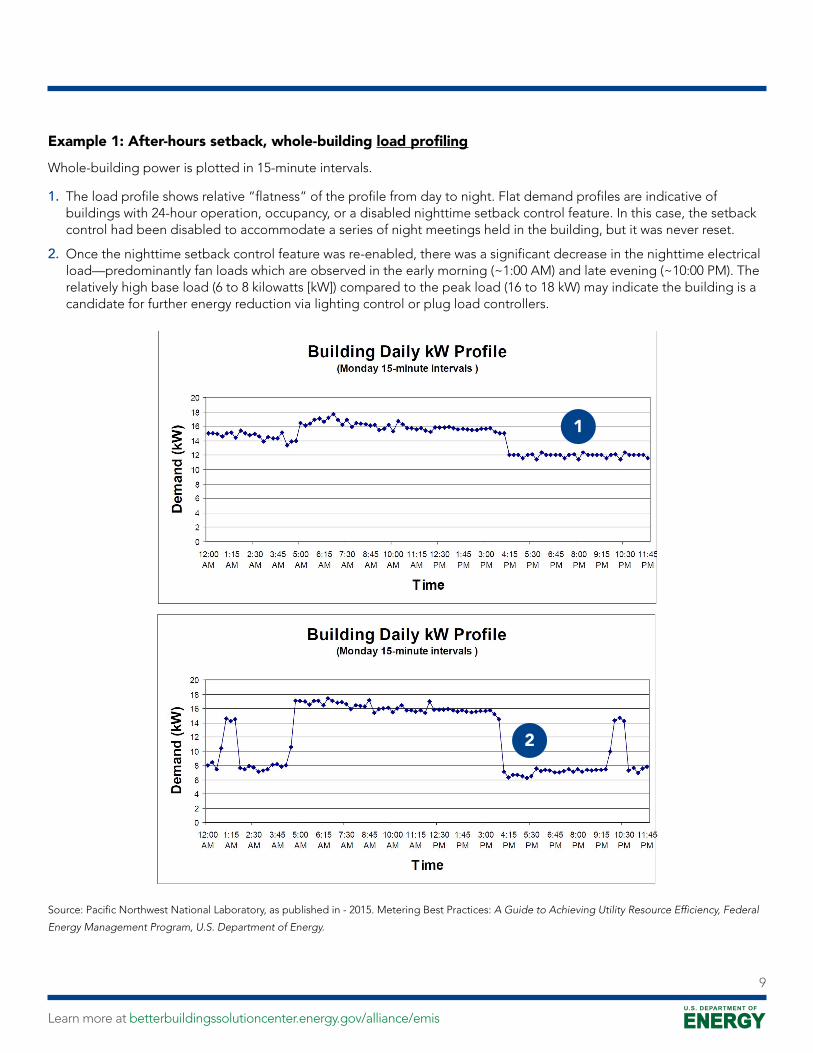
Example 1: After-hours setback, whole-building load profiling
Whole-building power is plotted in 15-minute intervals.
1. The load profile shows relative “flatness” of the profile from day to night. Flat demand profiles are indicative of buildings with 24-hour operation, occupancy, or a disabled nighttime setback control feature. In this case, the setback control had been disabled to accommodate a series of night meetings held in the building, but it was never reset.
2. Once the nighttime setback control feature was re-enabled, there was a significant decrease in the nighttime electrical load—predominantly fan loads which are observed in the early morning (~1:00 AM) and late evening (~10:00 PM). The relatively high base load (6 to 8 kilowatts [kW]) compared to the peak load (16 to 18 kW) may indicate the building is a candidate for further energy reduction via lighting control or plug load controllers.
Source: Pacific Northwest National Laboratory, as published in - 2015. Metering Best Practices: A Guide to Achieving Utility Resource Efficiency, Federal
Energy Management Program, U.S. Department of Energy.
1
2
Learn more at betterbuildingssolutioncenter.energy.gov/alliance/emis
9
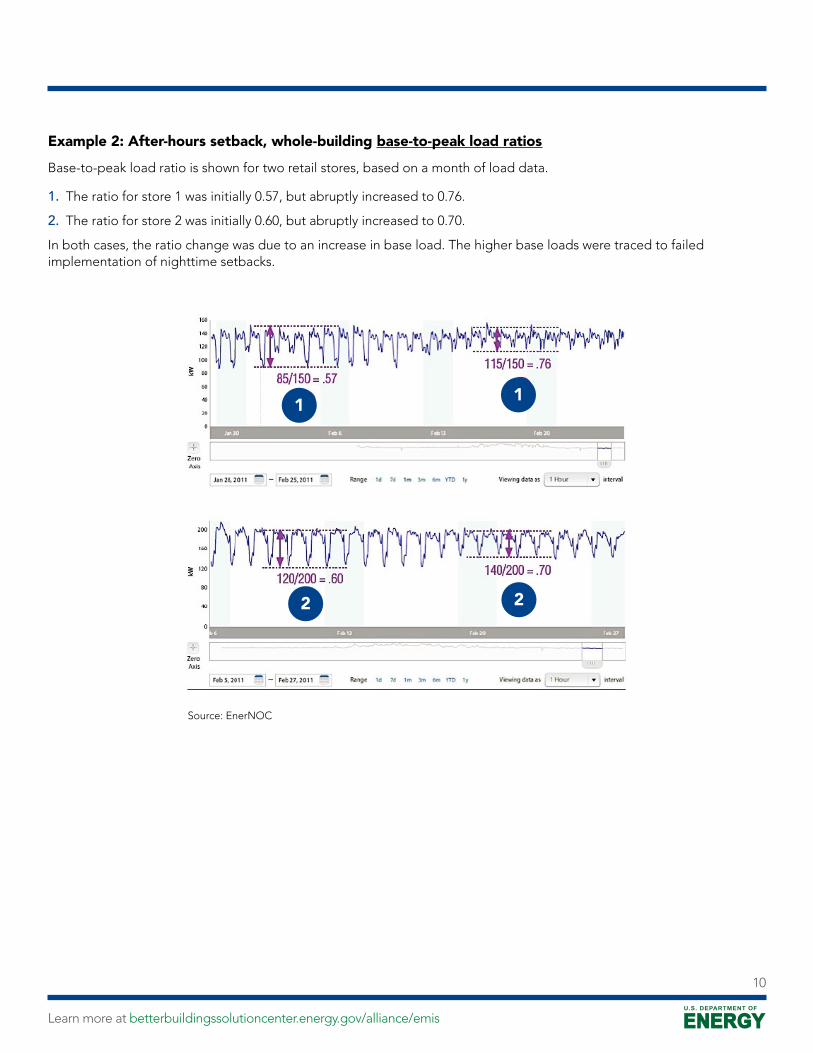
Example 2: After-hours setback, whole-building base-to-peak load ratios
Base-to-peak load ratio is shown for two retail stores, based on a month of load data.
1. The ratio for store 1 was initially 0.57, but abruptly increased to 0.76.
2. The ratio for store 2 was initially 0.60, but abruptly increased to 0.70.
In both cases, the ratio change was due to an increase in base load. The higher base loads were traced to failed implementation of nighttime setbacks.
1 1
2 2
Source: EnerNOC
Learn more at betterbuildingssolutioncenter.energy.gov/alliance/emis
10
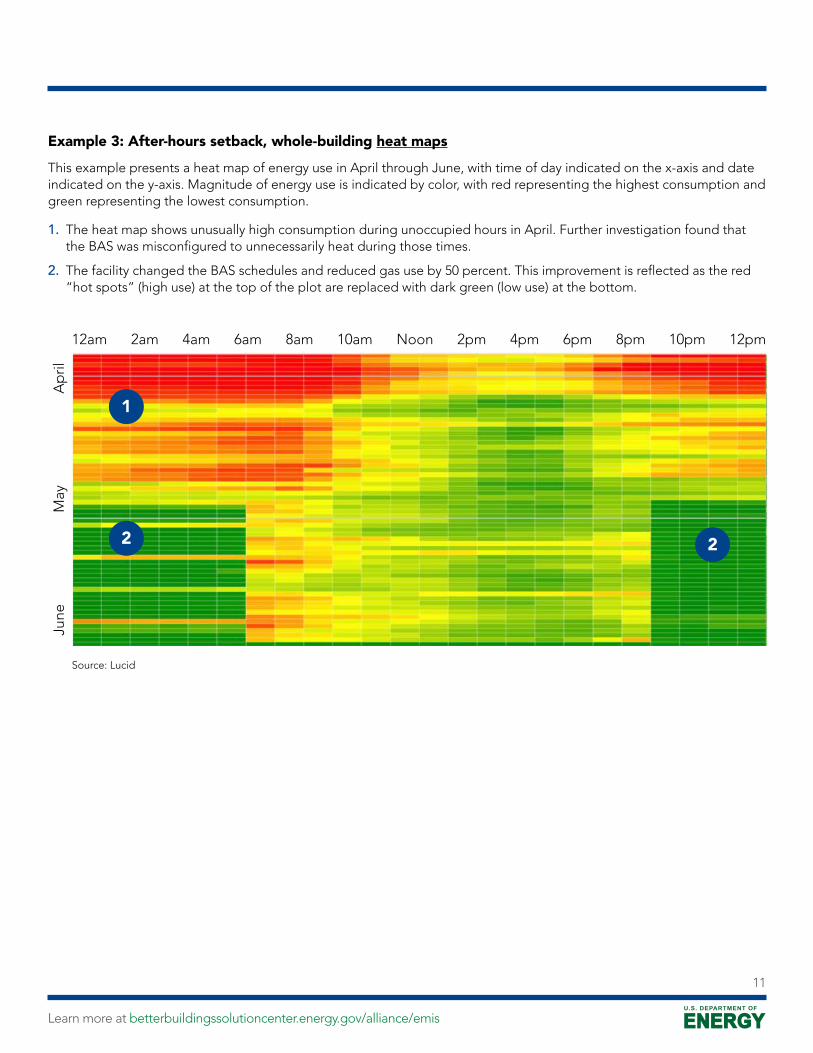
Example 3: After-hours setback, whole-building heat maps
This example presents a heat map of energy use in April through June, with time of day indicated on the x-axis and date indicated on the y-axis. Magnitude of energy use is indicated by color, with red representing the highest consumption and green representing the lowest consumption.
1. The heat map shows unusually high consumption during unoccupied hours in April. Further investigation found that the BAS was misconfigured to unnecessarily heat during those times.
2. The facility changed the BAS schedules and reduced gas use by 50 percent. This improvement is reflected as the red “hot spots” (high use) at the top of the plot are replaced with dark green (low use) at the bottom.
1
2 2
Source: Lucid
June
M
ay
Ap
ril
12am 2am 4am 6am 8am 10am Noon 2pm 4pm 6pm 8pm 10pm 12pm
Learn more at betterbuildingssolutioncenter.energy.gov/alliance/emis
11
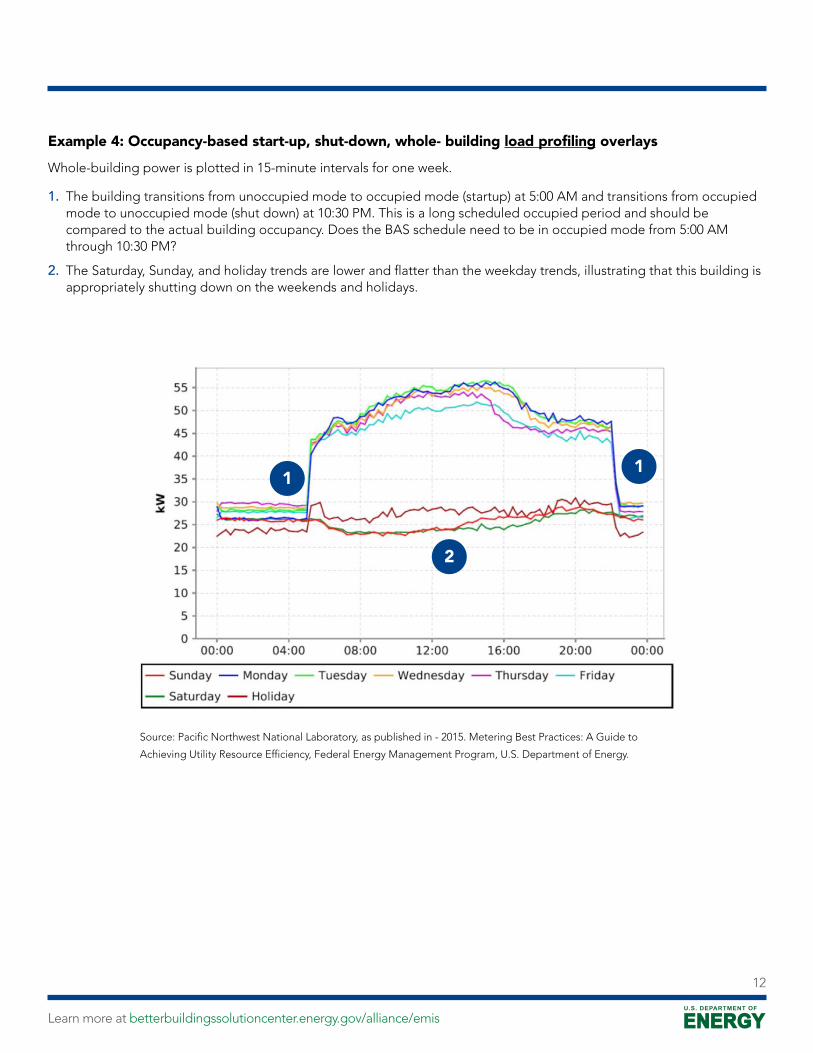
Example 4: Occupancy-based start-up, shut-down, whole- building load profiling overlays
Whole-building power is plotted in 15-minute intervals for one week.
1. The building transitions from unoccupied mode to occupied mode (startup) at 5:00 AM and transitions from occupied mode to unoccupied mode (shut down) at 10:30 PM. This is a long scheduled occupied period and should be compared to the actual building occupancy. Does the BAS schedule need to be in occupied mode from 5:00 AM through 10:30 PM?
2. The Saturday, Sunday, and holiday trends are lower and flatter than the weekday trends, illustrating that this building is appropriately shutting down on the weekends and holidays.
1 1
2
Source: Pacific Northwest National Laboratory, as published in - 2015. Metering Best Practices: A Guide to
Achieving Utility Resource Efficiency, Federal Energy Management Program, U.S. Department of Energy.
Learn more at betterbuildingssolutioncenter.energy.gov/alliance/emis
12
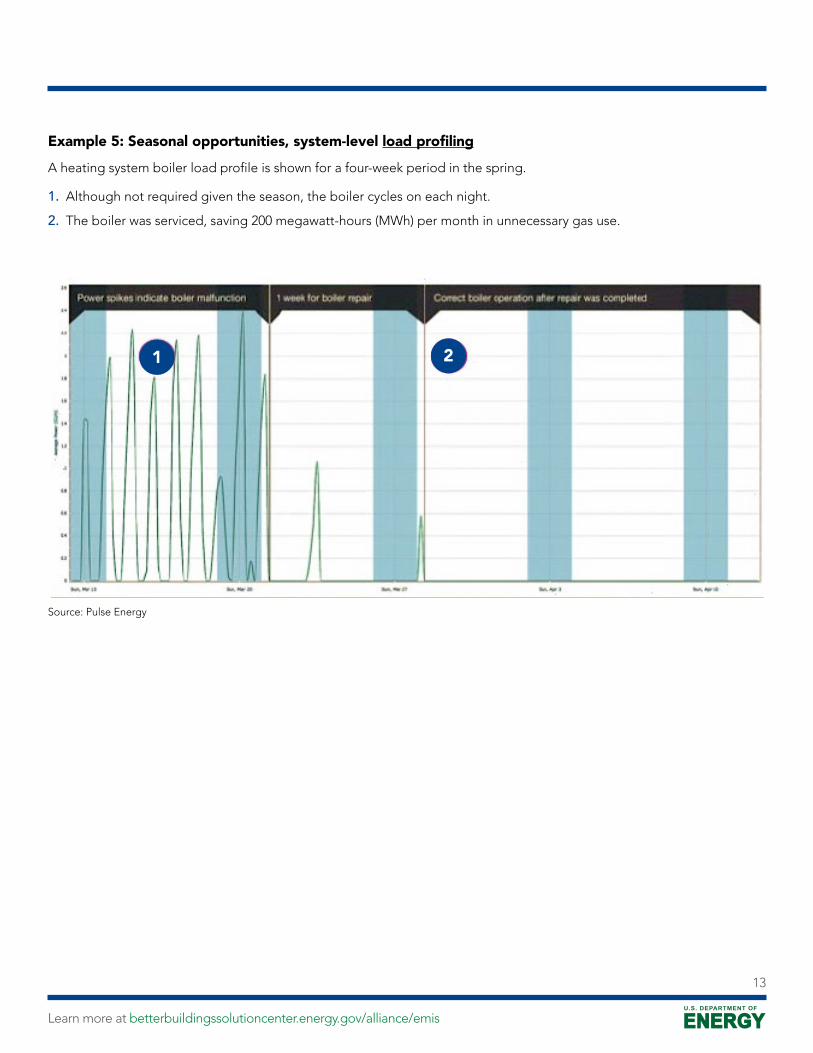
Example 5: Seasonal opportunities, system-level load profiling
A heating system boiler load profile is shown for a four-week period in the spring.
1. Although not required given the season, the boiler cycles on each night.
2. The boiler was serviced, saving 200 megawatt-hours (MWh) per month in unnecessary gas use.
1 2
Source: Pulse Energy
Learn more at betterbuildingssolutioncenter.energy.gov/alliance/emis
13
Scheduling Analysis and Examples with FDD Technologies Commercial building HVAC systems typically consist of equipment such as air-handling units (or packaged rooftop units), terminal units, chillers, boilers, pumps and cooling towers. Key operating trends indicating the operating status of this equipment are collected from BAS and analyzed in FDD technologies to point out whether the equipment are turning off during unoccupied periods. Key BAS trend log data (30 minutes or a shorter interval) that can be collected to detect scheduling opportunities include:
� Air-handling units supply fan status
� Air-handling units duct static pressure (when supply fan status is not available)
� Terminal units fan status (in fan-powered terminal boxes)
� Chiller status
� Boiler status
� Pumps status
� Cooling tower fan status
The following examples show automated outputs from FDD technologies applied to detect scheduling opportunities, as well as plots and logic of the types of analysis that FDD tools may automate for the users.
Learn more at betterbuildingssolutioncenter.energy.gov/alliance/emis
14
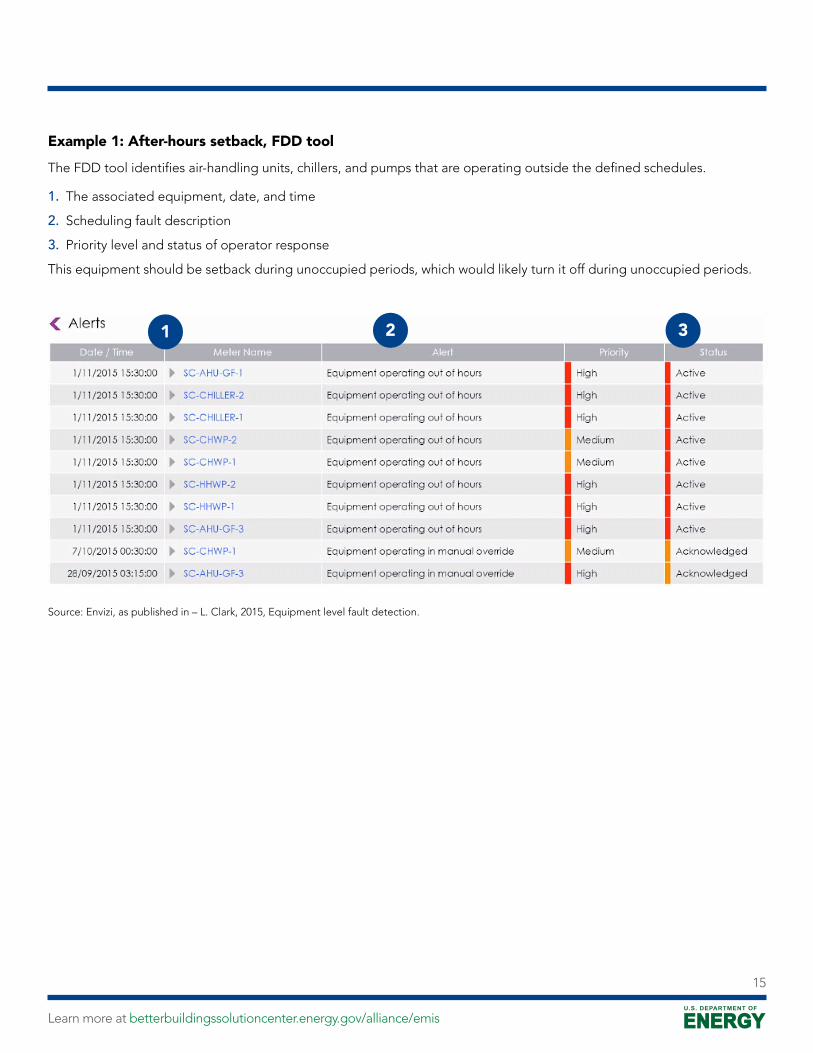
Example 1: After-hours setback, FDD tool
The FDD tool identifies air-handling units, chillers, and pumps that are operating outside the defined schedules.
1. The associated equipment, date, and time
2. Scheduling fault description
3. Priority level and status of operator response
This equipment should be setback during unoccupied periods, which would likely turn it off during unoccupied periods.
1 2 3
Source: Envizi, as published in – L. Clark, 2015, Equipment level fault detection.
Learn more at betterbuildingssolutioncenter.energy.gov/alliance/emis
15
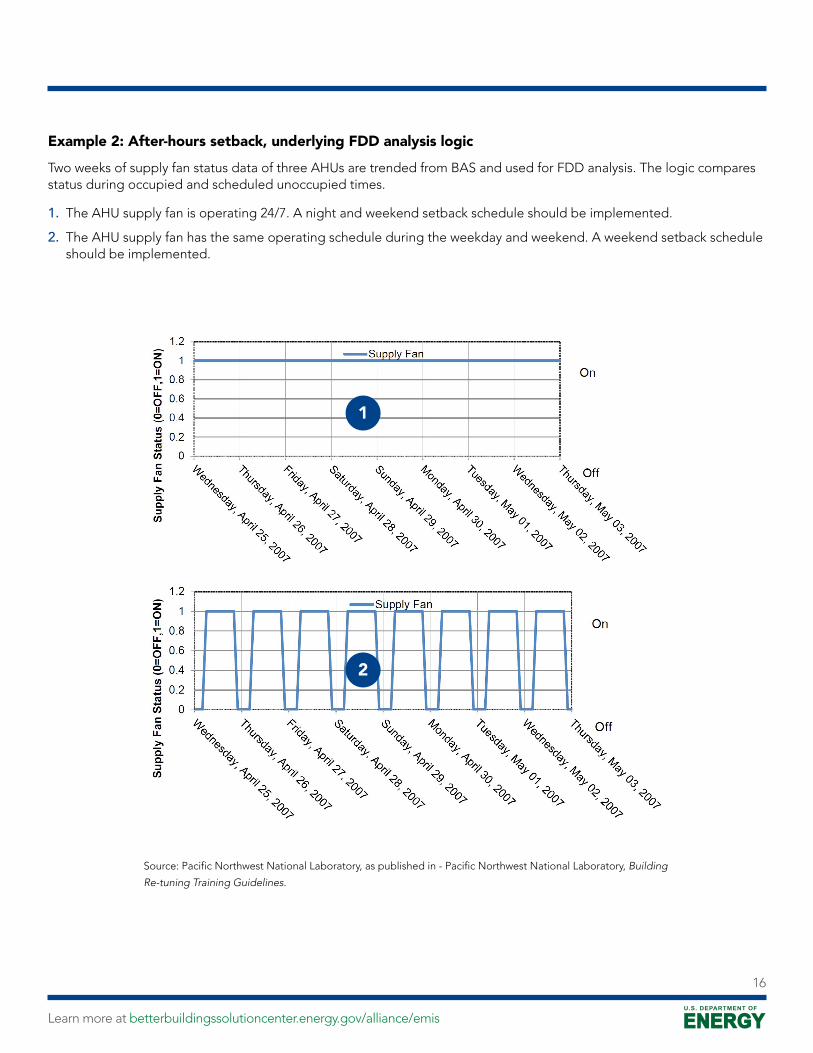
Example 2: After-hours setback, underlying FDD analysis logic
Two weeks of supply fan status data of three AHUs are trended from BAS and used for FDD analysis. The logic compares status during occupied and scheduled unoccupied times.
1. The AHU supply fan is operating 24/7. A night and weekend setback schedule should be implemented.
2. The AHU supply fan has the same operating schedule during the weekday and weekend. A weekend setback schedule should be implemented.
Source: Pacific Northwest National Laboratory, as published in - Pacific Northwest National Laboratory, Building
Re-tuning Training Guidelines.
1
2
Learn more at betterbuildingssolutioncenter.energy.gov/alliance/emis
16

Outdoor Air Usage Outdoor Air Usage OverviewHeating, ventilating, and air conditioning systems typically rely on mechanical cooling to supply cold air to zones during warm weather conditions. An air-side economizer is a duct/damper arrangement in an AHU, along with automatic controls that allow an AHU to use outdoor air to reduce or eliminate the need for mechanical cooling. When there is a need for cooling, and if the outdoor-air conditions are favorable for economizing (e.g., outdoor-air temperature is less than return-air temperature or outdoor-air enthalpy is less than return-air enthalpy), the outdoor air damper is modulated from minimum position up to 100 percent or open as needed. In this way, unconditioned outdoor air can be used to meet all of the cooling energy needs or supplement mechanical cooling. In a properly configured economizer control sequence, the outdoor-, return-, and exhaust-air dampers sequence together to mix and balance the airflow streams to meet the AHU discharge-air temperature setpoint.
A malfunctioning economizer may go unnoticed by occupants and operations management because mechanical cooling will compensate to maintain the discharge air at the desired discharge-air setpoint. This may include periods of time where too much outdoor air is being introduced into the AHU (when the economizer control is attempting to maintain a minimum outdoor-air setpoint) or when there is not enough outdoor air being introduced to the AHU (when the economizer control is attempting to bring in the maximum amount of outdoor air). Improper economizer function could be a result of incorrect sequences controlling the outdoor-, return-, and exhaust-air dampers. It also could be a result of broken or malfunctioning linkages, dampers, and actuators, which could cause a damper to be locked into a single position. Failure to correct the situation, in all likelihood, will lead to increased fan, cooling, and heating energy consumption. A properly operating economizer can cut energy costs by as much as 10 percent of a building’s total energy consumption (up to 20 percent in mild, coastal climates), depending mostly on local climate and internal cooling loads.16
The HVAC system supplies minimum outdoor airflow to the building, except when the economizer is operating. Proper outdoor air is delivered to the building to maintain good indoor air quality and to pressurize the building. Cooling and heating that outdoor air is one of the most energy-intensive tasks that an HVAC system performs. The minimum outdoor airflow should be set as necessary for the actual building use and occupancy, meeting the ventilation code and matching or exceeding the amount of exhaust taken from the area served by the system. Excessive outdoor air will cause unintended cooling and heating energy use.
In summary, the common measures to significantly reduce energy consumption from outdoor air usage include the following:
� Modify outdoor-, return-, and exhaust-air damper control sequences
� Repair or replace broken dampers and linkages
� Adjust minimum outdoor air flow intake based on actual building use
Learn more at betterbuildingssolutioncenter.energy.gov/alliance/emis
17
Outdoor Air Usage Analysis and Examples with FDD TechnologiesFault Detection and Diagnostics tools are the main technology to determine if outdoor air usage is proper or not. Key BAS trend log data (30 minutes or a shorter interval) is used in FDD tools to determine proper outdoor air usage.
� Outdoor air temperature (from a BAS or nearby weather station)
� AHU mixed-air temperature
� AHU discharge air temperature and setpoint
� AHU return air temperature
� AHU outdoor air damper position signal
The following examples show automated outputs from FDD technologies applied to detect outdoor air usage opportunities, as well as plots and logic of the types of analysis that FDD tools may automate for the users.
Learn more at betterbuildingssolutioncenter.energy.gov/alliance/emis
18
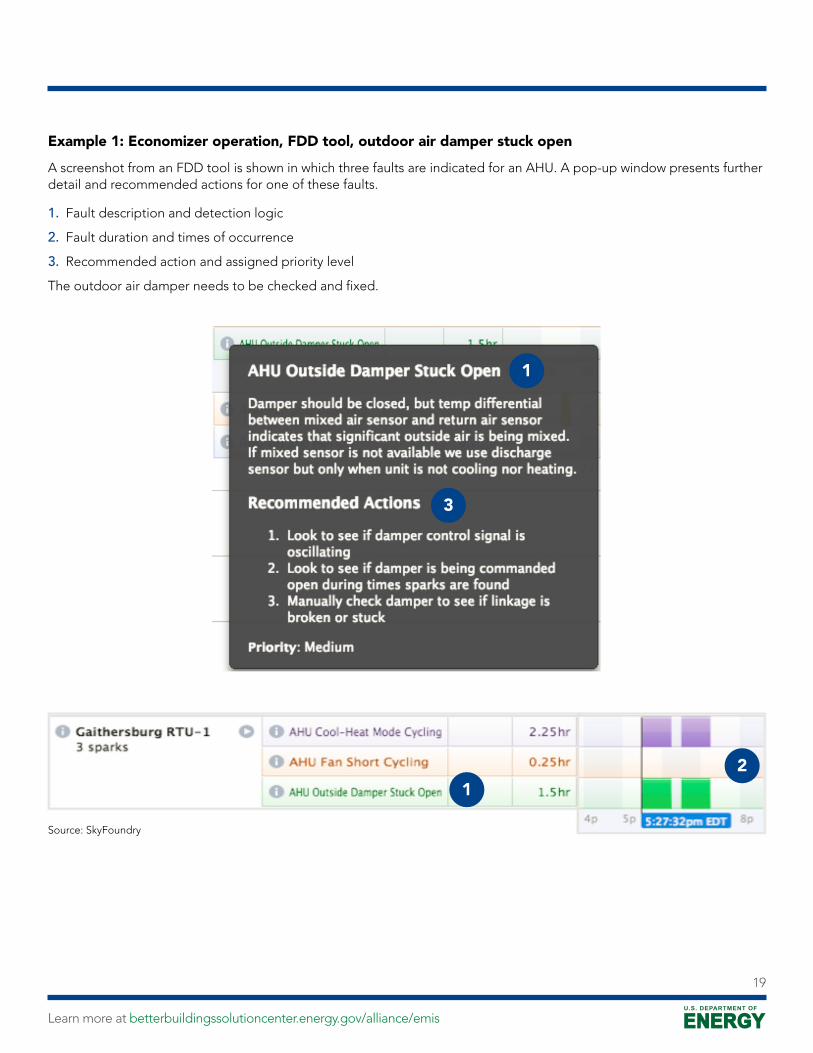
Example 1: Economizer operation, FDD tool, outdoor air damper stuck open
A screenshot from an FDD tool is shown in which three faults are indicated for an AHU. A pop-up window presents further detail and recommended actions for one of these faults.
1. Fault description and detection logic
2. Fault duration and times of occurrence
3. Recommended action and assigned priority level
The outdoor air damper needs to be checked and fixed.
Source: SkyFoundry
1
12
3
Learn more at betterbuildingssolutioncenter.energy.gov/alliance/emis
19
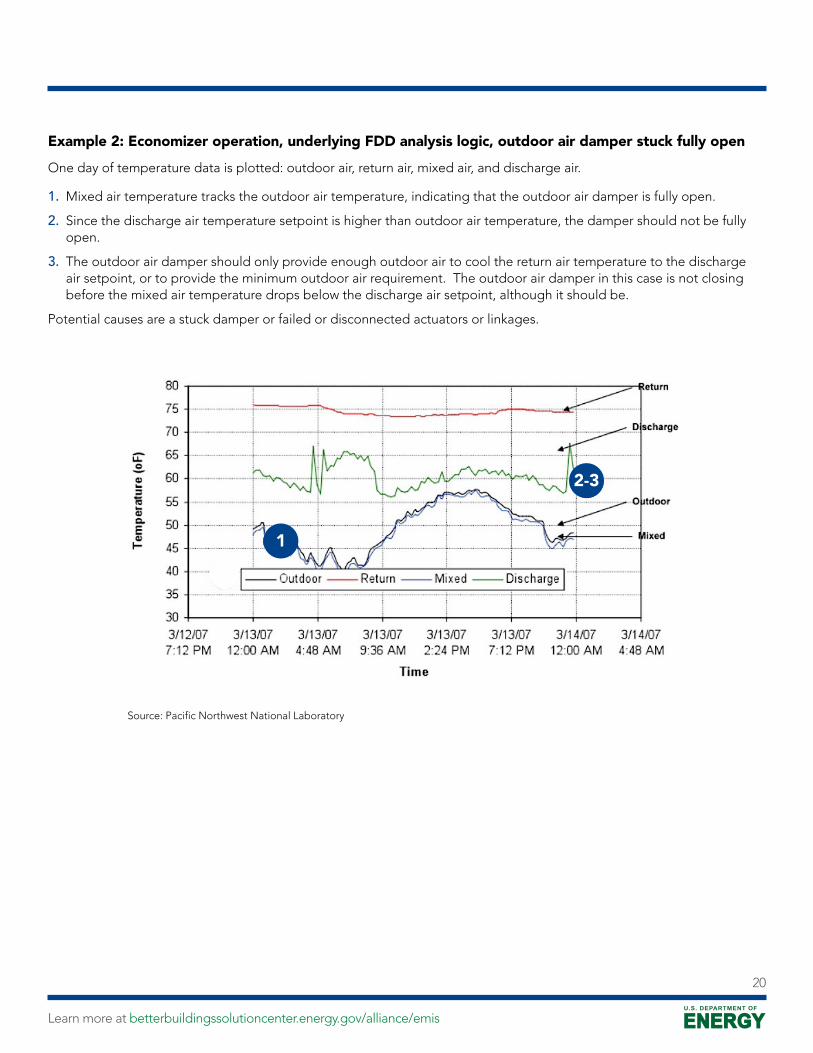
Example 2: Economizer operation, underlying FDD analysis logic, outdoor air damper stuck fully open
One day of temperature data is plotted: outdoor air, return air, mixed air, and discharge air.
1. Mixed air temperature tracks the outdoor air temperature, indicating that the outdoor air damper is fully open.
2. Since the discharge air temperature setpoint is higher than outdoor air temperature, the damper should not be fully open.
3. The outdoor air damper should only provide enough outdoor air to cool the return air temperature to the discharge air setpoint, or to provide the minimum outdoor air requirement. The outdoor air damper in this case is not closing before the mixed air temperature drops below the discharge air setpoint, although it should be.
Potential causes are a stuck damper or failed or disconnected actuators or linkages.
Source: Pacific Northwest National Laboratory
1
2-3
Learn more at betterbuildingssolutioncenter.energy.gov/alliance/emis
20

Example 3: Economizer operation, underlying FDD analysis logic, outdoor air damper stuck fully closed
One day of temperature data is plotted: outdoor air, return air, mixed air, and discharge air.
1. Outdoor air temperature is lower than the return air temperature, and is therefore acceptable for economizing.
2. Mixed air temperature tracks return air temperature, indicating that outdoor air is not entering the mixing box and the discharge air setpoint is being met with mechanical cooling when economizing/free cooling is available.
3. The outdoor air damper is closed, although it should be modulating to provide minimum outdoor air or free cooling.
Potential causes are a stuck closed damper or failed or disconnected actuators or linkages.
Source: Pacific Northwest National Laboratory
1
1 2-3
Learn more at betterbuildingssolutioncenter.energy.gov/alliance/emis
21
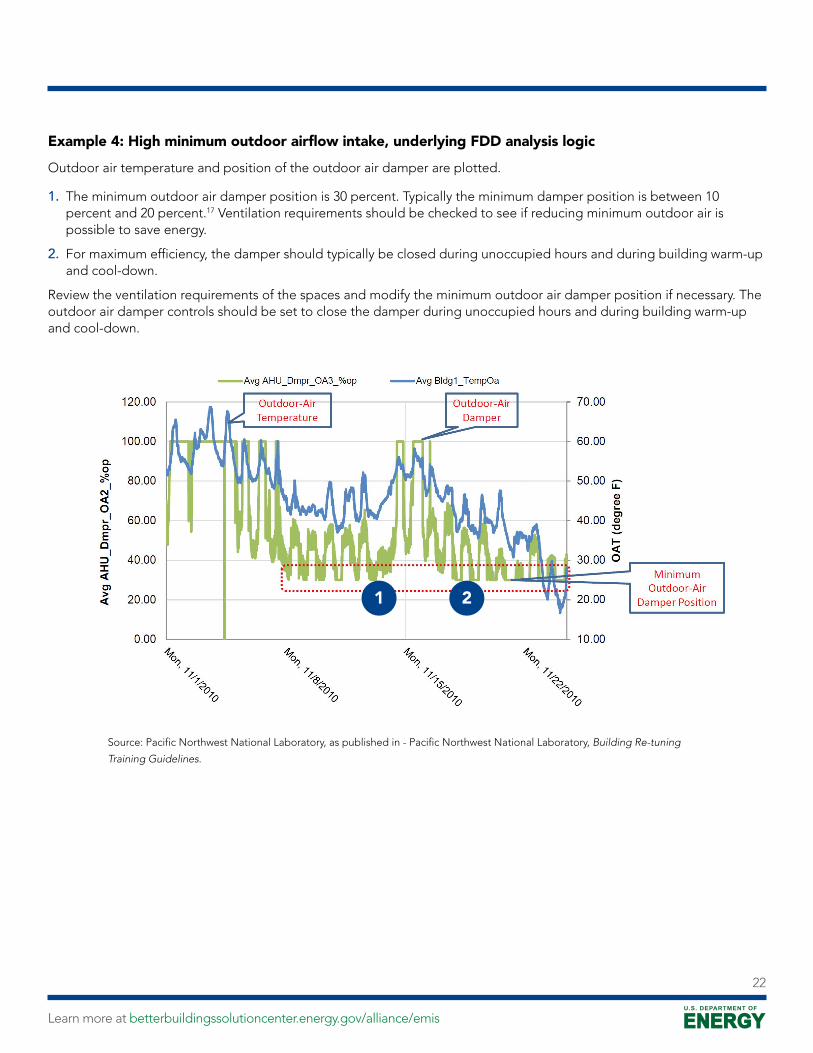
Example 4: High minimum outdoor airflow intake, underlying FDD analysis logic
Outdoor air temperature and position of the outdoor air damper are plotted.
1. The minimum outdoor air damper position is 30 percent. Typically the minimum damper position is between 10 percent and 20 percent.17 Ventilation requirements should be checked to see if reducing minimum outdoor air is possible to save energy.
2. For maximum efficiency, the damper should typically be closed during unoccupied hours and during building warm-up and cool-down.
Review the ventilation requirements of the spaces and modify the minimum outdoor air damper position if necessary. The outdoor air damper controls should be set to close the damper during unoccupied hours and during building warm-up and cool-down.
Source: Pacific Northwest National Laboratory, as published in - Pacific Northwest National Laboratory, Building Re-tuning
Training Guidelines.
1 2
Learn more at betterbuildingssolutioncenter.energy.gov/alliance/emis
22
Simultaneous Heating and CoolingSimultaneous Heating and Cooling OverviewSimultaneous heating and cooling is one of the most common efficiency opportunities available in commercial buildings and may be due to unnecessary reheating. In a typical system, the AHU’s discharge air temperature is usually designed to be a constant value between 53°F and 55°F to satisfy cooling requirements on the hottest day of the year. (Supply air temperature reset is a best practice that is now more common, although it is not universally implemented, and may often be implemented incorrectly.) When a zone only demands partial cooling, the zone terminal unit airflow volume is adjusted to meet the demand. If the airflow rate has already been reduced to the minimum airflow setpoint but is still too cold for the zone, reheat will be used to raise the terminal unit discharge air temperature. Improper control settings, valve or damper leakage, and sensor errors can lead to unnecessary simultaneous heating, mechanical cooling, and/or economizing. The energy penalty is amplified as the heating and cooling are used to negate each other. By eliminating unintended simultaneous heating and cooling, buildings can achieve savings of 5–20 percent in HVAC heating and cooling energy.18 The following HVAC system types are more likely to experience simultaneous heating and cooling problems. The Appendix presents the basic component layouts of these HVAC system types:
� Single-duct variable air volume (SDVAV) system with reheat
� Single-duct constant air volume (SDCAV) with reheat
� Dual duct
� Multizone
The common measures to minimize simultaneous heating and cooling include19:
� Reset AHU discharge air temperature (SDVAV and SDCAV) or AHU cold/hot deck discharge air temperature (dual duct and multi-zone) based on zone demand (best) or other demand metrics like outdoor air temperature, time of year, return air temperature, zone air temperature in a representative space, or some combination of these.
� Reduce AHU preheating settings to eliminate the unnecessary re-cooling when using economizer free cooling or mechanical cooling; anti-freezing requirements must still be met.
� Repair leaking cooling, heating, preheat, reheat coil valves, and dual-duct or multi-zone blending dampers to make sure that cooling/heating is not taking place when they are closed.
� Reduce VAV box minimum airflow settings wherever possible. More cooling and heating energy will be consumed if minimum airflow is greater than required. In principle, the minimum airflow should be determined based on actual space condition, satisfying the positive building pressure and ventilation requirements.
Learn more at betterbuildingssolutioncenter.energy.gov/alliance/emis
23

Simultaneous Heating and Cooling Analysis and Examples with EIS TechnologiesSimultaneous heating and cooling is a problem that is more commonly detected with FDD tools, but can be found even with interval meter data. EIS technologies can be used to conduct energy signature analyses with whole-building or submetered energy consumption data (hourly or shorter intervals). An energy signature is a plot of energy use versus the corresponding average outdoor temperature for a certain period of time, and can be used to derive insights related to high heating energy use in summer or high cooling energy use in winter. This approach is reviewed in detail in page 147 in the Energy Information Handbook.
The following example illustrates how to use an energy signature to identify simultaneous heating and cooling.
Learn more at betterbuildingssolutioncenter.energy.gov/alliance/emis
24

Example 1: Simultaneous heating and cooling in summer, natural gas energy signature
One year of hourly natural gas consumption data is plotted versus the average outdoor (outside) air temperature. The metered natural gas is only for the submetered HVAC system.
1. There is significant natural gas energy use occurring when the outside air temperature is greater than 65°F. High gas consumption during this type of temperature condition in the summer may be associated with simultaneous heating and cooling.
Source: Pacific Northwest National Laboratory, as published in - 2015. Metering Best Practices: A Guide to Achieving
Utility Resource Efficiency, Federal Energy Management Program, U.S. Department of Energy.
1
Learn more at betterbuildingssolutioncenter.energy.gov/alliance/emis
25

Simultaneous Heating and Cooling Analysis and Examples with FDD TechnologiesFault Detection and Diagnostics tools are commonly used to detect instances of simultaneous heating and cooling. In FDD tools, key BAS trend log data (30 minutes or a shorter interval) that relate to the heating or cooling status at different points within the HVAC system can be used to identify unnecessary simultaneous heating and cooling. These data points include:
� Air handling unit cooling coil valve status
� Air handling unit outdoor air damper position and outdoor air temperature (if economizer is implemented)
� Air handling unit heating coil valve status (if heating coil exists)
� Air handling unit preheating coil valve status (if preheating coil exists)
� Terminal unit reheat coil valve status (if reheat is used)
The following examples show automated outputs from FDD technologies applied to detect simultaneous heating and cooling, as well as plots and logic of the types of analysis that FDD tools may automate for the users.
Learn more at betterbuildingssolutioncenter.energy.gov/alliance/emis
26
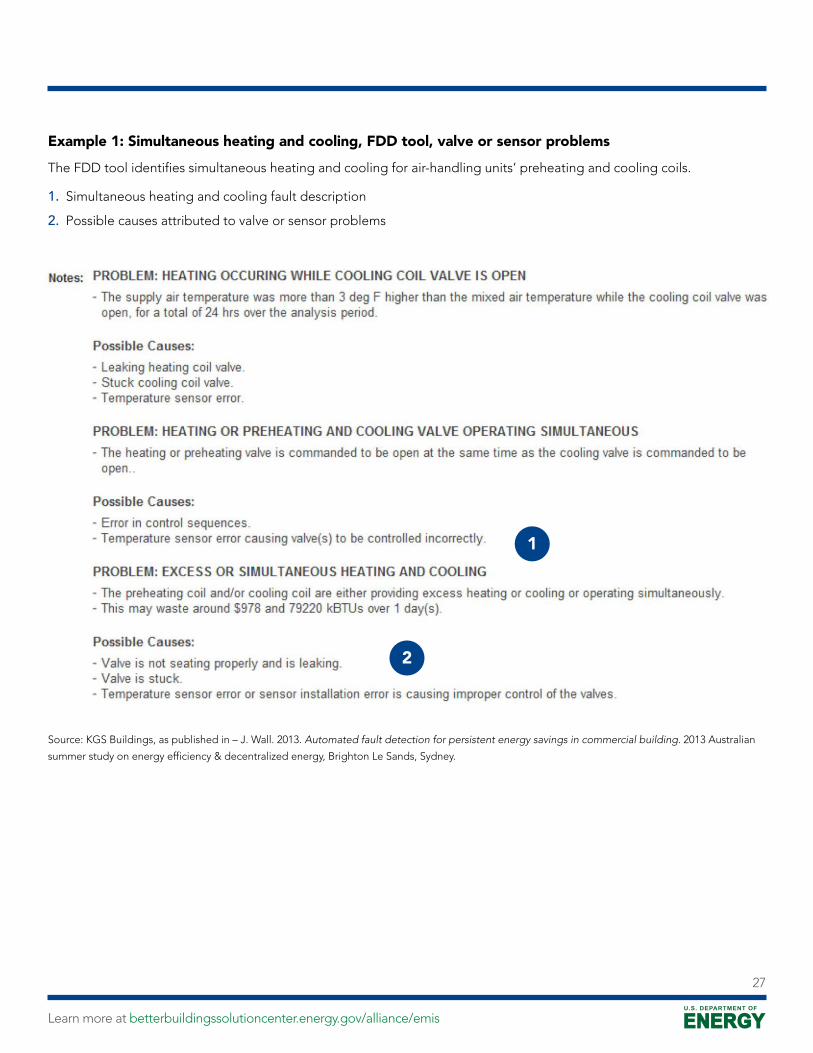
Example 1: Simultaneous heating and cooling, FDD tool, valve or sensor problems
The FDD tool identifies simultaneous heating and cooling for air-handling units’ preheating and cooling coils.
1. Simultaneous heating and cooling fault description
2. Possible causes attributed to valve or sensor problems
Source: KGS Buildings, as published in – J. Wall. 2013. Automated fault detection for persistent energy savings in commercial building. 2013 Australian
summer study on energy efficiency & decentralized energy, Brighton Le Sands, Sydney.
1
2
Learn more at betterbuildingssolutioncenter.energy.gov/alliance/emis
27

Example 2: Simultaneous heating and cooling, underlying FDD analysis logic, winter valve control
Air-handling unit cooling coil valve (CHWV) and heating coil valve (HWV) signal data are trended from the BAS and used for an FDD analysis. The trended period is in winter, during a time when heating only is required, and no cooling or dehumidification by the cooling coil is required.
1. The cooling coil valve and the heating coil valve are operating simultaneously. Heating and cooling of the airstream is taking place at the same time. Investigation found that the AHU cooling coil valve was not appropriately locked out for the winter season.
Source: Pacific Northwest National Laboratory, as published in - Pacific Northwest National Laboratory,
Building Re-tuning Training Guidelines.
1
1
Learn more at betterbuildingssolutioncenter.energy.gov/alliance/emis
28
Air-side Setpoint OptimizationAir-side Setpoint Optimization OverviewIn addition to scheduling and outdoor air usage, optimizing other HVAC system control setpoints can also save energy, with low cost and quick paybacks. A centralized HVAC system consists of two main components: the air-side system (e.g., zone terminal units, thermostat, and air-handling units) and the water-side system (e.g., chillers, boilers, pumps, and cooling towers). Simulation results show that many of the air-side optimizations are capable of reducing annual HVAC energy use by over 20 percent in most cities.20 The common optimizing HVAC air-side setpoint strategies include the following21:
� AHU discharge air temperature reset: For many AHUs, discharge air temperature may be designed to be a constant value between 53°F to 55°F to satisfy cooling requirements on the hottest day of the year. The discharge air temperature can be reset during times of partial cooling load to reduce chiller cooling load and the unnecessary reheating of already cooled air and increase airside economizer hours.
� AHU static pressure reset: The AHU discharge air static pressure is often used in VAV systems to control the AHU fan speed and ensure proper airflow in all zones. The static pressure may be set as a constant setpoint based on maximum cooling load condition airflow requirements. Under partial cooling load conditions, many zones need less airflow (to maintain zone temperature setpoint and ventilation), and their VAV terminal unit dampers will modulate down to a minimum position. This situation results in the fan using more power than necessary. With HVAC systems that include digital zone controls, static pressure reset can be implemented using continuous feedback from the VAV terminal unit dampers position (the representative of zone demand).22
� Thermostat setpoints: If the thermostat cooling setpoint is too low or the heating setpoint is too high, the space will be overcooled or overheated, causing unintended energy consumption. In addition, keep a minimum dead-band of 3°F between heating and cooling setpoints during occupied hours to reduce simultaneous heating and cooling. Increase the dead-band for higher savings, particularly in spaces with intermittent or transient occupancy.
While supply air temperature reset and static pressure reset are now common best practice, they are not universally implemented, and are often implemented incorrectly or manually overridden.
Learn more at betterbuildingssolutioncenter.energy.gov/alliance/emis
29

Air-Side Setpoint Optimization Analysis and Examples with FDD TechnologiesFault Detection and Diagnostics tools are the main technology to identify the opportunities of HVAC air-side system control setpoint. Key BAS trend log data (30 minutes or a shorter interval) used in FDD tools include:
� AHU discharge air temperature and setpoint
� AHU static pressure and setpoint
� Zone heating and cooling temperature and setpoints
The following examples show automated outputs from FDD technologies applied to detect air-side setpoint optimization opportunities, as well as plots and logic of the types of analysis that FDD tools may automate for the users.
Learn more at betterbuildingssolutioncenter.energy.gov/alliance/emis
30
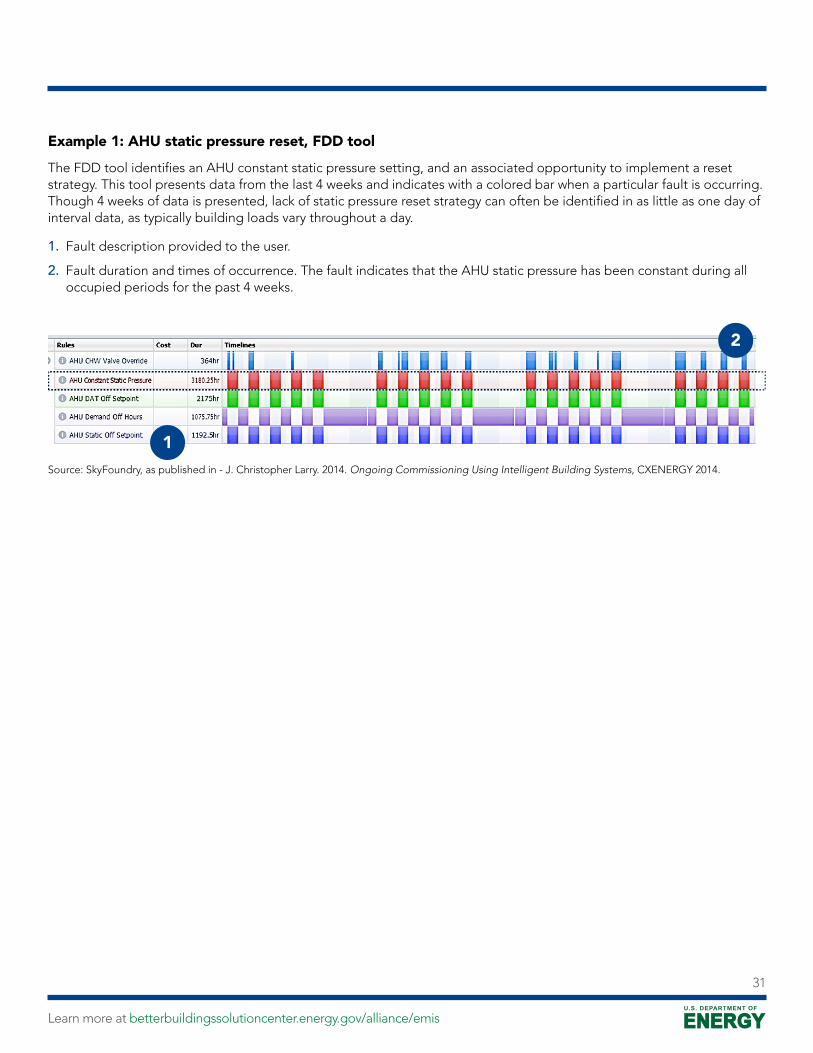
Example 1: AHU static pressure reset, FDD tool
The FDD tool identifies an AHU constant static pressure setting, and an associated opportunity to implement a reset strategy. This tool presents data from the last 4 weeks and indicates with a colored bar when a particular fault is occurring. Though 4 weeks of data is presented, lack of static pressure reset strategy can often be identified in as little as one day of interval data, as typically building loads vary throughout a day.
1. Fault description provided to the user.
2. Fault duration and times of occurrence. The fault indicates that the AHU static pressure has been constant during all occupied periods for the past 4 weeks.
Source: SkyFoundry, as published in - J. Christopher Larry. 2014. Ongoing Commissioning Using Intelligent Building Systems, CXENERGY 2014.
1
2
Learn more at betterbuildingssolutioncenter.energy.gov/alliance/emis
31
Example 2: AHU static pressure reset, underlying FDD logic
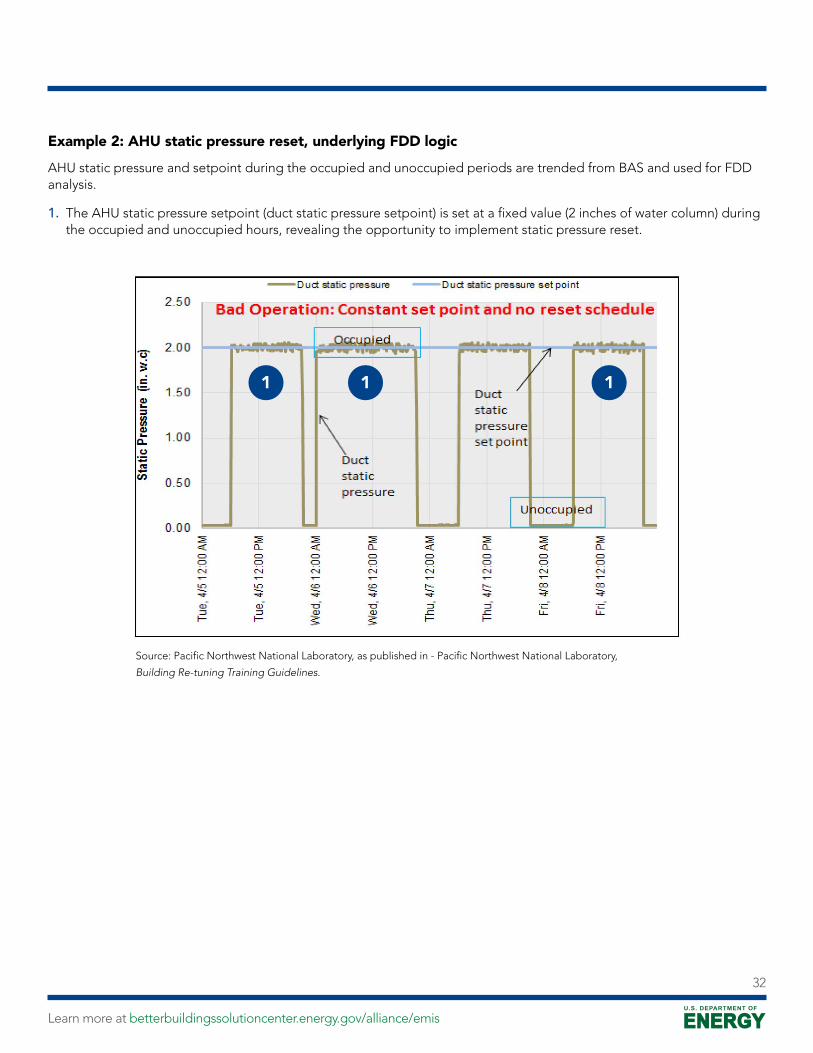
AHU static pressure and setpoint during the occupied and unoccupied periods are trended from BAS and used for FDD analysis.
1. The AHU static pressure setpoint (duct static pressure setpoint) is set at a fixed value (2 inches of water column) during the occupied and unoccupied hours, revealing the opportunity to implement static pressure reset.
Source: Pacific Northwest National Laboratory, as published in - Pacific Northwest National Laboratory,
Building Re-tuning Training Guidelines.
1 1 1
Learn more at betterbuildingssolutioncenter.energy.gov/alliance/emis
32
Example 3: AHU discharge air temperature reset, underlying FDD logic
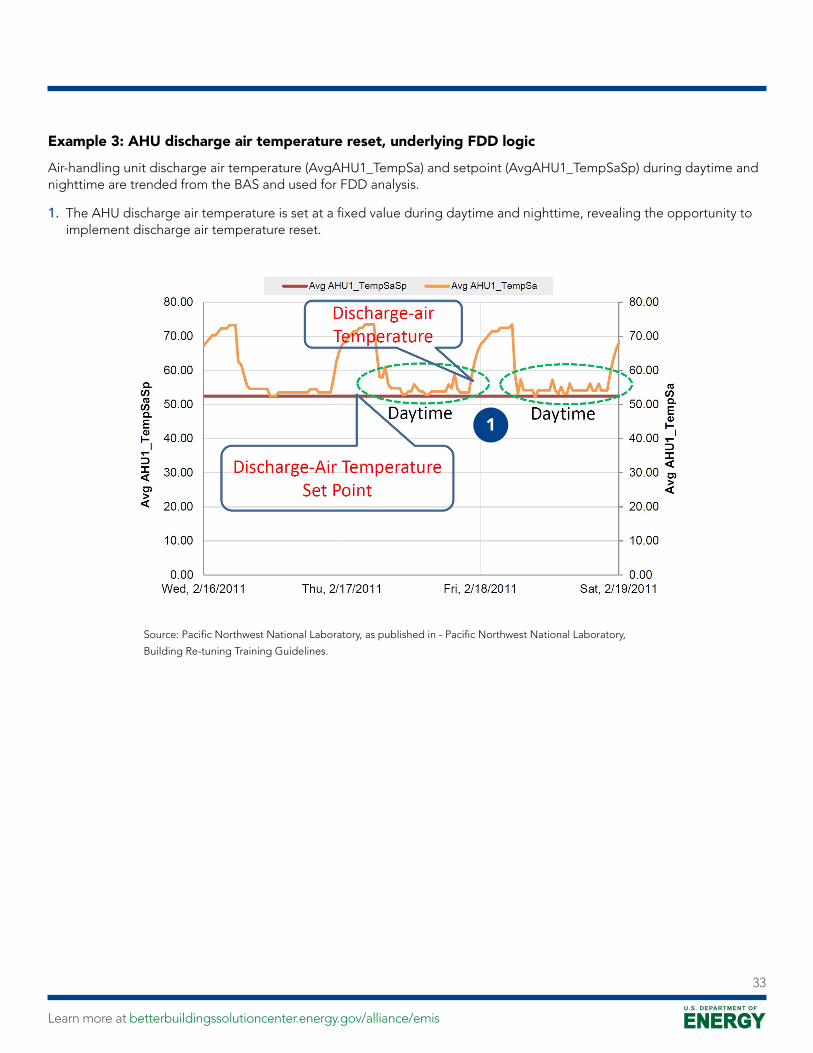
Air-handling unit discharge air temperature (AvgAHU1_TempSa) and setpoint (AvgAHU1_TempSaSp) during daytime and nighttime are trended from the BAS and used for FDD analysis.
1. The AHU discharge air temperature is set at a fixed value during daytime and nighttime, revealing the opportunity to implement discharge air temperature reset.
Source: Pacific Northwest National Laboratory, as published in - Pacific Northwest National Laboratory,
Building Re-tuning Training Guidelines.
1
Learn more at betterbuildingssolutioncenter.energy.gov/alliance/emis
33
Sensor ErrorsSensor Errors OverviewVarious sensors are used in the BAS to measure temperature, pressure, flow rate, carbon dioxide levels, and other operational and control parameters. Building automation systems (BAS) rely on sensor measurements for proper feedback to take actions. Fault Detection and Diagnostics (FDD) tools also rely on these sensor measurements to determine the presence or absence of faults. Therefore, accurate sensors are the foundation of reliable BAS controls and FDD analysis. Unfortunately, sensors may suffer various problems, including drift, bias, or complete failure, leading to erroneous readings. Inaccurate sensors can lead to enormous energy penalties. For example, simulation shows that an AHU discharge air temperature sensor that is offset by 2°C increases HVAC energy consumption by 10 percent.23 Additionally, a sensor may be placed in a location that is not suitable to capture the intended measurement, causing issues similar to erroneous readings.
While many sensors are used in BAS, those used by HVAC control loops are most likely to affect energy use. Common sensors used for control24 are listed below:
� Outdoor air temperature sensor
� AHU discharge air temperature sensor
� AHU mixed air temperature sensor
� AHU return air temperature sensor
� AHU wet bulb temperature or relative humidity sensor
� Zone thermostat space temperature sensor
� Zone carbon dioxide sensor
� Central plant chilled water leaving temperature sensor
� Central plant cooling tower condenser water leaving temperature sensor
� Central plant hot water leaving temperature sensor
Malfunctioning sensors need to be recalibrated, fixed, or replaced. Regular recalibration is recommended to maintain monitoring and control sensor hardware. Refer to the information provided by the manufacturer to determine sensor accuracy requirements and calibration processes. In addition, FDD tools may also offer automated analyses to identify sensor errors.
Learn more at betterbuildingssolutioncenter.energy.gov/alliance/emis
34

Sensor Errors Analysis and Examples with FDD TechnologiesFault Detection and Diagnostics tools are the main technology used to identify sensor errors. Key BAS trend log data (30 minutes or a shorter interval) used in FDD tools are the measured data from the critical sensors listed in the preceding overview. The typical FDD analysis to identify sensor errors includes the following:
� Check to see if the sensor reading is outside of a feasible range
� Check to see if the sensor reading is flat-lining
� Check the engineering logic with respect to the value of other sensors
The following examples show automated outputs from FDD technologies applied to detect sensor errors, as well as plots and logic of the types of analysis that FDD tools may automate for the users.
Learn more at betterbuildingssolutioncenter.energy.gov/alliance/emis
35
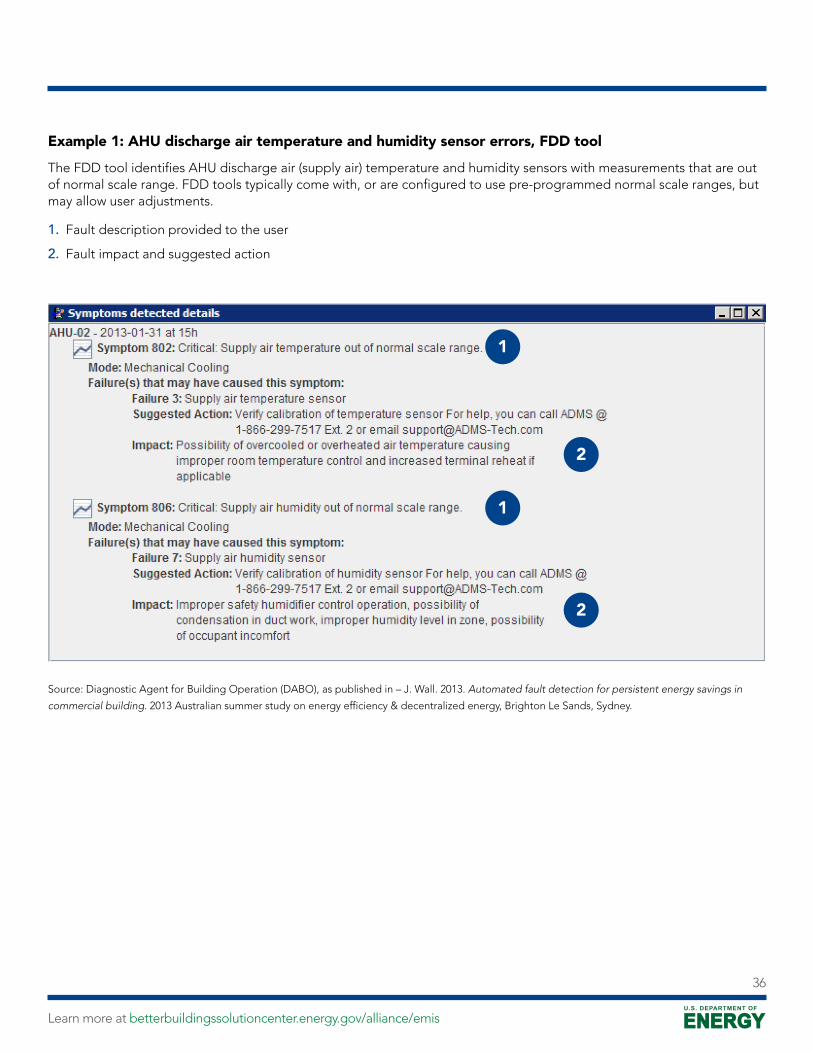
Example 1: AHU discharge air temperature and humidity sensor errors, FDD tool
The FDD tool identifies AHU discharge air (supply air) temperature and humidity sensors with measurements that are out of normal scale range. FDD tools typically come with, or are configured to use pre-programmed normal scale ranges, but may allow user adjustments.
1. Fault description provided to the user
2. Fault impact and suggested action
Source: Diagnostic Agent for Building Operation (DABO), as published in – J. Wall. 2013. Automated fault detection for persistent energy savings in
commercial building. 2013 Australian summer study on energy efficiency & decentralized energy, Brighton Le Sands, Sydney.
1
2
1
2
Learn more at betterbuildingssolutioncenter.energy.gov/alliance/emis
36
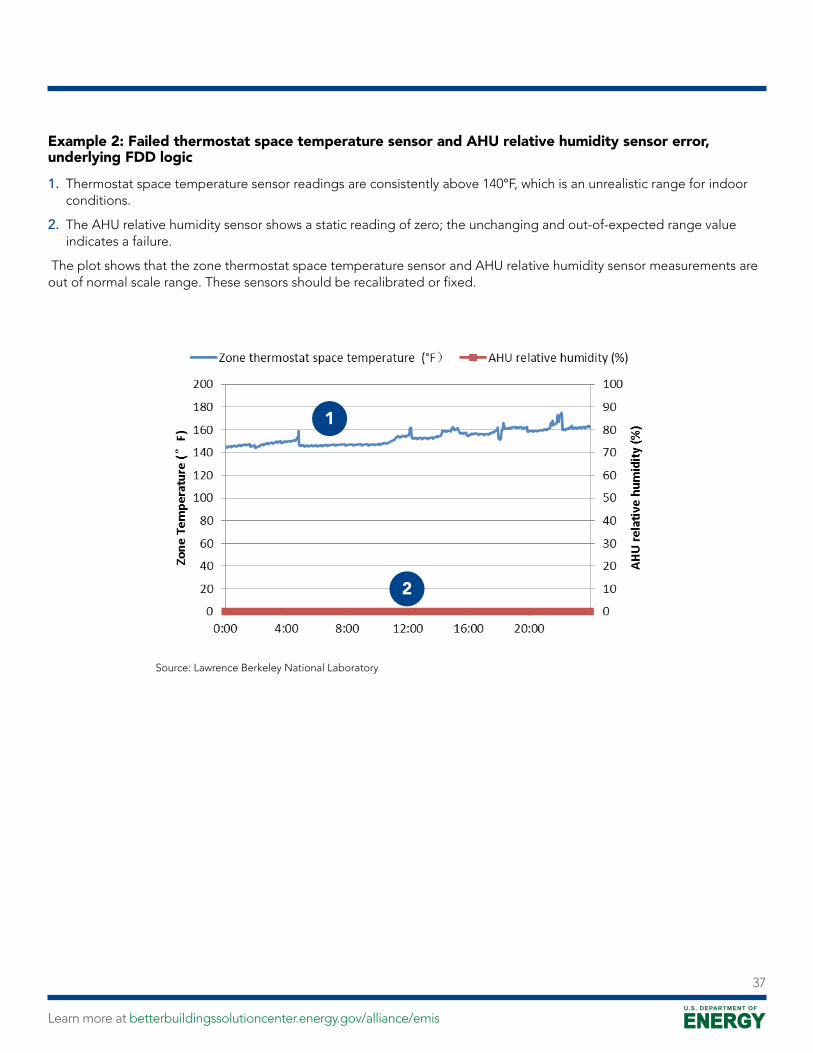
Example 2: Failed thermostat space temperature sensor and AHU relative humidity sensor error, underlying FDD logic
1. Thermostat space temperature sensor readings are consistently above 140°F, which is an unrealistic range for indoor conditions.
2. The AHU relative humidity sensor shows a static reading of zero; the unchanging and out-of-expected range value indicates a failure.
The plot shows that the zone thermostat space temperature sensor and AHU relative humidity sensor measurements are out of normal scale range. These sensors should be recalibrated or fixed.
Source: Lawrence Berkeley National Laboratory
2
1
Learn more at betterbuildingssolutioncenter.energy.gov/alliance/emis
37

Example 3: RTU mixed air temperature sensor error, underlying FDD logic
Rooftop unit (RTU) data are trended from the BAS and used for FDD analysis: outdoor air, return air, mixed air, and supply air temperature, mixing box damper position, and cooling and heating coil valve positions.
1. The heating coil valve is fully closed and mixing box dampers reposition for minimum outdoor air intake, which suggests that the RTU is in mechanical cooling mode. In mechanical cooling mode, the mixed air temperature should be between the outdoor air temperature and the return air temperature.
2. The mixed air temperature is lower than both the outdoor air temperature and the return air temperature, indicating that the mixed air, outdoor air, or return air sensors have errors.
Upon investigation, the onsite engineer determined that the mixed air temperature sensor had drifted out of calibration and needed to be recalibrated.
Source: 2013 CEC Advanced Automated HVAC Fault Detection and Diagnostics Commercialization Program
1
1
22
2
Learn more at betterbuildingssolutioncenter.energy.gov/alliance/emis
38
Additional Useful AnalysesOverview of Additional Useful AnalysesAdditional building-level analyses that are offered in EIS technologies and can support overall energy management and persistence of savings with minimal data requirements. These analyses include:
� benchmarking to prioritize efficiency efforts within a portfolio
� automated savings estimation
� continuous anomaly detection
� peak load management
Benchmarking for portfolio prioritization: Often a portfolio manager must prioritize efficiency efforts, due to limited resources. Visualizations of energy use (yearly, monthly, or a shorter interval), floor area, and weather data together can help this prioritization. Cross-sectional benchmarking can identify buildings with high potential for savings. It is the process of comparing a building’s energy efficiency relative to a peer group, perhaps from ENERGY STAR’s Portfolio Manager. This approach is reviewed in detail in page 59 in the Energy Information Handbook.
Automated savings estimation: Building owners or energy managers may be interested in determining energy or energy cost savings from efficiency projects, tracking effectiveness and justifying future projects. EIS technologies can be used to automate the savings estimation process. These analyses use baseline models, which predict energy consumption from key parameters such as ambient weather conditions, schedules, and historical energy data. Energy savings and model baselines are reviewed in detail in pages 159–161 and pages 119–123, respectively, in the Energy Information Handbook.
Continuous anomaly detection: Retrocommissioning has proven to be a cost-effective means to improve system operation and produce substantial energy savings. However, retrocommissioning savings often drift over time if performance is not continuously tracked.25 Persistence can be supported with energy anomaly detection analyses that flag deviations between actual and expected energy consumption. Expected consumption is determined using model baselines of the same type used in automated savings estimation or more simplified approaches. Energy anomaly detection is reviewed in detail in pages 175–178 of the Energy Information Handbook.
Peak load management: Peak demand charges may comprise a significant portion of utility costs particularly for large buildings. Therefore, reducing the fraction of the time that a building operates at a very high load even by a little bit could result in significant cost savings. Load duration curves provided in EIS technologies can be used to identify potential reductions in utility demand charges. This approach is reviewed in detail in page 10 in the User Guide: OpenEIS Reference Code.
Examples of these analyses follow.
Learn more at betterbuildingssolutioncenter.energy.gov/alliance/emis
39
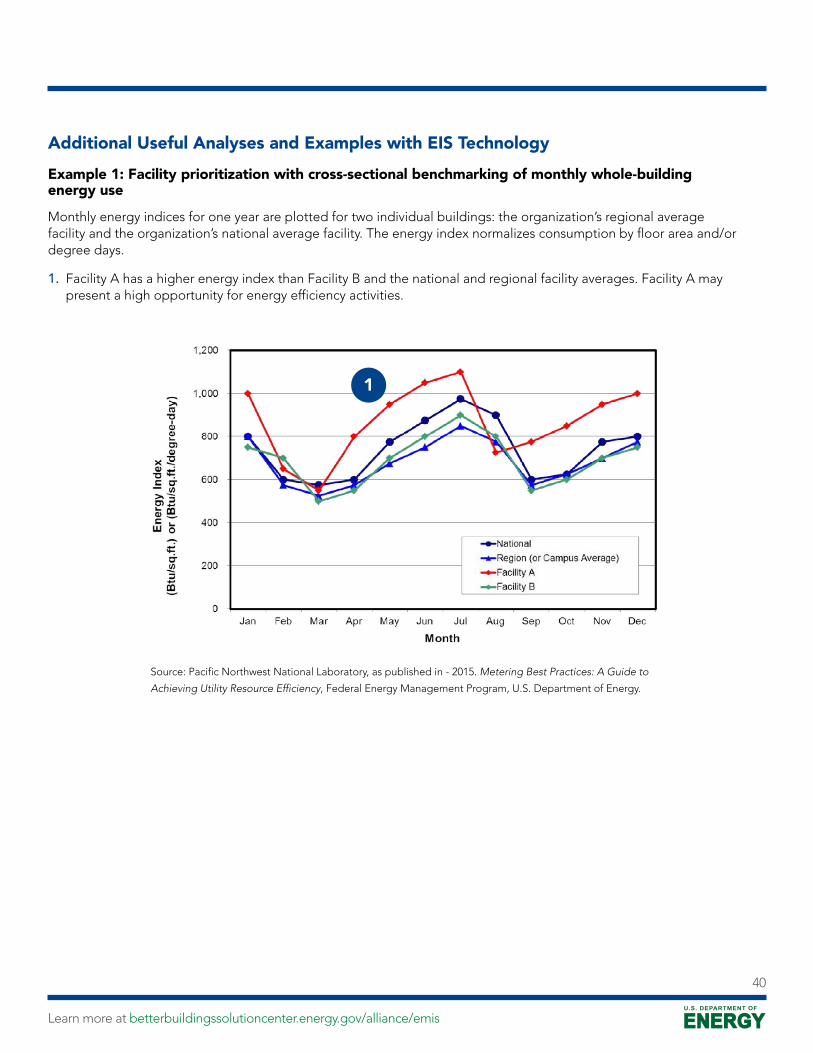
Additional Useful Analyses and Examples with EIS TechnologyExample 1: Facility prioritization with cross-sectional benchmarking of monthly whole-building energy use
Monthly energy indices for one year are plotted for two individual buildings: the organization’s regional average facility and the organization’s national average facility. The energy index normalizes consumption by floor area and/or degree days.
1. Facility A has a higher energy index than Facility B and the national and regional facility averages. Facility A may present a high opportunity for energy efficiency activities.
Source: Pacific Northwest National Laboratory, as published in - 2015. Metering Best Practices: A Guide to
Achieving Utility Resource Efficiency, Federal Energy Management Program, U.S. Department of Energy.
1
Learn more at betterbuildingssolutioncenter.energy.gov/alliance/emis
40
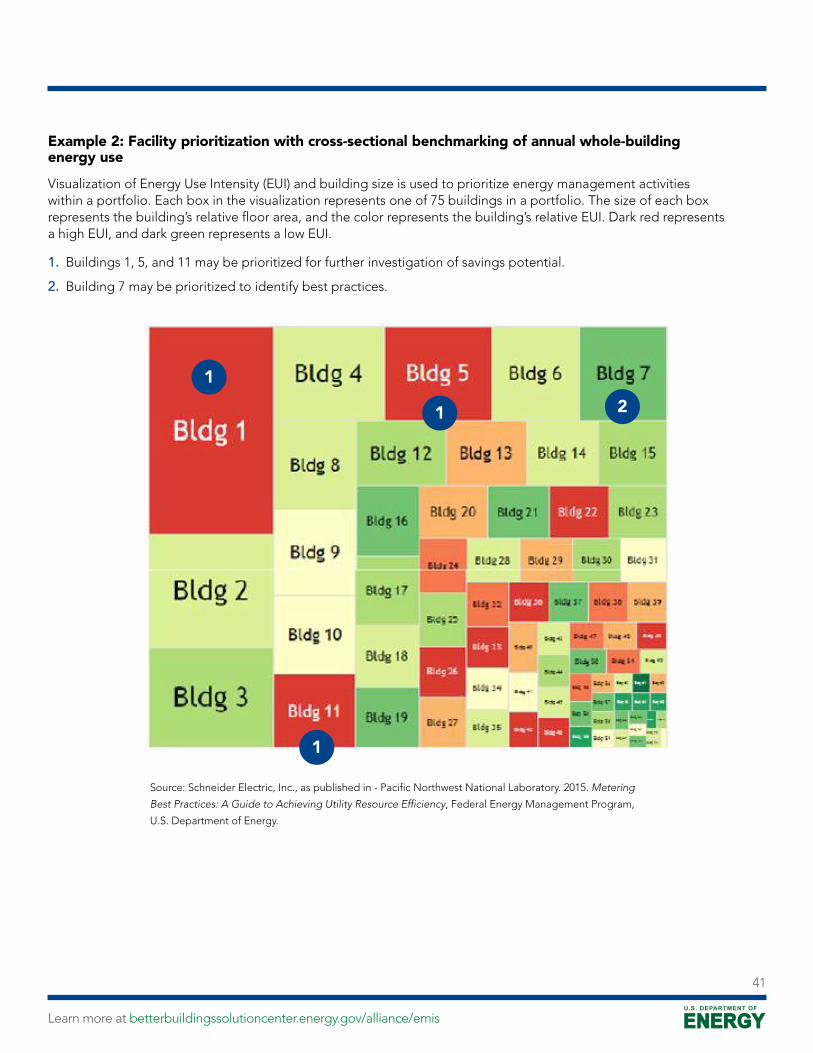
Example 2: Facility prioritization with cross-sectional benchmarking of annual whole-building energy use
Visualization of Energy Use Intensity (EUI) and building size is used to prioritize energy management activities within a portfolio. Each box in the visualization represents one of 75 buildings in a portfolio. The size of each box represents the building’s relative floor area, and the color represents the building’s relative EUI. Dark red represents a high EUI, and dark green represents a low EUI.
1. Buildings 1, 5, and 11 may be prioritized for further investigation of savings potential.
2. Building 7 may be prioritized to identify best practices.
Source: Schneider Electric, Inc., as published in - Pacific Northwest National Laboratory. 2015. Metering
Best Practices: A Guide to Achieving Utility Resource Efficiency, Federal Energy Management Program,
U.S. Department of Energy.
1
1
1
2
Learn more at betterbuildingssolutioncenter.energy.gov/alliance/emis
41
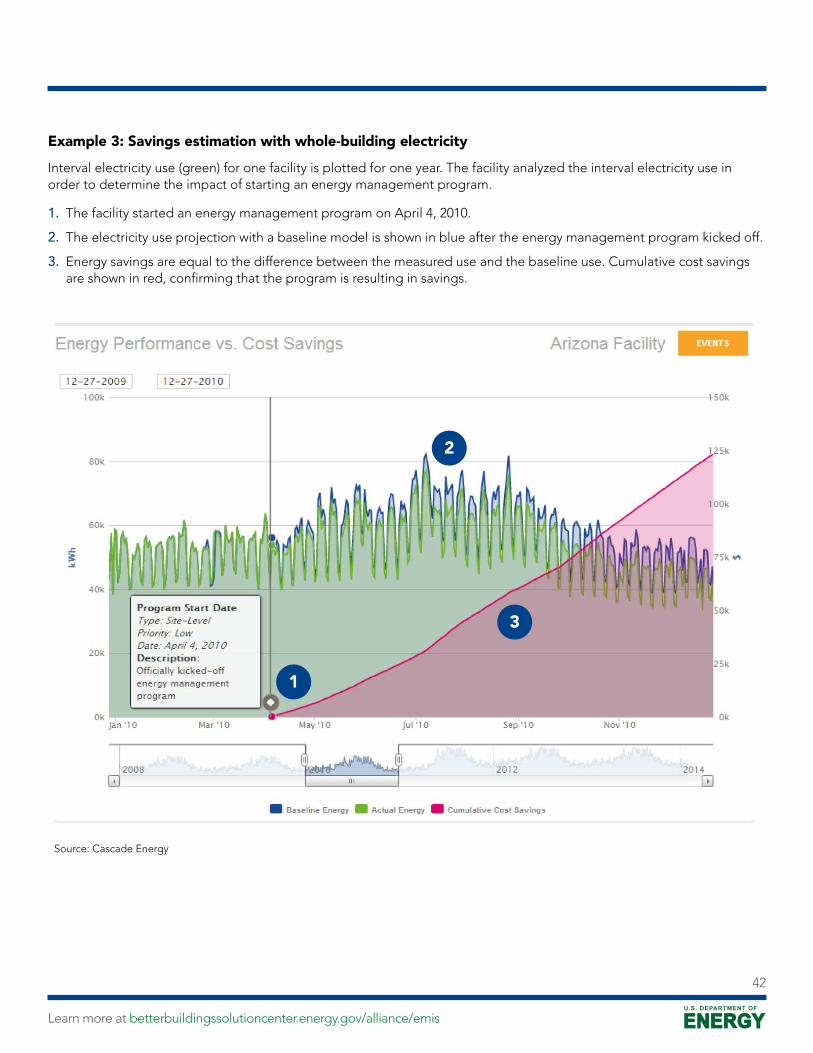
Example 3: Savings estimation with whole-building electricity
Interval electricity use (green) for one facility is plotted for one year. The facility analyzed the interval electricity use in order to determine the impact of starting an energy management program.
1. The facility started an energy management program on April 4, 2010.
2. The electricity use projection with a baseline model is shown in blue after the energy management program kicked off.
3. Energy savings are equal to the difference between the measured use and the baseline use. Cumulative cost savings are shown in red, confirming that the program is resulting in savings.
Source: Cascade Energy
1
3
2
Learn more at betterbuildingssolutioncenter.energy.gov/alliance/emis
42

Example 4: Persistence of savings with whole-building energy anomaly detection
The figure shows four 24-hour profiles of outdoor air temperature (yellow line), projected load (green band), and actual load for one building. The profiles show how the actual load compares to the projected load for each day, where the projected load is based on historic consumption and the forecasted outdoor air temperature for that day.
1. The actual load is color-coded red when above the expected range and olive when within the expected range.
2. Excessive after-hours use on Day 1 was traced to a cleaning crew HVAC override.
3. On Day 2 the crew was notified, and reduced the load some, but not enough.
4. On Days 3 and 4 the expected after-hours load increased due to a repeating monthly event.
5. By Day 4, the BAS was programmed to limit HVAC override times, and the waste was eliminated.
Overrides, lock-outs, and anomalous equipment operations may also be identifiable using analyses offered in FDD tools.
Source: Integrated Building Solutions
23
45
1
Learn more at betterbuildingssolutioncenter.energy.gov/alliance/emis
43
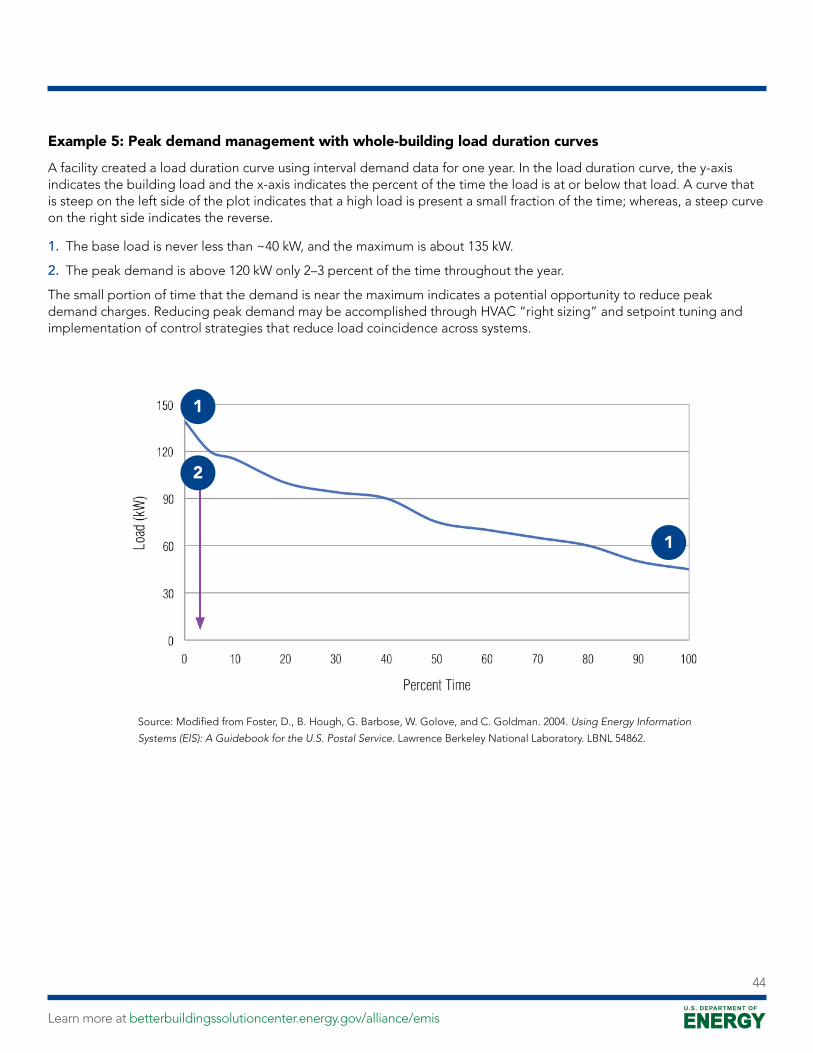
Example 5: Peak demand management with whole-building load duration curves
A facility created a load duration curve using interval demand data for one year. In the load duration curve, the y-axis indicates the building load and the x-axis indicates the percent of the time the load is at or below that load. A curve that is steep on the left side of the plot indicates that a high load is present a small fraction of the time; whereas, a steep curve on the right side indicates the reverse.
1. The base load is never less than ~40 kW, and the maximum is about 135 kW.
2. The peak demand is above 120 kW only 2–3 percent of the time throughout the year.
The small portion of time that the demand is near the maximum indicates a potential opportunity to reduce peak demand charges. Reducing peak demand may be accomplished through HVAC “right sizing” and setpoint tuning and implementation of control strategies that reduce load coincidence across systems.
Source: Modified from Foster, D., B. Hough, G. Barbose, W. Golove, and C. Goldman. 2004. Using Energy Information
Systems (EIS): A Guidebook for the U.S. Postal Service. Lawrence Berkeley National Laboratory. LBNL 54862.
1
1
2
Learn more at betterbuildingssolutioncenter.energy.gov/alliance/emis
44
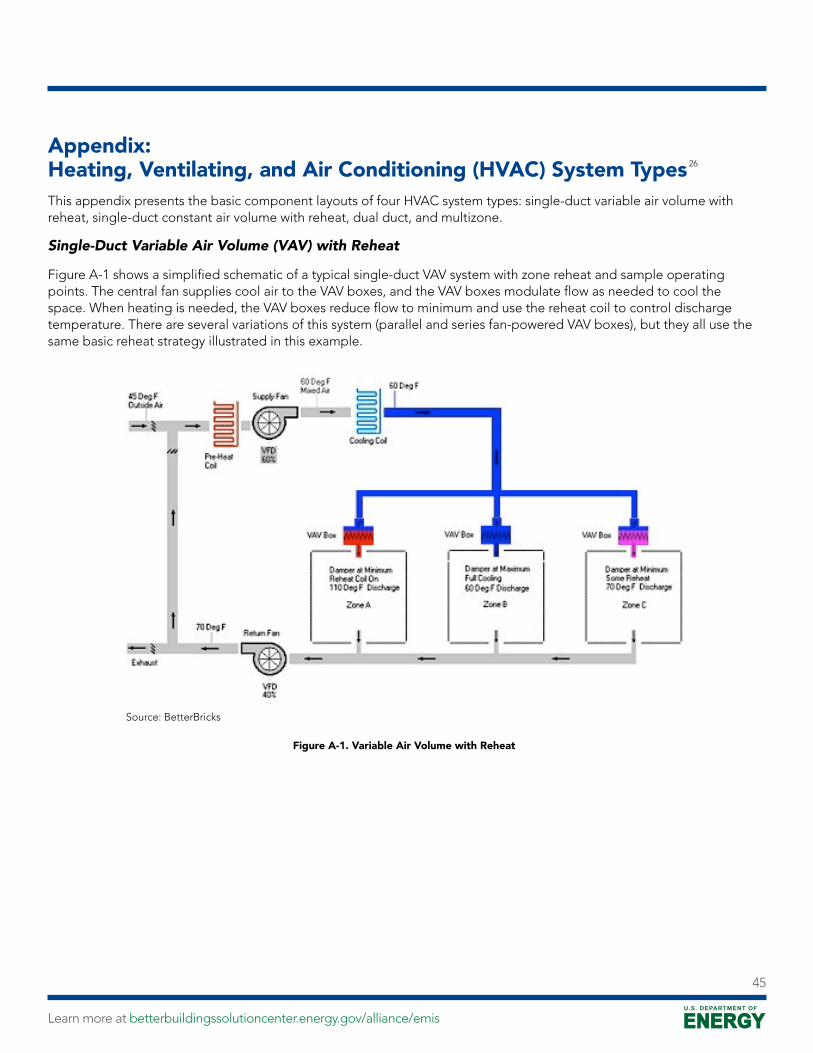
Appendix: Heating, Ventilating, and Air Conditioning (HVAC) System TypesThis appendix presents the basic component layouts of four HVAC system types: single-duct variable air volume with reheat, single-duct constant air volume with reheat, dual duct, and multizone.
Single-Duct Variable Air Volume (VAV) with Reheat
Figure A-1 shows a simplified schematic of a typical single-duct VAV system with zone reheat and sample operating points. The central fan supplies cool air to the VAV boxes, and the VAV boxes modulate flow as needed to cool the space. When heating is needed, the VAV boxes reduce flow to minimum and use the reheat coil to control discharge temperature. There are several variations of this system (parallel and series fan-powered VAV boxes), but they all use the same basic reheat strategy illustrated in this example.
Source: BetterBricks
Figure A-1. Variable Air Volume with Reheat
26
Learn more at betterbuildingssolutioncenter.energy.gov/alliance/emis
45
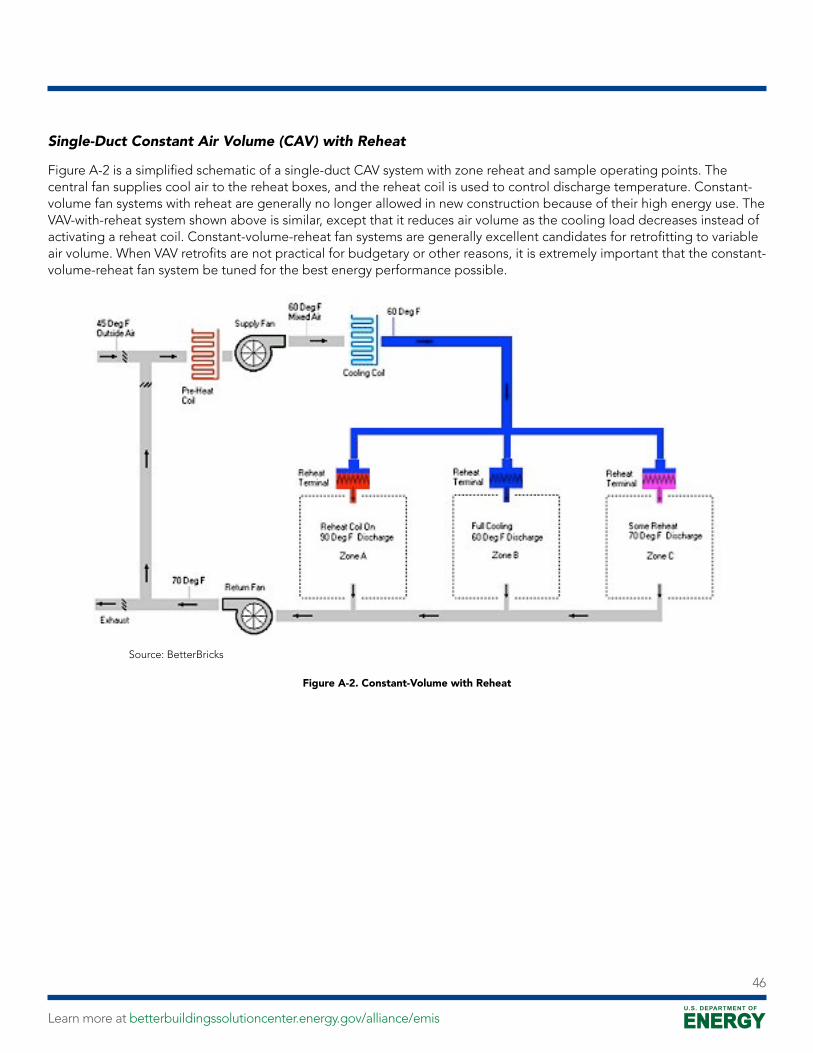
Single-Duct Constant Air Volume (CAV) with Reheat
Figure A-2 is a simplified schematic of a single-duct CAV system with zone reheat and sample operating points. The central fan supplies cool air to the reheat boxes, and the reheat coil is used to control discharge temperature. Constant-volume fan systems with reheat are generally no longer allowed in new construction because of their high energy use. The VAV-with-reheat system shown above is similar, except that it reduces air volume as the cooling load decreases instead of activating a reheat coil. Constant-volume-reheat fan systems are generally excellent candidates for retrofitting to variable air volume. When VAV retrofits are not practical for budgetary or other reasons, it is extremely important that the constant-volume-reheat fan system be tuned for the best energy performance possible.
Source: BetterBricks
Figure A-2. Constant-Volume with Reheat
Learn more at betterbuildingssolutioncenter.energy.gov/alliance/emis
46
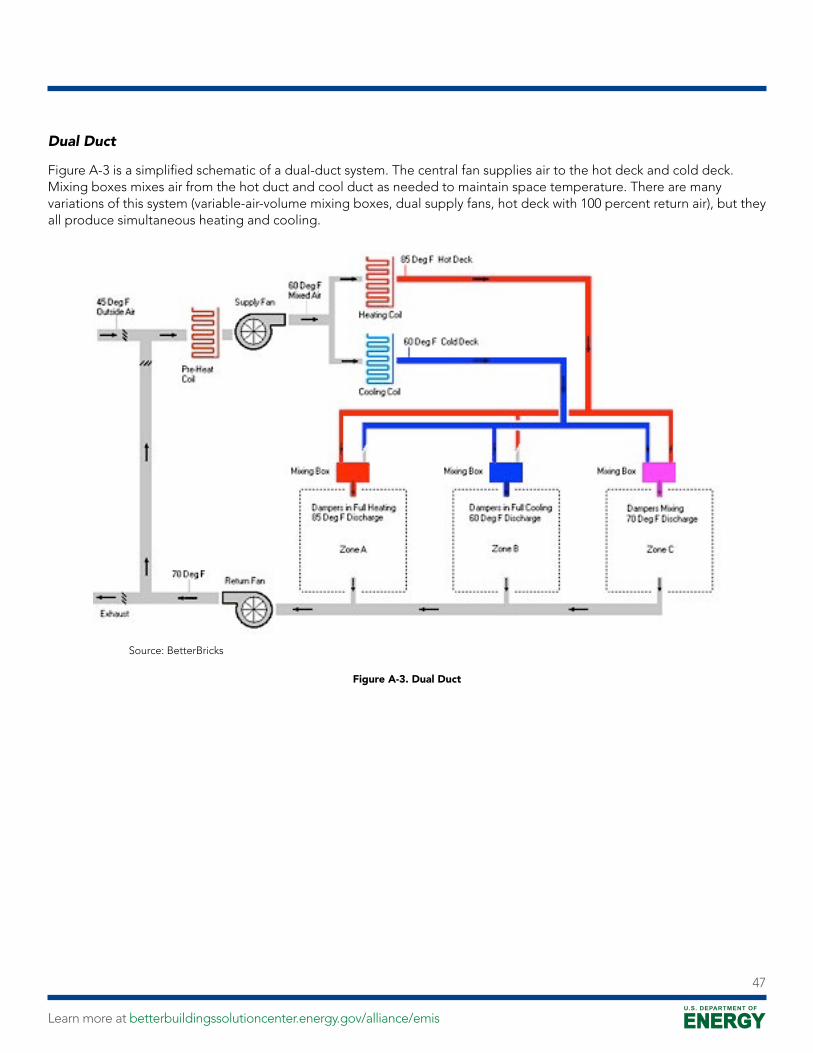
Dual Duct
Figure A-3 is a simplified schematic of a dual-duct system. The central fan supplies air to the hot deck and cold deck. Mixing boxes mixes air from the hot duct and cool duct as needed to maintain space temperature. There are many variations of this system (variable-air-volume mixing boxes, dual supply fans, hot deck with 100 percent return air), but they all produce simultaneous heating and cooling.
Source: BetterBricks
Figure A-3. Dual Duct
Learn more at betterbuildingssolutioncenter.energy.gov/alliance/emis
47
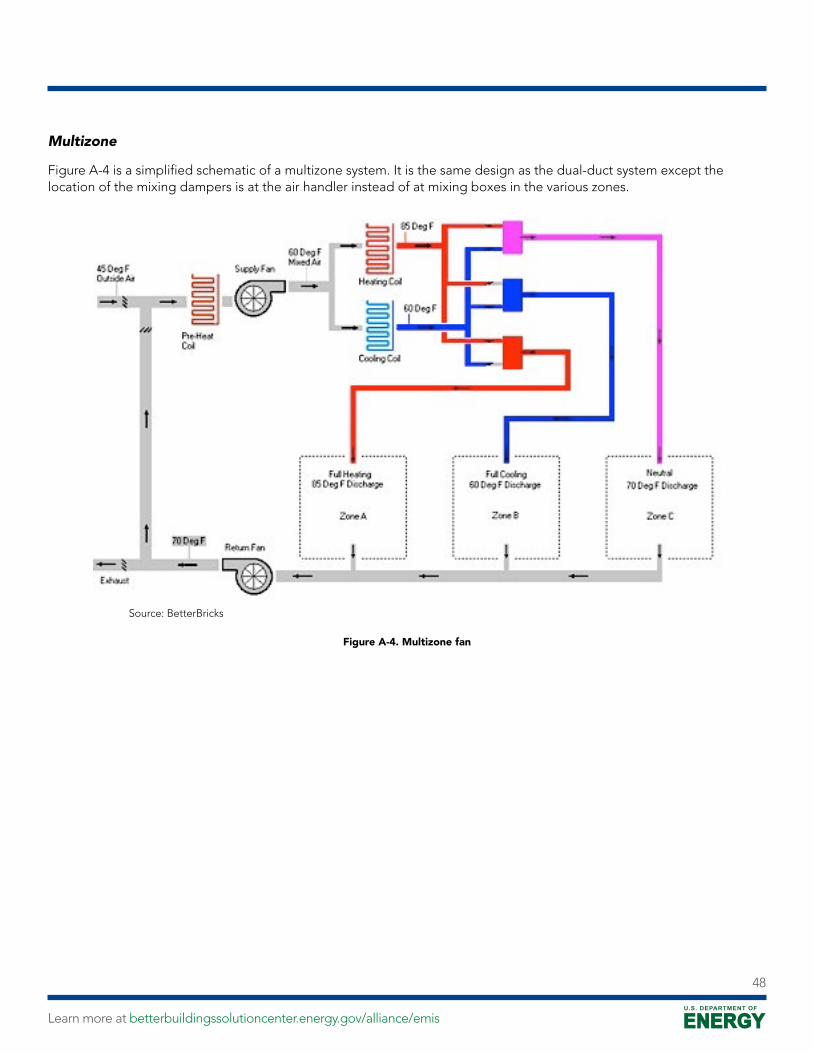
Multizone
Figure A-4 is a simplified schematic of a multizone system. It is the same design as the dual-duct system except the location of the mixing dampers is at the air handler instead of at mixing boxes in the various zones.
Source: BetterBricks
Figure A-4. Multizone fan
Learn more at betterbuildingssolutioncenter.energy.gov/alliance/emis
48

Endnotes1. Granderson, J., and G. Lin. 2016. “Building Energy Information Systems: Synthesis of Costs, Savings, and Best-practice Uses.” Energy Efficiency 9(6), 1369–
1384, DOI 10.1007/s12053-016-9428-9. Available from http://link.springer.com/article/10.1007/s12053-016-9428-9. (Last accessed 10/5/2016.)2. Granderson, J., et al. Energy Information Handbook: Applications for Energy Efficiency Building Operations. CreateSpace, 2013, ISBN
1480178276/9781480178274; LBNL Report No. LBNL-5272E. Available at: http://eis.lbl.gov/downloads/energy-information-handbook.pdf. (Last accessed 10/5/2016.)
3. Granderson, J., et al. User Guide: OpenEIS Reference Code. Available at: http://eis.lbl.gov/openeis.html. (Last accessed 10/5/2016.)4. Parker, SA, et al. Metering Best Practices: A Guide to Achieving Utility Resource Efficiency, Federal Energy Management Program, U.S. Department of Energy,
2015. Available at: http://energy.gov/sites/prod/files/2015/04/f21/mbpg2015.pdf. (Last accessed 10/5/2016.)5. Building Re-tuning Training Guidelines. Available at: http://buildingretuning.pnnl.gov/retuning_measures.stm. (Last accessed 12/5/2016.)6. BetterBricks. Common Opportunities: The Top Five. Available at: http://betterbricks.com/articles/common-opportunities-top-five. (Last accessed 10/5/2016.)7. Roth, K, Llana, P, Westphalen, D, Broderick, J. “Automated whole building diagnostics.” ASHRAE Journal Vol. 47, No. 5, May 2005, 82-84.8. Katipamula, S, Brambley, M. 2005. “Methods for fault detection, diagnostics, and prognostics for building systems – a review, part 1.” HVAC&R Research 11(1):
3-25.9. Fernandez, N., S. Katipamula, W. Wang, Y. Huang, and G. Liu. Energy Savings Modeling of Re-tuning Energy Conservation Measures in Large Office
Buildings. 2015. Pacific Northwest National Laboratory: Richland, Washington. Report No. PNNL-21569. Available at: http://buildingretuning.pnnl.gov/documents/pnnl_21569.pdf. (Last accessed 10/5/2016.)
10. US Environmental Protection Agency. ENERGY STAR Building Upgrade Manual. 2008. United States Environmental Protection Agency. Available at: https://www.energystar.gov/sites/default/files/buildings/tools/EPA_BUM_Full.pdf. (Last accessed 10/5/2016.)
11. Doty, S. P. 2009. “Simultaneous Heating and Cooling—The HVAC Blight.” Energy Engineering 106(2): 42–74.Available at: http://www.tandfonline.com/doi/abs/10.1080/01998590909509174 (Last accessed 10/5/2016.)
12. Wang, L., and T. Hong. 2013. Modeling and Simulation of HVAC Faulty Operations and Performance Degradation due to Maintenance Issues. Lawrence Berkeley National Laboratory: Berkeley, CA. Report No. LBNL-6129E. Available at: http://eetd.lbl.gov/sites/all/files/lbnl-6129e.pdf. (Last accessed 10/5/2016.)
13. US Environmental Protection Agency. ENERGY STAR data trends: Benchmarking and energy savings. US EPA, October 2012. Available at: https://www.energystar.gov/sites/default/files/buildings/tools/DataTrends_Savings_20121002.pdf. (Last accessed 1/9/2017.)
14. Fernandez, N., S. Katipamula, W. Wang, Y. Huang, and G. Liu. Energy Savings Modeling of Re-tuning Energy Conservation Measures in Large Office Buildings. 2015. Pacific Northwest National Laboratory: Richland, Washington. Report No. PNNL-21569. Available at: http://buildingretuning.pnnl.gov/documents/pnnl_21569.pdf. (Last accessed 10/5/2016.)
15. Building Re-Tuning Training Guide: Occupancy Scheduling: Night and Weekend Temperature Set back and Supply Fan Cycling during Unoccupied Hours. Pacific Northwest National Laboratory: Richland, WA. Report No. PNNL-SA-85194. Available at: http://www.pnl.gov/buildingretuning/documents/pnnl_sa_85194.pdf. (Last accessed 10/5/2016.)
16. US Environmental Protection Agency. ENERGY STAR Building Upgrade Manual. 2008. United States Environmental Protection Agency. Available at: https://www.energystar.gov/sites/default/files/buildings/tools/EPA_BUM_Full.pdf. (Last accessed 10/5/2016.)
17. Pacific Northwest National Laboratory. No date. Building Re-Tuning Training Guide: Air-Side Economizer Operation. Pacific Northwest National Laboratory: Richland, Washington. Report No. PNNL-SA-86706. Available at: http://buildingretuning.pnnl.gov/documents/pnnl_sa_86706.pdf. (Last accessed 10/5/2016.)
18. Doty, S. P. 2009. “Simultaneous Heating and Cooling—The HVAC Blight.” Energy Engineering 106(2): 42–74.Available at: http://www.tandfonline.com/doi/abs/10.1080/01998590909509174 (Last accessed 10/5/2016.)
19. To learn more about detailed “best of class” sequences of operation for HVAC system, consider ASHRAE proposed Guideline 36 - High Performance Sequences of Operation for HVAC Systems. Available at: http://gpc36.savemyenergy.com/ (Last accessed 2/28/2017.)
20. Fernandez, N., S. Katipamula, W. Wang, Y. Huang, and G. Liu. 2015. Energy savings modelling of re-tuning energy conservation measures in large office buildings. Pacific Northwest National Laboratory: Richland, WA. Report No. PNNL-21569. Available at: http://buildingretuning.pnnl.gov/documents/pnnl_21569.pdf. (Last accessed 10/5/2016.)
21. To learn more about detailed “best of class” sequences of operation for HVAC system, consider ASHRAE proposed Guideline 36 - High Performance Sequences of Operation for HVAC Systems. Available at: http://gpc36.savemyenergy.com/ (Last accessed 2/28/2017.)
22. Pacific Northwest National Laboratory. No date. Building retuning training guide: AHU static pressure control. Pacific Northwest National Laboratory: Richland, Washington. Report No. PNNL-SA-8418. Available at: http://buildingretuning.pnnl.gov/documents/pnnl_sa_84187.pdf. (Last accessed 10/5/2016.)
23. Wang, L., and T. Hong. 2013. Modeling and Simulation of HVAC Faulty Operations and Performance Degradation due to Maintenance Issues. Lawrence Berkeley National Laboratory: Berkeley, CA. Report No. LBNL-6129E. Available at: http://eetd.lbl.gov/sites/all/files/lbnl-6129e.pdf. (Last accessed 10/5/2016.)
24. Federal Energy Management Program. 2010. Operations & Maintenance Best Practices. Department of Energy. Available at: http://energy.gov/sites/prod/files/2013/10/f3/omguide_complete.pdf. (Last accessed 10/5/2016.)
25. Mills, E., and P. Mathew. 2009. Monitoring-based Commissioning: Benchmarking Analysis of 24 UC/CSU/IOU Projects. Lawrence Berkeley National Laboratory: Berkeley, California. Report No. LBNL 1972E. Available at: http://evanmills.lbl.gov/pubs/pdf/MBCx-LBNL.pdf. (Last accessed 10/5/2016.)
26. BetterBricks, Common Opportunities: The Top Five. Available at: http://betterbricks.com/articles/common-opportunities-top-five. (Last accessed 10/5/2016).
Learn more at betterbuildingssolutioncenter.energy.gov/alliance/emis
49

Learn more at betterbuildingssolutioncenter.energy.gov