Using Election Technology to Make Better Decisions · Using Election Technology to Make Better...
79
Using Election Technology to Make Better Decisions: The Case of Precinct Wait Times Charles Stewart III MIT NCSL Conference on The Future of Elections: Technology Policy and Funding June 15, 2017
Transcript of Using Election Technology to Make Better Decisions · Using Election Technology to Make Better...
Using Election Technology to Make Better Decisions:
The Case of Precinct Wait TimesCharles Stewart III
MIT
NCSL Conference on The Future of Elections: Technology Policy and Funding
June 15, 2017


And by the way, we
have to fix that


DC
FL
GA
LA
MD
MI
OK
SC
VT
VA
DC
GA
IN
MD
OK
SC
UT
VT
0
10
20
30
40
50
Avg
. m
inu
tes w
aitin
g
Nationwide avg.:13 min.

Wait times by mode of voting

Wait times by mode of voting
•Early voting: 11 min.

Wait times by mode of voting
•Early voting: 11 min.
•Election-Day voting: 14 min.

Wait times by race

Wait times by race
•Whites: 11 min.

Wait times by race
•Whites: 11 min.
•Blacks: 20 min.

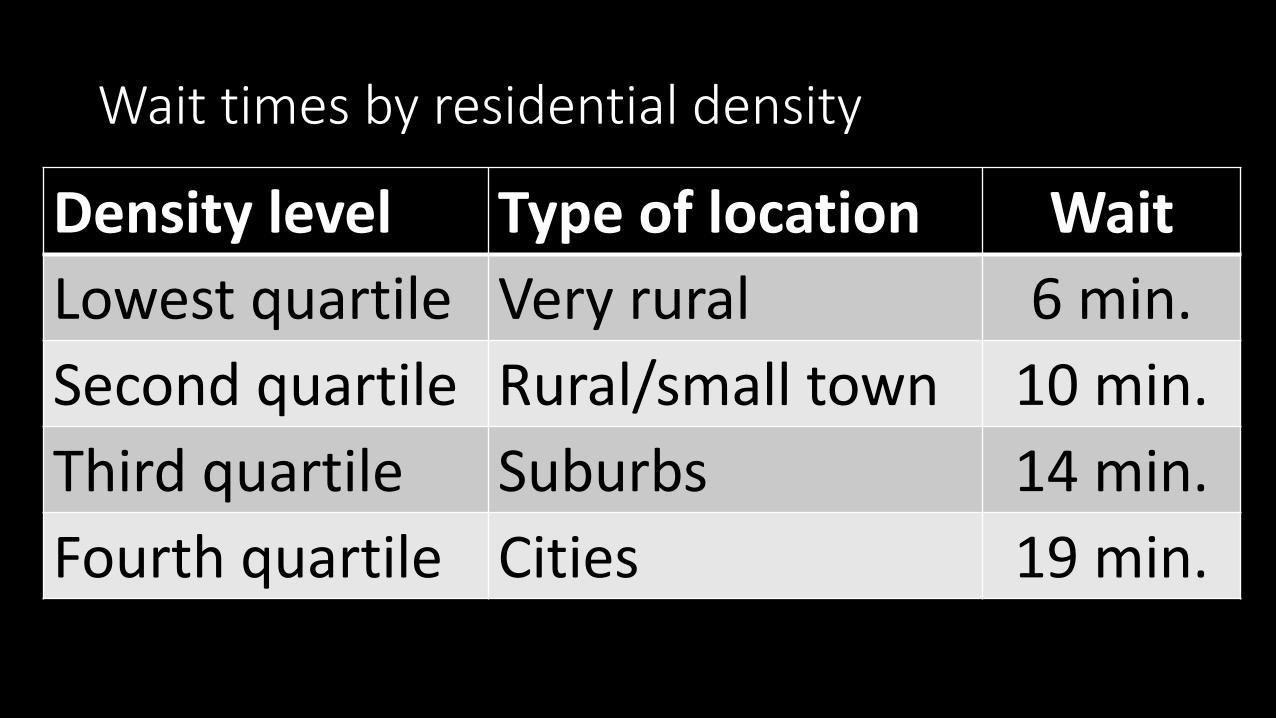
Wait times by residential density
Density level Type of location Wait
Lowest quartile Very rural 6 min.
Second quartile Rural/small town 10 min.
Third quartile Suburbs 14 min.
Fourth quartile Cities 19 min.

Wait times by residential density
Density level Type of location Wait
Lowest quartile Very rural 6 min.
Second quartile Rural/small town 10 min.
Third quartile Suburbs 14 min.
Fourth quartile Cities 19 min.

Wait times by residential density
Density level Type of location Wait
Lowest quartile Very rural 6 min.
Second quartile Rural/small town 10 min.
Third quartile Suburbs 14 min.
Fourth quartile Cities 19 min.

Wait times by residential density
Density level Type of location Wait
Lowest quartile Very rural 6 min.
Second quartile Rural/small town 10 min.
Third quartile Suburbs 14 min.
Fourth quartile Cities 19 min.
Wait times by residential density
Density level Type of location Wait
Lowest quartile Very rural 6 min.
Second quartile Rural/small town 10 min.
Third quartile Suburbs 14 min.
Fourth quartile Cities 19 min.

DC
FL
GA
LA
MD
MI
OK
SC
VT
VA
DC
GA
IN
MD
OK
SC
UT
VT
0
10
20
30
40
50
Avg
. m
inu
tes w
aitin
g
2012
Nationwide avg.:13 min.

DC
FL
GA
LA
MD
MI
OK
SC
VT
VA
DC
GA
IN
MD
OK
SC
UT
VT
0
10
20
30
40
50
Avg
. m
inu
tes w
aitin
g
2012 2016
Nationwide avg.:13 min.
Nationwide avg.:11 min.


PCEA Report, p. 39

The Planning Cycle of Elections
Election Implementation
Assess
Plan

The Planning Cycle of Elections
Election Implementation
Assess
Plan

The Planning Cycle of Elections
Election Implementation
Assess
Plan

The Planning Cycle of Elections
Election Implementation
Assess
Plan

Planning
Election Implementation
Assess
Plan

Planning
•What you need to know, in order to implement the most basic model in queuing theory (the M/M/c model)

Planning
•What you need to know, in order to implement the most basic model in queuing theory (the M/M/c model)•Arrival rate of voters

Planning
•What you need to know, in order to implement the most basic model in queuing theory (the M/M/c model)•Arrival rate of voters•Number of service locations (poll books, scanners,
voting machines, etc.)

Planning
•What you need to know, in order to implement the most basic model in queuing theory (the M/M/c model)•Arrival rate of voters•Number of service locations (poll books, scanners,
voting machines, etc.)• Service times (how long it takes to check in, scan a
ballot, cast a ballot, etc.)
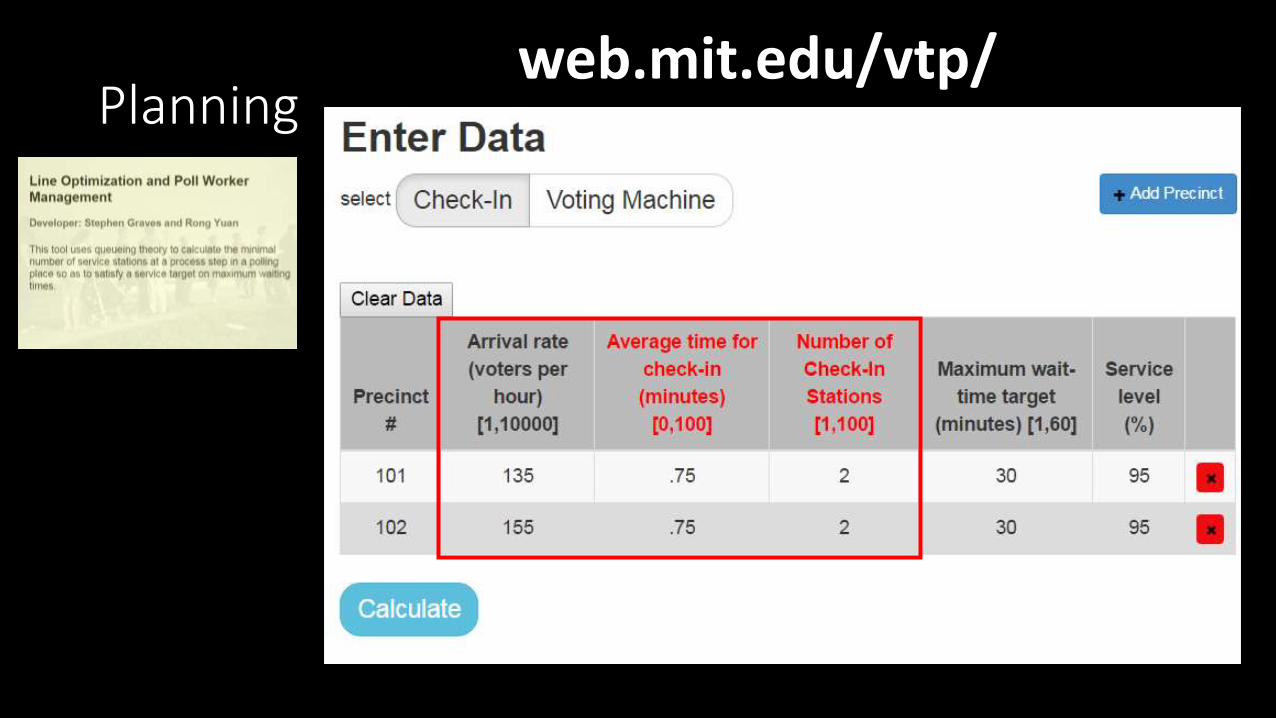
Planningweb.mit.edu/vtp/
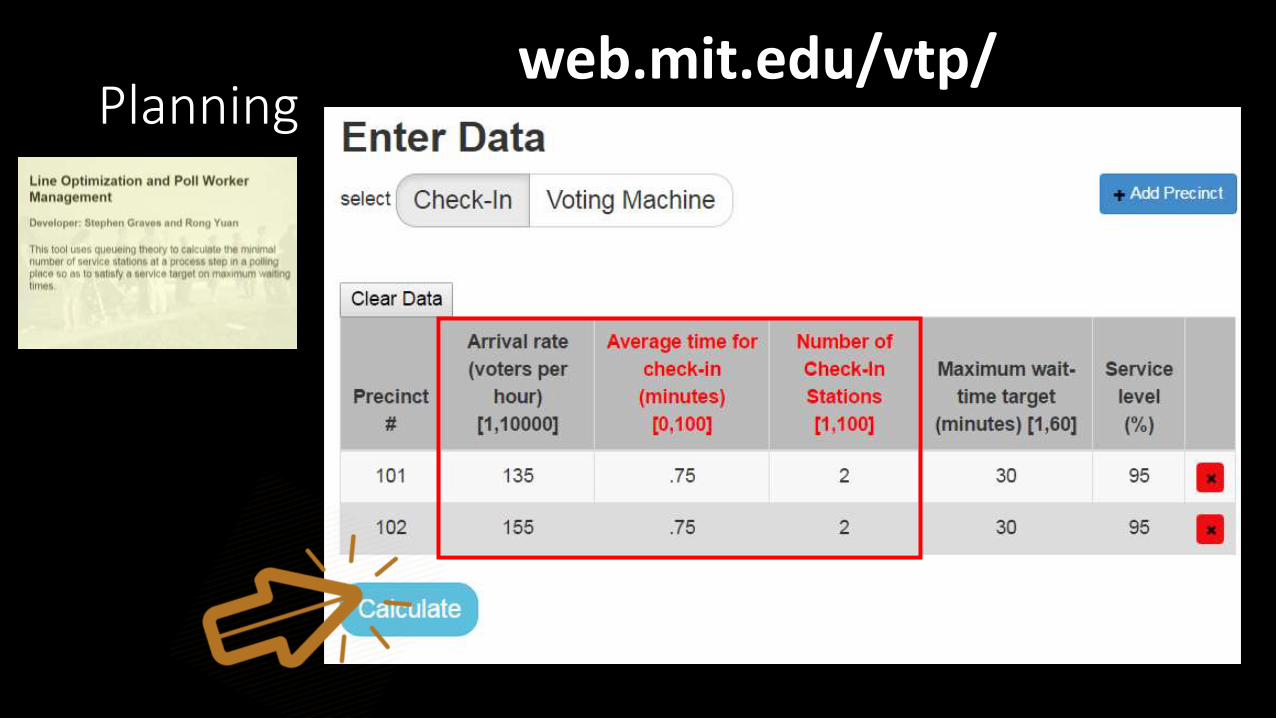
Planningweb.mit.edu/vtp/

Planningweb.mit.edu/vtp/

Planningweb.mit.edu/vtp/
?


Assessing: Measuring Wait Times Post-Election
Election Implementation
Assess
Plan

Little’s Law
𝐿 = 𝜆𝑊
(Long term average) Length of queue (Long term) Average wait time
(Long term) Arrival rate


Little’s Law
𝐿 = 𝜆𝑊
(Long term average) Length of queue (Long term) Average wait time
(Long term) Arrival rate

𝑊 =𝐿
𝜆Average wait time
Average queue length
Average arrival rate
Little’s Law

𝑊 =𝐿
𝜆Average wait time
Average queue length
Average arrival rate
Little’s Law
In-person votes for the dayhours the polls are open

𝑊 =𝐿
𝜆Average wait time
Average queue length
Average arrival rate
Little’s LawThis needs to be measured


0
1
2
3
Norm
aliz
ed
ch
eck in
s
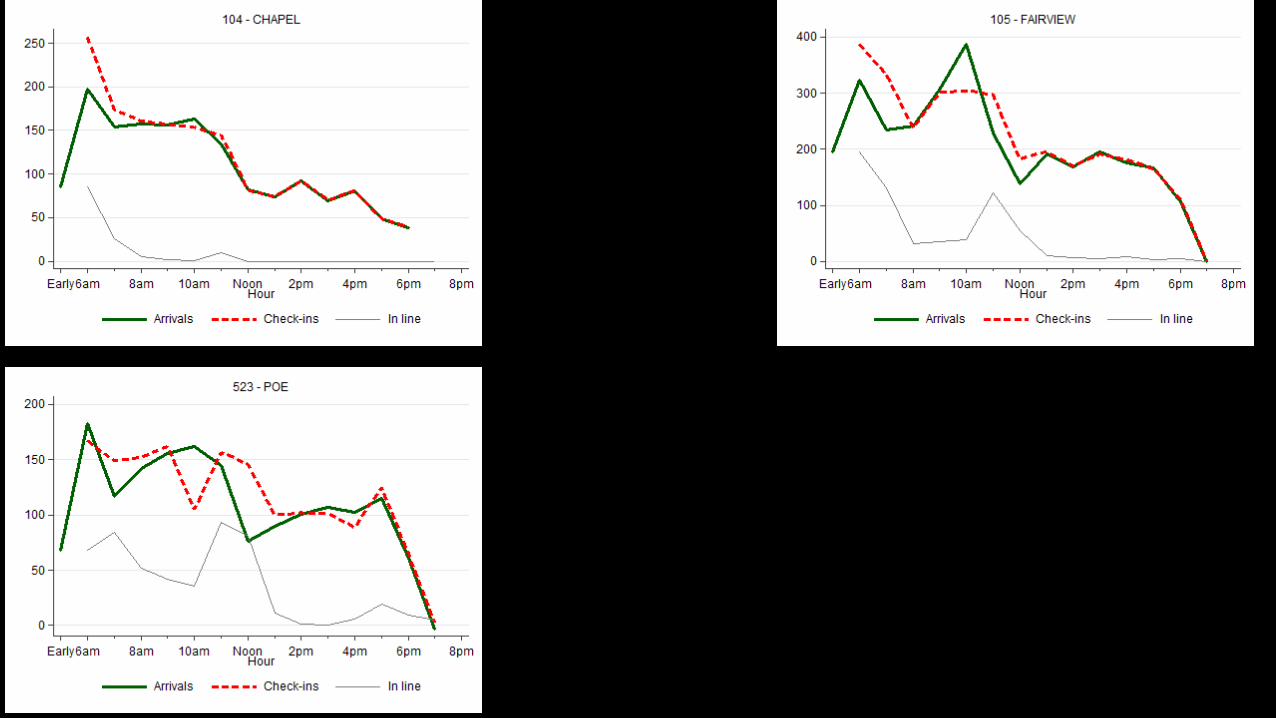
Early6am 8am 10am Noon 2pm 4pm 6pm 8pmHour
Data Average by hour
Normalized check ins

0
.5
1
1.5
2
Norm
aliz
ed
inlin
e
Early6am 8am 10am Noon 2pm 4pm 6pm 8pmHour
Data Average by hour
Normalized in line

-1
0
1
2
3
Norm
aliz
ed
arr
iva
ls
Early6am 8am 10am Noon 2pm 4pm 6pm 8pmHour
Data Average by hour
Normalized arrivals

Final thoughts
• Polling places are the hardest part of the election experience to optimize
• Improving the polling place experience requires election officials to find ways to extract management data from polling places
• Extracting the data requires rethinking some management practices and leveraging technology
• Improvements in wait times demonstrates that small changes to management practices and managing-by-data can work
Charles Stewart III
• @cstewartiii
• Election Updates
– electionupdates.caltech.edu