
Integrative EEG biomarkers predict progression to Alzheimer's ...

122 TELICOM XXX.5 — Fourth Quarter 2018
The measurement of general intelligence and aspects of cognitive performance using standardized tests have a long pedigree going back over 100 years. Indeed, intelligence testing has been described as possibly the greatest success story of psychology. However, only recently has brain imaging reached a level of technological sophistication where neuroscientists can start to tackle the vastly complex challenge of determining how intelligence arises in the brain. Locating the neural underpinnings of intelligence is now a major goal for modern intelligence research.
This article seeks to explain, for the benefi t of the non-expert, the rationale, methods, and fi ndings of a research study I conducted for my BSc. My motivation for taking a degree in cognitive neuroscience in the fi rst place was driven by my longstanding interest in what underpins human intelligence and special abilities and, in particular, extremely high intelligence. Surprisingly, there was no part of the cognitive neuroscience curriculum or, indeed, any part of the psychology department
curriculum dealing specifi cally with intelligence, psychometric testing, individual diff erences, or diff erential psychology. However, since these topics had long been a personal interest of mine, I had covered them extensively through my private reading. And, although on the course we had had introductory lectures on electroencephalogram (EEG) and neuroimaging as part of the general neuroscientifi c research-methods toolbox, most of my knowledge about EEG came from private workshops that I had actually started attending several years before starting the degree. When I had to choose a fi nal-year research project, combining my interests in EEG and intelligence seemed like a fun thing to do.
The genesis of my research study was the intriguing claim by two US neurofeedback experts, Thatcher and Lubar, that they had identifi ed various EEG measurements which showed a clear statistical relationship with children’s and adults’ full-scale IQs (see Figure 1).1
Using EEG to Predict IQ by Gwyneth Rolph, BSc (Hons) Cognitive Neuroscience, ASPE
Figure 1: Correlations between qEEG measures and full-scale IQ. Adapted from Thatcher and Lubar (2009).2
123 TELICOM XXX.5 — Fourth Quarter 2018
At the time of that publication (2009), their “NeuroGuide” database contained EEG, psychometric, educational, and medical data from 332 individuals, which the authors had collected to produce a “normal” reference sample against which neurofeedback training protocols could be designed.
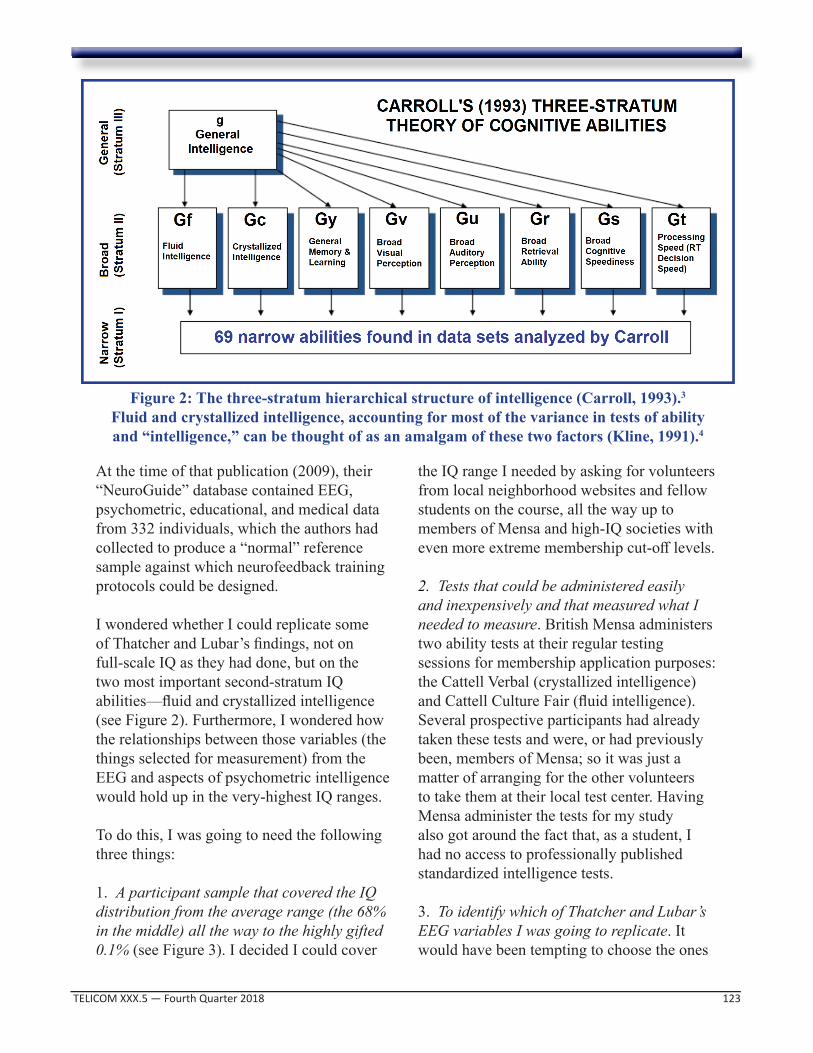
I wondered whether I could replicate some of Thatcher and Lubar’s fi ndings, not on full-scale IQ as they had done, but on the two most important second-stratum IQ abilities—fl uid and crystallized intelligence (see Figure 2). Furthermore, I wondered how the relationships between those variables (the things selected for measurement) from the EEG and aspects of psychometric intelligence would hold up in the very-highest IQ ranges.
To do this, I was going to need the following three things:
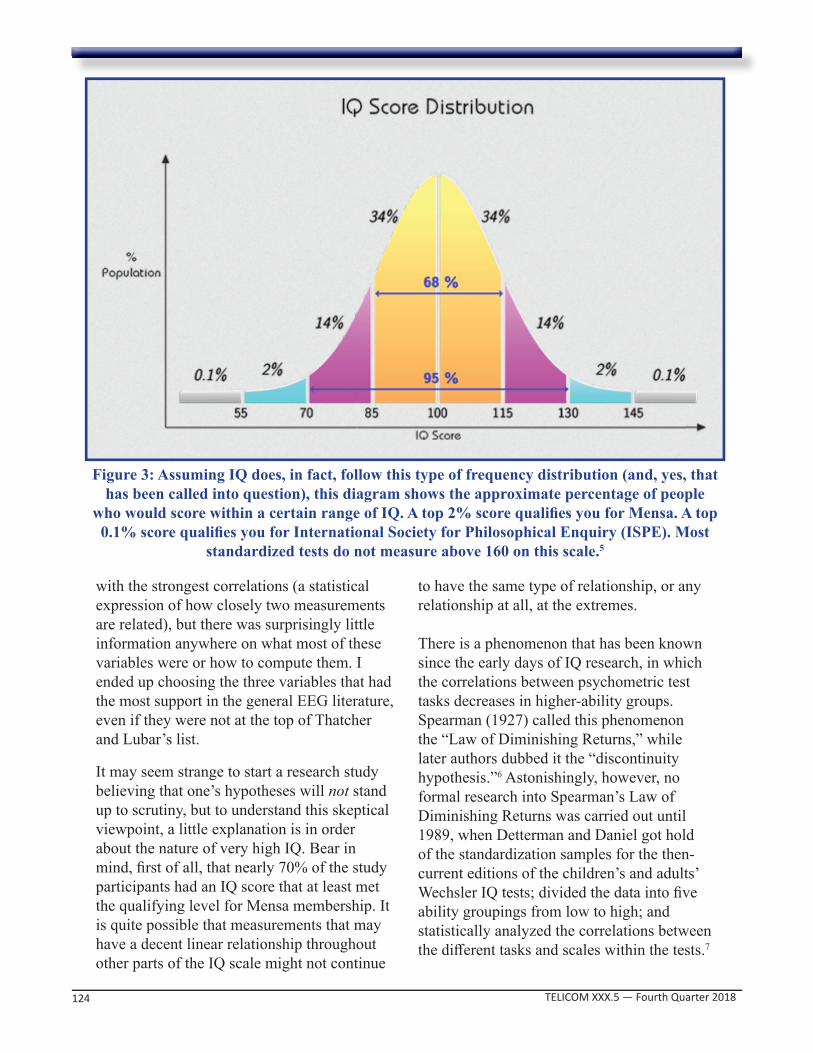
1. A participant sample that covered the IQ distribution from the average range (the 68% in the middle) all the way to the highly gifted 0.1% (see Figure 3). I decided I could cover
the IQ range I needed by asking for volunteers from local neighborhood websites and fellow students on the course, all the way up to members of Mensa and high-IQ societies with even more extreme membership cut-off levels.
2. Tests that could be administered easily and inexpensively and that measured what I needed to measure. British Mensa administers two ability tests at their regular testing sessions for membership application purposes: the Cattell Verbal (crystallized intelligence) and Cattell Culture Fair (fl uid intelligence). Several prospective participants had already taken these tests and were, or had previously been, members of Mensa; so it was just a matter of arranging for the other volunteers to take them at their local test center. Having Mensa administer the tests for my study also got around the fact that, as a student, I had no access to professionally published standardized intelligence tests.
3. To identify which of Thatcher and Lubar’s EEG variables I was going to replicate. It would have been tempting to choose the ones
Figure 2: The three-stratum hierarchical structure of intelligence (Carroll, 1993).3
Fluid and crystallized intelligence, accounting for most of the variance in tests of ability and “intelligence,” can be thought of as an amalgam of these two factors (Kline, 1991).4
124 TELICOM XXX.5 — Fourth Quarter 2018
with the strongest correlations (a statistical expression of how closely two measurements are related), but there was surprisingly little information anywhere on what most of these variables were or how to compute them. I ended up choosing the three variables that had the most support in the general EEG literature, even if they were not at the top of Thatcher and Lubar’s list.
It may seem strange to start a research study believing that one’s hypotheses will not stand up to scrutiny, but to understand this skeptical viewpoint, a little explanation is in order about the nature of very high IQ. Bear in mind, fi rst of all, that nearly 70% of the study participants had an IQ score that at least met the qualifying level for Mensa membership. It is quite possible that measurements that may have a decent linear relationship throughout other parts of the IQ scale might not continue
to have the same type of relationship, or any relationship at all, at the extremes.
There is a phenomenon that has been known since the early days of IQ research, in which the correlations between psychometric test tasks decreases in higher-ability groups. Spearman (1927) called this phenomenon the “Law of Diminishing Returns,” while later authors dubbed it the “discontinuity hypothesis.”6 Astonishingly, however, no formal research into Spearman’s Law of Diminishing Returns was carried out until 1989, when Detterman and Daniel got hold of the standardization samples for the then-current editions of the children’s and adults’ Wechsler IQ tests; divided the data into fi ve ability groupings from low to high; and statistically analyzed the correlations between the diff erent tasks and scales within the tests.7
Figure 3: Assuming IQ does, in fact, follow this type of frequency distribution (and, yes, that has been called into question), this diagram shows the approximate percentage of people
who would score within a certain range of IQ. A top 2% score qualifi es you for Mensa. A top 0.1% score qualifi es you for International Society for Philosophical Enquiry (ISPE). Most
standardized tests do not measure above 160 on this scale.5

125 TELICOM XXX.5 — Fourth Quarter 2018
Their fi ndings confi rmed the observations of the early IQ researchers: poor performers on one type of psychometric task tend to perform almost equally poorly on all of them, leading to high correlations between the tasks among that ability group. On the other hand, high performers tend to possess a much more uneven spread of scores between the Wechsler sub-scales, leading to much lower correlations between the various types of tasks.
This fi nding presents an anomaly for high-IQ research: does Spearman’s g, or the general intelligence factor, exist in the high range? In a 2002 interview with members of the Mega Foundation, one of the super-elite high-IQ groups, intelligence researcher Arthur Jensen suggested that there is a point, possibly around IQ 160, where the statistical relationships between performances on diff erent types of IQ tasks break down altogether.8 It may still be possible to measure the intelligence of the very highest performers using psychometric tests if a suffi ciently robust standardization sample in those extreme ranges could be assembled, but their intelligence might possibly be better represented by more specifi c measures of ability (Stratum I or II) in Carroll’s three-stratum model. In any case, the priority for my own ongoing research will be to assemble a suffi ciently large database of both very high scorers and those closer to the center of the IQ distribution in order to render meaningful statistical analysis.
Neural Theories of Intelligence
Attempts to investigate intelligence through biological, rather than psychometric, means have an interesting history. In the late nineteenth century, Sir Francis Galton made the fi rst attempt to measure intelligence quantitatively, through a series of “elementary cognitive tasks” that measured such things as grip strength and visual acuity (Jensen, 1980).9 Although Galton’s methods lacked
validity, they inspired much follow-up research. Paradigms such as reaction time and inspection time, which were rooted in his original ideas, were in use well into the twentieth century. The increasing availability of neuroimaging for research, however, led to largely abandoning eff orts to link such basic sensorimotor tasks to intelligence.
The appearance of PET (positron emission tomography) in the 1980s, and then later fMRI (functional magnetic resonance imaging), began to give researchers the ability to directly observe activity associated with information processing in the brain. Arising from these early imaging studies, some tentative theories started to appear regarding the cognitive neuroscience of intelligence. The best-supported theory regarding the neural basis of intelligence is the Parieto-Frontal Integration Theory of intelligence, or P-FIT (Jung & Haier, 2007).10
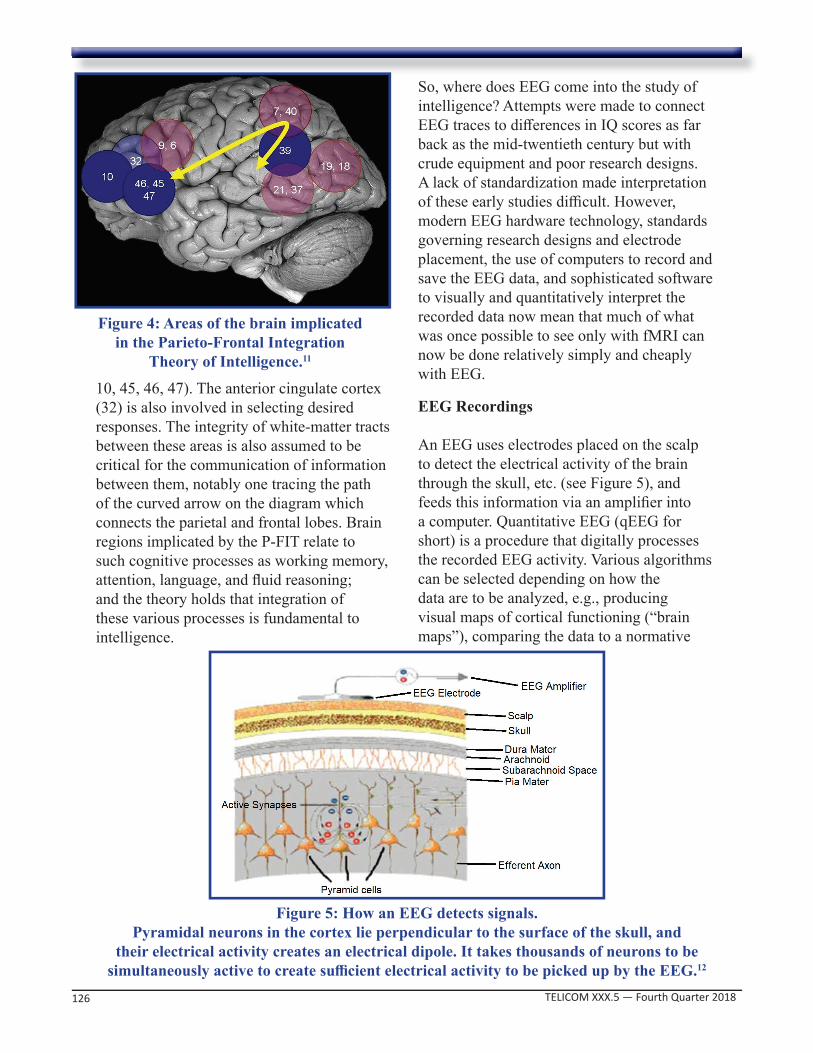
The P-FIT was based on a review of 37 neuroimaging studies which the authors drew upon to propose how intelligence-related information is processed in the brain. Neuroimaging studies tend to refer to brain regions by means of a numbering system called Brodmann’s Areas, named after the early twentieth-century neuroanatomist who fi rst identifi ed them. Jung and Haier realized that, in the majority of studies they reviewed, broadly similar Brodmann’s Areas were repeatedly implicated (see Figure 4) and that information appeared to travel through this brain network in the following sequence.Firstly, information entering through the senses is perceived in the visual cortex, or occipital lobe, at the back of the brain (areas 18 and 19 on the diagram), and in the auditory cortex in the temporal lobes (21, 37). This sensory information undergoes more elaborateprocessing in the parietal lobe (7, 39, 40) and is subsequently fed forward to the frontal cortex for decision making and analysis (6, 9,
126 TELICOM XXX.5 — Fourth Quarter 2018
10, 45, 46, 47). The anterior cingulate cortex (32) is also involved in selecting desired responses. The integrity of white-matter tracts between these areas is also assumed to be critical for the communication of information between them, notably one tracing the path of the curved arrow on the diagram which connects the parietal and frontal lobes. Brain regions implicated by the P-FIT relate to such cognitive processes as working memory, attention, language, and fl uid reasoning; and the theory holds that integration of these various processes is fundamental to intelligence.
So, where does EEG come into the study of intelligence? Attempts were made to connect EEG traces to diff erences in IQ scores as far back as the mid-twentieth century but with crude equipment and poor research designs. A lack of standardization made interpretation of these early studies diffi cult. However, modern EEG hardware technology, standards governing research designs and electrode placement, the use of computers to record and save the EEG data, and sophisticated software to visually and quantitatively interpret the recorded data now mean that much of what was once possible to see only with fMRI can now be done relatively simply and cheaply with EEG.
EEG Recordings
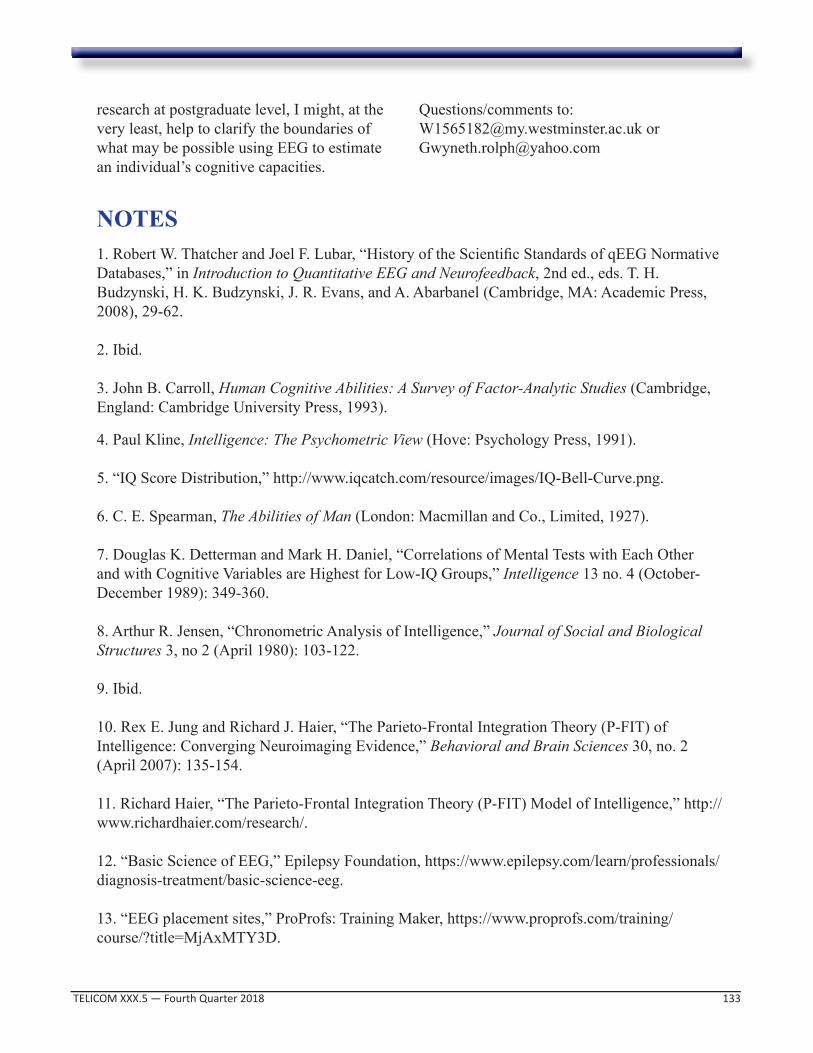
An EEG uses electrodes placed on the scalp to detect the electrical activity of the brain through the skull, etc. (see Figure 5), and feeds this information via an amplifi er into a computer. Quantitative EEG (qEEG for short) is a procedure that digitally processes the recorded EEG activity. Various algorithms can be selected depending on how the data are to be analyzed, e.g., producing visual maps of cortical functioning (“brain maps”), comparing the data to a normative
Figure 4: Areas of the brain implicated in the Parieto-Frontal Integration
Theory of Intelligence.11
Figure 5: How an EEG detects signals. Pyramidal neurons in the cortex lie perpendicular to the surface of the skull, and
their electrical activity creates an electrical dipole. It takes thousands of neurons to be simultaneously active to create suffi cient electrical activity to be picked up by the EEG.12

127 TELICOM XXX.5 — Fourth Quarter 2018
database containing reference values (such as Thatcher and Lubar’s “NeuroGuide” database, mentioned earlier), or exporting numerical data for statistical analysis in research.
EEG sensors are placed according to a standard pattern called the International 1020 system, although it is common nowadays to use an elasticated fabric cap with inbuilt electrodes already positioned. The use of a 19-electrode arrangement, or montage, is now fairly standard for most clinical, and many research, applications. Figure 6 shows the labels for the electrode sites, the various areas on the scalp being designated as frontal pole, frontal, central, temporal, parietal and occipital. By convention, the numbered sites on the left are odd-numbered while the corresponding ones on the right are even-numbered, with Z designating the midline.
Data are recorded simultaneously from all 19 channels and recorded on a laptop using specialist EEG software. Each electrode corresponds to one channel of EEG, and
Figure 6: EEG electrode placement sites.13
once recording starts, you see 19 wavy lines going across the computer screen (see Figure 7).
A standard recording typically consists of several minutes of resting-state EEG in both eyes-closed and eyes-open conditions to record the
Figure 7: Screenshot of the author’s EEG. Each channel on the central diagram corresponds to one wavy line of EEG, each of which is labeled on the left-hand side of the screen. The red spiky
line is the heart beat, and the thin blue line near the bottom of the screen is the respiration.

128 TELICOM XXX.5 — Fourth Quarter 2018
individual’s general brain functioning and a 20-minute continuous-performance task to assess attention and decision making. It is also common to record other physiological data at the same time, such as heart rate and respiration, to get a sense of the individual’s autonomic nervous system functioning.
Once the recording is complete and unwanted body motions (“artifacts”) have been removed, special software algorithms can then be used to analyze the data. How the data are analyzed will depend on what the clinician or researcher is looking for. A neurologist may be primarily interested in signs of epileptic seizures, while a clinical neuropsychologist who uses neurofeedback to devise a training plan may be interested in how the EEGs of patients with conditions such as ADHD or trauma vary from a norm database. For my research study, I was interested to see how the EEGs of participants of varying IQ levels compared to one another. To do this, I selected the three variables from Thatcher and Lubar’s study that were the best supported by other
EEG research literature: individual alpha peak frequency, alpha power, and coherence.
Individual Alpha Peak Frequency
EEG is o� en referred to in terms of ranges of frequencies, with delta being the slowest and gamma being the fastest (see Figure 8). � e exact boundaries between these frequency bands are somewhat arbitrary, but the names serve as a useful “shorthand.”
Individual alpha peak frequency (often just called the “alpha peak” or “peak frequency,” as it is labeled on the right-hand side of Thatcher and Lubar’s histogram) is the frequency with the strongest power in the EEG spectrum, which occurs in the 7.5 to 12.5 Hz frequency band (Klimesch, 1999).15
The alpha peak of most healthy adults will usually lie somewhere between 9.5 and 11.5 Hz and often shows as a very dominant peak of alpha frequency at one or both of the occipital electrodes, O1 and O2. You can quite clearly see the alpha peak at both of those locations in the frequency spectra chart shown in Figure 9.
Individual alpha peak frequency refl ects both state (in the moment) and trait (one’s typical characteristic) levels of overall cortical arousal (Anokhin & Vogel, 1996) and can refl ect sympathetic arousal, or “fi ght or fl ight,” which would obviously show up in the brain as well as in the heart and breathing rate.16 However, research has also shown that higher alpha-peak frequencies also correspond to higher IQ scores. What I needed to do was to tease the two apart.
Because we had also recorded the heart and respiration rates as part of the EEG recording session, it was possible to use these data to compute a measurement known as heart rate variability (HRV), which is a sign of healthy autonomic nervous system function and means that the individual is able to cope Figure 8: EEG frequency bands.14

129 TELICOM XXX.5 — Fourth Quarter 2018
well with stressors. This enabled me to use a statistical technique known as a partial correlation to control for HRV scores as a measurement of physiological arousal, with the assumption that what would be left over would be the part of the alpha peak data that corresponded with IQ.
EEG Power
There are two ways of considering the power or amplitude of the frequencies in an EEG recording. Absolute EEG power is the magnitude of the EEG frequencies of interest, measured in uV2, or microvolts squared (Thatcher and Lubar’s third right variable). However, absolute EEG power decreases with age, not least because the skull thickens as one matures. To compensate for the varying ages of my participants, therefore, I used a slightly diff erent measurement of EEG power: relative power. Relative power is the power of a given frequency band or range (e.g., the yellow alpha in Figure 9) expressed as a percentage of the power of the total EEG signal (all the colored bands). Most studies I found which examined EEG power in relation to IQ
showed that the alpha band correlated most closely with IQ.
Coherence
The third EEG variable I had selected was coherence (second left on Thatcher and Lubar’s histogram). Coherence measures the similarity of simultaneous EEG activity between two points, or sensor locations, and is understood as a measure of connectivity between brain regions. In quantitative EEG terms, this is expressed as a correlation, with unusually low values indicating hypo-coherence and unusually high values indicating hyper-coherence. Large deviations either way from the normal coherence range can suggest less-than-optimal functioning.
It is possible to map coherence between all or any pair of electrodes in any selected frequency band or range. I did not attempt to analyze every individual frequency or frequency band, due to their number and complexity, but focused on high alpha (10-12 Hz), which, according to prior literature, seemed to be the frequency band most
Figure 9: Frequency spectra showing the alpha peak.

130 TELICOM XXX.5 — Fourth Quarter 2018
associated with IQ. Furthermore, rather than analyze all 171 possible pairings, I had to limit my choice to a few which would make sense in terms of the main brain networks involved in intelligence. How did I choose which pairs to use? P-FIT!
The theory assumes that information fl ows from the parietal to the frontal lobes. Hence, to examine the back-to-front connectivity in each hemisphere, I performed my analysis on the coherence between electrodes P3-Fp1 on the left, and P4-Fp2 on the right.
I did not fi nd any statistically signifi cant relationships between these three variables, either when analyzed as separate correlations or together as a multiple-regression analysis. This is most likely because I ended up with a sample size of only 25 participants, meaning that the study was very under-powered. However, there is another possible interpretation for the lack of a signifi cant fi nding. Remember that nearly 70% of my
sample had an IQ within the top 2% of the population. According to Thatcher et al. (2016), high-IQ individuals may have diff erent patterns of activations between short-range brain networks and long-range connections.18 High-performance brains may be more effi cient because they are more modular—it would be less effi cient for large networks to be active and consuming energy all at once when more local networks can take care of it. In other words, the brains of high-IQ individuals are more specialized. How and, indeed, if that is connected in any way with the uneven psychometric profi les seen in this population is an area for future research.
Event-Related Potentials
Event-related potentials, or ERPs, are electrophysiological responses resulting from the presentation of sensory, cognitive, or motor tasks. As part of the EEG sessions, ERPs were recorded while administering a 20-minute visual continuous performance task
Figure 10: Coherence maps. The thicker the blue lines, the greater the hypo-coherence; the thicker the red lines, the greater the hyper-coherence between two electrode locations.17

131 TELICOM XXX.5 — Fourth Quarter 2018
(VCPT). Unfortunately, it was not possible to analyze the ERP data for my study due to timescale and word-count constraints. However, it may be interesting for a follow-up study to analyze ERP data.
The VCPT requires participants to click a mouse as quickly as possible after the presentation of one type of stimulus while refraining from clicking after other stimuli. There are four types of trials, 100 of each, consisting of pairs of pictures presented in a randomized order (see Figure 11).
If participants see an animal followed by an animal, that is the “Go” trial, and they must click as quickly as possible. Animal-plant is the “NoGo” trial (do not click), plant-plant is the “Ignore” trial (do not click), and plant-human is the novel stimulus trial, accompanied by a pure tone sound (do not click). It is trickier than it sounds, and even when the participant must not click, the brain is still active. In fact, it may actually be more diffi cult to inhibit oneself from clicking inappropriately!
Figure 12 shows the ERPs from the VCPT with each mini-diagram representing one EEG sensor location. Data from each type of trial are shown in a di� erent color. � e thin, vertical dotted lines represent the time points where the images were presented. It is possible to see the EEG potentials occurring right a� er the presentation of the stimuli. Some of the early EEG research suggested that faster ERP responses may be connected with a higher IQ, but other research has contradicted this.
Figure 11: Visual continuous performance task.19
Figure 12: Event-Related Potentials.20

132 TELICOM XXX.5 — Fourth Quarter 2018
Again, this is an area that would be interesting to follow up on and clarify using modern EEG equipment.
While it was not possible to analyze the ERP data in depth, I did examine the behavioral data from the VCPT, which includes the number of errors, the reaction time, and the reaction-time variability. As expected, being a generally high-ability sample, many participants made zero errors and tended to be faster and more consistent than the norms for their age group. However, there was a notable ceiling eff ect of performance on this task, which accords with other research I reviewed which suggested that processing speed may not correlate with cognitive “power” beyond a certain IQ level.
Can You Measure My IQ with EEG?
Exciting though the possibility sounds of measuring IQ directly through EEG or other forms of neuroimaging, the reader should regard the current state of research in the
fi eld with a healthy skepticism. The fi eld of psychometrics and diff erential psychology has decades of reliable research behind it, and it appears to be one of the few sub-disciplines in psychology not to have been hit by the recent replication crisis. On the other hand, the use of cognitive neuroscience techniques to study individual diff erences in intelligence is such a new discipline that I have seen only one other author besides myself (Deary, 2012) use the name I believe correctly describes such a venture: diff erential neuroscience.22 Furthermore, too many neuroimaging studies are under-powered and in need of replication. I believe that EEG and neuroimaging are still a very long way from replacing psychometrics with neurometrics. However, should “neurometric testing” become a dependable method anytime soon, I personally feel that an important goal for research should be to clarify whether extreme cognitive ability could be estimated neuroscientifi cally.
Clearly, the topic is ripe for research, and I now hope that if I am able to continue this
Figure 13: An estimate of a patient’s IQ derived from the patient’s EEG.21
133 TELICOM XXX.5 — Fourth Quarter 2018
research at postgraduate level, I might, at the very least, help to clarify the boundaries of what may be possible using EEG to estimate an individual’s cognitive capacities.
Questions/comments to:[email protected] or [email protected]
NOTES1. Robert W. Thatcher and Joel F. Lubar, “History of the Scientifi c Standards of qEEG Normative Databases,” in Introduction to Quantitative EEG and Neurofeedback, 2nd ed., eds. T. H. Budzynski, H. K. Budzynski, J. R. Evans, and A. Abarbanel (Cambridge, MA: Academic Press, 2008), 29-62.
2. Ibid.
3. John B. Carroll, Human Cognitive Abilities: A Survey of Factor-Analytic Studies (Cambridge, England: Cambridge University Press, 1993).
4. Paul Kline, Intelligence: The Psychometric View (Hove: Psychology Press, 1991).
5. “IQ Score Distribution,” http://www.iqcatch.com/resource/images/IQ-Bell-Curve.png.
6. C. E. Spearman, The Abilities of Man (London: Macmillan and Co., Limited, 1927).
7. Douglas K. Detterman and Mark H. Daniel, “Correlations of Mental Tests with Each Other and with Cognitive Variables are Highest for Low-IQ Groups,” Intelligence 13 no. 4 (October-December 1989): 349-360.
8. Arthur R. Jensen, “Chronometric Analysis of Intelligence,” Journal of Social and Biological Structures 3, no 2 (April 1980): 103-122.
9. Ibid.
10. Rex E. Jung and Richard J. Haier, “The Parieto-Frontal Integration Theory (P-FIT) of Intelligence: Converging Neuroimaging Evidence,” Behavioral and Brain Sciences 30, no. 2 (April 2007): 135-154.
11. Richard Haier, “The Parieto-Frontal Integration Theory (P-FIT) Model of Intelligence,” http://www.richardhaier.com/research/.
12. “Basic Science of EEG,” Epilepsy Foundation, https://www.epilepsy.com/learn/professionals/diagnosis-treatment/basic-science-eeg.
13. “EEG placement sites,” ProProfs: Training Maker, https://www.proprofs.com/training/course/?title=MjAxMTY3D.
134 TELICOM XXX.5 — Fourth Quarter 2018
14. “EEG frequency bands,” NeuroSky, http://neurosky.com/2015/05/greek-alphabet-soup-making-sense-of-eeg-bands/.
15. W. Klimesch, “EEG Alpha and Theta Oscillations Refl ect Cognitive and Memory Performance in Particular: A Review and Analysis,” Brain Research Reviews 29, no 2-3 (April 1999): 169-195.
16. Andrey Anokhin and Friedrich Vogel, “EEG Alpha Rhythm Frequency and Intelligence in Normal Adults,” Intelligence 23, no. 1 (July-August 1996): 1-14.
17. “Spectral Analysis & Brain Mapping: Coherence,” Mitsar Medical, http://www.mitsar-medical.com/eeg-software/qeeg-software/.
18. Robert Thatcher, E. Palmero-Soler, D. M. North, and C. J. Biver, “Intelligence and EEG Measures of Information Flow: Effi ciency and Homeostatic Neuroplasticity,” Scientifi c Reports 6, no 38890 (December 2016), https://doi.org/10.1038/srep38890.
19. “Mitsar-EEG ERP System,” Mitsar Medical, http://www.mitsar-medical.com/eeg-system/erp/.
20. “Event Related Potentials,” Mitsar Medical, http://www.mitsar-medical.com/download/manual/WinEEGEnglish_Ver2.11.pdf, 80.
21. “Predicted Neuropsychological Scores,” from sample report Quantitative EEG Analysis, Applied Neuroscience, Inc., November 10, 2010.
22. Ian J. Deary, “Intelligence,” Annual Review of Psychology 63 (January 2012): 453-482.
“It would be so nice if something made sense for a change.”—Alice in Lewis Carroll’s
Alice in Wonderland


![NSF Project EEG CIRCUIT DESIGN. Micro-Power EEG Acquisition SoC[10] Electrode circuit EEG sensing Interference.](https://static.fdocuments.net/doc/165x107/56649cfb5503460f949ccecd/nsf-project-eeg-circuit-design-micro-power-eeg-acquisition-soc10-electrode.jpg)