Using Dynamic Field Activities for On-Site Decision … Library/library/Subject...OSWER No....
205
Using Dynamic Field Activities for On-Site Decision Making: A Guide for Project Managers
Transcript of Using Dynamic Field Activities for On-Site Decision … Library/library/Subject...OSWER No....

Using Dynamic Field Activities for On-Site Decision Making:
A Guide for Project Managers


OSWER No. 9200.1-40EPA/540/R-03/002
May 2003www.epa.gov
Using Dynamic Field Activitiesfor On-Site Decision Making:A Guide for Project Managers
Office of Solid Waste and Emergency ResponseU.S. Environmental Protection Agency
Washington, DC 20460


iii
NOTICE
This document was developed with funding from the UnitedStates Environmental Protection Agency (EPA) underContract 68-W-02-033 and has been approved for publica-tion only after being subjected to the Agency’s reviewprocess.
The procedures set forth in this document are intended asguidance for employees of the EPA, states, and othergovernmental agencies. EPA officials may decide to followthe guidance provided in this document, or to act at variancewith it, based on analysis of site specific conditions. EPAalso reserves the right to modify this guidance at any timewithout public notice. Interested parties are free to raisequestions and objections about the substance of thisguidance and the appropriateness of the application of thisguidance to a particular situation. In addition, the Agencywelcomes public input on this document at any time.
This guidance does not constitute EPA rulemaking andcannot be relied upon to create any rights enforceable by anyparty in litigation with the United States.
Mention of trade names, products, or services does notconvey, and should not be interpreted as conveying, officialEPA approval, endorsement, or recommendation.


v
Acknowledgments
This document was developed by EPA’s Office of Solid Waste andEmergency Response with oversight and review provided by the U.S.Army Corps of Engineers and the following EPA programs:
Office of Administration and Resources ManagementOffice of Research and DevelopmentOffice of Air and RadiationOffice of General CounselOffice of Enforcement and Compliance AssuranceOffice of Environmental InformationRegion 1Region 2Region 3Region 4Region 5Region 6Region 7Region 8Region 9Region 10
Additional contributions and comments were provided by:
U.S. Air ForceU.S. NavyArgonne National LaboratoryPacific Northwest LaboratoryFlorida Department of Environmental ProtectionNew Jersey Department of Environmental ProtectionCalifornia Environmental Protection AgencyBoulding Soil-Water ConsultingEcology and Environment, Inc.Transglobal Environmental GeochemistryGary Struthers Associates, Inc.Tetra Tech NUS, Inc.


vii
Contents
Page
Exhibits . . . . . . . . . . . . . . . . . . . . . . . . . . . . . . . . . . . . . . . . . . . . . . . . . . xii
Abbreviations . . . . . . . . . . . . . . . . . . . . . . . . . . . . . . . . . . . . . . . . . . . . xiii
Chapter I: Introduction . . . . . . . . . . . . . . . . . . . . . . . . . . . . . . . . . . . I-1Purpose . . . . . . . . . . . . . . . . . . . . . . . . . . . . . . . . . . . . . . . . . . . I-1Intended Audience . . . . . . . . . . . . . . . . . . . . . . . . . . . . . . . . . . . I-1Scope and Limitations . . . . . . . . . . . . . . . . . . . . . . . . . . . . . . . . I-2How To Use This Guidance . . . . . . . . . . . . . . . . . . . . . . . . . . . . I-4
Chapter II: Overview of the On-Site Decision-Making Process . . . . . II-1Overview . . . . . . . . . . . . . . . . . . . . . . . . . . . . . . . . . . . . . . . . . . II-1Section 1: The On-Site Decision-Making Process . . . . . . . . . . II-3
Step 1: Using a Systematic Planning Process . . . . . . . . II-4Step 2: Preparing a Dynamic Work Plan . . . . . . . . . . . . II-4Step 3: Conducting a Dynamic Field Activity . . . . . . . . . II-5Step 4: Writing a Final Report . . . . . . . . . . . . . . . . . . . . II-6
Section 2: Applying Dynamic Field Activities to Contaminated Sites . . . . . . . . . . . . . . . . . . . . . . . . . . . . . II-7Characterization . . . . . . . . . . . . . . . . . . . . . . . . . . . . . . . II-7
Cost-Effective, Rapid, and Comprehensive SiteCharacterization . . . . . . . . . . . . . . . . . . . . . II-7
Integration of Characterization and RemedyEvaluation Tasks . . . . . . . . . . . . . . . . . . . . II-9
Smooth Transition to Subsequent RemediationActivities . . . . . . . . . . . . . . . . . . . . . . . . . . . II-9
Improving Risk Assessments . . . . . . . . . . . . . . . II-10Increasing Knowledge About Site
Conditions . . . . . . . . . . . . . . . . . . . II-10Including Risk Assessors in Field Decision
Making . . . . . . . . . . . . . . . . . . . . . II-10Cleanup . . . . . . . . . . . . . . . . . . . . . . . . . . . . . . . . . . . . . II-10
Optimize a Cleanup Technology . . . . . . . . . . . . II-11Confirm That Cleanup Objectives Have Been
Achieved . . . . . . . . . . . . . . . . . . . . . . . . . II-11Segregate Soil for Various Treatment Options . . II-11
Monitoring . . . . . . . . . . . . . . . . . . . . . . . . . . . . . . . . . . . II-12Initial Site Screening . . . . . . . . . . . . . . . . . . . . . . . . . . . II-12
Evaluating Several Potential Exposure Pathways or Sources Areas . . . . . . . . . . II-13
Planning Field Work at Sites with Known Class of Potential Contaminants . . . . . . . II-13
Linking Source Area to a Receptor . . . . . . . . . . . II-14

viii
Assessing Actual Human Health or Ecological Risk . . . . . . . . . . . . . . . . . . . . . . . . . . . . . II-14
Section 3: Special Considerations of Dynamic Field Activities II-15Additional Preparatory Planning . . . . . . . . . . . . . . . . . . II-15Contingency Budgeting . . . . . . . . . . . . . . . . . . . . . . . . . II-16Increased Agency Oversight . . . . . . . . . . . . . . . . . . . . . II-16Availability of Rapid Analytical Methods . . . . . . . . . . . . II-17Experienced Technical Staff . . . . . . . . . . . . . . . . . . . . . II-17
Conclusion . . . . . . . . . . . . . . . . . . . . . . . . . . . . . . . . . . . . . . . . II-18
Chapter III: Managing Dynamic Field Activities . . . . . . . . . . . . . . . . III-1Overview . . . . . . . . . . . . . . . . . . . . . . . . . . . . . . . . . . . . . . . . . III-1Section 1: Using Systematic Planning to Develop a
Dynamic Work Plan . . . . . . . . . . . . . . . . . . . . . . . . . . . . III-3Systematic Planning . . . . . . . . . . . . . . . . . . . . . . . . . . . III-3Dynamic Work Plan . . . . . . . . . . . . . . . . . . . . . . . . . . . . III-4
Oversight of Subcontractors . . . . . . . . . . . . . . . . III-7Documenting the Decision-Making Process . . . . III-7
Sampling and Analysis Plan . . . . . . . . . . . . . . . . . . . . . III-7Quality Assurance Project Plan . . . . . . . . . . . . . III-8
Contingency Procedures . . . . . . . . . . . . . III-8Decision-Making Procedures . . . . . . . . . . III-9Standard Operating Procedures . . . . . . . III-9Quality Control Samples . . . . . . . . . . . . III-10Field Laboratory Audits . . . . . . . . . . . . . III-10
Field Sampling Plan . . . . . . . . . . . . . . . . . . . . . III-11Contingency Planning . . . . . . . . . . . . . . III-11Decision-Making Procedures . . . . . . . . . III-13Standard Operating Procedures . . . . . . III-13
Data Management Plan . . . . . . . . . . . . . . . . . . III-14Communications Strategies . . . . . . . . . . III-14Data Summaries . . . . . . . . . . . . . . . . . . III-14Contingency Procedures . . . . . . . . . . . . III-16Data Format, Entry, and Display . . . . . . III-16
Community Involvement Plan . . . . . . . . . . . . . . . . . . . III-16Section 2: Determining Funding Needs . . . . . . . . . . . . . . . . III-18
Developing an Independent Cost Estimate . . . . . . . . . III-18Step 1: Estimate Minimum Work That Will Be
Needed . . . . . . . . . . . . . . . . . . . . . . . . . III-18Step 2: Develop Decision Trees . . . . . . . . . . . III-19Step 3: Develop List of Unit Costs . . . . . . . . . . III-19
Evaluating Field Analytical Equipment Needs . . . . . . . III-20Renting Analytical Equipment . . . . . . . . . . . . . . III-20Buying Analytical Equipment . . . . . . . . . . . . . . III-21Acquiring a Controlled Space . . . . . . . . . . . . . . III-21Acquiring a Qualified Analytical Equipment
Operator . . . . . . . . . . . . . . . . . . . . . . . . III-21
ix
Addressing Funding Limitations . . . . . . . . . . . . . . . . . III-22Section 3: Ensuring the Selection of Qualified Personnel . . . III-23
Planning Team Member Responsibilities and Qualifications . . . . . . . . . . . . . . . . . . . . . . . . . . III-24Technical Team Leader . . . . . . . . . . . . . . . . . . III-26Project Hydrogeologist/Geologist . . . . . . . . . . . III-26Project Chemist . . . . . . . . . . . . . . . . . . . . . . . . III-27Project Environmental Engineer . . . . . . . . . . . . III-27Project Geophysicist . . . . . . . . . . . . . . . . . . . . . III-27Project Risk Assessor (Human Health and/or
Ecological) . . . . . . . . . . . . . . . . . . . . . . III-28Project Statistician . . . . . . . . . . . . . . . . . . . . . . III-28Community Involvement Coordinator . . . . . . . . III-28Health and Safety Specialist . . . . . . . . . . . . . . . III-28Information Technology Specialist . . . . . . . . . . III-29Data Management Specialist . . . . . . . . . . . . . . III-29
Field Team Member Responsibilities and Qualifications III-29Field Analytical Equipment Operators . . . . . . . III-30Field Geologist . . . . . . . . . . . . . . . . . . . . . . . . . III-31Field Technician/Sampler . . . . . . . . . . . . . . . . . III-31Specialty Samplers . . . . . . . . . . . . . . . . . . . . . . III-31
Selecting Technical Specialty Firms . . . . . . . . . . . . . . III-31Section 4: Preparing and Overseeing the Field Work . . . . . . III-33
Organizing a Kick-Off Meeting . . . . . . . . . . . . . . . . . . III-33Obtaining Commitments for Technical Consultation . III-34
Oversight Teams . . . . . . . . . . . . . . . . . . . . . . . III-34Technical Review Teams . . . . . . . . . . . . . . . . . III-34
Developing Decision Points . . . . . . . . . . . . . . . . . . . . . III-35Establishing a Meeting Schedule . . . . . . . . . . . . . . . . III-35Preparing for Data Exchange . . . . . . . . . . . . . . . . . . . III-36
Data Required for Decision Making . . . . . . . . . III-36Data Transfer Schedule and Format . . . . . . . . III-37
Conclusion . . . . . . . . . . . . . . . . . . . . . . . . . . . . . . . . . . . . . . . III-38
Chapter IV: Key Considerations for Meeting Project Requirements withField-Based Analytical Methods . . . . . . . . . . . . . . . . . . . . . . . . IV-1Overview . . . . . . . . . . . . . . . . . . . . . . . . . . . . . . . . . . . . . . . . . IV-1Section 1: Selecting Field-Based Analytical Methods . . . . . . . IV-3
Principal Method Selection Process . . . . . . . . . . . . . . . IV-3Initial Method Selection Criteria . . . . . . . . . . . . . IV-5
Method Sensitivity . . . . . . . . . . . . . . . . . . IV-5Detection Limits . . . . . . . . . . . . . . IV-6Quantitation Limits . . . . . . . . . . . . IV-6
Method Selectivity . . . . . . . . . . . . . . . . . . IV-6Dynamic Range . . . . . . . . . . . . . . . . . . . . IV-7
Additional Measurement Performance Criteria . . IV-8Precision and Accuracy . . . . . . . . . . . . . . IV-8

x
Indirectly Measuring Target Compounds . IV-8Practical Considerations for Analysis in
the Field . . . . . . . . . . . . . . . . . . . . IV-9Method Applicability Studies . . . . . . . . . . . . . . . IV-10
Alternative Selection Strategies If Existing MethodsDo Not Meet Project Requirements . . . . . . . . . IV-11Altering Project Requirements . . . . . . . . . . . . . IV-11Modifying Existing Methods . . . . . . . . . . . . . . . IV-12Developing a New Method . . . . . . . . . . . . . . . . IV-12
Method Validation Studies . . . . . . . . . . . . . . . . . . . . . IV-13Section 2: Applying Quality Assurance and Quality Control to
Field-Based Analytical Methods . . . . . . . . . . . . . . . . . IV-14Quality Assurance . . . . . . . . . . . . . . . . . . . . . . . . . . . . IV-14
Establishing Quality Assurance Project Plans . IV-15Developing Standard Operating Procedures . . IV-15Evaluating the Type and Frequency of Quality
Assurance Audits . . . . . . . . . . . . . . . . . . IV-15Quality Control . . . . . . . . . . . . . . . . . . . . . . . . . . . . . . IV-16
Quality Control Sample Analysis . . . . . . . . . . . IV-16Evaluating “Confirmation” Analyses . . . . IV-17Selecting Split Samples . . . . . . . . . . . . . IV-19
Documenting Quality Control Results . . . . . . . . IV-19Data Review . . . . . . . . . . . . . . . . . . . . . . . . . . . IV-20
Section 3: Managing Data During a Dynamic Field Activity . IV-22Data Flowcharts . . . . . . . . . . . . . . . . . . . . . . . . . . . . . IV-22Data Management Readiness Review . . . . . . . . . . . . IV-25Document Review . . . . . . . . . . . . . . . . . . . . . . . . . . . . IV-25
Data Verification . . . . . . . . . . . . . . . . . . . . . . . . IV-25Data Validation . . . . . . . . . . . . . . . . . . . . . . . . . IV-26
Data Tracking Systems . . . . . . . . . . . . . . . . . . . . . . . . IV-26Document Control . . . . . . . . . . . . . . . . . . . . . . . . . . . . IV-27Data Visualization . . . . . . . . . . . . . . . . . . . . . . . . . . . . IV-27
Conclusion . . . . . . . . . . . . . . . . . . . . . . . . . . . . . . . . . . . . . . . IV-29
Chapter V: Dynamic Field Activity Case Study Summaries . . . . . . . . V-1Overview . . . . . . . . . . . . . . . . . . . . . . . . . . . . . . . . . . . . . . . . . . V-1Section 1: Soil and Groundwater Characterization, Marine Corps
Air Station Tustin . . . . . . . . . . . . . . . . . . . . . . . . . . . . . . . V-4Background . . . . . . . . . . . . . . . . . . . . . . . . . . . . . . . . . . . V-4Innovative Approach . . . . . . . . . . . . . . . . . . . . . . . . . . . . V-4Results . . . . . . . . . . . . . . . . . . . . . . . . . . . . . . . . . . . . . . V-6Lessons Learned . . . . . . . . . . . . . . . . . . . . . . . . . . . . . . . V-6
Section 2: Soil and Sediment Cleanup, Loring Air Force Base . V-7Background . . . . . . . . . . . . . . . . . . . . . . . . . . . . . . . . . . . V-7Innovative Approach . . . . . . . . . . . . . . . . . . . . . . . . . . . . V-7Results . . . . . . . . . . . . . . . . . . . . . . . . . . . . . . . . . . . . . . V-8Lessons Learned . . . . . . . . . . . . . . . . . . . . . . . . . . . . . . . V-8

xi
Section 3: Treatment System Optimization, Umatilla ChemicalDepot . . . . . . . . . . . . . . . . . . . . . . . . . . . . . . . . . . . . . . . V-10Background . . . . . . . . . . . . . . . . . . . . . . . . . . . . . . . . . . V-10Innovative Approach . . . . . . . . . . . . . . . . . . . . . . . . . . . V-11Results . . . . . . . . . . . . . . . . . . . . . . . . . . . . . . . . . . . . . V-11Lessons Learned . . . . . . . . . . . . . . . . . . . . . . . . . . . . . . V-11
Section 4: Innovative Dynamic Strategies During Initial SiteScreening . . . . . . . . . . . . . . . . . . . . . . . . . . . . . . . . . . . V-13B&M Laundromat, Escambia County, Florida . . . . . . . . V-13
Innovative Approach . . . . . . . . . . . . . . . . . . . . . . V-14Results . . . . . . . . . . . . . . . . . . . . . . . . . . . . . . . . V-14Potential Benefits and Applications . . . . . . . . . . V-15
Jacobs Smelter, Stockton, Utah . . . . . . . . . . . . . . . . . . V-15Innovative Approach . . . . . . . . . . . . . . . . . . . . . . V-15Results . . . . . . . . . . . . . . . . . . . . . . . . . . . . . . . . V-16Potential Benefits and Applications . . . . . . . . . . V-16
Iceland Coin Laundry and Dry Cleaning, Vineland, New Jersey . . . . . . . . . . . . . . . . . . . . . . . . . . . . . V-17Innovative Approach . . . . . . . . . . . . . . . . . . . . . . V-17Results . . . . . . . . . . . . . . . . . . . . . . . . . . . . . . . . V-17Potential Benefits and Applications . . . . . . . . . . V-17
Conclusion . . . . . . . . . . . . . . . . . . . . . . . . . . . . . . . . . . . . . . . . V-19
References . . . . . . . . . . . . . . . . . . . . . . . . . . . . . . . . . . . . . . . . . . . . . . R-1
Appendix A: Daily and Weekly Activity Summary Reports . . . . . . . . . A-1
Appendix B: Qualification Worksheets . . . . . . . . . . . . . . . . . . . . . . . . B-1
Appendix C: Summary of Detection Limits for Selected Field-BasedAnalytical Methods . . . . . . . . . . . . . . . . . . . . . . . . . . . . . C-1
Glossary . . . . . . . . . . . . . . . . . . . . . . . . . . . . . . . . . . . . . . . . . . . . . . . G-1

xii
Exhibits
Exhibit Page
I-1 Comparison of Field Activity Terms Used by EPA ContaminatedSite Cleanup Programs . . . . . . . . . . . . . . . . . . . . . . . . . . . . . . . I-4
II-1 Schematic of the On-Site Decision-Making Process . . . . . . . . . II-3II-2 Summary of Applications to Contaminated Site Activities . . . . . II-8III-1 Summary of Issues to be Covered by Project Planning
Documents for a Dynamic Field Activity . . . . . . . . . . . . . . . . . . III-6III-2 Example Decision Tree for TCE Release Investigation . . . . . III-12III-3 Example Communication Strategy . . . . . . . . . . . . . . . . . . . . . III-15III-4 Summary of Planning Team Member Qualifications . . . . . . . III-25III-5 Summary of Field Team Member Qualifications . . . . . . . . . . III-30IV-1 Method Selection Process Overview . . . . . . . . . . . . . . . . . . . . IV-4IV-2 Summary of Quality Control Sample Issues . . . . . . . . . . . . . IV-18IV-3 Summary of Documentation Issues . . . . . . . . . . . . . . . . . . . . IV-20IV-4 Summary of Data Management Issues . . . . . . . . . . . . . . . . . IV-23IV-5 Screening Sampling Data Management Flow Diagram . . . . . IV-24V-1 Summary of Dynamic Field Activity Case Studies . . . . . . . . . . . V-2V-2 Summary of Several Previously Reported Dynamic Field Activity
Case Studies . . . . . . . . . . . . . . . . . . . . . . . . . . . . . . . . . . . . . . . V-3V-3 Summary of Innovative Dynamic Strategies During Initial Site
Screening . . . . . . . . . . . . . . . . . . . . . . . . . . . . . . . . . . . . . . . . . V-13
xiii
Abbreviations
ASTM American Society for Testing and MaterialsBAP benzo(a)pyrenebgs below ground surfaceBRAC Base Realignment and ClosureBTEX benzene, toluene, ethylbenzene, and xylenes CERCLA Comprehensive Environmental Response, Compensation, and
Liability ActCFR Code of Federal RegulationsCLP Contract Laboratory Program CLU-IN Clean-Up Information SystemCRREL Cold Regions Research and Engineering LaboratoryDDD dichlorodiphenyldichloroethaneDDE dichlorodiphenyldichloroethene DDT dichlorodiphenyltrichloroethaneDNAPL dense nonaqueous phase liquidDOD United States Department of DefenseDOE United States Department of EnergyDP direct pushDQA data quality assessmentDQO data quality objectiveECD electron capture detectorEPA United States Environmental Protection AgencyERT Environmental Response TeamESAT Environmental Services Assistance TeamFAM field-based analytical method FASP Field Analytical Support ProgramsFID flame ionization detectorFS feasibility studyFSP field sampling planGAC granular activated carbonGC gas chromatographGIS geographic information systemsHMX high melting explosiveHRS Hazard Ranking SystemICP inductively coupled plasmaIRP Installation Restoration ProgramISE ion-specific electrodeMCAS Marine Corps Air StationMCL maximum contaminant levelµg/kg micrograms per kilogramµg/L micrograms per litermg/kg milligrams per kilogram

xiv
mg/L milligrams per literng/L nanograms per literMS mass spectrometryND nondetectNPL National Priorities ListNOAA National Oceanic and Atmospheric AdministrationO&M operation and maintenanceOES optical emission spectroscopyOERR Office of Emergency and Remedial ResponseOSWER Office of Solid Waste and Emergency ResponseOU operable unitPAH polyaromatic hydrocarbonPCB polychlorinated biphenylPCE tetrachloroethene or perchloroethenePE performance evaluationPID photoionization detectorppb parts per billionppm parts per millionPRP potentially responsible partyQA quality assuranceQAPP quality assurance project planQC quality controlRCRA Resource Conservation and Recovery ActRDX royal demolition explosiveRI remedial investigationRI/FS remedial investigation/feasibility studySAP sampling and analysis planSCAPS Site Characterization and Analysis Penetrometer SystemSOP standard operating procedureTCE trichloroetheneTNT trinitrotolueneTRPH total recoverable petroleum hydrocarbonsU.S. EPA United States Environmental Protection AgencyUSACE United States Army Corps of EngineersUST underground storage tankVOC volatile organic compoundXRF X-ray fluorescence

Chapter I
Introduction


Chapter I Introduction
Purpose
This document provides environmental cleanup professionals with guidance on how to use an on-site decision-making process to streamline field work at contaminated sites. Because of the adaptive nature of this process, it can be applied to all U.S. Environmental Protection Agency (EPA) programs within the Office of Solid and Emergency Response (OSWER), including the Comprehensive Environmental Response, Compensation, and Liability Act (CERCLA), Resource Conservation and Recovery Act (RCRA) corrective action, Brownfields, and leaking underground storage tanks. Sites that have used on-site decision making, as reviewed in Chapter V, consistently demonstrated that this process reduces the time needed to meet project objectives, reduces the cost of site activities, and increases confidence in the decisions, thereby improving the overall quality of field work.
Proper implementation of an on-site decision-making process depends on three key elements: thorough systematic planning, development of “dynamic” or “flexible” work plans, and quick turnaround analytical methods—typically provided by field-based analytical methods. While systematic planning is an established and essential component of all types of data collection efforts, the other two elements have generally not been well understood by regulators, contractors, and industry. In particular, there has been a general misconception that data generated in the field cannot withstand judicial scrutiny. In reality, however, as long as field generated data meet project requirements with an appropriate level of quality control procedures and documentation to support its scientific defensibility, the data are generally legally defensible.
Consequently, this guidance focuses on how project managers can use dynamic work plans and field-based analytical methods to meet project requirements and streamline site activities. The guidance provides an overview of the entire process to provide some context for the use of these two issues. Also provided are examples of how this process has already been successfully utilized.
Intended Audience
The primary audience for this guidance is contaminated site project managers who have the primary responsibility for carrying out regulatory response activities at their assigned sites. In addition, this guidance is designed to help educate other key participants (e.g., relevant EPA personnel, contractors, other federal and state agencies, industry) about the on-site decision-making process so
I-1
On-site decision making is applicable for all types of data collection activities, and it can provide a “better, faster, cheaper” method of doing business.
Systematic planning, dynamic work plans, and quick turnaround analytical results are key elements to successfully using an on-site decision-making process.

that these groups can work in concert with EPA project managers when implementing these projects.
Although this document is written primarily for EPA programs, the ideas and recommendations contained within it are generally applicable for any field work at a contaminated site because the data generation and decision-making issues are similar, regardless of a site’s regulatory status. As such, this guidance may also be useful for individuals undertaking assessment, characterization, remediation, and monitoring at sites being managed by federal facilities, states, or tribes.
Scope and Limitations
The material presented in this guidance is based on the knowledge and experience of the authors and peer reviewers, as well as the latest available technical data and information. However, this document cannot provide project managers with definitive or comprehensive recommendations that are broadly applicable for all situations; nor can it resolve all of the questions and issues involved with implementing an on-site decision-making process. Consequently, project managers will need to seek the assistance of experts from their regional offices, contractors, or other government agencies (e.g., U.S. Army Corps of Engineers, U.S. Geological Survey). Other initiatives and resources that can provide additional support to project managers include:
C The “Triad” campaign (http://clu-in.org), which promotes the use of systematic planning, dynamic work plans, and quick turnaround measurements for streamlining site activities through a number of projects that complement this guidance;
C Fully Integrated Environmental Location Decision Support (FIELDS) (http://www.epa.gov/region5fields/static/pages/index.html) is a software system that integrates geographic information systems, a global positioning system, imaging software, and in-field sampling and analysis technologies;
C Spatial Analysis and Decision Assistance (SADA) (http://www.tiem.utk.edu/~sada/) is a software program, partially funded by EPA, that integrates visualization, geospatial analysis, statistical analysis, human health risk assessment, cost-effective analysis, sampling design, and decision analysis;
C Performance-based measurement systems (PBMS) (http://www.epa.gov/ SW-846/pbms.htm) is an approach that emphasizes the use of analytical methods according to decision objectives rather than through regulation;
C U.S. EPA, 1997. Expedited Site Assessment Tools for Underground Storage Tank Sites: A Guide for Regulators, EPA 510-B-97-001. Office
This guidance is only one piece of a larger initiative to improve contaminated site decision making.
I-2

of Solid Waste and Emergency Response, Washington, DC. http://www.epa.gov/swerust1/pubs/index.htm ; and
C ASTM D6235-98, Standard Practice for Expedited Site Characterization of Vadose Zone and Groundwater Contamination at Hazardous Waste Contaminated Sites, and ASTM E1912-98, Standard Guide for Accelerated Site Characterization of Confirmed or Suspected Petroleum Releases. http://www.astm.org.
The text has been written in very general terms that are applicable to a broad range of programs and conditions. Consequently, the term “project manager” is used unless the information is applicable for only a specific type of project manager (e.g., on-scene coordinator, remedial project manager). Likewise, generic terms are used to describe activities throughout the phases of contaminated site work, such as characterization, cleanup, and monitoring. When the text is applicable to all phases of site work, terms like “field activities” or “field work” are commonly used. Program-specific terminology is used only in the context of providing examples. Exhibit I-1 summarizes the field activity terms used by the programs within OSWER and how they relate to each other.
The on-site decision-making process promoted in this guidance refers to decisions being made while equipment and personnel are in the field, ready to follow through with decisions made by experienced staff, regulators, and stake-holders. The term “on-site decision making” is not intended to imply that all of the decision-makers need to be on site. On the contrary, through the use of modern information technologies, many decision makers may be able to provide their input from remote locations. In addition, this process does not encourage project personnel to make unlimited decisions about site activities; rather, the site decisions should be limited to the scope of work outlined in the project planning documents. The on-site decision-making process is further limited by legal restrictions for some regulatory programs that require a formal review process before certain additional site activities may occur. For example, CERCLA requires a 30-day public comment period for proposed remedies at National Priority List (NPL) sites.
In addition, this document defines the term “field-based analytical methods” as a broad category of analytical methods that can be applied at the site during sample collection activities. The definition encompasses methods that can be used outdoors, as well as those that require the controlled environments of a mobile laboratory. Although using field-based analytical methods is the most common approach to supporting an on-site decision-making process, this guidance does not intend to imply that they are the only means. For instance, off-site laboratories may be appropriate when they can provide data at a competitive price within the time frame needed for on-site decision making. The selection of the most appropriate analytical methods should be determined on a site-specific basis. This document uses the terms “quick turnaround,” “rapid,” or “timely,” to refer to data generation methods used to support on-site decision making.
I-3
On-site decision making is limited by program specific legislation and regulations as well as the scope of work described in the project planning documents.
Examples of the types of decisions that may be made with an on-site decision making process include: – Placement of monitoring wells; – Determining if cleanup objectives have been met; – Timing of carbon change-out for pump and treat systems.

Exhibit I-1 Comparison of Field Activity Terms Used by EPA Contaminated Site
Cleanup Programs
CERCLA Remedial Program
CERCLA Removal Program
RCRA Corrective Action
Program
LUST Site
Preliminary Assessment/ Site Inspection
Removal Site Evaluation
RCRA Facility Assessment
Investigation
Characterization
AssessmentRemedial Investigation
RCRA Facility Investigation
Feasibility Study Engineering Evaluation/Cost Analysis*
Corrective Measures Study
Corrective Action Plan
Remedial Design/Remedial Action
Removal Action Solid Waste Management Unit Closure
Corrective Measures Implementation
Interim Measure
Remediation
Cleanup
Interim Measure
Operation and Maintenance
Post-removal site control
Operation, Maintenance, and Monitoring
Monitoring
*Non-time critical removal actions only.
How To Use This Guidance
EPA encourages project managers to use this guidance as a reference document during the planning and management of their projects. To help readers find the information they need for a particular activity, several features have been developed. First, text boxes, summary tables, and figures are provided to high-light major points. Second, the text has been organized into many brief sections each with a subtitle heading so that subject areas of particular interest can be quickly found and reviewed. Third, supporting documentation and additional resources have been added to the appendices and referenced to web pages. Lastly, web site addresses are included in the reference section wherever possible. Older EPA documents (e.g., pre-1996) that do not have a specific website address may be accessed at http://www.epa.gov/ncepihom/nepishom/index.html where a scanned copy is generally available. Finally, Chapter II has been developed as an overview for the guidance. As such, it provides a “roadmap” for finding key information within the rest of the guidance.
I-4

Following this chapter, the guidance is divided into four subject areas:
Chapter II Overview of the On-Site Decision-Making Process. This chapter presents an overview of the activities needed to successfully implement on-site decision making, how the process can be applied to different phases of field work, and some of the special considerations that are needed for proper implementation.
Chapter III Managing Dynamic Field Activities. This chapter provides project managers with information to put a dynamic work plan in place, ensure that qualified staff work on the project, and oversee site activities.
Chapter IV Key Considerations for Meeting Project Requirements with Field-Based Analytical Methods. This chapter describes steps that can be used to enhance the scientific defensibility of data generated with field-based analytical methods for on-site decision making.
Chapter V Dynamic Field Activity Case Study Summaries. This chapter provides brief examples of how on-site decision-making processes have been used at different sites. The full texts of these case studies are available at http://www.epa.gov/superfund/programs/dfa/casestudies. Examples include soil and groundwater characterization; soil and sediment cleanup; and treatment system optimization. In addition, three examples of a dynamic approach being applied during initial site screening are provided.
I-5


Chapter II
Overview of the On-Site Decision-Making Process


Chapter II Overview of the On-Site Decision-Making Process
Overview
This chapter provides an overview of the on-site decision-making process, its applications for contaminated site cleanup programs, and special considerations that help to avoid problems in the field. This process necessitates systematic planning, dynamic work plans, and rapid analytical results. The resulting project is a dynamic field activity—an approach that combines on-site data generation with on-site decision making. The term “dynamic” is used because these field activities are designed to incorporate changes as new information is obtained, thus, accommodating the iterative nature of field work at contaminated sites. Consequently, dynamic field activities help project managers reach site decisions while avoiding numerous planning efforts and field mobilizations that would otherwise be necessary. Because of its flexible approach, this process is applicable to all data collection activities (e.g., initial site screening, characterization, remediation, monitoring).
Dynamic field activities contrast with the “traditional” staged approach where site decisions are made after all the data have been collected and evaluated, typically many weeks after sampling equipment has been demobilized from the site. This approach entails using numerous mobilizations to complete projects in stages. The project scopes are similar to dynamic field activities, however, iterations are guided during off-site evaluations rather than through on-site decision making.
The dynamic approach can eliminate many of the mobilization stages by collecting the data needed for decision making before the field work is terminated. This concept is not new. A number of sites have successfully used this process already and it has been promoted by a number of different programs. Of particular interest for large complex sites is the ASTM Expedited
On-Site Decision Making is Not New
Several programs have promoted on-site decision making for streamlining field work at contaminated sites:
C Common practice in the CERCLA removal program.
C Expedited Site Characterization by DOE (Burton, 1993) and ASTM (ASTM, 1998a)
C Accelerated Site Characterization (for UST sites) by ASTM (ASTM, 1998b).
C Expedited Site Assessment promoted by EPA’s Office of Underground Storage Tanks (U.S. EPA, 1997c).
C Described as a Triad Approach (Crumbling, 2000).
C Rapid Site Assessment used by the State of Florida (Applegate and Fitton, 1997).
Site Characterization standard (ASTM, 1998a). For less complicated petroleum sites with leaking underground storage tanks, the ASTM Accelerated Site Characterization standard (ASTM, 1998b) and EPA’s Expedited Site Assessment
II-1

Tools for Underground Storage Tank Sites (U.S. EPA, 1997c) are particularly relevant. The key features promoted in all of these initiatives include:
C Thorough systematic planning carried out by experienced technical staff that will be involved in the actual field work;
C Cooperation of all stakeholders throughout the planning and implementation process;
C Flexible sampling and analytical plans; C Reliance on quick turnaround analytical methods; and C Strategies to minimize mobilizations.
The benefits of integrating these features into project activities are significant. As demonstrated through numerous case studies documented in Chapter V, dynamic field activities can help to:
C Reduce administrative costs for regulators and contractors by eliminating iterations of project planning, interim report writing, and document review;
C Reduce remediation costs through detailed site characterization that can help focus subsequent field work;
C Improve project quality control; C Eliminate delays in getting results caused by an over-booked off-site
laboratory, thereby increasing the effective use of excavation equipment; C Improve data quality that meet all decision criteria established in project
planning documents; C Improve overall project efficiency; C Reduce total project costs by 15 to 45 percent; and C Reduce project time by 33 to 60 percent.
The following chapter provides an overview of the concepts that are important in using an on-site decision-making process and also refers the reader to other sections of this guidance for more detail on specific topics. The description of this process is not intended to imply that only purely dynamic projects provide benefits to contaminated sites. On the contrary, many times a hybrid use of on-site decision making and staged activities are appropriate depending on a number of factors, including staff experience level, available funding, and knowledge of site conditions.
II-2

Section 1: The On-Site Decision-Making Process
On-site decision making provides an iterative, flexible framework for collecting data and making site decisions throughout contaminated site activities. The schematic drawing presented in Exhibit II-1 summarizes the four step process as:
C Using a systematic planning process; C Preparing a dynamic work plan that documents an on-site decision-making
strategy; C Conducting a dynamic field activity; and C Writing a final report.
Exhibit II-1 Schematic of the On-Site Decision-Making Process
II-3

Step 1: Using a Systematic Planning Process
Systematic planning is a process that is based on the scientific method. In the context of a contaminated site it is a transparent, deliberate, coordinated effort to identify and manage decision uncertainty with minimal decision errors. Because dynamic field activities rely on clearly developed goals to effectively guide the field work, systematic planning is particularly important for their successful execution. To facilitate the use of a systematic planning process for data collection, EPA has developed guidance (U.S. EPA, 2000d) which recommends the use of data quality objectives (DQOs). Regardless of the formal process used, systematic project planning should entail:
C Reviewing existing site information; C Selecting key personnel; C Identifying the project objectives; C Developing an initial conceptual site model; C Preparing sampling and measurement strategies; and C Selecting appropriate analytical methods, equipment, and contractors.
The development of an initial conceptual site model in the systematic planning process is an essential activity. Commonly, it is presented in a series of maps and diagrams that include contaminant release mechanisms, geological features, migration pathways, human and ecological receptors, and other information important for understanding site conditions. This information is used for making sampling and analytical decisions. The conceptual site model is updated during a dynamic field activity so that subsequent on-site decisions can be based on all available information. Consequently, this process necessitates that decision makers establish methods for reviewing their initial assumptions, integrating new data, and modifying the conceptual site model accordingly. Electronic tools for accomplishing this integration from both the communication and management perspectives are discussed in Chapter III, Managing Dynamic Field Activities and Chapter IV, Key Considerations for Meeting Project Requirements with Field-Based Analytical Methods. The cleanup case study of Loring Air Force Base, summarized in Chapter V, provides an example of how this process can be accomplished.
Step 2: Preparing a Dynamic Work Plan
After the initial phase of systematic planning has been completed, project planners may prepare a dynamic work plan—the document that provides the project team with the lines of communication and on-site decision-making
II-4
The key to a successful dynamic field activity is communication. Project managers need to meet with the important decision makers and stakeholders to identify problems and agree on the approach to the site early in the planning process.
Dynamic work plans document the approach and rationale behind the on-site decision-making process.

strategy. It outlines a sequence of activities that accommodate the decision-making process and stakeholder involvement to keep the project moving forward. As such, dynamic work plans describe project activities that are adaptable to the new information acquired during field work. They are accompanied with a series of official documents, such as the field sampling plan, quality assurance project plan, data management plan, and community involvement plan, that target specific audiences. Chapter III, Managing Dynamic Field Activities, provides more information on how to develop a dynamic work plan.
Dynamic work plans should include contingencies so that unexpected findings or unsuccessful procedures can be quickly modified without halting the field work. For example, a dynamic work plan might include a contingency for an alternative sampling technique to be used if the preferred one fails to perform as expected. Although every effort should be made to ensure that the selected equipment and methods are appropriate for the expected field conditions, thorough planning cannot always anticipate unexpected circumstances. Consequently, dynamic work plans should fully discuss the procedures that would take place to access additional equipment or services if the need arises. This discussion is often presented in an “if-then” format. For example, the dynamic work plan for the soil and sediment cleanup case study, summarized in Chapter V, demonstrates the use of a contingency plan in making a smooth transition from an unsatisfactory immunoassay technique to a transportable gas chromatography (GC) method for PCB analysis. In addition, Chapter III, Managing Dynamic Field Activities, provides a detailed discussion on how contingency planning can be integrated into dynamic work plans.
For a dynamic field activity to be successful, all of the associated planning documents should support the on-site decision-making process. For example, the community involvement plan should provide a mechanism for sharing data with the local community and determining the specific decision points where each stakeholder should be involved. Where specific decisions require cooperation with the local community, the community involvement plan should discuss the potential situations, options, and acceptable activities with the community prior to the mobilization.
Step 3: Conducting a Dynamic Field Activity
Dynamic field activities utilize an iterative sampling, analysis, and evaluation strategy that allows project teams to continually refine the conceptual site model in the field until they are satisfied they have reached their project objectives. This iterative process minimizes the number of site mobilizations.
II-5
Dynamic field activities use quick turnaround data to support on-site decision making.

Although the field sampling plan for a dynamic field activity may initially select sampling locations (e.g., a probabilistic sampling approach), it should also establish a scheme for using the findings to guide additional field work (e.g., judgmental sampling, statistical techniques that facilitate adaptive or sequential sampling programs). In this respect, the field sampling plan should provide a framework for data collection that can be modified and optimized continuously as the field program proceeds. Experienced personnel are an essential component of this process to evaluate results and guide the progress of the project. Consequently, the field sampling plan should establish lines of communication that enable technical experts to evaluate data in a timely fashion. Typically, a very experienced and cross-trained technical team leader will supervise activities in the field and ensure that appropriate personnel have the information they need to generate and evaluate data.
The dynamic field activity is completed when project requirements, as documented in the dynamic work plan, are met. Although thorough project planning can typically avoid ending a project before reaching the objectives, on occasion field conditions or external events may cause work to end earlier than expected. For instance, field work may stop if additional legal proceedings are required to pursue a contaminant plume across property lines. Consequently, the planning documents need to define success for the project as well as the conditions that will require demobilization for additional planning.
Step 4: Writing a Final Report
As with any environmental field work, projects using dynamic field activities document results in a final written report. However, since dynamic projects can generate more meaningful data sets and provide greater project confidence in site conditions than other approaches, the final report should also provide better guidance on a subsequent course of action. For example, if a dynamic field activity is used to generate a CERCLA site inspection report, decision makers should have a better understanding of the risks posed by the site, thereby improving their ability to decide whether to include it on the National Priorities List. In addition, any subsequent field work will have more information to build upon.
One added benefit of the report writing process is that much of the data processing and evaluation are done as part of the field work, so the report writing is significantly streamlined in comparison to a staged approach. Furthermore, since the experienced staff are more involved with the actual field work, they need less time to review and become familiar with the documentation in preparation of writing the report.
II-6

Section 2: Applying Dynamic Field Activities to Contaminated Sites
Examples of how dynamic field activities can be used throughout all phases of work at contaminated sites are provided in this section to enlighten and encourage project managers to use this approach for a variety of activities. Dynamic field activities provide two strategic benefits for contaminated site cleanup programs. First, they force better integration of programmatic issues that may not otherwise be coordinated by helping decision makers to understand site problems and solutions quickly. For example, implementing a dynamic field activity during the initial site screening creates more and better data for followup characterization which, in turn, can allow for a more streamlined implementation of cleanup and monitoring activities.
Second, by reducing the time between site discovery and cleanup, dynamic field activities help to reduce the spread of contaminants, thereby reducing the area of contamination and possibly the need for recharacterization of redistributed contaminants. For example, a storm event or spring snow melt can sometimes mobilize contaminated sediment. By streamlining the evaluation process, dynamic field activities can help to cleanup contaminants as they are characterized. A summary of these applications is provided in Exhibit II-2.
Characterization
Site characterization is the most obvious and most commonly used application of dynamic field activities. It has already been thoroughly described by a number of organizations, as mentioned earlier in this chapter. The four benefits commonly cited for this phase of field work include:
C Providing a cost-effective, rapid, and comprehensive site characterization; C Facilitating the integration of characterization and cleanup technology
evaluation tasks; C Facilitating a smooth transition into subsequent remediation activities; and C Improving risk assessments.
Cost-Effective, Rapid, and Comprehensive Site Characterization
Dynamic field activities improve site characterization by allowing the iterative investigation process to take place in the field rather than off site. They also promote the use of multiple, complementary methods that increase confidence in the conceptual site model, especially at sites where the subsurface is heterogeneous. As a result, the overall project cost and time can be substantially
II-7
Dynamic field activities can be used for characterization, cleanup, and monitoring. f the potential contaminants at a site are known, dynamic field activities can benefit initial site
I

Exhibit II-2 Summary of Applications to Contaminated Site Activities
Site Activity Application
Overall, dynamic field activities encourage better integration of response programs and, by streamlining field work, they contribute to a more timely cleanup.
Characterization Complete characterization quickly and with better understanding of site conditions.
Increase confidence that preferential contaminant migration pathways have been identified in heterogenous geologic settings.
Make decisions with higher level of statistical certainty (e.g., declaring an area “clean”).
Integrate characterization and cleanup technology evaluation tasks.
Streamline subsequent remediation activities.
Improve risk assessments.
Cleanup Optimize cleanup technology.
Make decisions with higher level of statistical certainty.
Streamline soil removal and treatment decisions.
Monitoring Evaluate and optimize remedy performance.
Initial Site Screening Evaluate several potential exposure pathways or source areas.
Plan field work at sites with known classes of potential contaminants.
Determine “attribution” of source area to receptor.
Assess actual human health or ecological risk.
reduced. An analysis of the characterization case study presented in Chapter V indicates that the most easily quantifiable cost and time savings were derived from a reduction in contractor hours dedicated to writing the work plans and interim reports as well as the Agency’s time in reviewing these documents. While the total analytical costs were comparable, the dynamic process provided the project team with significantly more data points and sufficient QA/QC to define the nature and extent of the contamination in both the soil and groundwater. If the project managers had tried to use a traditional phased approach with the same level of confidence using off-site analyses, the total costs would have been prohibitive.
II-8

Integration of Characterization and Remedy Evaluation Tasks
Dynamic field activities can facilitate the integration of characterization and remedy evaluation tasks, as recommended in EPA guidance (U.S. EPA, 1988), by allowing project teams to use characterization data simultaneously for remedy evaluation purposes. If project planners develop dynamic work plans that include remedial objectives and appropriate remedies along with characterization objectives, data collection efforts can support the evaluation of remedy options since these options will become clearer as the investigation proceeds.
For example, if a suspected TCE release is being characterized, the investigators will need to collect data for the remedy evaluation of TCE in soil and potentially TCE in groundwater. A dynamic field activity can quickly narrow the remedy options (e.g., soil vapor extraction, ex situ thermal desorption, air sparging) by determining the depth of the source area and the soil types in which it is located. If the project team finds contamination in a clayey soil, it can eliminate soil vapor extraction as a treatment option. If it discovers that groundwater contamination is limited to a clayey aquifer, it can eliminate air sparging. If, on the other hand, groundwater contamination is in a sandy aquifer, the project team can schedule an aquifer pumping test during the installation of monitoring wells. These types of evaluations were successfully carried out for a TCE release in the soil and groundwater characterization case study summarized in Chapter V.
Smooth Transition to Subsequent Remediation Activities
Dynamic field activities usually result in a more fully detailed site characterization that allows the subsequent steps in the remedial process to proceed expeditiously. For example, CERCLA remedial project managers often spend considerable resources developing additional site characterization data during the remedial design because of inadequate characterization during the remedial investigation. Additional data may also be needed during the remedial action process before the remediation technology can be installed or implemented. By allowing projects to collect sufficient data for implementing potential remedies, dynamic field activities may allow remedial action resources to be focused on cleanup activities. Furthermore, having an accurate “final” conceptual site model aids in the implementation of effective operation and maintenance activities as well.
The Hanscom Air Force Base case study (Robbat, 1997a) provides an example of how an inadequate characterization resulted in the need for additional investigations after the remediation technology proved to be ineffective. In this case a dynamic field activity was used to identify gaps in the site characterization.
II-9

Improving Risk Assessments
As a site is characterized, data are collected to determine the risk the site poses to human health and ecological receptors. There are at least two ways in which risk assessment data collection efforts can be improved with the use of dynamic field activities:
C Increasing knowledge about site conditions; and C Including risk assessors in field decision making.
Increasing Knowledge About Site Conditions
Although risk assessors often have to work with very limited data sets for evaluating site conditions, they can gather more data about a site with an on-site decision-making process provided an analytical method can be found that has adequate detection limits. The data collected is also likely to be more relevant to the risk assessment because sample locations can be modified based on the latest site information. Therefore, risk assessors can determine if data points with high concentrations are merely outliers that do not significantly affect the actual level of risk, or if they are part of a significant area of contamination. Consequently, project managers can make risk decisions based on samples that are representative of the area of concern and with a better understanding of the overall conceptual site model, thereby increasing the confidence in their actions.
Including Risk Assessors in Field Decision Making
Dynamic field activities allow risk assessors to review data as they are produced and influence the selection of additional samples to meet the needs of the risk evaluation, thus they can avoid having to depend on site characterization data that do not meet their needs. By providing risk assessors with an opportunity to influence sample selection, additional mobilizations can be avoided and decision makers can have increased confidence in the risk assessors’ evaluations.
Cleanup
Dynamic field activities may be used in at least three ways as part of the cleanup process, including:
C Optimize a cleanup technology; C Confirm that cleanup objectives have been achieved; and C Segregate soil for various treatment options.
II-10

Optimize a Cleanup Technology
Implementing a dynamic optimization strategy during the startup period of a cleanup technology allows the remediation team to adjust equipment parameters based on quick turnaround analytical results. For example, if thermal desorption or a soil washing technology is being implemented, field-based analytical methods may provide data that ensure the technology is operating within the project requirements, thereby allowing the project team to refine the treatment process quickly and precisely. The Umatilla case study summarized in Chapter V provides an example of how a colorimetric analytical method and a dynamic sampling strategy were used to optimize protocols at a groundwater treatment plant. In addition, the King of Prussia soil washing report (U.S. EPA, 1995a) demonstrates how x-ray fluorescence (XRF) has been used to confirm the effectiveness of a treatment system.
Confirm That Cleanup Objectives Have Been Achieved
Dynamic field activities can play a very valuable role in cleanup scenarios that need a large number of samples to make a statistical determination of whether cleanup goals were met. For example, if the distribution of the constituents of concern is heterogenous, then the project team may need to collect a large number of samples before an area can be declared “clean.” Field-based analytical methods that meet the project’s data use needs can help project teams generate sufficient data to expedite the decision-making process of declaring the cleanup complete, prior to demobilization. In addition, by allowing the project team to collect more data with the same analytical budget, this process can increase the certainty with which they make site decisions.
Segregate Soil for Various Treatment Options
Often during cleanup activities quick turnaround analysis is essential, such as during a soil removal operation where the hourly cost of removal equipment is much greater than the cost of quick turnaround off-site analysis. If field-based analytical methods can be used to support decision making for a dynamic field activity, then the project can avoid paying the higher analytical fees. Likewise, if a treatment process is less expensive per ton of soil than an off-site analytical method, it is often more cost effective to treat soil that may be “clean.” If a low cost analytical method can meet the project requirements, project managers can avoid treating questionably contaminated soil and expedite the treatment process. The Wenatchee Tree Fruit case study (U.S. EPA, 2000h) and the Loring Air Force Base case study summarized in Chapter V both provide examples of these benefits.
II-11

Monitoring
Dynamic field activities are relevant for monitoring activities when a cleanup technology needs to be evaluated and optimized. As a result, the applications are similar to the activities demonstrated in the Umatilla and Hanscom case studies already mentioned. In addition, dynamic field activities should result in lower monitoring costs by:
C Reducing the number of monitoring wells (see Tustin case study in Chapter V); and
C Optimizing the cleanup technology, thereby leaving a lower level of residual contamination.
Initial Site Screening
Generally, initial site screening is used to determine which, if any, program should take responsibility for additional work at a site. If project planners realize that only a few samples will be needed to make a site decision, or very little is known about the nature of the contamination, on-site decision making may not benefit the project. However, even with the limited budgets often used for initial site screening, there are several situations in which dynamic field activities can address this project goal. A list of possible scenarios includes:
C Evaluating several potential exposure pathways or source areas; C Planning field work at sites with known classes of potential contaminants; C Linking a source area to a receptor; and C Assessing actual human health or ecological risks.
Examples of each of these situations are presented in the initial site screening case studies described in Chapter V.
In addition, as with other project goals, dynamic field activities help to reduce the number of mobilizations needed to make a site decision by providing investigators with the flexibility to maximize the amount of information that is collected during each sampling event. Many times project planners believe that a site can be screened with only a few key samples, only to learn that another sampling event is needed once the results arrive. By using a dynamic sampling strategy, it is possible to reduce a number of these remobilizations.
II-12

Evaluating Several Potential Exposure Pathways or Sources Areas
If a site contains several potential exposure pathways or source areas that need evaluation, a dynamic field activity may be the best strategy for obtaining the necessary information in a reasonable time frame. Although the use of mobile laboratories are often considered too expensive for initial site screening, in this situation they may be appropriate, considering the number of samples that may be needed. In addition, even without sophisticated mobile laboratories, project managers can benefit from an on-site decision-making process. Inexpensive port-able field analytical instruments, such as portable GC, XRF, and immunoassay test kits can often help to evaluate contaminant distribution and provide a high degree of confidence in the results due to increased sampling density with data of known quality.
Planning Field Work at Sites with Known Class of Potential Contaminants
If known classes of contaminants exist at a site, project planners can often select inexpensive analytical equipment that can support a dynamic field activity and allow a decision to be made in as little as a single mobilization. Examples of site types that may be applicable, include:
C Dry cleaner sites where volatile chlorinated hydrocarbons are expected: a portable GC may be used.
C Smelters, platers, and battery recycling sites where specific metals are expected: XRF may be used;
C Agricultural sites where specific pesticides are expected: immunoassay test kits or portable GCs may be used;
C Firing range sites where specific types of explosives are expected: immunoassay test kits or colorimetric methods may be used; and
C Sites where radionuclides are expected: equipment such as a long range alpha detector may be appropriate (MARSSIM, 2000).
In all of these situations, the field-based analytical method could cost-effectively identify and quantify the suspected contaminant in a large number of samples while a small number of quality control samples could be sent to an off-site laboratory for confirmatory analysis, if necessary, using the Contract Laboratory Program (CLP) or other reference methods. Information on how these confirmatory samples can be selected to build confidence between methods and reinforce decisions at critical locations is provided in Chapter IV.
II-13

Linking Source Area to a Receptor
One of the activities that is often necessary during the initial screening of a site is to determine if contamination at a source area can be linked to a specific receptor (e.g., a drinking water well). Typically, many samples are needed to link these two points because the pattern and direction of contamination should be defined. Dynamic field activities allow many samples to be collected rapidly by providing the sampling team with the data they need to select new sampling points in real time. Therefore, this process can benefit initial screening activities by providing more, and better, information with which to connect a source of contamination and receptors.
Assessing Actual Human Health or Ecological Risk
During the initial site screening, dynamic field activities provide a quick and cost effective method of preliminarily determining contaminant exposure. Although this phase of program activities generally do not necessitate a full scale risk assessment, just enough data may be collected to estimate the effect site contamination may have on human health and ecological receptors. For example, a dynamic field activity may be used to determine how many residential properties near a lead smelter have elevated levels of lead without having to conduct numerous mobilizations.
II-14
Section 3: Special Considerations of Dynamic Field Activities
Although the benefits of using dynamic field activities are substantial, they are not applicable for all situations. In addition, special considerations should be taken to maximize their positive aspects. These considerations include:
C Additional preparatory planning; C Contingency budgeting; C Increased level of Agency oversight during planning and field activities; C Availability of rapid analytical methods to meet project-specific
objectives; and C Experienced technical staff to evaluate data and assist in decision making.
A more detailed discussion of how to manage these special considerations is presented in Chapter III, Managing Dynamic Field Activities.
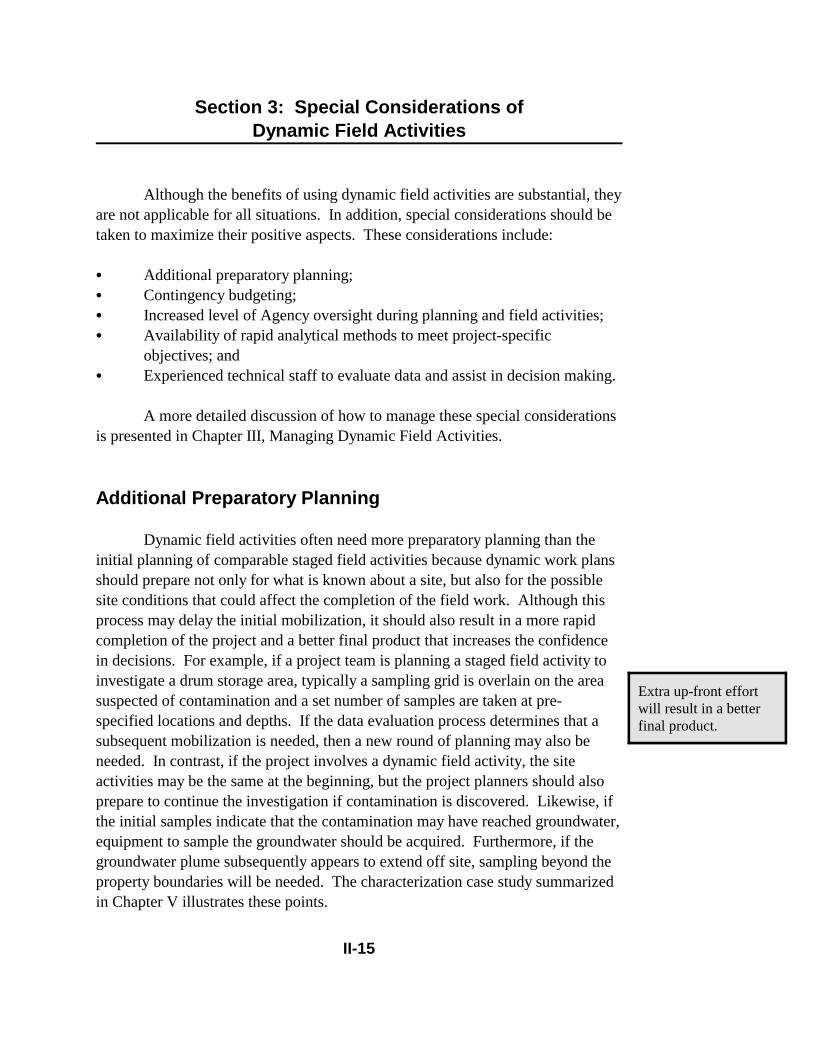
Additional Preparatory Planning
Dynamic field activities often need more preparatory planning than the initial planning of comparable staged field activities because dynamic work plans should prepare not only for what is known about a site, but also for the possible site conditions that could affect the completion of the field work. Although this process may delay the initial mobilization, it should also result in a more rapid completion of the project and a better final product that increases the confidence in decisions. For example, if a project team is planning a staged field activity to investigate a drum storage area, typically a sampling grid is overlain on the area suspected of contamination and a set number of samples are taken at pre-specified locations and depths. If the data evaluation process determines that a subsequent mobilization is needed, then a new round of planning may also be needed. In contrast, if the project involves a dynamic field activity, the site activities may be the same at the beginning, but the project planners should also prepare to continue the investigation if contamination is discovered. Likewise, if the initial samples indicate that the contamination may have reached groundwater, equipment to sample the groundwater should be acquired. Furthermore, if the groundwater plume subsequently appears to extend off site, sampling beyond the property boundaries will be needed. The characterization case study summarized in Chapter V illustrates these points.
II-15
Extra up-front effort will result in a better final product.

Contingency Budgeting
Although the final cost of a dynamic field activity is often much lower than that of a staged process using only off-site analytical capabilities, the initial budget is often higher than the initial budget for the same project using a staged process because the costs of subsequent stages are built into the dynamic work plan up front. In addition, a dynamic field activity typically benefits from being fully funded at the outset so that project managers may extend field work if site conditions indicate the need. Full funding generally includes money for any plausible contingencies, such as bringing new analytical equipment on site if previously unreported contaminants are identified. However, if full funding is not possible, the project manager may be able to plan the work around two different budget cycles or complete the work in smaller increments, funding each section of a site when the field team is ready. Creative budgeting strategies such as these may allow project managers to take advantage of dynamic field activities without acquiring full funding in the initial budget.
Increased Agency Oversight
Dynamic field activities generally need more Agency field oversight because the Agency should be involved in evaluating key technical decisions as they occur. As a result, EPA project managers may need timely support from Agency technical experts (e.g., chemists, hydrogeologists) or independent contractors to help guide the field program. The increase in oversight during dynamic field activities should be offset by a reduction in administrative document review (e.g., work plans, interim reports) that is generally needed for staged approaches. For example, a project manager overseeing a dynamic groundwater investigation may need to consult an independent hydrogeologist if the contractor recommends installing new monitoring wells based on additional groundwater data that changed the conceptual site model. In a staged approach, the independent hydrogeologist would be consulted after the interim report was submitted. Dynamic field activities, therefore, may result in more consultation during a mobilization but should also result in less administrative review after it.
In addition, project managers should consider Internet and visualization software options for sites that will need extended field work. By allowing the project manager to evaluate progress from a remote location rather than in the field, these tools can actually reduce the amount of direct oversight needed. This approach was successfully used at the Loring Air Force Base cleanup summarized in Chapter V.
This approach can save significant resources over the life of a project.
This approach can reduce overall oversight effort by eliminating an iterative review process for work plans and interim reports.
II-16

Availability of Rapid Analytical Methods
Although dynamic field activities do not absolutely necessitate that data be generated on site for on-site decision making to take place, data nonetheless should be provided to the field team in a time frame that allows for decision making to take place without significant delays. In many cases this means that data are generated on site. However, there are situations when it is either technically or economically preferred that samples be sent expeditiously to an off-site laboratory for quick turnaround analysis. For example, if a project requires a method that detects chromium in soil, currently only a fixed laboratory method can meet the quantitation limits needed for an evaluation of its threat of leaching into groundwater. If quick turnaround analysis from the fixed laboratory is not economically or technically feasible, a staged approach for this aspect of the field work may be more appropriate.
Experienced Technical Staff
Unlike a staged approach, the presence of one or more experienced technical staff in the field is recommended for dynamic field activities because experienced staff play a key role in the decision-making process and their recommendations can greatly influence the direction field activities take. Although recent innovations in information technologies, such as password protected “e-rooms,” allow technical experts to participate in these projects from remote locations, at least one experienced field team member should be on site because they provide the field team with immediate access to someone that can interpret results, avoid pitfalls, and provide overall leadership to a potentially complicated field effort. This individual should be a cross-trained technical professional who is empowered to make field decisions with access to specialists when needed or to make field related recommendations to the Agency project manager and technical experts. If an experienced technical team leader is not available to oversee the field work, a dynamic field activity will often be ineffective. Experienced technical staff are especially important during geologic and hydrogeologic characterizations because expert judgement is needed to select sample locations in the subsurface.
Both field-based analytical methods and off-site laboratories can support dynamic field activities.
Modern communication strategies allow communication with team members in remote locations.
II-17

Conclusion
Dynamic sampling and analytical strategies can streamline contaminated site activities by providing the data needed to make site decisions without multiple iterations of project work plans and interim reports. At the same time, the on-site decision-making process has the potential to save significant resources for the Agency while increasing confidence in the decisions that are made. This process is not new. It has been used successfully at a number of sites. Experience at several sites has demonstrated that the key to success is in using:
C Thorough systematic planning; C Flexible “dynamic” work plans; C Rapid data generation, particularly with field-based analytical methods; C Expertise in the field; and C Constant communication between stakeholders.
However, dynamic field activities offer more challenges to implement than traditional approaches and some precautions are necessary in order to maximize the benefits they can provide. Consequently, project managers should be committed to:
C Using a systematic planning process for the project design and implementation;
C Developing thorough project planning documents that take into account multiple scenarios and contingencies;
C Establishing a budget that provides flexibility in pursuing various levels of effort;
C Creating an independent oversight team, where appropriate, whose members are available for project updates and able to provide feedback when needed; and
C Selecting experienced technical staff for conducting a systematic planning process and implementing the field work.
II-18

Chapter III
Managing Dynamic Field Activities


Chapter III Managing Dynamic Field Activities
Overview
This chapter provides project managers with a basic understanding of the key issues involved in managing a dynamic field activity. Although specific activities differ among sites and programs, general guidelines have been developed on:
C Using systematic planning in developing a dynamic work plan; C Determining funding needs; C Ensuring the selection of qualified personnel; and C Preparing and overseeing the field work.
Managing a dynamic field activity presents special issues for the EPA project team because of the extensive planning required and rapid progress of the field work. Project managers need to be closely involved to ensure that the appropriate people are doing the work and that key individuals have the infor-mation needed to make defensible decisions in a timely manner. The high level of involvement they provide up front should ultimately save substantial project time by eliminating numerous project planning and report review cycles.
Project managers can benefit from a dynamic field activity when they find ways to maximize flexibility in the project‘s planning, management, funding, and oversight. Obtaining a high level of flexibility starts with selecting an organization for conducting the project. When a site is an Agency-lead site, project managers generally have at least four different mechanisms for finding the right people to do the work. The best choice is often dictated by site-specific, regional, and funding issues, but the primary goal should be to find qualified personnel to do the work, regardless of their affiliations. For example, in the Superfund program, the options generally include:
C Conducting the work in-house through EPA Regional Science and Technology Divisions, their in-house contractors (Environmental Services Assistance Team– ESAT), and the use of Field Analytical Support Programs (FASPs);
C Accessing Army Corps of Engineers staff and contractors through an Inter-Agency agreement to work with EPA staff and contractors;
C Using regional level-of-effort contracts, such as the Superfund Response Action Contract (RAC), to access an EPA contractor; or
C Requesting support from the Environmental Response Team‘s (ERT) in-house staff or through their Response Engineering and Analytical Contract (REAC).
III-1
The primary goal in assembling a project team should be to find the right people for the work. managers should consider a variety of affiliations.
Project

When the potential responsible party/responsible party (PRP/RP) takes the lead at the site, project managers often need access to similar types of expertise as those needed at Agency-lead sites to oversee the development of work plans, field work, and project reports. This chapter provides an overview of the types of information project managers should look for from project teams that are designing and implementing a dynamic field activity.
III-2

Section 1: Using Systematic Planning to Develop a Dynamic Work Plan
As mentioned in Chapter II, a dynamic work plan is the document that provides the project team with the lines of communication and an agreed upon framework that facilitates decision making in the field. Dynamic work plans provide —structured flexibility“ to project teams by describing the specific bound-aries and criteria within which project teams can make decisions based on new data. For Agency-lead sites where an EPA project manager chooses to use an in-place contractor to implement a dynamic field activity, the project manager should prepare a statement of work that allows a dynamic work plan to be developed. For all other situations in which a dynamic approach is under consideration, project managers need to negotiate the contents of the dynamic work plan. For both scenarios, this section provides project managers with the basic information they should expect in the planning documents that will allow on-site decision making while still maintaining proper Agency review.
Once a decision has been made to use an existing contract to conduct the field work, the project manager should issue a statement of work that requests the development of a dynamic work plan. Project managers should keep in mind that work plans proposed by a contractor are limited to the activities outlined in the statement of work. Although the overall statement of work should not be much different for a dynamic field activity than for a staged approach, the project manager should ensure that this document tells the contractor the prefer-red approach is one that uses rapid data generation to support on-site decision making. In addition, the statement of work should indicate the areas where the contractor should consider innovative field characterization techniques and analytical equipment.
Systematic Planning
In order to write a dynamic work plan the planning team should follow a systematic planning process to establish the project objectives and boundaries. It is through this process that the planning team can establish sampling and analyti-cal protocols that meet project requirements in the most cost effective manner. Examples of issues to be determined through the systematic planning process include:
• Identifying project objectives; • Designing an initial conceptual site model; • Identifying action limits, including how and where the contaminant action
levels may vary at the site; • Determining detection limits and quantitation limits that will be necessary
to support the site‘s action limits;
III-3
The dynamic work plan translates the project requirements, developed with stake-holders through the systematic planning process, into proced-ures to be used by the project team that will conduct the dynamic field activity.

• Establishing quality control protocols that will be needed to ensure analytical data meet project requirements; and
• Identifying initial sampling locations, methods, selection criteria, and quality control protocols to ensure that sufficient and representative data are collected.
The planning team should identify important variables in the design and execution of the project so that cost-effective strategies to manage them can be developed. Variables to be identified include:
C Budget; C Time frames; C Skill level of staff; C Availability of staff; C Historical site information; C Equipment availability; and C Regulatory and programmatic requirements.
At some sites other factors will also have a large impact, such as political and media interest, local community health and economic concerns, and broader ecological and economic considerations.
Project planners should also use the systematic planning process to develop a common sense approach that fits the level of planning to the level of concern about making mistakes. This objective requires that key decision makers collaborate with stakeholders to set clear and reasonable goals for a project, including the level of confidence sought in avoiding mistakes. After the project begins, the two groups should continue to evaluate their goals and ensure that the goals are being met. Consequently, systematic planning is not only the first step for planning a dynamic field activity, it is also an iterative process that takes place throughout the life of the project. For more information on what the systematic planning process entails, readers should refer to EPA guidance (U.S. EPA, 2000a). For an example of data quality objectives developed for a dynamic field activity, readers can refer to a U.S. Navy document developed for Marine Corps Air Station, Tustin available on the web (see reference, U.S. Naval Facilities Engineering, 1995c).
Dynamic Work Plan
Developing a dynamic work plan is an iterative process. The result is a document that provides a roadmap of decisions that the field team can follow. It is not just a paper requirement, by providing the field team with agreed upon guidelines to meet the project requirements, stakeholders can have increased confidence that their goals will be accomplished.
III-4
Dynamic work plans document the objec-tives and rationale behind the on-site decision making process.

For a work plan to be —dynamic,“ it should provide the project team with the lines of communication and agreed upon criteria needed to facilitate on-site decision making. As such, it outlines a sequence of adaptive approaches to field work that accommodate the decision-making process and stakeholder involve-ment to keep the project moving forward. Consequently, the dynamic work plan should contain:
C The intended technical approach; C Project goals; C A description of the initial conceptual site model; C An estimated time needed to complete each field task, including the mini-
mum and maximum depending on site conditions; and C A management plan for completing the field work.
In addition, EPA project managers using existing EPA contracts should request in the statement of work that contractors:
C Provide the qualifications of the proposed staff and subcontractors for EPA review before work on the project begins.
C Keep turnover of key personnel to an absolute minimum; and C Notify the project manager when there are key personnel changes and
provide the qualifications of replacement personnel for EPA approval.
While EPA may not specify the individuals the contractor will assign to a project, EPA may and should ensure that the contractor‘s proposed staff are qualified and appropriate for the required work. General guidelines for staff qualifications are provided in Section 3 of this chapter.
In addition to the dynamic work plan, there are a number of planning documents normally developed for site activities that should also be modified significantly to support a dynamic field activity, including:
C Sampling and Analysis Plan œ Quality Assurance Project Plan œ Field Sampling Plan œ Data Management Plan
C Community Involvement Plan.
A summary of the key activities that should be in the various planning documents for a dynamic field activity are provided in Exhibit III-1.
III-5

Exhibit III-1 Summary of Issues to be Covered by Project Planning
Documents for a Dynamic Field Activity
Planning Documents Dynamic Field Activity Aspect
Statement of Work (developed by project manager)
States that the preferred approach uses rapid data generation to support on-site decision making.
Contains type of experience and/or qualifications expected for each field activity.
Requests prime contractor to certify their review of subcontractor references for similar work.
Requests personnel turnover be kept to a minimum, particularly key personnel.
Dynamic Work Plan Describes the intended technical approach.
Provides estimates of the time needed to complete each field task, including a minimum and maximum range that would be controlled by the complexity of site conditions.
Describes the initial conceptual site model.
Explains the management plan for completing the field work.
Documents personnel and subcontractors‘ qualifications.
Describes measures to keep personnel turnover to a minimum, particularly key personnel.
Discusses how decisions will be made and the action taken documented.
Sampling and Analysis Plan
The QAPP, FSP, and DMP should be modified to accommodate flexibility in the field.
Quality Assurance Project Plan
Contains SOPs of all analytical methods.
Identifies QC requirements for all analytical methods.
Field Sampling Plan
Provides decision tree for how sampling will take place.
Provides alternative sampling/geotechnical techniques in the event the preferred method fails.
Data Management Plan
Provides a detailed discussion of data flow from sampling through measurement, validation, and display/evaluation.
Identifies potential bottlenecks and areas that will need special oversight/QC.
Community Involvement Plan
Discusses how the community will be expeditiously informed of decisions and/or findings that depart from the initial conceptual site model or remedial approach.
III-6

Oversight of Subcontractors
If the actual subcontractors have not been chosen at the time the dynamic work plan is submitted, the plan can reference the type of experience the prime contractor will be seeking for each subcontract. Because EPA personnel do not have a legal agreement or —privity of contract“ with a prime‘s subcontractor, EPA personnel may not approve or reject the prime‘s selection of a subcontractor. However, the project manager may specify the type of experience and/or qualifi-cations the Agency expects the contractor to provide for each field activity (i.e., DP, drilling, soil gas) to be performed under the statement of work. By including the specifications in the statement of work, it is incumbent upon the prime to adhere to these expectations when selecting its subcontractor. In addition, project managers should specify in their statements of work that the prime contractor requests and reviews client references for similar work, and that it certifies to EPA that the references have been checked. This certification will help ensure that appropriate personnel, capable of providing quality deliverables, are assigned to key roles. Once the subcontractor begins work, an EPA project manager that is dissatisfied with a subcontractor‘s performance or qualifications should raise these concerns directly with the prime contractor.
Documenting the Decision-Making Process
The project manager should also look for a dynamic work plan that discusses who will be involved in the decision-making process and how decisions will be documented. In some situations, formal Decision Memoranda may be appropriate. In other situations, less formal notes documenting meetings and the consensus decisions that were reached may be sufficient. In either case, the decision process should involve the project manager to avoid any disagree-ment about the direction the project should take and the Agency‘s approval of that decision. Documented concurrence from the EPA project manager is often key for PRP-led dynamic field activities. To help ensure that the decision-making process is efficient, the lines of communication and authority should be clearly outlined in the dynamic work plan. For example, a contractor should state how often (e.g., once a week) or when (e.g., a source area has been bounded) decisions will be made and documented. For small sites, these decisions should document approval of the work before demobilization. For large sites, periodic decisions help avoid the need for remobilizations after work has been completed at a particular location.
Sampling and Analysis Plan
Although the format for site plans can vary significantly among EPA regional offices and programs, the general issues covered within them is generally consistent. Whether a project plan is being written for a leaking underground storage tank site characterization or a CERCLA remedial action, the planning document(s) will discuss sampling, analysis, site access, security, contingency procedures, and management responsibilities. Depending on the scale of the
III-7
The dynamic work plan should discuss who will be involved in decision making and how decisions will be documented.

project, these issues may be covered in one document or several. For the purpose of explaining how these issues should be discussed within a dynamic field activity framework, these topics are considered part of the sampling and analysis plan (SAP). For large projects, sections of the SAP may be broken out into a number of separate and distinct planning documents, including a quality assurance project plan (QAPP), field sampling plan (FSP), and data management plan (DMP). Although the SAP may contain additional sections, such as a health and safety plan, this discussion is limited to sections of a SAP that will be significantly modified to accommodate a dynamic field activity. As with any project, a copy of the approved SAP should be maintained at the site for reference.
Quality Assurance Project Plan
The QAPP describes the policy, organization, functional activities, and QA/QC protocols necessary to achieve the project data quality objectives (DQOs -see glossary for definition). A more detailed discussion of QA and QC considerations for field-based analytical methods is found in Chapter IV. In over-seeing the development of a QAPP for a dynamic work plan, project managers should request that discussions of the following issues be covered:
C Contingency procedures; C Decision-making procedures; C Standard operating procedures; C Quality control samples; and C Field laboratory audits.
Contingency Procedures
As the project team refines the conceptual site model, specific field-based analytical methods may not be able to continue meeting project requirements due to a number of site conditions, including newly identified analytes, problems with matrices, or changing weather conditions. Consequently, the project manager should ensure that the QAPP discusses the circumstances that would lead to a transition between field-based analytical methods and how this transition would be made with a minimal disruption to the field work. This discussion should clearly show that the new field-based analytical method is capable of meeting project data objectives under the new conditions. Since all situations cannot be anticipated, it is imperative that the planning team members be sufficiently experienced to be able to successfully react to unplanned conditions and to recognize when a project should be stopped so that a satisfactory plan of action can be developed. The Loring Air Force Base case study summarized in Chapter V provides an example of a dynamic field activity that made a smooth transition between analytical methods when their initial choice was not performing as expected. By having the contingency thoroughly evaluated and discussed in the
III-8

approved QAPP, switching field-based analytical methods resulted in little loss of time for that project.
Decision-Making Procedures
The project manager should ensure that the QAPP explains how the results from the proposed field-based analytical method will be used to support decision making. This discussion should include a full evaluation of the analytical capabilities of all selected and contingency methods, including matrix interferences, frequency, and type of QA/QC needed; and estimated quantitation limits, so that the project manager understands and can justify the use of particular methods for on-site decision making.
In order to eliminate misunderstandings between the field team and EPA, the QAPP should also discuss the type of decisions that should be made in conjunction with the Agency and the type of decisions that are merely routine adjustments to the QAPP and may be made without prior approval. For example, the decision to stop using a particular field-based analytical method in favor of a contingency procedure may require input from the Agency, whereas the decision to correct an error in an analytical procedure by rerunning a sample should not require Agency consultation.
Standard Operating Procedures
Standard operating procedures (SOPs) for field-based analytical methods prepared in support of a dynamic work plan should contain site-specific details that go beyond the manufacturer's specifications. For instance, calibration standards for immunoassay test kits should be matched to the site‘s decision criteria in order to provide useful information. Likewise, soil preparation procedures should match the data quality needed for specific decisions, particularly for methods such as XRF or immunoassay.
There should also be an SOP for all analytical methods that will potenti-ally be used, or reference a document already on file with the Agency, because of the need for project-specific information on how methods will be run. This recommendation is in line with the existing EPA policy that laboratory SOPs be submitted along with the QAPP. In general, both fixed and mobile laboratories should be able to easily comply with this requirement by using or modifying existing SOPs. Many other SOPs can be found on a number of web sites, as listed in Chapter IV under Principle Method Selection Process. Project managers should note that simply citing an SW-846 method does not fulfill this recom-mendation because many of these methods are merely summaries and most provide several options that the analyst can choose from. The SOPs need to describe the specific method used so that analysts can be interchanged,
III-9
The QAPP should outline the decisions that can be made by the field team, the appropriate documenta-tion needed, and the types of decisions that call for consultation with EPA.

modifications can be made easily when needed, and defensible documentation can be provided.
In addition, the SOPs should be located near the respective on-site instru-ments for reference. If method modifications are necessary in the field, the process for documenting these changes should be specified in the project communication and documentation strategy just as is normally the process for documenting changes to sampling SOPs. Additional information on developing SOPs is provided in existing EPA guidance (U.S. EPA, 2001a).
Quality Control Samples
Project managers should expect a QAPP that includes a discussion of the number and types of QC samples that will be used to demonstrate that field-based analytical methods are meeting the project‘s acceptance criteria. This discussion should state how QC sample data will be documented and how they will be used to demonstrate analytical data defensibility. In particular, the discussion should explain how performance evaluation (PE) samples will be used with field-based analytical methods. As a starting point, QAPP developers should refer to Section 3 of Chapter IV for information on how QC samples can be used to support dynamic field activities.
Field Laboratory Audits
Field laboratory audits are often necessary for ensuring that field-based analytical methods are providing data at a level of quality that is expected and required. Consequently, project managers should ensure that the QAPP discusses the frequency and format of audits that will be performed and who will perform them.
Although the audit should involve the project‘s technical team leader who is in a position to make the necessary changes rapidly, the individual selected to do the audit should be independent of the project team. The individual may be a contractor staff chemist who was not involved in designing the investigation or a representative of the regional QA program. The results should then be evaluated by an Agency chemist or quality assurance specialist and reviewed by the project manager. Furthermore, if the field laboratory work will be performed by a subcontractor, the prime contractor‘s QAPP should include:
C An outline of the field laboratory audit formats and checklists; C SOPs that will be used by both the prime and subcontractors; C An outline of information to be included in the prime contractor‘s formal
field audit report to the Agency;
III-10

C The time frame within which audit reports will be produced; and C An agreement that the prime contractor will notify the Agency whenever
there is a change in laboratory personnel.
Field Sampling Plan
A field sampling plan (FSP) describes the types of samples to be collected, the method for collecting them, and the conditions under which additional samples will be collected. The FSP for a dynamic field activity should include:
C Contingency planning; C Decision-making procedures; and C Standard operating procedures.
Contingency Planning
As with the QAPP, the project manager should ensure that the FSP includes decision-tree contingencies that allow for expanding, contracting, or implementing a different sample design plan if the data indicate it is needed. The FSP should also address potential problems discovered on site and how they can be resolved quickly. Contingencies should include:
• Sample design contingencies (e.g., if —x“ is found then —y“ will follow; but if —x“ is not found then —z“ will follow);
C A discussion about the limitations of equipment and methods as well as the likelihood of encountering conditions that are affected by these limitations;
C The potential for equipment failure and how replacement equipment will be obtained; and
C A description of corrective actions to be taken when necessary.
For sampling design contingencies, if the field work calls for delineating the extent of contamination, the project manager should look for a FSP that also contains a description of the mutually agreed upon procedures (e.g., among the contractor, EPA project manager, and appropriate stakeholders) that will be used for responding to potential site scenarios as data become available. This program can often be presented in the form of a decision tree, such as the one presented in Exhibit III-2. When the planning team cannot construct a decision tree due to limited information at a very complex site, a discussion should be included that explains how different data outcomes will be addressed with sampling equipment and analytical instrumentation so that the Agency can pre-approve site activities, particularly at PRP-lead sites. Additional information on how to develop decision trees is provided in Section 2 of this chapter.
III-11
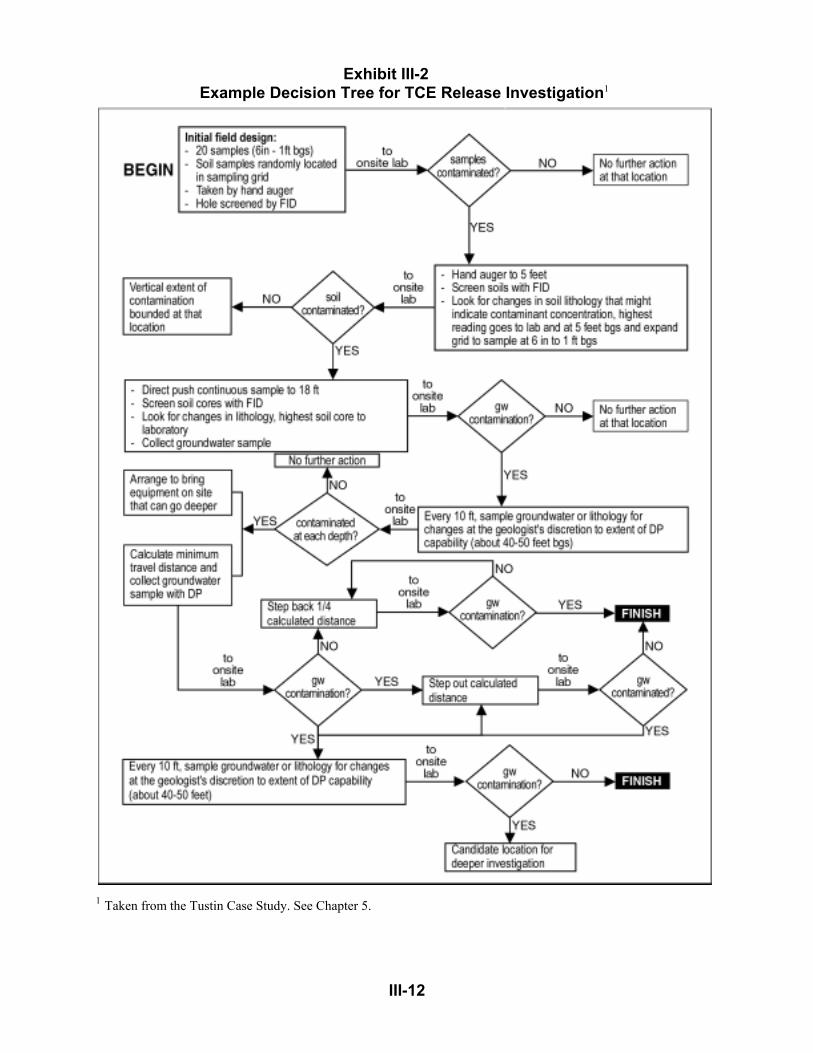
Exhibit III-2 Example Decision Tree for TCE Release Investigation1
1 Taken from the Tustin Case Study. See Chapter 5.
III-12

If the planning team needs multiple equipment contingencies, it should list them in order of preference with a brief explanation of how switching to the alternative would occur. For example, if the team proposes to take shallow groundwater samples with a direct push rig, the contractor should prepare a contingency method, such as the use of a hollow stem auger, in case the direct push rig has problems penetrating the formation to the required depth. They could also set up a contingency to use a more robust method, such as an air-rotary drill rig in case the hollow stem auger is unable to penetrate a particular formation. The discussion of each contingency method should be as complete as needed to allow pre-approval by the Agency and implementation in the field. Experienced staff may need to field test some methods before actual field work begins because site-specific conditions may result in some revisions. For example, if the planning team selects a direct push conductivity meter to delineate a contaminant plume, it should test the meter‘s capability of differentiating the uncontaminated soil from the contaminated soil.
Decision-Making Procedures
Project managers should expect decision-making procedures in the FSP that resolve coordination questions with the Agency. This section should discuss the type of decisions that will be made in conjunction with the Agency and the type of decisions that could be made without prior approval (e.g., routine adjustments to the planning documents). For example, if the field team concludes that contamination has seeped into a deeper aquifer than expected, the FSP may state that the technical team leader will request approval from the EPA project manager prior to taking action because the deeper investigation would commit a substantial amount of resources. On the other hand, the FSP may state that if the field team determines that several more shallow soil samples should be collected and analyzed to fully evaluate the level of soil contamination in a specific area, prior Agency approval would not be necessary.
Standard Operating Procedures
As with QAPPs, project managers should ensure that the FSP includes SOPs for all equipment and sampling methods that will potentially be used. Additional information on developing SOPs is provided in existing EPA guidance (U.S. EPA, 2001a). For EPA contractors, if EPA maintains a master copy of field SOPs, then the FSP need only reference them, although any site- specific changes should be noted. Regardless of who conducts the field work, a copy of the all the SOPs should be maintained at the site for reference.
III-13

Data Management Plan
The DMP describes how data will be managed and displayed. For conducting a dynamic field activity, project managers should look for DMPs to include discussions on:
C Communication strategies; C Data summaries; C Contingency procedures; and C Data format, entry, and display.
Additional information on procedures for data management can be found in Appendix X5 of ASTM 6235 (1998a) Quality Control for Field Data and Computer Records. In addition, data quality issues that should be considered in the DMP are provided in Chapter IV of this guidance.
Communications Strategies
The communication strategy identifies relevant people to contact and their reporting hierarchy so that new information can be transferred in a timely manner to the people who need it. The contact people should include regulators, contrac-tors, support organizations, PRPs, and community organizations. The strategy should indicate the anticipated frequency of communications among groups of individuals so that all participants understand their roles and responsibilities to transfer information. An example of a communication strategy is provided in Exhibit III-3.
Data Summaries
The DMP should state how data summaries will be prepared, what infor-mation they will contain, how frequently they will be generated, and who will review them. Examples of daily and weekly summary reports are presented in Appendix A. Project managers should ensure that stakeholders are consulted in the development of the data summary plan. Several key people may be designated to review data summaries at the end of each day. Data summaries for large or complex sites should include a meeting schedule among the EPA project manager, the technical team leader, and other key personnel on the implications of project findings. Presenting data summaries in an electronic format using visual software can enhance stakeholder understanding of the data summary reports and transfer the data quickly to project personnel. Issues related to the type of data provided in these summaries and to whom they should be provided are discussed Section 4 of this chapter under the title Data Exchange and in Chapter IV, Section 3, entitled Managing Data During a Dynamic Field Activity.
III-14

Exib
it III
-3
Ex
ampl
e C
omm
unic
atio
n St
rate
gy
III-15

Contingency Procedures
Contingency procedures described in the FSP and QAPP should be addressed in the DMP. Contingency planning in the DMP is important because data produced by different field equipment or different analytical instruments will need to be compatible with, or quickly adjusted to, the data management system. For example, the Loring Air Force Base cleanup summarized in Chapter V initially generated immunoassay PCB data that were entered into the database by hand. However, when a transportable GC replaced the immunoassay test kit, the data output became electronic. Because the central database had been configured to accept both, the transition occurred smoothly. The discussion of contingency procedures also should consider how the project team plans to modify their activities if information technologies fail, for whatever reason.
Data Format, Entry, and Display
Data management plans include a section on how data will be formatted, entered, and displayed. Typically, this section discusses the software packages that will be used, their capabilities, and their compatibility with other relevant systems (both for receiving data and for interactive access). For a dynamic field activity, project managers should look for a discussion on:
C QA and QC procedures for ensuring that the chemical data have been sufficiently validated before they are entered into the database; and
C How both the chemical and non-chemical data entered in the database (e.g., field pH, XRF readings, geological logs) will be compared to the original field collection forms before they are used.
ASTM (ASTM, 1998a), Appendix X5, provides additional information on maintaining quality control for field data and computer records.
Community Involvement Plan
The community involvement plan documents the history of community involvement for the site, the community‘s concerns, and a mechanism for sharing data with the local community. The need for developing a community involve-ment plan will vary among projects. Although it is a required document for many CERCLA activities at NPL sites, it may be beneficial for some projects (e.g., Brownfields), or not necessary at all for others.
When it is appropriate, the plan specifies decision points where stake-holders should be involved. For a dynamic field activity, project managers should look for a discussion on how the community will be informed if project activities change based on the acquisition of new information. The community
III-16

involvement plan should ensure that communities have a chance to review project plans including all activities and contingencies that are likely to occur at a site so that issues of concern can be resolved during the review and comment period. Where specific decisions require cooperation with the local community, the community involvement plan should specify when opportunities to discuss the potential situations, options, and acceptable activities with the community prior to the mobilization will occur.
For example, an on-site information officer may be appropriate if the field work is expected to continue for less than a week. If the field work is expected to continue significantly longer, the community involvement plan may consider a schedule for community meetings and a mechanism for distributing information (e.g., flyers). If the extent of the field work changes significantly because of the findings in the initial stages, the community should be informed and the process of involving the community should be thoroughly discussed. Additional guidance on working with communities is provided in existing EPA guidance (U.S. EPA, 2001d).
III-17

Section 2: Determining Funding Needs
One of the more difficult issues to resolve in planning a dynamic field activity is deciding on the funding level and allocating the necessary resources to achieve the project goals. In deciding on a funding level, project managers should consider how much is known about the site. When there is little information, there is an increased need for flexibility, contingencies, and resources. This section is designed to help project managers determine the funding level for these projects and provide information on three issues that are important for the acquisition of Agency resources:
C Developing an independent cost estimate; C Evaluating field analytical equipment needs; and C Addressing funding limitations.
This section is not intended to be a stand alone resource for estimating project costs and resource needs, rather, it should be used along with existing documents and in conjunction with existing practices, such as the Procurement Guide available at the Procurement Corner on the Brownfields Technical Support Center website (http://brownfieldstsc.org/). In addition, ASTM (1998a) provides some guidance on procurement and contracting.
Developing an Independent Cost Estimate
All statements of work necessitate that the EPA project manager and the contractor independently estimate the cost of performing the work. When using a staged approach, calculating direct costs is relatively straightforward because the work to be performed in the field is fixed. In contrast, because dynamic work plans are flexible, they, by definition, cannot describe all the specific work that will take place in the field. Consequently, it is much more difficult to estimate the total cost of field activities. To estimate the cost of a dynamic field activity, project managers may want to use the following three step process:
Step 1: Estimate the minimal work that will be needed; Step 2: Develop decision trees for the work that could take place; and Step 3: Develop a list of unit costs.
Step 1: Estimate Minimum Work That Will Be Needed
As a starting point, the cost of a dynamic field activity can be estimated the same way as a staged approach. The least amount of field work that will be needed is a known quantity and the cost can be easily calculated. Because the initial sampling and analysis will often need to test the accuracy of an initial
III-18
Although developing an accurate estimate of funding needs for dynamic field activities is more difficult than for staged field activities, minimum and maximum cost estimates can be systematically developed.

conceptual site model, the minimum number of samples needed and the type of analysis can be predicted. The main difference in managing the cost of a dynamic field activity versus a staged approach is that the field work generally does not end at this point.
Step 2: Develop Decision Trees
After considering the minimum work that will be necessary at a site, project managers can develop an estimate of the range of possible work at a site by developing credible scenarios (i.e., a prediction of the actual conditions that is neither optimistic nor worst case based on all available information) with the goal of fully funding the project and creating project decision trees based on them. An example of a decision tree is provided in Exhibit III-2. It is derived from the characterization case study summarized in Chapter V. This decision tree outlines the logical steps that the field team would take as they acquire more site data. In many cases, EPA project managers should consult with Agency technical experts to develop these scenarios and decisions trees. By completing the decision trees to their logical conclusions based on the credible scenarios, project managers can develop an estimate of the minimum and maximum amount of work that will be necessary at a site, including the approximate number of samples, types of analyses, and labor hours.
Step 3: Develop List of Unit Costs
To develop an estimate of the total cost for the site, the project manager should use the decision trees developed in Step 2 to determine the type of equipment and personnel needed for each scenario. With an itemized list, unit costs can be calculated for all anticipated and contingency equipment as well as analytical needs. Unit costs may include:
C Geophysical evaluations, generally charged on a per day or per week basis;
C Field-based analytical methods, generally calculated on a per day or per week basis:
œ Note that if the sample number is expected to be low, it may also be worth comparing the per sample on-site cost with the per sample off-site cost on a quick turnaround basis; œ In calculating this cost it is also very important to ensure that the sample generating capability matches the analytical throughput so that resources are not wasted by one group waiting another;
C Fixed laboratory analysis, generally on a per sample basis; C Drilling equipment, generally given on a per foot basis with specific set-
up costs for each location, or on a per day basis for additional sampling flexibility, along with a mobilization fee and cost for standby time; and
C Direct push rigs, generally per day, along with a mobilization fee.
III-19

In addition, project managers may need to include estimated costs to the prime contractor for soliciting contingency equipment or methods. After vendors or consultants are selected, the project manager should work with the prime contractor to refine costs. Sources of information about unit costs include Agency technical experts, such as those on the Field Analytical Support Programs and the Environmental Response Team (ERT), as well as vendors. A variety of field analytical method vendors can be found at http://www.epareachit.org or the Environmental Technology Verification website at http://www.epa.gov/etv.
Evaluating Field Analytical Equipment Needs
An important element of the costing effort is evaluating what field analytical equipment will be needed and how it will be accessed. Accordingly, EPA project managers should determine if the Agency has the necessary analyti-cal equipment and whether it can be used for the entire period of the project. Internal Agency sources of analytical equipment include the Regional Science and Technology Divisions; Field Analytical Support Programs; and ERT. If the work will be completed in-house and the equipment is not already on hand, the Agency may conduct a cost-benefit analysis of buying or renting the equipment. As part of this analysis, project managers should evaluate whether acquiring a controlled space, such as a trailer or building, will be necessary and how equipment operators will be obtained.
Renting Analytical Equipment
The ease of obtaining some types of rental equipment may favor it over purchasing. However, rental equipment can cost much more than buying equip-ment if it is used for an extended period. Also extra care is needed to ensure that rental equipment is in good repair. If the project manager decides to rent the analytical equipment, there are a couple of options that may be considered. The first option is to rent from a rental company. However, with this option, the project manager should have access to a trained instrument operator (e.g., EPA staff, ESAT/FASP contractors, Army Corps of Engineers) since the vendors generally do not provide personnel. The second option is to rent the equipment as part of a mobile laboratory from a vendor specializing in environmental mobile laboratories. Depending upon the vendor, this arrangement may include an operator. The choice between the two options depends upon the size of the project and the complexity of the contaminant matrix that needs analysis.
Weigh the cost of renting verses purchasing equipment.
III-20

Buying Analytical Equipment
The decision to buy equipment may be made on a project-by-project basis or in the context of the overall program depending on the cost of equipment and the scope of an individual project. For example, purchase of a spectrophotometer, costing $5,000, to improve the accuracy of immunoassay analyses makes sense if the project expects to analyze a significant number of samples (e.g., greater than 100) because the cost per sample would still be very competitive relative to off-site analysis, and the instrument would be available for use on other projects. On the other hand, the purchase of a portable GC, costing $25,000, would probably be done on a program-wide basis because very few projects would provide a sufficient number of samples to justify such a large expenditure. Consequently, the decision to buy and maintain equipment is often based on whether there are many sites on which the instrument can be used or whether one project can absorb the total cost.
If purchasing equipment is being considered for a project, the EPA project manager should consult with the EPA project officer, contracting officer, and regional QA/laboratory staff as soon as possible to prevent procurement delays and ensure that the equipment is appropriate for the anticipated field work. This process should be handled during the project planning process because procure-ment can be difficult to accomplish within the tight schedules of dynamic field activities.
Acquiring a Controlled Space
When analytical equipment is needed on site, project planners should consider the need for controlled space. A controlled space is particularly impor-tant for transportable equipment, such as a laboratory grade GC or XRF. If the space needs to be provided, then this cost, including a power source, should be added to the analytical cost estimate. Project managers should determine whether any local, state, and federal regulations apply to the set up and operation of mobile laboratories. Examples of projects that set up field laboratories are provided in Chapter V. For the characterization case study, a small laboratory trailer was rented. In the cleanup case study, an unused building was provided at no cost to the project.
Acquiring a Qualified Analytical Equipment Operator
When costing out the analytical equipment, project managers should include the cost of the operator because most field-based analytical methods need well-trained operators to ensure consistent results. While the operator does not have to be a chemist, having a chemist can provide an additional level of QC that a lesser-trained technician may not be able to provide for some field-based
III-21
Consider the need for a controlled space: building? trailer? back of a truck?

analytical methods. The Environmental Technology Verification reports at http://www.epa.gov/etv/verifrpt.htm provide a discussion of the minimum training needs for the instruments that they have evaluated.
Addressing Funding Limitations
If more funds are needed than are available for the project after costing the most credible scenario, the project manager should consider whether funding could be spread over multiple budget cycles using a dynamic phased approach. Under this scenario, the project manager scopes an addressable phase (constrained by budget) but uses a dynamic approach. This funding method should result in a portion of the field work being done with greater data certainty and in less time than using an approach without on-site decision making. The potential benefits of the process are significant, regardless of the scale that the project manager chooses to use.
For example, if a site were divided into two operable units, one being soil contamination, and the other being groundwater contamination, a dynamic field activity could be planned for the soil contamination first. Once that work was complete, a dynamic field activity could be planned for the groundwater con-tamination. Although an approach using different phases would take longer than a dynamic field activity of the entire site, it would likely be faster and more cost effective than a staged field activity.
In addition, EPA managers may find that they can accomplish more of their programmatic goals and address a greater number of sites more quickly by targeting a limited number of projects with an on-site decision making strategy. Although this approach may have an appearance of fewer accomplishments in the short-term, over several years it has the potential of demonstrating signifi-cantly more completions than a program dedicated to staged field activities.
Dynamic field activities are not —all or nothing“ events. Activities can be broken out according to funding limitations while still providing a benefit to the project as a whole.
A programmatic-wide shift to using dynamic field activities has the potential to demon-strate significant accomplishments over a period of several years.
III-22

Section 3: Ensuring the Selection of Qualified Personnel
Project managers should work closely with their contractors to ensure that the contractors select qualified contract personnel because choosing staff with the appropriate experience is an essential part of conducting a successful dynamic field activity. This section provides information on the types of personnel that project managers often need to evaluate when preparing for a dynamic field activity. As such, it should help them negotiate with their contractors for qualified personnel for their projects. Types of personnel include:
C Planning team members; C Field team members; and C Staff of speciality technical firms.
The composition of the project team for a dynamic field activity will depend on the size and complexity of the site. Consequently, the guidelines below are provided merely to give project managers and contractors a general idea of the type of expertise they will need. None of these guidelines are intended to be used as requirements on any particular project, particularly the guidelines on years of experience. In some cases, individuals with fewer years may be qualified for specific positions because of the quality of their experience or knowledge, or because of the complementary experience of other team members. Likewise, some individuals will not qualify for certain positions in spite of their years of experience because the project may be particularly difficult or their experience may not match specific requirements of the site. Thus, team member qualifications should be viewed in the context of the team rather than as individuals with highly defined roles. For example, if the technical team leader has strong hydrogeology and fate and transport skills, the experience level of other team members who have these expertises could be considerably lower than if the technical team leader had only a general understanding of these issues.
When a contractor is designated to carry out the work, it is the contractor‘s responsibility to propose staff it believes capable of executing the work in a fashion that meets project objectives (U.S. EPA, 2000c). Consequently, state-ments of work developed by EPA project managers need to be very specific in describing anticipated site conditions and the types of experience that will be needed to assist contractors in choosing appropriate skill levels. If the proposed individuals/skill levels are widely different from those outlined in the following section, then there may be a misunderstanding concerning the complexity of the site. Project managers should consider meeting with the contractor to ensure full understanding of site complexities and performance expectations to enable the contractor to propose a team sufficiently qualified to successfully complete the project.
Accessing qualified staff is essential for the execution of a successful dynamic field activity. managers should insist on specific staff qualifications for their projects.
Project
III-23
Planning Team Member Responsibilities and Qualifications
The planning team represents the project‘s most experienced staff who are responsible for the technical quality of work plans, field work, subcontractors, and final deliverables. Project managers should inquire, either formally in writing or in discussions with the contractor, whether planning team members have ever run projects using on-site decision making. Although experience with these projects may not be a requirement for every individual, as a group, they should have enough experience to understand where potential problems may occur and be capable of taking corrective action. In addition, contractors should be advised that key individuals proposed in a work plan will be expected to staff the project from planning through execution because dynamic field activities are dependent on team members understanding site conditions and being able to make recommendations rapidly. This point is particularly important for the core group of planning team members that have the greatest impact on site decisions. When staff turnover is high, the ability of a team to meet this criteria is severely affected. Likewise, project managers should request in a statement of work that they review team member qualifications and approve replacements if any changes in staffing occur.
The planning team may include the following positions:
C Technical team leader; C Project hydrogeologist/geologist; C Project chemist; C Environmental engineer; C Geophysicist; C Risk assessor (human health and/or ecological); C Statistician; C Quality assurance specialist; C Community involvement coordinator; C Health and safety specialist; C Information technology specialist; and C Data management specialist.
For large projects these positions may be filled by separate individuals; however, for small projects, one person may be able to fill several roles. For example, the technical team leader may also be the project hydrogeologist, geo-logist, or geophysicist while the project chemist might also fill the roles of the risk assessor, statistician, and health and safety specialist. These individuals may be assisted by less experienced staff who help draft documents. However, the planning team members should be responsible for the technical content and accuracy of the documents. In addition, planning team membership may depend on the urgency of the field work. For example, a time-critical removal action may rely only on an expert risk assessor or QA specialist for plan review rather than plan development. A summary of the qualifications for planning team members is provided in Exhibit III-4.
III-24
A core group of technical staff, such as the technical team leader, project hydrogeologist, and project chemist, should commit to working on the project from project planning through the submission of the final report.

Exhibit III-4 Summary of Planning Team Member Qualifications
Position Suggested Minimum
Experience (years)
Special Qualifications for Conducting Dynamic Field Activities
Technical team leader
5 to 10 A cross-trained and experienced individual who can quickly integrate information from multiple disciplines to guide field activities.
Project hydrogeologist/ geologist
5 to 10 At least 3 years involved in interpreting chemical, geological, and hydrogeologic environmental data.
Experience using direct push technologies.
Ability to integrate data from various sources and disciplines.
Project chemist 5 to 10 At least 2 years involved in QA/QC activities that involve conducting laboratory audits.
Specific knowledge of field analytical equipment that is proposed to be used on the project.
Project environmental engineer
$3 Qualifications are the same whether dynamic or staged approaches are used.
Project geophysicist
5 to 10 Capable of selecting techniques, determining where they should be applied, and evaluating conclusions provided by subcontractors.
Experience conducting QA/QC audits of the subcontractors during their work performance.
Risk assessor 3 to 5 Qualifications are the same whether dynamic or staged approaches are used.
Statistician 3 to 5 Experience choosing appropriate sample support strategies, providing advice on overcoming sample design uncertainties, designing background sampling strategies, and working with the statistical techniques laid out in EPA guidance.
Community involvement coordinator
Not Applicable
Experience dealing with a variety of community outreach issues and situations.
Demonstrated ability to react quickly.
Health and safety specialist
1 Qualifications are the same whether dynamic or staged approaches are used.
Information technology specialist
Not Applicable
For real-time visualization software, this person should have extensive experience with both the proposed hardware and software packages.
Data management specialist
2 to 3 Coordinates with other team members to ensure data transfer is compatible and usable.
III-25

Technical Team Leader
The technical team leader is responsible for the overall development of work plans, execution of field activities, data evaluation, and final deliverables. For small projects this individual may also fill the role of the contractor‘s project manager; however, for larger projects, the administrative duties of this position are likely to be too much for the technical team leader to manage. The technical team leader should be a cross-trained, experienced individual who can quickly integrate information from multiple disciplines to guide the investigation activi-ties. This individual has the final decision-making responsibilities in the field and is responsible for communicating those decisions and/or recommendations to the Agency. Technical team leaders are also responsible for ensuring that field audit activities are carried out as needed. Often, CERCLA on-scene coordinators (OSCs) perform the role of technical team leader for the Agency. In these instances the contractor‘s team leader may not need to meet the requirements described in this document. As a guide, technical team leaders should have the following minimum level of experience:
C For small, uncomplicated projects (e.g., a 600-cubic yard surficial dig-and-haul removal action), 5 years of actual field experience with 3 years as a field project leader.
C For large or complex sites, 10 years of field investigation or remedial/ removal action experience with 5 years of technical project management (as opposed to administrative project management) and data interpretation/integration experience.
C For characterization work, the experience shown should be in assessing geologic, hydrogeologic, and chemical data and directing field work.
C For cleanup, the experience shown should be in design and/or installation and operation of remedial technologies with emphasis on the technology that will be used at the site.
General project management (e.g., office level or non-environmental) experience should not count toward the years of experience for this position. In addition, technical team leaders may have a core discipline that matches one of the specialties discussed below (e.g., hydrogeologist, chemist, geophysicist) and fill both roles when project requirements do not necessitate separate full-time commitments for the positions.
Project Hydrogeologist/Geologist
The project hydrogeologist/geologist should have 5 to 10 years of experi-ence in site investigations, with at least 3 years field experience involved in interpreting chemical and hydrogeologic environmental data, including knowledge of field and laboratory methods for measuring subsurface hydrologic properties (e.g., performing and interpreting aquifer tests). If sampling will be
III-26
The technical team leader should be cross-trained and very experienced because this individual is responsible for: evaluating data, making field decisions, and providing recommendations to EPA.

conducted within unconsolidated soil, the hydrogeologist should have experience using direct push technologies and be familiar with their rapid sampling and data collection capabilities. Depending upon the complexity of the site, the project hydrogeologist/geologist may or may not be needed in the field. If the individual being considered for this position does not have a strong background in both environmental geology and hydrogeology, it may be necessary to fill this position with two people.
Project Chemist
The role the project chemist plays in site activities can vary from being on site, overseeing or running analyses, and providing continual data interpretation to the technical team leader, to being off site, providing consultation as requested. This person should have 5 to 10 years of experience working with environmental analytical methods, including at least 2 years in QA and QC activities that involve conducting laboratory audits. In addition, the project chemist should have specific knowledge on the operation of any field analytical equipment that is proposed for use.
Project Environmental Engineer
The amount of experience necessary for a project environmental engineer can vary greatly depending on the type of project, however, 3 to 5 years of experi-ence is generally sufficient for determining the data needs for a remedy evalua-tion. The experience needed to design and install a remedial technology may be significantly higher, depending on the size and type of remedy.
Project Geophysicist
For projects that involve investigations, the planning team often includes a project geophysicist who has 5 to 10 years experience using geophysical methods for environmental work. Generally, project geophysicists oversee the work of subcontractors, and in doing so, they select the methods that will be used, deter-mine where they will be applied, and evaluate conclusions provided by subcon-tractors. Consequently, they should have experience providing recommendations on how subcontractors‘ conclusions will affect the overall investigation and have demonstrated capability in conducting QA and QC audits of the subcontractors during their work performance.
III-27

Project Risk Assessor (Human Health and/or Ecological)
The project risk assessor should have at least 3 to 5 years of experience in conducting risk assessments. An ecological risk assessor should also have suffici-ent field experience to provide necessary guidance on the collection of biota. Project risk assessors are generally not needed on site during a field activity, but in the case of ecological risk assessments they may need to supervise the sample collection to acquire the correct sample population. Since the data needs for risk assessments are the same whether or not a project is dynamic, there are no special qualifications for this position.
Project Statistician
The project statistician should have 3 to 5 years experience assisting in the design of environmental sampling strategies and choosing appropriate statistical tests for evaluating data usability. This experience should include providing advice on overcoming sample design uncertainties, designing background sampling strategies, and working with the statistical techniques laid out in EPA guidance (U.S. EPA, 2000a). This individual is not needed on site but may need to be available for consultation, particularly if assumptions about contaminant distribution are found to be inaccurate after the field work has begun.
Community Involvement Coordinator
Community involvement coordinators generally need to be more proactive during a dynamic field activity than for a staged field activities because of the rapid decision making and the flexible work planning aspects. Consequently, they should be able to react quickly to site information and have very good communication skills so that information coming from the field work will not adversely affect the community support for the project. To adequately address these changing circumstances, the planning team should have an individual who has successfully dealt with a variety of situations in conducting community involvement activities. Guidelines for years of experience cannot be provided for this position because some important skills, such as good facilitation skills, good written and oral communication skills, and, most importantly, sensitivity to the needs of the community are not necessarily acquired through experience.
Health and Safety Specialist
There are no special qualifications beyond the normal requirements for health and safety specialists overseeing a dynamic field activity because exposure issues are essentially the same for any field work. As with all contaminated site activities, this person should have American Conference of Governmental and
III-28
Industrial Hygienists certification. One year of experience should be adequate for this position.
Information Technology Specialist
Depending upon the size of the project, the data management needs can vary from producing in-plan maps with several data points to real-time visualiza-tion modeling involving thousands of data points. If the project manager chooses to use real-time visualization, it is imperative that the information technology specialist have extensive experience with both the proposed hardware and software packages, since there will be very little time to troubleshoot unforeseen problems once the project begins. This level of experience differs from a staged approach because dynamic field activities need to access data within a shorter timeframe. No guidelines on qualifications can be provided because information technology hardware and software change rapidly. Instead, experience with the particular hardware and software package that will be used at a site (including those used by the particular site field-based analytical methods) is more important than years of experience.
Data Management Specialist
The data management specialist should have 2 to 3 years experience in planning and managing data flow and storage for projects of equivalent size and complexity to the one being planned. Together with the project chemist and hydrogeologist, the data management specialist will either choose the appropriate off-the-shelf software or develop a storage and retrieval program using off-the-shelf database software. In either case, the system needs all appropriate data entry fields and it needs to be compatible with other data systems (e.g., GIS, models, laboratory equipment outputs).
Field Team Member Responsibilities and Qualifications
The field team consists of members of the planning team who should be involved with the daily site activities along with additional technical support staff and subcontractors who implement the project. It is imperative that planning team members whose involvement is needed only periodically, be available for consultation whenever their input is needed. With the use of modern communication technologies, remote involvement is both feasible and cost effective.
Dynamic field activities necessitate more scrutiny of field team member qualifications because these members play a key role in the decision-making process, and their recommendations can greatly influence the direction field
III-29

activities take. This section provides some basic information on the responsi- bilities and qualifications of the field team staff who are not part of the planning team. These positions include:
C Field analytical equipment operators; C Field geologist; C Field technician/sampler; and C Specialty samplers.
During small projects, active participation of the planning team in the field is generally confined to the technical team leader. As the project grows in complexity, more members of the planning team may need to be in the field, especially if real-time visualization tools are not being used. In this event, the staff most likely to be needed in the field full-time would include the project chemist, hydrogeologist, and geophysicist. A summary of the qualifications for field team members is provided in Exhibit III-5.
Exhibit III-5 Summary of Field Team Member Qualifications
Position Suggested Minimum
Experience (years)
Special Qualifications for Conducting Dynamic Field Activities
Field analytical equipment operator
1 A chemistry background with data evaluation experience is desirable but not required.
If not a chemist, have access to an experienced chemist who can troubleshoot analytical problems.
Field geologist 1 to 5 Qualifications are the same whether dynamic or staged approaches are used.
Field technician/ sampler
0 to 2 Qualifications are the same whether dynamic or staged approaches are used.
Specialty samplers
0 to 2 Qualifications are the same whether dynamic or staged approaches are used.
Field Analytical Equipment Operators
Generally, field analytical equipment operators should have completed at least 1 year performing field-based analyses with the equipment to be used. Classroom experience can count toward the total experience, particularly if hands-on training has been provided, but it should not constitute the only experience unless a more experienced equipment operator is directly supervising
III-30

the work. A chemistry background with data evaluation experience is desirable but not required. In addition, if the operators are not chemists themselves, they should have access to an experienced chemist who can troubleshoot analytical problems.
Field Geologist
The field geologist will generally be responsible for logging soil borings; overseeing well installations; performing slug or pumping tests; and taking or overseeing soil, surface water, and groundwater samples. As a guide, this position needs mid-level staff (e.g., 3 to 5 years experience) unless supervision is also provided, in which case entry-level staff may be acceptable (e.g., 1 to 2 years experience).
Field Technician/Sampler
When additional staff are needed for activities that do not require an in-depth knowledge of the science behind the activity, such as a routine sampling event, planning staff often select field technicians/samplers. If they are in the field without supervision, they should have at least 2 years experience. If proper training and supervision are provided, then no additional experience is necessary.
Specialty Samplers
Speciality samplers, such as those needed to conduct biota sampling or tidal/estuarine sampling, are occasionally needed for ecological evaluations. The individuals responsible for managing the collection of these samples should have knowledge of the area of concern, be familiar with the specific ecosystem they are sampling, and be on site during the sampling event to do the sampling or super-vise others. Specialty samplers who are in the field without supervision should have at least 2 years experience. These individuals are generally reached through subcontracts with local area firms or with local college staff because they generally have a better understanding of unique regional-specific conditions.
Selecting Technical Specialty Firms
Technical specialty firms are companies that supply equipment and personnel for specific activities that are not readily available in-house or through a prime contractor. Examples of the type of services provided by technical specialty firms include soil gas sampling, mobile laboratory analysis, geophysical surveys, direct push soil and groundwater sampling, and cone penetrometer rigs with laser induced fluorescence (LIF) analysis.
III-31

As with the selection of other personnel, the project manager should examine the qualifications, availability, and capacity of the proposed specialty technical firm personnel to ensure that they are capable of meeting project requirements. The project manager should discuss the proposed work plan with the prime contractor and subcontractor (technical specialty firm) representatives. To prepare for this meeting, the project manager may request that the prime contractor complete a worksheet, such as the one presented in Appendix B, for the specialty technical firms. They may also ask the prime contractor to check refer-ences and provide examples of reports that the proposed firms have completed to review their capabilities. During the meeting, the project manager should specifically ask how contingencies will be resolved and determine if the firm is capable of implementing the field work to the full extent of the contract (e.g., if the work plan states the need for one DP rig during a two month period with a contingency for up to three DP rigs at some point in that same period, they should have the capability to supply them). If there are any questions about the firm‘s ability to handle a full work load, then the prime contractor may need to establish multiple subcontracts as backups to provide the same service.
III-32

Section 4: Preparing and Overseeing the Field Work
Managing dynamic field activities generally involves more preparation and oversight than a staged approach because the field work needs to be structured as an intensive effort for a short duration. In addition, because significant decisions are made during the field work, project managers need to be involved in reviewing data on a regular basis. Consequently, project managers need to ensure that the resources they will need during the field work are arranged prior to the mobilization so that field work can progress as smoothly as possible. The following program areas are particularly important for a project manager‘s preparation and oversight of a dynamic field activity:
C Organizing a kick-off meeting; C Obtaining commitments for technical consultation; C Developing decision points; C Establishing a meeting schedule; and C Preparing for data exchange.
Organizing a Kick-Off Meeting
The project manager should organize a kick-off meeting to discuss the issues that are important for the successful implementation of the project once organizations involved with the project have been determined and the decision makers from each group have had a chance to review the existing site data. Although kick-off meetings are important for any field work, they are essential for dynamic field activities because the success of these projects are particularly dependent on up-front planning and acceptance by all stakeholders. EPA project managers should arrange to have Agency technical personnel attend the kick-off meeting to discuss the work plans and the overall approach to the field work. Agency attendees and Agency representatives should be defined on a project-specific basis and may include a project manager, chemist, hydrogeo-logist, contracting officer, risk assessor, and quality assurance officer. All other organizations involved in the project implementation should send their decision makers as well so that each perspective is represented. In addition to the areas normally covered at a kick-off meeting, the following are important issues to discuss when planning a dynamic field activity:
C Roles and responsibilities, including the level of involvement of different team members and how that relates to the communication strategy (e.g., who will be involved in detailed decisions and who will only be consulted on decisions that involve a change to existing plans);
Project managers or their representatives need to be involved in reviewing field generated data on a regular basis.
The kick-off meeting is critical for establishing communication among stakeholders and developing consensus on how a project should proceed.
III-33

C Field work objectives and boundaries to the scope of work (e.g., characterization of soil contamination only? stay within property boundaries? complete characterization?); and
C Overall approach to the field work (e.g., is a dynamic strategy appropriate for the site at this time?).
Obtaining Commitments for Technical Consultation
For most types of field work, project managers often need to consult with chemists, hydrogeologists, engineers, and QA specialists, among others, to evaluate work plans and review reports because they are generally not technical experts in multiple fields. Additional technical consultation is often needed during the field work of a dynamic field activity since data are interpreted as they are collected and decisions about the appropriate course of action made accordingly. Consequently, project managers should prepare for a mobilization by assessing the need for expert input during the mobilization and obtaining the appropriate commitments. The number and level of involvement of these technical experts will vary with the size and nature of the project. To facilitate the rapid flow of information and decisions, oversight teams may be needed for PRP-lead sites, and technical review teams may be needed for Agency-lead sites.
Oversight Teams
For PRP- and Federal Facility-lead sites, technical consultation will gener-ally take the form of an oversight team. The purpose of the oversight team is to provide an independent evaluation of the site activities and field team recom-mendations. The oversight team may consist of Agency experts, Army Corps of Engineers staff, or contractors with no conflict of interest in the site. The charac-terization case study described in Chapter V provides an example of how an oversight team for a Federal Facility-lead site may function. In this case study, the oversight team consisted of an Agency hydrogeologist, chemist, QA officer, risk assessor, and Agency project manager.
For dynamic field activities to function effectively at PRP and Federal Facility sites, there should be a high degree of coordination, trust, and communi-cation between the project lead and the oversight team because the PRP‘s techni-cal team leader provides the primary evaluation of the data and resulting recom-mendations. In contrast, the oversight team reacts to rather than formulates its own ground-level evaluation. The level of oversight team commitment will, of course, depend on the size and complexity of the site.
Technical Review Teams
For EPA-lead site activities that are performed by an Agency funded contractor, the EPA will still need Agency technical review team approval of
III-34

work plans and reports. The review team should be defined on a project specific basis and may include a QA officer, hydrogeologist, risk assessor, chemist, and environmental engineer. Depending on the size and complexity of the site, a dynamic field activity may also need these Agency technical experts to be involved during the field work. Accordingly, prior to the onset of field activities, the project manager should determine the type of technical expertise needed for review during the field work and make those personnel available through Agency resources (e.g., ERT, Tech Support, Office of Research and Development), contractors, or the Army Corps of Engineers.
Developing Decision Points
In order to reach and quickly resolve decision points during a dynamic field activity, project managers should ensure that decision trees consisting of a series of —if-then“ statements (see Exhibit III-2) are developed before the mobili-zation. Examples of decision points include:
C Identifying when and how characterization work should proceed; C Selecting when and where to place a monitoring well; C Changing sampling or analytical methods to account for unexpected
conditions; C Deciding that the field work has accomplished the objectives laid out in
the dynamic work plan and can be stopped; and C Deciding that cleanup criteria have been met and where characterization
should continue if action levels are not satisfied.
These decisions may have to be made within several hours and generally cannot be delayed longer than a day or two, depending on the size of the site and the type of work being conducted. For example, if a dry cleaner site is being investigated to delineate an area of PCE contamination emanating from only one source area, there would be little for a field crew to do if the decision about the next sampling location or installation of a well was delayed. On the other hand, the characterization of multiple contaminant source areas on a military base may not be significantly hindered by delays in decisions since a field crew could be diverted to other source areas while the issue is resolved. In either situation, however, the project manager, with the help of the technical review team, will need to stay sufficiently well informed about the progress of field work to make timely decisions based on the information presented by the technical team leader.
Establishing a Meeting Schedule
If the dynamic field activity will last more than a week, the project manager may need to establish a schedule for meetings to discuss progress and subsequent steps. The format and schedule of meetings may range from daily
III-35
Establishing decision points is extremely important for the success of a dynamic field activity.

telephone conversations to weekly face-to-face meetings. The amount of interaction will depend on the estimated number of decision points. For small sites with a single source in which the overall time in the field will be two weeks or less, a daily phone conversation may be all that is necessary. On the other hand, field work on a large site with multiple sources lasting several months may necessitate weekly teleconferences or bi-weekly face-to-face meetings. In some situations, the field work will benefit from having the project manager on site for continuous interaction with contractors rather than relying on intermittent discus-sions. Other factors involved in determining the number and type of meetings will be the cost of travel and the type of data management system that has been implemented for the project. The frequency of the meetings, type and format of information to be discussed, location and/or method of communication, and individuals to be involved, should be clearly stated in the planning documents. Regardless of the established meeting schedule, the project manager should also arrange to be contacted at any time during the field work when the project manager‘s input is needed.
Preparing for Data Exchange
Data exchange is important for the project manager to understand because dynamic field activities are controlled by the exchange of information. As discussed below, the project manager needs to establish two major data exchange topics before a project begins:
C Data required for decision making; and C Data transfer schedule and format.
Data Required for Decision Making
For EPA-lead sites, the EPA project manager should work with the planning team to determine what data will be required for making decisions and what format to use to eliminate extraneous data not needed to support decisions. For example, although data may be collected for a great many analytes to support various activities (e.g., modeling, determining what chemicals are present, or remedial technology screening), only one or two analytes may drive an investi gation. Consequently, decision makers may prefer to receive report summaries that concentrate on only the key analytes. On the other hand, technical team experts (e.g., project chemist, project hydrogeologist) will want to review a wide variety of data, such as turbidity levels for groundwater samples that were analyzed for inorganic constituents. If the field work is carried out by a PRP contractor, the project manager should expect the same kind of information in the PRP‘s dynamic work plan or data management plan as is provided for EPA-lead sites. The EPA project manager also will need information on when and what kind of data the PRP will provide the Agency as well as negotiated time periods in which the Agency has to concur or not concur with PRP recommendations.
The project team should decide what data will drive the site decisions so that the data manager can focus on the best way to provide it to them.
III-36

Data Transfer Schedule and Format
Project managers should decide how often they want to receive updates. This decision can range from continuous to biweekly; however, project managers should keep in mind that, in general, the more often updates are provided, especially in data visualization formats, the more the data transfer system will cost. Therefore, the project needs should be balanced with the cost of the system. The key to performing this analysis is to examine how often major decision points are expected and schedule the reviews accordingly. Both the technical team leader and the project manager should be aware that the regular meeting schedule does not replace the need for meetings caused by unexpected occurrences or special events.
Depending upon the equipment chosen, much of the data generated in the field, especially geologic data, should receive QC before being recorded. Each entry should be —fact checked“ before being used for modeling. ASTM‘s Expedited Site Characterization Standard (ASTM, 1998a) provides some guidance on procedures for QC of geologic and hydrogeologic data in Appendix X4. Project managers and technical team leaders should be aware that the integration of false data into a conceptual site model during a dynamic field activity can be very costly since the field team is able to react quickly to new information.
When project managers are determining the data transfer mechanisms and format, they should also consider interface problems between the field equipment and the software running the models or visualization. Remote viewing may also require software installation on Agency computers and the expertise to manipulate it. If an automated real- to near real-time system is chosen, the operators should be well trained, and a contingency plan should be in place in the event of a system failure.
A quick and easy way to transfer data is to have the technical team leader provide a data summary sheet at the end of each day. This sheet will touch on the major analytical and QA/QC results reported during the day and briefly describe the results of other field activities and findings (e.g., site stratigraphy, wells installed, cubic yards of materials removed). The sheet can then be transmitted to all concerned parties. Examples of daily and weekly data summary sheets are provided in Appendix A. Another possibility is to develop an —e-group“ in which all the information is stored and accessed by interested parties at a password protected website. The cleanup case study summarized in Chapter V provides an example of how this was accomplished. A number of EPA supported software programs that can facilitate this process are described in Chapter IV, including FORMS II LITE, FIELDS, and SADA.
III-37

Conclusion
Managing dynamic field activities necessitates a concerted and coordina-ted effort from all participating parties because clear communication and consen-sus decision making are essential for responding rapidly to unexpected site condi-tions. Project managers need to work closely with the contractors, independent technical experts, PRPs, and communities throughout the entire planning and implementation of these projects because they are primarily responsible for ensuring that these activities are handled appropriately.
In many respects, project managers need to be more involved in the details of a project when managing a dynamic field activity because decisions are needed during the field work. The proper planning and oversight of these activities involves a more intensive effort than is generally needed for a staged approach, but the end result should be a site that demands less Agency resources, both in time and money, to reach completion. In addition, the extra effort should also result in a better product that is less likely to cause unexpected problems in the future.
III-38

Chapter IV
Key Considerations for Meeting Project Requirements with Field-Based Analytical
Methods


Chapter IV Key Considerations for Meeting Project Requirements with
Field-Based Analytical Methods
Overview
Using data generated on site for on-site decision making is a simple concept that is intuitively appealing. It allows data gaps to be filled while equip-ment is still available to collect and analyze samples, thereby reducing additional mobilizations; it reduces overall project costs by decreasing the number of itera-tions for writing and reviewing both work plans and reports; and it can increase the level of certainty about site decisions by generating more data points with which to make decisions (Crumbling et al., 2001). Unfortunately, this process has been underutilized in contaminated site programs for a number of complex reasons. One of the greatest barriers has been the perception that data generated on site can only be used for screening purposes because they cannot withstand judicial scrutiny. In reality, however, field generated data can be used for making site decisions as long as they meet a level of scientific defensibility that is appropriate for the decision being made. Adequate quality control procedures can be used to ensure that the data generated meet project requirements and modern data management methods can provide the needed supporting documentation. As long as the data can be determined to be scientifically defensible, it can generally be considered legally defensible.
This chapter provides project managers with an overview of data quality issues that affect the use of field-based analytical methods (FAMs). The chapter also provides explanations of how FAMs can be effectively integrated into the overall data quality process within an on-site decision making framework. This chapter cannot substitute for the presence of an experienced chemist or QA/QC expertise on the planning team; rather, it is designed to complement existing guidance already developed by EPA by focusing project managers on ways they can meet project requirements with FAMs. As such, it includes the following three sections:
C Selecting FAMs; C Applying quality assurance and quality control to FAMs; and C Managing data during a dynamic field activity.
The quality of data is not limited to the performance criteria of an analytical method. Rather, it reflects the success of the entire data quality program which considers all aspects of the sampling and analysis process, including sampling design, because the number and type of samples to be collected should be sufficient to provide a representative measurement of the true value of the contaminants present. Analytical methods and performance criteria
IV-1
Field-based analytical methods, with careful planning, can produce data of suitable quality, both technically and legally defensible, for making decisions.
Field-based analytical methods help to improve a project‘s overall data quality by increasing sample density and improving the selection of sample locations.

can vary greatly at a single site, depending on the end use of the data. However, as long as the data meet the project data quality requirements, they are considered acceptable. FAMs can be used to improve the quality of a data set in at least two ways:
C By increasing the number of samples that can be collected and analyzed with the same analytical budget, they provide greater confidence that contaminated areas are adequately characterized; and
C By providing rapid turnaround data, they allow better selection of subsequent sample locations to quickly fill data gaps and address data quality problems.
Although fixed laboratories and standard analytical methods can be used to support dynamic field activities, they are not discussed in this chapter because QC protocols for these methods are well established. However, they may play an important role in:
C Providing supporting documentation through the use of confirmatory analysis;
C Providing a means for validating a FAM modification, or FAM development prior to mobilization; or
C Providing data for on-site decision making when FAMs are not available or cost effective, and project turnaround times can cost-effectively be met.
As with all projects, a successful dynamic field activity starts with syste-matic planning. EPA has developed guidance on how to use a systematic plan-ning process for contaminated site activities (U.S. EPA, 2000a). Project managers interested in developing a dynamic work plan and implementing a dynamic field activity should work with someone who is experienced in using a systematic planning process. Although dynamic field activities are not appropri-ate for all situations, particularly if site knowledge is extremely limited or analyti-cal methods are not available to support their use, project planners should under-stand what is necessary for a dynamic field activity and they should be encouraged to consider it as an option from the very beginning. Readers interested in reviewing data quality objectives (DQOs) developed for a dynamic field activity can refer to http://www.epa.gov/superfund/programs/dfa/casestudies to view the DQOs for the Marine Corps Air Station Tustin characterization that is summarized in Chapter V.
Field-Based Analytical Method Benefits
œ Allow more analysis for same or less cost.
œ Make data available to direct sampling.
œ Resolve data quality problems quickly.
Systematic planning is essential for the success of any project.
IV-2

Section 1: Selecting Field-Based Analytical Methods
The process of selecting a FAM for a dynamic field activity is very similar to the process of selecting any method for a staged field activity. However, selecting FAMs necessitates consideration of some additional criteria. For instance, they need project planners to evaluate FAM applicability to particular field conditions. Exhibit IV-1 provides an overview of the decision process involved with selecting field-based and fixed laboratory methods. Essentially, this process involves two parallel tracks: a principal method selection track, which involves progressive steps of comparing available methods with project requirements; and an alternative track that is used if the available methods do not meet project requirements. In addition, one of the most important steps a project manager can take in selecting appropriate methods is consulting with a qualified chemist who is experienced in field chemistry and is familiar with the available methods for the analytes of interest. The chemist can identify and evaluate methods and suggest any modifications that might be needed to meet project requirements developed during the systematic planning process.
Principal Method Selection Process
In the principal method selection process, the project planning team attempts to match the selection criteria developed in the systematic planning process with existing field and laboratory-based methods. The steps of this process involve:
C Listing all potentially appropriate methods based on the analyte(s) and media of interest;
C Comparing existing methods to project requirements for sensitivity, selectivity, and dynamic range;
C Examining the refined list of appropriate methods with additional measurement performance criteria; and
C Conducting method applicability studies, if necessary.
In addition to the assistance of a suitably qualified chemist, basic information on available FAMs can be found in Appendix C, Summary of Detection Limits for Selected Field-Based Analytical Methods, and numerous Internet sites, some of which are listed below:
• Dynamic field activities web site, which contains many links and listings of available FAMs, at http://www.epa.gov/superfund/programs/dfa;
• National Environmental Methods Index website, which contains a search-able index of water methods at http://www.nemi.gov;
When selecting field-based analytical methods, secure the services of an experienced chemist to lead the process.
Field-based analytical method selection can be based on their ability to provide data for risk assessments, to guide a site character-ization, or both.
IV-3

Exhibit IV-1 Method Selection Process Overview
IV-4

• Final Update III and Draft Update IV of SW-846, which contains draft and final methods for a number of established FAMs (e.g., GC, immunoassays, and XRF) at http://www.epa.gov/epaoswer/hazwaste/test/main.htm;
• EPA Compendium of ERT Field Analytical Procedures at http://www.ert.org;
• Innovative technology verification reports at http://www.epa.gov/etv; • Hazardous Waste Clean-Up Information (CLU-IN) website, developed by
EPA at http://www.clu-in.org; • The Federal Remediation Technologies Roundtable, developed
co-operatively by EPA, DOD, DOE, and other federal agencies at http://www.frtr.gov;
• Vendor information, including the vendor database at http://www.epareachit.org;
• The field analytical technologies encyclopedia (FATE) at http://fate.clu-in.org; and
• Field Analytical Measurement Technologies, Applications and Selection, California Military Environmental Coordination Committee, 1996, at http://www.epa.gov/region09/qa/r9-qadocs.html.
Initial Method Selection Criteria
Initial method selection criteria include method sensitivity, method selectivity, and dynamic range. These criteria should be considered simultane-ously because their relationship to project requirements dictates if a method should be considered for further evaluation. Selectivity plays an important role in evaluating sensitivity because it describes whether a method measures a single analyte or a class of analytes. Depending on project requirements and site condi-tions, a method‘s selectivity may not be an important factor, thereby allowing project planners to choose from a larger group of methods.
Method Sensitivity
In considering the necessary sensitivity of methods, the project planning team should be aware that there may be multiple action levels for an analyte depending on what part of the site is being sampled. For example, a highly sensitive FAM that is needed to reliably detect the leading edge of a groundwater plume of VOCs could be replaced with a less sensitive FAM within the source area where contamination levels are high. Two basic aspects of method sensiti-vity should be considered in the selection process:
C Detection limits; and C Quantitation limits.
The analytical method needs to provide reliable information about a compound‘s concentration at the action level.
IV-5

Detection Limits
A detection limit is the lowest concentration or amount of a target analyte that can be determined to be different from zero at a stated level of probability. It is used in calculating the lowest level of measurements achievable by a method or instrument. The detection limit is important in the method selection process because it helps the analyst determine the quantitation limit and to interpret values that fall below the quantitation limit.
Quantitation Limits
A quantitation limit is the lowest concentration of an analyte that a method can accurately and precisely quantify. Project planners should seek a method with a quantitation limit below the action level to ensure confidence in decisions made at the action level. When choosing a method, the project planner should consider how the data will be used and how much an individual data point will affect a decision. Generally, project planners should seek a quantitation limit that is one third to one half the project-specific action level to ensure that the method will provide reliable data. This ratio provides a margin of safety for the results and ensures that concentrations reported near the action level do not fall between the quantitation limit and the detection limit where they would be considered estimates. If a large number of data points are used to make a decision, the quan-titation limit can be set closer to the action level because of the increased stati-stical confidence. Likewise, quantitation limits may need to be set significantly lower than one half the action level if a project's DQOs do not allow for a signi-ficant amount of measurement error. Examples of widely used and accepted terms for quantitation limits include:
C Contract required quantitation limits, used exclusively by the EPA Contract Laboratory Program;
C Practical/estimated quantitation limits, used by SW-846; C Method reporting limits, a term in general usage; C Required detection limits, a term in general usage; and C Sample quantitation limits, often used by risk assessors.
Method Selectivity
Method selectivity refers to the ability of an analytical method to detect or quantify a particular analyte when other chemically similar analytes are present. Some analytical methods measure single analytes while others measure a class of analytes. The project planning team needs to understand what a prospective analytical method is measuring to ensure the method is appropriate, the results are meaningful, and to account for possible interferences. If the method‘s selectivity is understood, a method that measures a class of analytes can be used to make
IV-6
Choose a method that can detect the analytes of concern below the action level.
Methods that detect a class of compounds can be used to make decisions about specific analytes in some cases.

decisions about a specific analyte under site specific conditions. For example, if a project needs to ensure that the concentration of total polyaromatic hydrocarbons (PAHs) in soil does not exceed 5.0 mg/kg and that the concentration of benzo(a)pyrene (BAP), a carcinogenic PAH, does not exceed 1.0 mg/kg, a PAH immunoassay test kit that gives results by measuring total PAHs could still be used to select samples that have a total PAH concentration greater than 5.0 mg/kg for disposal and greater than 1.0 mg/kg for off-site analysis. In addition, it could determine samples with less than 1.0 mg/kg total PAHs as —clean,“ since the concentration of BAP would also be less than 1.0 mg/kg.
Similarly, a method that is subject to interferences from non-target analytes can be used if the project planning team has additional information about the interfering compounds. For example, chlorinated pesticide immunoassay test kits may be marketed for DDT or chlordane, but they tend to have a high degree of sensitivity to other chlorinated compounds, such as endrin, endosulfan, and dieldrin. If project planners can demonstrate that interfering compounds are not present, the immunoassay method may provide reliable data for the target compound. One significant application of the methods that are sensitive to more than one analyte is in removal activities to show that cleanup levels have been achieved because the broad sensitivity can be used as a benefit while also providing significant cost savings over fixed-laboratory analytical methods.
Dynamic Range
Dynamic range is the range of concentrations an instrument can accurately measure before a dilution step needs to be performed. There are several issues to consider when evaluating whether the dynamic range of a method is suitable for a site. The first is whether quantitative or semi-quantitative concentration values are required across the entire range of concentrations expected at the site, and how the expected concentrations compare with the range of the method. If decision makers only need to know that the concentrations exceed a single action level, and not by how much, then a method that includes that action level in its dynamic range should be perfectly suitable. However, if quantitative and semi-quantitative values are required across the entire range of expected concentrations then the number of dilutions that may be needed to span this range should be considered. The method may not be practicable if it has to be run through a number of dilutions to obtain all the data needed. Project planners also should consider whether the method is linear through the dilutions and, if not, if the nonlinearity is correctable.
The Loring Air Force Base case study summarized in Chapter V provides a good example of this situation. The project planners at this site had originally intended to use immunoassay test kits for the analysis of PCBs in order to deter-mine whether soil/sediment should be removed and how it should be treated. Because there was a broad range of action levels that determined the disposal
IV-7
Even if a method is sensitive enough to meet project require-ments, it may not be appropriate if too many analyses or dilutions are needed to produce useful data.

options, project managers soon realized that too many dilutions and analyses were needed before they could decide the appropriate course of action, thereby negating any cost savings accrued by the use of immunoassay. Consequently, they needed a method that could produce a specific data point over a broad range of concentrations. To meet this project requirement they selected a transportable gas chromatography unit with an electron capture detector (ECD).
Additional Measurement Performance Criteria
Once appropriate methods have been identified based on the initial selec-tion criteria, potential methods should be evaluated according to additional measurement performance criteria. These criteria include:
C Precision and accuracy; C Applicability to indirectly measuring target compounds; and C Applicability to field conditions.
Precision and Accuracy
Precision and accuracy are data quality attributes that should be evaluated for each method during method selection. The results of the systematic planning process indicate the total study error a project may be able to tolerate. Perfor-mance criteria are derived for the degree of imprecision and bias (accuracy) that the project planners can accommodate in the method. Although precision and accuracy are interrelated, it is possible for a method to be precise, inasmuch as it gives reproducible results, but be biased in one direction. For example, all the results generated by a particular method might be biased high. It may be possible for the project planners to use a biased method if they are aware of the degree of bias, and can make allowance for it. However, if a method is imprecise, the degree of error the method will contribute to the total study error should be carefully assessed so that DQOs for total study error are not exceeded.
Indirectly Measuring Target Compounds
Another issue that should be considered during the method selection process is whether indirect measurements can be used to evaluate the concentra-tion of the target compound, also referred to as using —surrogate“ analytes or —indicator“ compounds. This process can only be evaluated under site-specific conditions, as outlined in the data quality objectives, because the selected surro-gate analyte will not always correlate with the target analyte in the same way. Hence this option necessitates thorough evaluation to ensure that surrogate concentrations are directly related to the target analyte and that the analysis of the
IV-8

surrogate analyte is easier or less expensive to measure. Actual site examples include:
C Total recoverable petroleum hydrocarbons (TRPH) in soil using on-site infrared spectroscopy to estimate the level of PAHs and metals. Site investigation data indicated that there were linear relationships between TRPH and the two other classes of analytes. This relationship was based on the fact that the PAHs and some metal risk drivers were associated with waste oils (see the characterization case study summarized in Chapter V).
C Chlordane and lead analysis in soil using an on-site GC/ECD and XRF, respectively, as a surrogate for toxicity characteristic leaching procedure (TCLP) analysis. This substitution was possible because concentrations in the particular soil type could be directly correlated with TCLP results (see the cleanup case study summarized in Chapter V).
C Fluoride analysis in groundwater using an on-site ion specific electrode as a conservative method of defining a plume containing fluoride, arsenic, cyanide, and PCE at an aluminum production plant because the fluoride ion was known to travel at least as far as all other analytes of interest.
All of these examples demonstrate that indirect analysis of target com-pounds can be a valuable tool in reducing project costs and analytical times when appropriate. Consequently, project planners should consider the use of surrogates in the method selection process.
Practical Considerations for Analysis in the Field
One final issue that should be considered in selecting a FAM is its applic-ability to field conditions. Although every method has specific limitations, often the limitations can be overcome through project planning. Field analysis adds a new dimension to method selection because the limitations should also be evalu-ated with specific field conditions in mind. When considering FAMs, project planners should take into account the following:
C Ruggedness–will the instrument withstand transportation to the site and perhaps being carried around on site?
C Environmental sensitivity–is the instrument capable of operating in a wide range of humidity and temperature conditions?
C Electricity demands–if there is a need, how will electricity be accessed? How and where will instruments that need batteries to operate be recharged?
IV-9

C Size and weight–is the instrument truly portable, can it be easily transported between locations, or will it have to stay in one place?
C Water needs–will tap water be easily accessible?
C Accessories–will associated equipment and disposable products be needed, such as balances, pipettes, wipes, towels, carrier gas, and timer?
C Training needs–how much experience, oversight, or instruction is neces-sary for the field operators?
C Safety issues–what is the need for items, such as personal protective equipment or a fume hood?
C Investigation derived waste (IDW)–how much waste will be generated, how hazardous will it be, and how should it be disposed?
C Workspace needs–how many people will be working together, and will they be in each other‘s way?
C Costs–how cost effective is it for the project as a whole? Field genera-tion of samples should be well matched to analytical throughput capabi-lities.
C Turnaround times–will the analytical method be able to provide results by the time they are needed to make a decision?
C Required licenses–will radioactive sources, such as an XRF instrument, be used?
Method Applicability Studies
Method applicability studies are used in the initial stages of field mobilization to verify that a proposed FAM will perform as predicted under site-specific field conditions. Project planners should establish criteria for success before implementing a method applicability study in order to obtain the most useful data from the event. A method applicability study may not be necessary when project planners have —hands-on“ experience with a FAM in the matrix they expect to encounter. However, when needed, these studies are important for establishing:
• The physical and chemical effects of the site-specific matrix on FAM performance;
• That personnel are proficient in the use of the FAM and can generate project-required electronic and hardcopy documentation;
IV-10
There are many logistical considerations to using field-based analytical methods that need to be evaluated during project planning.

• That the expected MDLs can be achieved in the matrices of interest;The comparability of FAM data with the confirmatory method;
• The need for backup analytical instrumentation; • The rate of disposable supply consumption; and • An estimated number of samples needed to achieve a statistically signifi-
cant decision based on matrix heterogeneity and statistical variability.
Alternative Selection Strategies If Existing Methods Do Not Meet Project Requirements
If at anytime in the method selection process project planners realize that available methods will not be able to meet project requirements, they should consider three different alternatives:
C Altering the project requirements; C Modifying existing methods; or C Developing a new method.
If a new method needs to be developed, a method validation study (U.S. EPA, 1992c) is necessary to document its performance with the matrix and analyte of concern.
Altering Project Requirements
Sometimes the method selection process will result in a reexamination of project requirements because the performance criteria for sensitivity cannot feasibly be met. For example, there are a number of PAHs, such as benzo(a)pyrene (BAP), that pose a significant cancer risk at extremely low concentrations. When these concentrations are used as action levels, they result in a need for both low quantitation limits and low remediation goals. For BAP, the 10-6 excess lifetime cancer risk value is 12 ng/L in water. In order for analysts to use a method that has a quantitation level below this concentration, they would need to take additional measures, such as using very large sample volumes for extraction, which would increase the cost and time for analysis. In some cases, regulators may decide that the extra expense of achieving this quantitation limit is not justified and will allow the project requirements to be altered to an action level that is more reasonably attainable. If altering project requirements is being considered, data users (e.g., risk assessors) need to agree to the alteration.
IV-11

Modifying Existing Methods
Many times an existing method can be modified to meet project require-ments when there is no readily available method. Modifications may range in complexity from minor, easily adapted changes, to major changes that necessitate intensive testing. Regardless of the level of modifications needed, any project-specific method modification should be clearly documented in the method standard operating procedure (SOP) maintained by the project.
Minor method modifications are a common solution to meeting project requirements and may only need an existing method to be run with a modified preparation or analytical procedure. For example, the Spittler Method (a micro-extraction technique) is a modified organic extraction method frequently used in the field to prepare semi-volatiles (e.g., pesticide, PCBs) in soil for analysis by gas chromatography (U.S. EPA, 2002a). The principles of the Spittler extraction are the same as those used by off-site laboratories for solvent extractions, but the quantities of solvent employed and the weight of the soil sample used for extrac-tion are reduced. Although this modification results in an increased quantitation limit, it allows for rapid on-site analysis by reducing extraction time and the need for a complex and expensive extraction apparatus. An additional benefit is that waste solvent volumes are minimized. Many other simple adaptations to field conditions and small method modifications can easily be implemented by a field chemist in order to make on-site analysis more rapid while meeting project objectives. Examples include:
C Raising GC column temperatures to shorten run times; C Using an auto sampler to allow unattended overnight analysis of excess
samples when site-specific conditions permit; and C Using two columns, each with identical injection ports and detectors, to
effectively double the rate of analysis rather than use the second column for confirmation.
If the project planners intent to compare data generated by a modified method to data produced by an existing method, a correlation study should be performed early in the project.
Developing a New Method
Because the process of developing a new method is very time consuming and expensive, project planners generally reserve method development for either the introduction of a novel analytical technology, or a major modification to an existing method when there is a serious problem posed by a constituent. An example of a situation in which method development was justified is presented by Thorne and Jenkins (1995). In this study, the Army Corps of Engineers was charged with developing a field method for ammonium picrate and picric acid,
IV-12
Simple method modifications can often enable an existing method to meet project-specific requirements.

two highly toxic compounds used in explosives. Since the methods they devel-oped were to be applied to a number of sites and would greatly increase the potential capabilities of remediation activities at these sites, the Department of Defense determined that the expense of method development was justified.
Method Validation Studies
Method validation studies are needed for new or highly modified methods that will be used for site-specific purposes to evaluate the performance of the method with site-specific matrices. However, they can be expensive. A method validation study may involve analyzing a reasonably large number of spiked, field-split samples (probably 25 to 50) with the new, or modified method, and with an established definitive method. The results of the two sets of analyses are then compared, and the performance of the new method evaluated. The process results in a report that is similar to the Innovative Technology Evaluation Reports produced by the EPA Environmental Technology Verification (ETV) program. A method validation study for a new FAM does not necessarily involve the tradi-tional round-robin analysis by multiple laboratories that is associated with developing fixed laboratory analytical methods. However, a sufficient number of analyses should be performed to establish method detection limits, allowable matrix recovery percentages, and precision and accuracy.
IV-13

Section 2: Applying Quality Assurance and Quality Control to Field-Based Analytical Methods
Quality assurance (QA) and quality control (QC) comprise interrelated processes that ensure data will meet project requirements. They also help to ensure the technical and legal defensibility of analytical data. One aspect in which dynamic field activities have a tremendous advantage over staged field activities is in their ability to rapidly identify data deficiencies. This information allows project managers to fix problems immediately so that data deficiencies are rectified before demobilization. In contrast, by relying on off-site data, typically submitted to a project weeks after samples are collected, staged field activities may not identify problems until after the field work has ended. In these situations project managers are faced with the unpleasant choice of making decisions with incomplete information, or delaying decisions many months while a remobilization is planned and implemented.
In order to ensure that analytical data can withstand judicial review, project planning teams should develop QA and QC programs that match project requirements. The purpose of this section is to provide information to project managers on the key issues to look for in QA and QC programs that are designed to support a dynamic field activity. Although the procedures are the same for both on-site and off-site analyses, conducting field analyses necessitates additional considerations regarding their applications. The degree to which QA and QC activities are implemented is site specific. Small sites with relatively simple problems generally use only a fraction of the planning and management activities presented in this section, while large, complex, and contentious sites may need full implementation of all the measures discussed below.
Quality Assurance
QA encompasses all management activities that ensure data are defensible and of a quality that fits with their intended use. Quality assurance measures include:
• Establishing quality assurance project plans; • Developing standard operating procedures; and • Evaluating the type and frequency of quality assurance audits.
Due to differences among regional offices, EPA project managers should refer to their regional programmatic quality management plan to identify staff responsible for reviewing project planning documents and conducting audits.
QA/QC considerations are the same for field-based analytical methods and off-site methods.
Match the QA/QC project requirements to the intended use of the data.
IV-14

Establishing Quality Assurance Project Plans
Quality assurance project plans (QAPPs) describe all the necessary project-specific DQOs and QA/QC procedures for successful data collection. They forge the link between the outputs of the systematic planning process and its end product–sufficient, defensible analytical data for project decisions. Not only are approved QAPPs required before any EPA data collection activities begin (U.S. EPA, 2000g), but projects undertaken without them are subject to a very high risk of failure because the QAPP provides the road map for ensuring that sampling and analytical activities will meet project objectives. For more information on developing QAPPs, refer to existing EPA guidance (U.S. EPA, 2001a).
Developing Standard Operating Procedures
Standard operating procedures (SOPs) are a QA measure that allows tasks for meeting project objectives to be reproduced, even if there are changes in the personnel performing them. SOPs are needed for specific tasks, such as sampling, decontamination, and analysis because reproducibility is essential for successful data collection. For example, project teams should be able to establish that the variation between two soil samples is attributable to a heterogeneous matrix rather than differences in sampling technique. For more information on developing SOPs, the reader can refer to existing EPA guidance (U.S. EPA, 2001b).
Evaluating the Type and Frequency of Quality Assurance Audits
An important aspect of a well-designed QA program is evaluating the type and frequency of QA audits. These audits are independent reviews of sampling and analytical activities. They are designed to reveal process deficiencies. Although implementing audits is actually a QC procedure, they are discussed in this section because determining their applicability for a particular project is a QA activity.
Audits are an essential part of a QA program because they allow the project team to attain an objective evaluation of their procedures, and they enable project teams to implement any necessary corrective actions. Because audit programs are project specific, the QAPP needs to describe their frequency and the person, by name and title, who is responsible for performing each type of QA oversight. In general, project managers should plan on using an audit to evaluate sampling and analytical procedures at the beginning of a field mobilization, particularly for large projects. In addition, audits may be needed in the field when there are:
The personnel respon-sible for implementing SOPs should be thoroughly familiar with them before field work begins.
IV-15

C Significant changes in field conditions, such as extreme weather condi-tions, or when project activities are moved to a location with different geology and geochemistry;
C Changes in field personnel or instrumentation; C Continuing failures to meet project-specific QC criteria; C Interferences that impair data quality; or C Documents found to be incomplete or to indicate unreliable results.
Detailed information on conducting audits is provided in EPA guidance (U.S. EPA, 2000f). Because of the site-specific nature of audit programs, project managers should access someone with expertise in conducting audits for the type of site being managed.
Quality Control
QC encompasses all of the performance measurement activities used to determine whether a system is meeting performance criteria and, therefore, is attaining the goals established by QA planning. QC procedures are important for determining when problems need to be fixed, and for documenting that the data are of known quality, which helps to ensure reported results are defensible. In addition to QA audits, there are three major aspects of QC that should be employed in hazardous waste site activities to meet this objective:
• QC sample analysis; • Documentation of QC results; and • Data review.
Quality Control Sample Analysis
QC sample analyses are used for estimating whether a method is perform-ing within the method‘s performance criteria. Dynamic field activities often need more QC checks because FAMs can be exposed to environments that are less controlled and more varied than in fixed laboratories. Although no subset of QC samples are wholly unique to FAMs, there is a project-driven approach to their use. Since FAMs provide data on site, they allow QC sample decisions to be made according to project needs rather than to rigid preset levels. In this way, dynamic field activities can take full advantage of the on-site data that FAMs provide to increase confidence in the data and decisions in the most cost-effective manner.
The five major categories of QC samples include:
• Calibration standards–to determine if analytical systems are performing within project-specified limits;
IV-16

• Blanks–to verify that sampling, preparation, or system procedures are not introducing contaminants;
• Spikes–to evaluate if measurements are accurate and free from bias; • Duplicates/Replicates–to evaluate precision among measurements or, in
the case of field duplicates, to evaluate spatial and temporal heterogeneity; and
• Splits–to compare data provided by two different methods or two laboratories using the same method.
Traditionally, off-site analysis of split samples has been called —confirmation analysis.“
A summary of these issues is presented in Exhibit IV-2. In addition, a comprehensive list of QC samples and the type of information they can provide is available at: http://www.epa.gov/superfund/programs/dfa/download/qctable.pdf.
Evaluating —Confirmation“ Analyses
One of the most important uses of QC samples during a dynamic field activity is in confirming whether a FAM is providing data that meets the project requirements. In order to evaluate these QC samples, it is first necessary to develop project specific QC protocols for evaluating the differences between a reference method and a FAM. Split samples have commonly been called —confirmation samples,“ implying they provide the most accurate data; however, it is necessary to evaluate the quality of each data set to confirm the accuracy of the results. Consequently, split sample analyses should not be used as the sole QC mechanism to evaluate FAM data. In order to use split samples for confirmation of a FAM, data users need to be able to understand the sampling variability (e.g., homogenize samples) and they need to have specific criteria for determining when results are comparable or which results are more representative when results are not comparable. A discrepancy between results does not necessarily indicate a problem with the FAM. Examples of apparent differences between the two methods that are not the result of problems with the FAM include:
C Heterogeneity of the sample media–make sure samples from which duplicates are to be taken are thoroughly mixed to reduce the likelihood that they contain different levels of the target analyte due to the variation in sample heterogeneity.
C Size of the sample used for extraction–if the FAM uses a smaller sample to expedite extraction, the method will generally be less sensitive than a similar confirmatory method that uses a larger extraction volume. Comparison studies can identify systematic bias.
When comparing two sets of data, make sure you know the quality of each data set.
Even if a reference method and a field-based analytical method provide different results, the field-based analytical may be operating properly. Several factors could cause a difference in results.
IV-17

Exhibit IV-2 Summary of Quality Control Sample Issues
Activity Relationship to Dynamic Field Activities
Quality Control Sample Program Design
The QC sample program should be designed to meet the needs of thespecific project.
Consider all types of QC samples to find the right ones to provideconfidence in the FAM generated data.
Calibration Standards (Quantitation)
FAMs typically need more frequent calibration checks than fixedlaboratory analyses due to environmental conditions such as changesin temperature, humidity, etc. The frequent calibrations help to ensurereliable quantitations.
Blank Samples(Contamination)
Use method blanks, instrument blanks, and cleaning blanks to verifythat contamination has not been introduced into the FAM. identification of contamination sources helps to improve data qualitywhile minimizing cost.
Spiked Samples(Accuracy)
Several different kinds of sample spikes can be used with FAMs toprovide confidence that the compounds of interest can be accuratelyidentified and quantified.sample, matrix spikes, and laboratory control samples (LCSs).
Performance Evaluation (PE)Samples(Accuracy)
PE Samples, also known as proficiency testing samples, are spikedsamples that are provided to the laboratory as an unknown.be used to test if the FAM can accurately identify and quantify thecompounds of interest.of an analyst for the particular FAM.
Replicates:Duplicates andTriplicates(Precision)
Judicious selection of replicate samples can help to assess thereproducibility of a measurement and the variability in taking a sample.Project managers can target the use of replicates to their most criticaldecision points and get rapid feedback with the use of FAMs.
Laboratory duplicates and matrix spike/matrix spike duplicates(MS/MSD) measure analytical variability. FAMs can benefit by usingMS/MSDs to ensure there is a quantitative comparison - projectmanagers should consider setting relatively wide acceptance windows.
Field replicates can help assess overall measurement error - bothsampling and analysis - since they are separately collected samples.
Field replicates and colocated samples are useful for providing anearly indication of the problems in the sampling and analytical process.Additional information on their application can be found in existing EPAguidance (U.S. EPA, 1990).
Split Samples(Comparability)
Carefully homogenized samples that are divided and sent for analysisby two different methods or two laboratories using the same methodcan help provide confidence that the FAM is producing data of knownquality. These samples, sometimes called confirmation samples, canhelp convince decision makers that the FAM is reliable.
Rapid
These spikes include: surrogates in each
They can
They can also be used to test the proficiency
IV-18

C Instruments measuring different constituents–many FAMs measure slightly different analytes than their confirmatory method counterpart. For example, XRF measures total metal concentrations while inductively coupled plasma (ICP) methods measure the concentration of metals extracted through an acid digestion process. Hence, the XRF method may justifiably provide higher results than the ICP method. Comparison studies can address these differences.
C Loss of volatiles–on-site analysis of volatile compounds often indicates higher concentrations than off-site analysis due to the loss of volatiles during shipping and handling. This problem often increases the longer a sample is stored before analysis. Consequently, sampling and storage procedures should be used that minimize loss of volatiles.
C Redistribution of previously homogenized sample–some samples, such as saturated sediments, tend to separate by particle size when shaken, thereby creating a potential for the two methods to provide very different results. Consequently, procedures should be in place to ensure that laboratories re-homogenize the samples before subsampling for analysis.
C Inconsistent measurement and reporting methods–for example, a field gas chromatography method may report the wet weight soil concentration while the confirmation method may report the dry weight concentration. Therefore, QAPPs should request data to be reported consistently.
Selecting Split Samples
A QC protocol that has commonly been used by projects is to select 10 percent of the samples designated for FAM analysis for —confirmation“ with split analysis throughout the life of the project. A better approach is to submit split samples for analysis at carefully chosen decision points. The rationale for this protocol is that a higher percentages of split samples are needed at the beginning of projects to determine how a method is performing in different site conditions (e.g., clayey samples versus sandy; turbid samples versus clear). However, once FAM reliability has been established, split samples are best used to provide information at key decision points (e.g., where the FAM results are close to the project‘s action level; when continued FAM reliability may be in doubt). In some cases, this protocol may result in more than 10 percent comparative analyses, and in other cases it may result in less. In either case, the data set will provide the project team with more confidence in their decisions than fixed-interval submis-sion for analysis of a predetermined percentage.
Documenting Quality Control Results
Documenting QC results is an important aspect of QC because it enables the project planning team to prove that the data are of sufficient quality for the
IV-19
Split samples should be selected judiciously. Focus on the beginning of the project and key decision points.
The documentation system should ensure that QC samples are easily associated with appropriate field samples.

intended use. Environmental samples need to be clearly associated with the quality control sample(s) that are analyzed with them. This information can be preserved by having a sample identification scheme that links field samples to their associated field and method quality control samples. Adequately planning and documenting procedures up-front will enhance the defensibility of the resulting data. In addition to this routine recording of QC sample results, documentation entails maintaining records of:
C All method evaluation procedures, such as method applicability studies; C SOPs and any modifications that have been adopted; and C Corrective actions.
A summary of how these issues relate to the implementation of dynamic field activities is presented in Exhibit IV-3.
Exhibit IV-3 Summary of Documentation Issues
Activity Relationship to Dynamic Field Activities Documentation of Study Results
A field analytical logbook should be maintained for each FAM along with any instrument printouts necessary for results to beverified or validated by an independent reviewer.
Special protocols may be needed to document FAM data.
Standard OperatingProcedures
Changes in SOPs should be clearly documented, particularly fordynamic field activities, because unexpected changes in siteconditions may need to be accommodated.
Clear direction should be given in the project-specific SOP foreach FAM stating the information that needs to be captured bythe measurement system.
Corrective Action The problem, corrective action, and resolution need to berecorded so that the problem does not reoccur.
Data Review
Data review is a series of QC procedures that allows project teams to determine if the data they have collected meet project requirements. Dynamic field activities rely on this data review process to occur in real time so that changes can be made to the field activities before data collection is complete. Data review includes:
C Data verification; C Data validation; and C Data quality assessment.
IV-20

Additional information on data verification and validation is provided in Section 3 of this chapter, Managing Data During a Dynamic Field Activity.
Data quality assessment (DQA) helps illuminate the big picture by combining results from the sampling and analytical procedures to evaluate whether the activities met the project‘s needs. For dynamic field activities, data quality assessment generally occurs at two points in a project. The first is informal and occurs daily as the technical team leader examines and evaluates the data to determine if they make sense and meet the project requirements. This type of DQA is unique to dynamic field activities and it provides an advantage over staged field activities because it allows the technical team leader to identify and correct problems as they occur. During this informal process, the technical team leader should also discuss the progress of the data collection with the risk assessors to determine if the data are meeting their needs as well.
The formal DQA is the final step in data review, and it is performed after data verification and validation are completed. A formal DQA involves a scienti-fic and statistical evaluation of a data set to determine if it is appropriate for its intended use. While not strictly a QC procedure, DQA detects conditions under which a project‘s DQOs will not be met and is mentioned here for completeness. U.S. EPA (2000c) has published a five-step process for DQA that should be consulted for further information on this topic.
The use of FAMs allows for large numbers of data points to be collected that may not otherwise be economically feasible, and they facilitate the generation of a data set more representative of site conditions than would otherwise be pos-sible. Consequently, the quantity of data provided during dynamic field activities increases the types of statistical analyses that can be conducted with the data, and it enhances the ability of the statistical methods to aid decision making with higher levels of statistical probability.
IV-21

Section 3: Managing Data During a Dynamic Field Activity
Data management is an essential part of ensuring that a project‘s data are accurately specified and can be accessed as long as it is needed. Although data management plans also vary in length and degree of sophistication, all have the same objectives:
C To report analytical and geological data accurately in an agreed upon, consistent, and uniform format (e.g., all metal concentrations in mg/kg, dry weight);
C To provide accessible data, readily retrievable from their stored form, whether electronic or hardcopy; and
C To ensure the traceability of the data to a specific location, collection time, and technique.
Data for a dynamic field activity needs be managed very rapidly so that field work can proceed based on timely and accurate information. This process is much different than that for a staged field activity where data are generally not used until after the sampling event. The information in this section complements existing EPA guidance on managing data (U.S. EPA 1998a and 2001a). Topics of particular concern to dynamic field activities include:
C Data flowcharts; C Data management readiness review; C Data review; C Data tracking systems; C Document control; and C Data visualization.
A summary of data management issues related to dynamic field activities is presented in Exhibit IV-4.
Data Flowcharts
The first, and perhaps the most crucial, data management activity for a dynamic field activity is the preparation of a flowchart that clearly documents the steps of data generation from its source(s) to final storage and retrieval. An example of a data flowchart is provided in Exhibit IV-5. This flowchart was developed for the Loring Air Force Base cleanup, which is summarized in Chapter V. The flowchart contents should include:
• Any point at which data are manipulated, transferred, or transformed; • Those points when QC checks are performed; • Names, titles, and responsibilities of each individual handling the data;
and
IV-22

Exhibit IV-4 Summary of Data Management Issues
Activity Relationship to Dynamic Field Activities
Data Flowcharts Flowcharts should identify and eliminate anybottlenecks where data could accumulate uselessly.
Data Management Readiness Review
A rehearsal of the data handling system for largeprojects is useful because of the complex data flowprocess during a dynamic field activity.
Document Review These services should be provided in a timely fashion.
Data Verification 100 percent verification is necessary throughout theactivity for field generated data.
Data Validation Select which data need validation.
Using —in-house“ staff generally provides more controlfor ensuring that validation is completed in real time.
Explore electronic data validation options.
Validating FAM data as they are generated may helpto identify and resolve data anomalies, allowing newsamples to be collected where necessary.
In general, QC sample validation should be used withall FAMs.
Full validation should be used if FAMs are providingthe confirmation level data.
Document Control Dynamic field activities can generate an enormousamount of documents that an independent reviewermay need to use to establish that data quality wasmaintained at project-required levels.
Data Visualization Electronic manipulation of data with softwarepackages enables the conceptual site model to beviewed in 2 and/or 3 dimensions with the latestinformation integrated quickly, thus greatly enhancingthe decision-making process, particularly for largeprojects.
• Time frame for each step of the data flow process (e.g., mobile laboratory chemist to report results to the project chemist/data validator by close of business each working day; the project chemist is to present validated results to the team leader by 2:00 p.m. the subsequent day).
The flowchart should indicate that data generated during dynamic field activities are continually moving toward the end user without any bottlenecks where data may accumulate uselessly.
IV-23

Exhi
bit I
V-5
Sc
reen
ing
Sam
plin
g D
ata
Man
agem
ent F
low
Dia
gram
IV-24
Data Management Readiness Review
For large projects, project managers should ensure that every member of the project team participates in a rehearsal, or readiness review, of the data handling system, as documented in the flowchart, before the mobilization so that deficiencies can be identified and personnel can become familiar with the flow process. For small projects, this recommendation is generally not necessary because there are not as many groups handling data. Both electronic and hard-copy dummy data deliverables, similar to anticipated project deliverables, should be taken through as many steps of the data flow process as possible. This activity can be accomplished with suitably edited, pre-existing information, such as field generated data; field boring logs; and laboratory deliverables, including both hard and electronic copies.
Document Review
Project managers need to make sure processes are in place to review data rapidly during a dynamic field activity so that data of a known quality are avail-able when they are needed. Document review includes data verification and data validation. There are numerous ways to facilitate the quick turnaround of data, such as:
C Making analytical and geological data available on a timely basis for the personnel responsible for data entry;
C Giving specific individuals the responsibility of compiling and providing different types of data on a timely basis;
C Providing data, along with supporting documents, to data validation and verification groups on an agreed-upon time frame;
C Using pre-printed forms and worksheets to facilitate the capture of needed data;
C Using, when appropriate, the Field Operations and Records Management System II Lite (FORMS II Lite), which is a sample document automation software that aids aspects of data management, such as sample labeling and tracking, chain of custody reporting, and export of electronic data (available from EPA Contract Laboratory Program); and
C Using data validation software, with oversight from an experienced chemist, if data are electronically transmitted to a project‘s database.
Data Verification
Data verification includes the steps used to ensure that the electronic and hard copy results agree. Project managers should ensure that project plans and appropriate SOPs clearly state the percentage of results to be reviewed for verification and how problems will be fixed if incorrect entries are identified.
IV-25
Make sure the data handling system works before going into the field.
Decision makers need reliable data in a timely fashion.
Determine the steps needed for the project manager to have confidence in the data.

Initially, all data deliverables from a laboratory should be verified; however, this standard can be scaled back to around 5 or 10 percent once confidence is estab-lished in the submittals. For field generated data, 100 percent verification is needed throughout the activity. All field documents (e.g., hydrogeologic data, drilling logs) should be rapidly reviewed so that field analytical results can be traced back to a three-dimensional location, date, and time of sampling.
Data Validation
Data validation assesses the quality of the data and assigns flags to it based on how well the results adhere to the QC criteria. The percentage of a data set that should be validated is project specific, therefore, project planners should set a target during the systematic planning process that fits with the end use of the data. For example, when a large amount of screening data are collected during a dynamic field activity, much of the data may not need validation since these data are often collected for the purpose of deciding which sample should be analyzed with a definitive method. In addition, validation of FAM data is very important at the beginning of a project, but once its reliability is established, usually the percentage of validation can be scaled back.
Validating FAM data as they are generated may help to identify and resolve data anomalies, allowing new samples to be collected where necessary. In general, QC sample validation should be used with all FAMs. It entails the review of the results from QC samples and it assesses compliance with the project-specific performance criteria. Full validation entails a more stringent level of QC such as having a qualified chemist examine the raw data to determine if proper analyte identification and quantitation has been reported. A reasonable standard for determining the level of validation needed is to increase the thoroughness of review when a data set is critical in supporting a project decision. Consequently, full validation should be used if FAMs are providing the confirmation level data (i.e., data that are used to verify a decision or to show that a sampling and analysis program is performing as expected). Less stringent levels of validation may be acceptable when long-range trends in the data are being estimated (e.g., groundwater monitoring).
Data validation can be accomplished using —in-house“ staff or by hiring data validation firms. However, project managers generally have greater control of the validation schedule when in-house staff is used because data validation firms may not always dedicate the necessary staff when needed. Control of validation staff is particularly important during dynamic field activities because these projects generally need validation to be completed rapidly.
IV-26

Data Tracking Systems
Project managers should ensure that a system is in place for tracking data during a dynamic field activity because there may be a relatively long period between sample submittals for fixed laboratory analysis and the data delivery. Without proper data tracking information, due dates and potential delays may be overlooked. In addition, the system should track field-generated data to ensure that data are available for decision making when expected.
Document Control
Dynamic field activities can generate a considerable number of documents that an independent reviewer needs to examine to certify that quality was main-tained at project-required levels. Consequently, project managers should ensure that a well-designed document control system is developed. Aspects of document control that should be developed include:
C Training for field personnel on generating and storing field documents; C Long-term storage of hardcopy and electronic records, including the
frequency that electronic records should be backed-up; C The length of time records should be maintained; and C A list of important documents and their location, such as the work plan,
sampling and analysis plan, original chains of custody forms, and field logbooks.
Data Visualization
Project managers should ensure that data visualization procedures are established for their projects to help the project team interpret data as it is generated. Generally, this manipulation occurs with visualization software. For small projects, this activity may involve no more than a specification of the software to be used to show boring logs, cross sections, and in-plan maps in the final report. In these situations, field visualization is usually performed with hand drawn diagrams. For more complex projects, electronic visualization software is often more appropriate, especially if stakeholders will be viewing the information off site.
Depending upon the size of the project and the stakeholders involved, project managers may want to use a password protected web page to share raw data and data visualizations with remote users so that decisions requiring broad input can be made rapidly. The Loring Air Force Base case study, summarized in Chapter V provides an example of how this activity can be accomplished. If real-time viewing is not considered necessary, data can also be plotted on a single
IV-27

computer that is used to distribute reports through e-mail on a pre-determined schedule (e.g., every few days, weekly, biweekly).
A number of software programs can be used for data visualization. Some are commercially available. The following programs can be downloaded for free:
• EPA‘s Kerr laboratory provides access within the public domain to numerous groundwater and vadose zone modeling software programs, at http://www.epa.gov/ada/csmos/models.html.
• The USGS provides access to public domain software, such as MODFLOW and related programs at http://water.usgs.gov/nrp/gwsoftware/.
• Spatial Analysis and Decision Assistance (SADA) was developed by the University of Tennessee, Knoxville, with funding from EPA and DOE in collaboration with Oak Ridge National Laboratory (ORNL). SADA incorporates tools from the environmental assessment field into an effective problem solving environment. The tools include integrated modules for visualization, geospatial analysis, statistical analysis, human health risk assessment, cost-effective analysis, sampling design, and decision analysis at http://www.sis.utk.edu/cis/sada/.
• Fully Integrated Environmental Location Decision Support (FIELDS) Software was developed by EPA‘s Region 5. It integrates geographic information systems (GIS), global positioning systems, database, and analytical and imaging technologies to facilitate site characterization decision making at http://www.epa.gov/region5fields/.
IV-28

Conclusion
Technical advances in analytical instrumentation have created an enor-mous number of choices for project managers. These choices include rapid generation of rigorous data to support dynamic field activities. Because of the many advantages to using an on-site decision-making process, project managers should ensure that project planning teams consider the selection of FAMs during the initial systematic planning process. In order to ensure adequate consideration, project managers should work closely with experienced chemists to select methods that meet their project objectives.
Concerns about the scientific defensibility of FAMs are no more relevant to the project planning process than concerns about fixed laboratory methods. Well planned projects can use a wide array of QA and QC procedures to demonstrate that methods meet project requirements. In addition, there are numerous data management tools that can be used with field generated data to ensure appropriate data handling and storage.
In short, for dynamic field activities to result in rational site decisions and for their resulting data to be effective in court, good laboratory practice and suit-ably qualified, experienced professionals are needed to support all site activities. Good laboratory practice is not an extraordinary standard; rather it is part of a basic quality assurance program to ensure that the data reported are accurate and support the site decisions. Furthermore, because more data can be generated economically with FAMs than with fixed laboratories, dynamic field activities help to increase the confidence project managers and stakeholders have in site decisions by alleviating questions of data interpretation where most challenges to scientific evidence occur. In order to meet these standards, project managers need to understand that confidence in data is related to both sampling and analytical procedures. They also need to implement the data quality aspects outlined in this chapter, including:
C Ensuring systematic planning considers all options and selects the most appropriate procedures;
C Encouraging project chemists to select analytical methods according to data needs;
C Overseeing the development of project-specific QA and QC protocols; and C Developing procedures to manage data effectively.
IV-29

Chapter V
Dynamic Field Activity Case Study Summaries


V-1
Dynamic field activi-ties have already beencompleted at a numberof sites. Evaluationsof these projectsdemonstrate improvedsite decision making inaddition to costsavings ranging from15 to 57 percent andtime savings rangingfrom 33 to 60 percent.
Chapter VDynamic Field Activity Case Study Summaries
Overview
Although the term “dynamic field activities” is new, a number of projectmanagers have already demonstrated the effectiveness of this type of field work. Working independently, they have identified similar techniques for using field-based analytical methods (FAMs) to streamline site decision making in a way thatresults in quantifiable savings in the time and cost of field work. They have alsodemonstrated that the FAMs met project requirements for analytical data quality,and the end product was equal to or better than what could have been done if theproject had relied on fixed-laboratory analyses for decision making.
This chapter summarizes examples of dynamic field activities that havetaken place at three CERCLA sites. Readers interested in reviewing the completereports, including supporting information and a full discussion of how cost andtime savings were calculated, should refer to http://www.epa.gov/superfund/programs/dfa/casestudies. Links to additional case studies are also provided onthis web page.
None of the case studies presented in this chapter are intended to be aperfect example of a dynamic field activity. Rather, they demonstrate that inspite of the problems and mistakes that occurred, substantial benefits were real-ized. In addition to the significant time and cost savings that were documented,these case studies provide examples of a number of unquantifiable but importantbenefits. For example, in the treatment system optimization case study, FAMsprovided a mechanism for discovering mistakes quickly so that corrective actionscould be instituted before problems caused a significant expenditure of resources. In all three case studies, FAMs helped promote a higher level of confidence insite decisions by using a larger data set than would have been feasible with con-ventional approaches. Consequently, by integrating FAMs into project decisionmaking, overall project QC was improved beyond what could have been obtainedwith fixed laboratory analysis alone.
Coincidentally, each of the case studies presented in this chapter is aFederal Facility site that was part of the Department of Defense’s Base Realign-ment and Closure (BRAC) program. However, they also provide a very diverseset of contaminants, FAMs, site conditions, activities, and problems. Conse-quently, they should contain helpful information for a large number of situations. A comparison of these case studies is provided in Exhibit V-1.

V-2
Exhibit V-1Summary of Dynamic Field Activity Case Studies
Project Topic Characterization Cleanup Treatment SystemOptimization
Location Tustin Marine Corps AirStation, California
Loring Air Force Base,Maine
Umatilla Chemical Depot,Oregon
Lead Organization Navy Air Force Army
Constituents ofConcern
TCE, metals, PAHs PCBs, DDT, Chlordane,Lead, PAHs
RDX, TNT, Degradationproducts
Source ofContamination
Leaks and spillage in drumstorage areas
Run-off from runway,industrial activities, directapplication of pesticides
Washout and recovery ofexplosives from munitions
Contaminated Media Soil and groundwater Soil and sediment Groundwater
Receptors Direct human contact,discharge to surface waterand downstream wildliferefuge
Direct human contact,wetland, wildlife, humanconsumption ofcontaminated trout
Drinking water supply
FAMs Used FID, GC/PID, Infraredspectroscopy
Immunoassay, XRF,GC/FID, GC/ECD
Colorimetric test kit
Action Level TCE (water) 5 µg/LTCE (soil) 7100 µg/kgTRPH (soil) 10 mg/kg1
Aroclor 1260 1.0 mg/kgDDD/DDE/DDT 0.12 mg/kgChlordanes 0.32 mg/kgBenzo(a)pyrene 5.14 mg/kg
RDX 2.1 µg/LTNT 2.8 µg/L
FAM QuantitationLimit
TCE (water) 5 µg/LTCE (soil) 50 µg/kgTRPH (soil) 10 mg/kg
Aroclor 1260 0.5 mg/kgDDD/DDE/DDT 0.06 mg/kgChlordanes 0.16 mg/kgBenzo(a)pyrene 2.57 mg/kg
RDX 2.0 µg/LTNT 0.9 µg/L
Activity Delineation ofcontamination
Removal of contaminatedsoil and sediment;restoration of stream andwetlands
Optimization ofgroundwater treatmentsystem
Project Time 10 months 2 construction seasons(May through October)
Long-term remediation
Percent TimeSavings
60 33 Not Applicable
Cost Savings $90,0002 $5 million $180,000 per year
Percent Cost Savings 152 25 453
1 Based on the preliminary remediation goals for PAHs.2 Calculation does not include EPA administrative savings from reduced staff timereviewing multiple work plans and interim reports. Additional savings in RD/RA arelikely due to detailed characterization.3 Based on the total cost of sample analysis and treatment with granular activated carbon.
In addition, a summary of a few additional case studies that have beenpreviously described in other documents is provided in Exhibit V-2. These previ-ously reported case studies emphasize the applicability of this process to a broadrange of programs and site conditions, including small dry cleaning and leakingunderground storage tank (LUST) sites. The range of cost savings for all of thesesites is 15 to 57 percent, while the range of time savings is 33 to 60 percent.

V-3
Exhibit V-2Summary of Several Previously Reported
Dynamic Field Activity Case Studies
Project Topic Applegate et al.,1997
Robbat, 1997 ASTM, 1998b U.S. EPA,2000h
Location 8 dry cleaner sitesin Jacksonville,Florida
Hanscom AFB,Massachusetts
Unidentifiedgasoline station
Wenatchee,Washington
LeadOrganization
State of Florida Air Force UnidentifiedState Program
EPA
Constituentsof Concern
PCE VOCs, PCBs,PAHs, metals
Benzene,Toluene,Ethylbenzene,Xylene(s)
Pesticides
ContaminatedMedia
Soil andgroundwater
Soil andgroundwater
Soil andgroundwater
Soil
FAMs Transportable GCrunning SW-846methods 8010 and8020
Laboratory gradeequipment usedonsite, includingGC/MS andICP/OES
TransportableGC running SW-846 methods8015 and 8020
Immunoassay
Site Activity Characterization Characterization Characterization Removal
Time Savings(percent)
>50 Not Calculated Not Calculated Not Calculated
Cost Savings(percent)
30 to 50 36 to 57 Not Calculated 50

V-4
Section 1: Soil and Groundwater Characterization,Marine Corps Air Station Tustin
Background
The U.S. Navy planned, implemented, and completed a dynamic fieldactivity at the Marine Corps Air Station Tustin, in Southern California betweenJuly 1995 and June 1996 (U.S. EPA, 2002c). The 1600-acre military base waspart of the Department of Defense’s Base Realignment and Closure (BRAC)program and the land was designated for redevelopment and integration into thesurrounding community of Tustin, located just north of Irvine in Orange County.
Based on background information, the U.S. Navy and regulators knew of15 Installation Restoration Program (IRP) sites that may have experiencedhazardous substance releases. Site managers placed seven of these IRPs into theCERCLA remedial program, and scheduled a remedial investigation/feasibilitystudy, because they believed these locations were likely to have had substantialreleases. The site managers placed the remaining eight IRPs into the CERCLAremoval program so that an engineering evaluation/cost analysis could be per-formed, however, they also stipulated that if any of these sites had contaminationworse than anticipated, the site would be transferred to the remedial program. Inaddition, the Navy was responsible for investigating approximately 70 RCRAsolid waste management units, a number of potential fuel/heating oil problems,agricultural fields to determine the impact of past pesticide application, and baseresidential areas.
For the purposes of providing a succinct case study of how dynamic fieldactivities can be used to conduct a characterization, this discussion focuses on thework at a single site, IRP-12—Drum Storage Area #2; however, investigatorsused the same methods throughout the base.
Innovative Approach
Based on historical information, investigators believed that groundwater atthe site was shallow (i.e., less than 20 feet below ground surface) and that thestratigraphy was generally a sequence of clays and silty sands until reaching theregional aquifer at about 100 feet bgs. In addition, their list of known chemicalsof concern included chlorinated solvents, BTEX, waste oils (PAHs and metals),and paint stripper wastes (solvents and metals). With their knowledge of the site,the project consultants believed that a dynamic approach was both feasible andadvantageous.
One of their first planning activities was to select analytical methods thatwould provide data that they could use for on-site decision making. For thechlorinated solvents and BTEX, they selected the EPA Environmental Response

V-5
Team GC/PID SOP with detection limits of 5 Fg/L for water and 20-50 Fg/kg forsoil. For waste oils they selected an infrared spectrophotometer using a modifiedEPA method 418.1 that provided a detection limit of 10 ppm in soil and guidanceon which samples to analyze off-site for PAHs. This method allowed investiga-tors to avoid the time and expense of analyzing for PAHs in the field whileensuring that contaminated samples would not be missed. In order to ensureconsistent results, they rented a laboratory trailer in which to operate the analyticalequipment and they employed experienced chemists to run the analyses.
Metals analysis in the field posed a problem for investigators because thecommon field equipment (i.e., XRF) did not provide the detection limits theyneeded for field decision making. However, because investigators realized thatmetal contamination was associated with waste oils and paint stripping (i.e.,chlorinated solvents) they proposed, and regulators accepted, using analyticalresults from the IR spectrophotometer and the GC/PID to select samples for off-site analysis of metals. By using waste oils and chlorinated solvents as surrogatesfor metals, they were able to avoid the expense of on-site metals analysis whileensuring that metal contamination was not being overlooked. In addition,investigators set up a confirmatory off-site analytical scheme to ensure thatanalytes were not missed by the on-site equipment.
To collect soil samples, investigators used a dual tube direct push rig thatprovided continuous cores of the subsurface. Each core was logged, examined forstaining and potential preferential pathways, and screened with an organic vaporanalyzer for VOCs. Samples were selected for on-site analysis based on theseobservations. Although the initial sampling design was based on a statisticallydetermined grid, with a majority of the samples being taken on 20-foot centers, adynamic work plan was developed to allow the technical team leader to collectadditional samples based on the results of the initial findings. Flexibility clauseswere included allowing deeper sampling, sampling outside the grid, suspension ofgrid sampling, and increased sampling densities as needed. When the dynamicwork plan was fully implemented, investigators expected to produce up to 50samples a day for on-site analysis. Investigators set up the on-site laboratory tohandle approximately 70 samples a day to ensure that the laboratory would not bea bottle neck for data generation. This excess capability also allowed them tosubmit samples from other field activities as needed.
Regular communication among stakeholders (i.e., Navy, EPA, State ofCalifornia, contractors) was essential for managing the complicated activities atthis site. To facilitate communication, weekly meetings, either face-to-face or byteleconference, were held with the decision makers from each organization todiscuss progress, resolve any concerns, and determine the general investigationplan for the following week. In addition, if any decision points were reached priorto a scheduled meeting, decision makers were contacted on an as needed basis.

V-6
Results
Within 30 days of starting the field work, investigators had discovered anddelineated five source areas in the drum storage area that contributed to two TCEgroundwater plumes. Ironically, the initial work plan did not target any of thesezones of contamination. One groundwater plume was 400 feet long and the otherwas 1,500 feet long. Neither of these plumes had reached the regional drinkingwater aquifer, and although the larger plume had migrated into a deeper perme-able zone, the groundwater modeling programs indicated that neither plumewould reach the drinking water aquifer.
Investigators also demonstrated that the site did not have any appreciablecontamination from waste oils, contrary to what had been reported previously, andhad no risk level PAHs or metals. The off-site laboratory did detect a Freon113™ plume contained within the larger TCE plume that was not detected by theon site GCs. However, the existing QC program had sufficient checks andbalances to ensure contaminants undetected by the field equipment would beidentified.
Compared with what would have been possible at this site using rigidwork plans and decision making based on off-site analysis, the on-site decisionmaking process at this site cost 15 percent less money ($497,000 vs. $587,000);required 60 percent less time (44 weeks verses 110 weeks, including projectplanning and report writing); and provided much more data than would haveotherwise been feasible, thereby enabling decision makers to have much moreconfidence that contamination had not been missed and that they were making theright site decisions.
Lessons Learned
There were six significant lessons learned from this dynamic field activity:
C Regular communication among all stakeholders was essential.C On-site decision making proved to be a “faster, better, cheaper” approach
to meeting the project goals.C On-site analysis and DP sampling techniques (both soil and groundwater)
were a powerful combination in rapidly collecting the required data.C On-site analysis increased the confidence project managers had in the risk
assessment.C Additional analytical savings could have been realized, without sacrificing
data quality or defensibility, if investigators had selected QC samplesbased on decision needs rather than pre-specified percentages.
C Although the on-site laboratory used generic PE samples, more usefulinformation could have been attained if the PE samples contained site-specific constituents in site-specific matrices.

V-7
Section 2: Soil and Sediment Cleanup,Loring Air Force Base
Background
Loring Air Force Base, located near Limestone, Maine, and the Canadianborder, was a 9,000-acre military installation that began operation in 1952 andclosed in September 1994 as part of the Department of Defense Base Realignmentand Closure (BRAC) process (U.S. EPA, 2003). During the base closure process,the Air Force identified 15 operable units (OUs) requiring investigation. TheCERCLA remedial investigation/feasibility study identified eight separate areasthat required remediation. In order to provide a reasonably concise description ofhow a dynamic field activity facilitates site cleanup, this case study discusses theactivities at one of these areas, the Flightline Drainage Ditch Wetlands.
The Flightline Drainage Ditch Wetlands is located between a spill contain-ment facility and a trout stream, East Branch Greenlaw Brook. The spill contain-ment facility was a clay-lined detention basin designed to prevent fuel spills andother contaminants from traveling from the flightline through the Flightline Drain-age Ditch and downstream into environmentally sensitive areas. Discharges fromthe spill containment facility flowed into the 20-acre Flightline Drainage DitchWetlands. The CERCLA remedial investigation/feasibility study (RI/FS) identi-fied PCBs, lead, DDT/DDD/DDE, chlordane, and PAHs as contaminants ofconcern in the sediments of these wetlands.
Innovative Approach
Before the cleanup activities could begin, the site required extensivesampling and analysis to delineate the zones of contamination more precisely thanhad been done during the RI/FS. To facilitate the rapid turnaround of data at areasonable cost, the project team set up an on-site laboratory, using a vacantbuilding, and equipped it with an XRF, two transportable GCs (one with an FIDfor the PAHs and the other with an ECD for the PCBs/pesticides). The GCs wereconfigured with split samplers that allowed their two columns to be used separ-ately, thus doubling their analytical capabilities. Once the project team estab-lished confidence in the on-site analytical capabilities among all stakeholders, itincreased the GC’s QA and QC protocols to meet off-site laboratory QA/QCstandards. This change allowed the project team to determine if an excavationarea met cleanup levels with on-site analysis, thereby eliminating quick turn-around off-site analysis of cleanup confirmation samples and greatly reducinganalytical costs.
To improve communication among stakeholders and facilitate rapiddecision making, the project team set up an Internet-based visualization system

V-8
that displayed data within 24 hours of analysis. This system allowed all theproject decision makers to rapidly come to agreement on whether an area wasclean, thereby enabling stream/wetland excavation and restoration efforts tocontinue uninterrupted.
Results
During the initial phase of the field work, the field team collected 271samples to locate the contamination and determine which areas required excava-tion. An additional 355 samples were analyzed to confirm removal activities metthe cleanup goals. Both sets of samples were analyzed by the on-site laboratoryand all project decisions were based on these results. A subsequent analysis ofon-site versus off-site data found that in 93 percent of the samples the samedecision would have been made if off-site data had been used. In greater than 6percent of the samples the on-site laboratory was conservative – suggestingexcavation where excavation may not have been necessary, and in less than 1percent of the samples the on-site data indicated no further action while the off-site data would have dictated further excavation. These error rates were wellwithin the project requirements.
The Record of Decision (ROD) specified that the wetlands would berestored as part of the remedial action. The project carefully mapped the existingconditions before the excavations began. By producing data within 24 hours ofsample collection, the restoration crews were able to operate immediately behindthe remediation crews, thereby saving an enormous amount of time. The AirForce estimates that this process allowed them to reduce the project time framefrom three construction seasons (i.e., May through October) to two. By reducingthe project time, the project saved about 25 percent of the necessary funds(approximately $5 million). In addition, the on-site laboratory saved the project atleast 50 percent of the potential analytical expenditures.
Lessons Learned
There were five major lessons learned by the dynamic field activity atLoring Air Force Base:
C Close coordination among the stakeholders was essential for rapiddecision making.
C An on-site laboratory can meet all of the QA and QC protocols of an off-site fixed-based laboratory.
C On-site analysis provided several benefits to the project, including: fastdata turnaround times, flexibility in selecting the order in which thesamples were analyzed, and lower analytical costs.

V-9
C Faster analytical results enabled the project team to simultaneouslyconduct the remedial actions and the restoration activities, thereby savingconsiderable project time.
C Although rapidly disseminating analytical data to stakeholders was laborintensive and expensive (due to the need to verify/validate data on verytight timeframes), the process was invaluable in obtaining agreement onthe course of action and proceeding with the field work without delay.

V-10
Section 3: Treatment System Optimization,Umatilla Chemical Depot
Background
The Umatilla Chemical Depot was established as an Army ordnance depotin 1941 for the purpose of storing and handling munitions. It is located in north-eastern Oregon in Morrow and Umatilla Counties, approximately five miles westof Hermiston, Oregon, and six miles south of the Columbia River. The installa-tion covers over 19,000 acres, 86 percent of which was used by the Army and theremaining 14 percent for agriculture. In 1988, Umatilla Chemical Depot wasincluded in the Department of Defense’s Base Realignment and Closure (BRAC)Program, which required its conventional ordnance storage mission to betransferred to another installation (U.S. EPA, 2002d).
Beginning in the 1950s, the chemical depot operated an on-site explosiveswashout plant. The plant was cleaned weekly, and the wash water, whichcontained high concentrations of explosives, was disposed of in two nearbyunlined lagoons, where it percolated into the soil to form a 330-acre groundwaterplume in the underlying unconfined sandy aquifer. The plume consisted primarilyof Royal Demolition Explosive (RDX) with concentrations ranging up to 6,816µg/L. Trinitrotoluene (TNT) was also found at elevated levels (3,000 µg/L), but itwas generally confined to the area under and near the lagoons. In 1994, theRecord of Decision for the groundwater operable unit (OU) selected groundwaterextraction and granular activated carbon (GAC) treatment as the remedy. To meetthese requirements, the Army Corps of Engineers designed and constructed twoparallel treatment systems, each with a pair of 20,000-gallon GAC filled tanks. The lead tank would remove the majority of contamination and a polishing tankwould ensure that no contaminants were reinjected into the aquifer. The flow ratefor the entire system was 1,300 gallons per minute.
To monitor the treatment system the BRAC cleanup team tested the levelof RDX, the most conservative contaminant, between the lead and polish tanks ona weekly basis with an on-site colorimetric method. When the team detected anRDX concentration of 5 Fg/L, it shut the system down and changed the lead tankfor off-site regeneration. During the first year of the plant’s operation, the projectteam noticed that the lead tank was being replaced far more often than had beenanticipated. After evaluating the system they realized that the system’s flow ratewas too high for the efficient removal of the RDX although the contact time forTNT appeared to be satisfactory. Therefore, their challenge was to find a way tomaximize the useful life of the GAC without redesigning the entire treatmentsystem.

V-11
Innovative Approach
The BRAC cleanup team decided that the best method of optimizing thesystem was to use the on-site analytical method to detect breakthrough on thepolishing tank before it violated their discharge permit. In doing so, the lead tankwould be much more fully loaded with contaminants than if its changeout werebased solely on the early breakthrough of RDX as it left the lead tank. As a result,the team developed four scenarios for evaluating the treatment systems remainingcontaminant removal capacity to be compared with the original sampling andanalysis protocols. Each scenario required someone to analyze samples fromdifferent locations on various schedules. To determine the most cost-effectivescenario, the project team tested each method over four cycles of carbon change-out starting in December 1997. After the first two cycles, the project team addedan additional scenario to accommodate lower concentration loadings that wouldlikely occur over time. Each of the scenarios relied on the on-site colorimetricmethod for the data the BRAC cleanup team used to make plant shutdown andtank changeout decisions.
Results
The BRAC cleanup team determined that the most cost-effective scenariowas the last one developed. The new protocols called for sampling and analyzingthe effluent of the lead tank after the first 5 weeks of the treatment cycle (theexperiments indicated no RDX would break through the polish tank that quickly). The RDX ratio of an influent sample and the lead tank effluent concentrations ofRDX indicated when breakthrough would occur. As long as the ratio stayedbelow 0.25, the sampling and analysis of the lead tank effluent were performedevery other week. When the ratio passed 0.25 but was less than 0.5, the samplingand analysis were performed every week. Finally, when the ratio passed 0.5, thesampling and analysis was performed every other day at the lead tank effluent lineand at the treatment system effluent line until break through was observed, atwhich time the system was shut down for change-out. The use of on-site analysisallowed these sampling protocols to be tested at a reasonable cost. The newsampling protocols saved the project approximately $180,000 per year (or 45percent) in operation and maintenance costs compared to the cost of an approachof using off-site analysis and the original sampling protocols.
Lessons Learned
Although the capabilities and limitations of the RDX/TNT colorimetricmethod for this groundwater pump-and-treat system were thoroughly researchedbefore it was selected, a number of problems were discovered during the initialstages of its integration into the project, and the following lessons were learnedfrom this experience:

V-12
C Method requirements must be clearly provided to the contractor, and thedesignated operator must be thoroughly trained in its execution;
C Site-specific matrices may require method modifications—high nitratelevels in the water at the site reduced the method performance, andmodifications were required to meet project objectives;
C The data generated on site were essential for the optimization process; andC Undocumented analytical issues may exist, even for well researched
methods; therefore, a method evaluation procedure is often needed toresolve any potential site-specific problems.

V-13
Section 4: Innovative Dynamic StrategiesDuring Initial Site Screening
This section provides three examples of the use of dynamic strategiesduring the initial site screening process. Although a couple of these sites did notnecessarily take full advantage of dynamic field activities to reduce the timeneeded to reach a site decision, they demonstrated the potential for integratingdynamic field activities more completely into initial site screening programs (e.g.,CERCLA site assessment). Cost savings for these sites have not been calculatedbecause the project goals were only to screen sites. The sites discussed in thissection, and their innovative strategies, include:
C A dry cleaner site in Florida that used a colorimetric detector tube to tracka groundwater plume;
C A lead smelter site that used XRF during the removal evaluation to obtainthe data needed to list the site on the National Priorities List (NPL); and
C A dry cleaner site in which groundwater samples collected with a directpush rig were analyzed with a field GC/PID to attribute a PCE plume to itssource and use the data for a CERCLA Hazard Ranking System (HRS)package.
A summary of the activities at these sites is presented in Exhibit V-3.
Exhibit V-3Summary of Innovative Dynamic Strategies
During Initial Site Screening
Project Topic B&M Laundromat Jacobs Smelter Iceland CoinLaundry
Contaminant PCE Lead, Arsenic PCE
FAM Colorimetric detectiontubes
XRF GC/PID
Benefits andApplications
Inexpensive screeningtechnique can be usedto supply field GC withsamples
Integrated SiteInspection/ RemovalAction reducing timeneed to list site
DP and field GC usedto improve HRSpackage QC anddetermine the sourcefor contaminated wells. Data used in HRSpackage
B&M Laundromat, Escambia County, Florida
The B&M Laundromat operated commercial washing machines, clothesdryers, and a dry-cleaning unit between 1968 and 1974. A 55-gallon drum of PCE

V-14
was used to top off the level of PCE in the dry-cleaning unit as needed. Employ-ees transferred PCE to the unit with a hand pump mounted on the top of the drum. Any spillage during transfer or cleaning of the unit was hosed down with waterand swept out of the back of the building. The site first came to the attention ofthe State of Florida when an areal survey was conducted to assess potentialsources of contamination of two nearby supply wells.
Innovative Approach
The field team used a combination of direct push groundwater samplingand an innovative modification of a colorimetric gas detector tube method todevelop vertical profiles of PCE levels in the subsurface 19 to 30 feet bgs. Theseprofiles were developed at seven locations with 59 samples that had all beencollected within a single day. An SOP for the detector tube method is available athttp://www.epa.gov/superfund/programs/dfa/fldmeth.htm#detect. It is specific tochlorinated ethenes and, for PCE alone, it has a detection limit of 8 µg/L. Themethod only takes a minute, and the disposables cost about $4.00 per sample. A24 ml sample of water (or 10 cc of soil placed in 10 ml of ultrapure deionizedwater) is put in a 40 ml vial with a septum cap and vigorously shaken. The cap isthen punctured by two hollow needles. One is used to allow air into the vial andthe other to extract the headspace air by hand pumping through the colorimetrictube. As the headspace air is extracted, the induced vacuum draws ambient airthrough the second needle where it bubbles up through the water sample. Thispurges the water of its volatile content. The chlorinated ethenes react with thereagent in the tube, and a direct reading of the relative concentration is provided. The greater the number of chlorine ions, the greater the sensitivity. Consequently,the method is very sensitive to PCE and much less sensitive to vinyl chloride.
Results
The information provided by the detector tube method was used to selectthree new monitoring well locations, one background and two downgradient, andto select samples for more rigorous off-site analysis. The investigation confirmeda groundwater flow direction to the northeast towards the contaminated irrigationwells. Off-site analysis of the monitoring wells confirmed the existence of asignificant PCE plume, including concentrations as high as 2,000 µg/L in one ofthe new monitoring wells. Since this concentration is greater than 1 percent of thesolubility of PCE, there was a high likelihood of a DNAPL at this locationaccording to the Agency’s “1 percent rule.”
In addition, the field analyses were successfully used to choose the mostcontaminated soil samples for off-site confirmation analysis, as well as to showrelative levels of contamination in the other core samples. By using the on-siteanalysis the investigation team was able to reduce the number of samples analyzed

V-15
off-site and to focus these samples on the locations that would provide the mostuseful information.
Because the federal MCL for PCE is 5 µg/L and the State of Florida MCLis 3 µg/L, the site inspection indicated that the site posed a substantial threat to thegroundwater supply of 18,000 people within one mile of the site. Accordingly,further site work was recommended.
Potential Benefits and Applications
Historically, there had been a general programmatic policy of limiting thenumber of samples collected at a site until there was a clear indication that the siteshould be considered for the NPL. As a result, the project planners developed awork plan with a limited scope of work so that additional site decisions andactivities could be made in stages. However, the equipment available to theproject team was ideally suited for a dynamic field activity and it could have beenused to collect all the data necessary to make the site decision in a single mobili-zation. For example, if the dynamic work plan had allowed a continuation of thefield work to identify any DNAPL source during the initial sampling, thenadditional samples could have been collected to link the source area to receptors. The resulting costs would have been only slightly more than the originallyscheduled field work, since only one work plan, mobilization, and final reportwould have been needed. In addition, the complete report would have provideddecision makers with detailed information about the size of the plume and theactual threat to drinking water supplies, enabling them to implement correctiveaction expeditiously if needed.
Jacobs Smelter, Stockton, Utah
Jacobs Smelter is located in the northeastern Utah City of Stockton. Itoperated from 1872 to perhaps the early 1900s, refining lead and silver ore. TheState of Utah collected some initial soil and sediment samples from residentyards, fields, and former smelting locations in 1997 and found extremely highlevels of lead (68,400 mg/kg) and arsenic (6,550 mg/kg), prompting furtherinvestigation at the site. For more information about this site, the reader can referto the HRS documentation package located on the Internet at: http://www.epa.gov/oerrpage/superfund/sites/docrec/pdoc1566.pdf.
Innovative Approach
The project planners used a dynamic strategy to implement a CERCLAintegrated site assessment/removal action between August 10, 1998, and October9, 1998. A total of 5,296 samples were collected and analyzed on site with XRFat 252 properties to delineate contamination, begin removal activities, and collect

V-16
data for HRS purposes. Composite sampling of the surface soils (0–2 inches bgs)was used to determine if lead levels exceeded the action level of 400 mg/kg, orarsenic was detected above 100 mg/kg. Because XRF results are greatly influe-nced by the sampling and processing procedures that are used, the QAPP outlineddetailed procedures that would ensure consistent results. The samples werecollected with a stainless steel spoon and dried. Before analysis, the driedsurficial samples were passed through a 60 mesh sieve (i.e., openings of 0.250mm). If XRF results indicated high levels, three more samples (2–6 inches bgs,6–12 inches bgs, and 12–18 inches bgs) would be collected at each of the loca-tions where the initial composite samples were gathered. After being dried andpassed through a 10 mesh sieve (i.e., openings of 2.00 mm), they again wereanalyzed with XRF.
As a QC procedure, 10 percent of these samples were sent to an off-sitelaboratory for confirmatory analysis with SW-846 Method 6010. Because XRFanalysis does not destroy the sample, the identical sample was used for theconfirmatory analysis, thereby minimizing the potential for site heterogeneity toaffect the comparison of results. For detailed information on the performance ofXRF analyzers and how they can be used for specific project objectives, the readercan refer to information on the Dynamic Field Activities web site(http://www.epa.gov/superfund/programs/dfa/fldmeth.htm#xray).
Results
The results indicated that more than half of the soil composites were nearor exceeded the 400 mg/kg action level for lead, and the followup samplingindicated that 30 residences had lead soil levels greater than 3,000 mg/kg. Because the investigation integrated remedial and removal activities, projectmanagers were able to schedule a removal action at the highly contaminatedhomes immediately.
A comparison of on-site and off-site confirmation results for lead showeda good correlation. However, the correlation with the arsenic results was not goodbecause elevated levels of lead in the samples interfered with the XRF analysisand masked its presence. Fortunately, because the levels of lead that interferedwith arsenic analysis were in excess of the action level, this analytical problem didnot affect the decisions that were made.
Potential Benefits and Applications
By using an on-site XRF for this investigation, the field investigation wascompleted in one mobilization over a two-month period. The real-time analysisallowed for decisions to be made in the field on whether a given area requiredfurther sampling. The XRF and off-site confirmation sample results showedsufficiently close correlation to allow for decisions on whether or not to excavate
V-17
an area based on the field instrument results alone. By integrating the remedialand removal programs, project managers were able to streamline site decisionmaking and take rapid action.
Iceland Coin Laundry and Dry Cleaning, Vineland, NewJersey
Iceland Coin Laundry and Dry Cleaning operated in the southern NewJersey Town of Vineland between approximately 1963 and 1971. According to theproperty owner, the laundry had four coin-operated dry cleaning units. Theseeight-pound-capacity machines each used four gallons of PCE. At the time ofoperation, the building had two 14-foot-deep cesspools with a 40-foot drain field. For more detailed information about this site, the reader can refer to the HRSdocumentation package located on the Internet at: http://www.epa.gov/oerrpage/superfund/sites/docrec/pdoc1561.pdf.
Innovative Approach
DP equipment was used to collect 50 groundwater samples at 14 locations. Forty-four of these were analyzed on site with a portable GC/PID capable ofdetecting the contaminants of concern (PCE, TCE, and 1,2-DCE).
Results
By combining DP equipment with a portable GC/PID, the field team wasable to develop a vertical profile of the contaminant plume and estimate its arealextent before placing monitoring wells. The investigation confirmed that theIceland property was the source of a PCE plume that was impacting private watersupply wells. It also showed the location of the highest contaminant concentra-tions as well as identify several potential source areas on the site.
Potential Benefits and Applications
There were two interesting aspects to this site inspection. First, the HRSpackage was completed with data generated from DP groundwater sampling ratherthan traditional monitoring wells. Second, the on-site analysis seemed to providebetter data quality than the fixed-laboratory analysis, providing an example of on-site measurements supplying a quality check for off-site results. Evidence of thisconclusion is provided by:
C The fixed laboratory reported common laboratory solvents, such asacetone, methylene chloride, and carbon disulfide in field blanks, tripblanks, and field samples;

V-18
C The on-site GC provided consistently higher concentrations of PCE;C The validation company rejected a detection of 1,1,2,2-tetrachloroethane at
the off-site laboratory due to inadequate instrument calibrations; andC A separate round of sampling used a different fixed laboratory for
confirmation analysis and a comparison of the results showed betteragreement between the on-site and fixed laboratory results.
Consequently, this site provides evidence that not only can DP ground-water sampling and on-site analysis be used to develop an HRS package, but alsothey can help to improve the package with another level of QC that provides moredata to support the site’s listing.

V-19
Conclusion
The case studies provided in this chapter demonstrate that dynamic fieldactivities are capable of reducing the time and cost of field work at contaminatedsites for a wide range of site activities. They can also substantially improve QCby providing real-time data that can be used to correct problems or even toprovide another method of verifying fixed-laboratory data. A summary of someof the specific benefits that these case studies document include:
C Reduced administrative costs for regulators and contractors by eliminatingiterations of project planning, interim report writing, and documentreview;
C Reduced remediation and O&M costs through detailed sitecharacterization that can help focus subsequent field work;
C Improved project QC;C Eliminated delays in getting results caused by an over-booked off-site
laboratory, thereby increasing the effective use of excavation equipment;C Improved data quality that met all decision criteria established in project
planning documents;C Improved overall project efficiency;C Reduced total project costs by 15 to 45 percent; andC Reduced project time by 33 to 60 percent.
Although these benefits are significant, they cannot be attained simply byusing FAMs. Successful dynamic field activities require a concerted effort by allthe parties involved in a project to develop a project plan that allows decisions tobe made as data are generated. In order for this goal to be accomplished, theproject must develop:
C Clear lines of communication;C Mutually agreed upon criteria for specific decisions so that actions can be
taken when those criteria are met;C Contingency procedures and contracts that can be implemented rapidly if
problems are encountered; and,C Dynamic work plans that allow project activities to be modified as new
information is received.


References


R-1
References
American Chemical Society (ACS). 1999. DQO-PRO [software].http://www.acs-envchem.duq.edu/dqopro.htm
American National Standards Institute (ANSI). [Post-1996 Draft]. American National StandardMeasurement and Associated Instrumentation Quality Assurance for Radioassay Laboratories.N42.23-D2.
Applegate, J.L., D.M. Fitton. 1997. Rapid site assessment applied to the Florida Department ofEnvironmental Protection’s Drycleaning Solvent Cleanup Program. Proceedings of SuperfundXVIII Conference, December 2-4, 1997. pp. 695-703.
Argonne National Laboratory. 1995. Expedited Site Characterization at the Marine Corps AirStation, Tustin, California: Phase I Report and Recommendations for Phase II. Prepared forU.S. Department of Defense, Department of Navy, Southwest Divisions, Naval FacilitiesEngineering Command, by Argonne national Laboratory, Argonne, Illinois.
ASTM. 1995. Standard guide to site characterization for environmental purposes with emphasison soil, rock, the vadose zone, and ground water, D5730-95. Annual Book of ASTM Standards,Conshohocken, PA. http://www.astm.org
ASTM. 1995. Standard guide to site characterization for environmental purposes with emphasison soil, rock, the vadose zone, and ground water, D5730-95. Annual Book of ASTM Standards,Conshohocken, PA. http://www.astm.org
ASTM. 1998a. Standard practice for expedited site characterization of vadose zone and groundwater contamination at hazardous waste contaminated sites, D 6235-98. Annual Book of ASTMStandards, Conshohocken, PA. http://www.astm.org
ASTM. 1998b. Accelerated site characterization for confirmed or suspected petroleum releases,E1912-98. Annual Book of ASTM Standards, Conshohocken, PA. http://www.astm.org
Bechtel Environmental, Inc. 1997. Loring Air Force Base. Technical Memorandum:Confirmation Analysis by On-site Laboratory. U.S. Air Force Center for EnvironmentalExcellence (AFCEE), Brooks Air Force Base, Texas.
Bechtel Environmental, Inc. 1998a. Loring Air Force Base, Remediation of Basewide SurfaceWater/Sediment (OU-13) and Removal at Base Exchange Service Station Wetland (OU-5),Quality Assurance Project Plan, Revision 1. U.S. Air Force Center for EnvironmentalExcellence (AFCEE), Brooks Air Force Base, Texas.

R-2
Bechtel Environmental, Inc. 1998b. Loring Air Force Base, Remediation of Basewide SurfaceWater/Sediment (OU-13) and Removal at Base Exchange Service Station Wetland (OU-5), FieldSampling Plan, Revision 1. U.S. Air Force Center for Environmental Excellence (AFCEE),Brooks Air Force Base, Texas. Bechtel Environmental, Inc. 1998c. Loring Air Force Base, Remediation of Basewide SurfaceWater/Sediment (OU-13) and Removal at Base Exchange Service Station Wetland (OU-5),Remedial Action Work Plan, Revision 1. U.S. Air Force Center for Environmental Excellence(AFCEE), Brooks Air Force Base, Texas.
Bechtel Environmental, Inc. 1998d. Loring Air Force Base, Remediation of Basewide SurfaceWater/Sediment (OU-13) and Removal at Base Exchange Service Station Wetland (OU-5),Remedial Action Interim Report for 1997 Construction Season. U.S. Air Force Center forEnvironmental Excellence (AFCEE), Brooks Air Force Base, Texas.
Bechtel Environmental, Inc. 1998e. Loring Air Force Base, Remediation of Basewide SurfaceWater/Sediment (OU-13) and Removal at Base Exchange Service Station Wetland (OU-5),Remedial Action Work Plan, Addendum 1, April 1998. U.S. Air Force Center for EnvironmentalExcellence (AFCEE), Brooks Air Force Base, Texas.
Bechtel Environmental, Inc. 1998f. Loring Air Force Base. OU-13 Data ManagementImplementation Plan. U.S. Air Force Center for Environmental Excellence (AFCEE), BrooksAir Force Base, Texas.
Bechtel Environmental, Inc. 1999. Loring Air Force Base, Remedial Action Report forFlightline Drainage Ditch Wetlands, East Branch Greenlaw Brook Wetlands, Greenlaw Brook,and Chapman Pit Manganese Sediment Removal Area, 1997 and 1998 Construction Seasons. U.S. Air Force Center for Environmental Excellence (AFCEE), Brooks Air Force Base, Texas.
Brown, E.T. 1998. Legal considerations governing data and EPA’s amendment of SW-846. Soil Sampling for Volatile Organics, Proceedings, 17 February 1998.
Burton, J.C. 1993. Expedited site characterization: A rapid, cost-effective process forpreremedial site characterization, Superfund XIV, Vol. II. Hazardous Materials Research andControl Institute, Greenbelt, MD, pp. 809-826. http://www.anl.gov/ER/Refs.html
Burton, J.C., J.L. Walker, P.K. Aggarwal, and W.T. Meyer. 1995. Argonne's expedited sitecharacterization: An integrated approach to cost- and time-effective remedial investigation, Paper95-TA47.04. Proceedings of the 88th Annual Meeting and Exposition of the Air and WasteManagement Association, San Antonio, Texas, June 18-23, 1995. http://www.anl.gov/ER/Refs.html
California Military Environmental Coordination Committee (CMECC). 1996. Field AnalyticalMeasurement Technologies, Applications, and Selection. http://www.epa.gov/region09/qa/r9-qadocs.html

R-3
Craig, H., G. Ferguson, A. Markos, A. Kusterbeck, L. Shriver-Lake, T. Jenkins, and P. Thorne. 1996. Field Demonstration of On-Site Analytical Methods for TNT and RDX in Groundwater. Proceedings of the Great Plains-Rocky Mountain Hazardous Substance Research Center(HSRC)/Waste Education and Research Consortium (WERC) Joint Conference on theEnvironment, Albuquerque, NM, May 21-23, 1996. http://www.engg.ksu.edu/HSRC/96Proceed/craig.pdf
Crockett, A.B., H.D. Craig, T.F. Jenkins, and W.E. Sisk. 1996. Field Sampling and SelectingOn-Site Analytical Methods For Explosives in Soil. EPA/540/R-97/501. U.S. EPA, Office ofResearch and Development and Office of Solid Waste and Emergency Response, Washington,DC. http://clu-in.org/download/toolkit/explosiv.pdf
Crockett, A.B., H.G. Craig, and T. Jenkins. 1999. Field Sampling and Selecting On-siteAnalytical Methods for Explosives in Water. Federal Facilities Forum Issue, EPA/600/S-99/002,U.S. Environmental Protection Agency. http://www.epa.gov/tio/tsp/download/water.pdf
Crumbling, D.M. 2000. Improving the cost effectiveness of hazardous site characterization andmonitoring, FailSafe, January 2000. http://www.felsef.org/jan00.htm#meo4
Crumbling, D.M., C. Groenjes, B. Lesnik, K. Lynch, J. Shockley, J. Van Ee, R. Howe, L. Keith,J. McKenna. 2001. Managing uncertainty in environmental decisions. Environmental Scienceand Technology, v.35, no. 19, pp 404 – 409.
Davidson, J. R, and N. L. Hassig, J. E. Wilson, R. O. Gilbert. 2001. Visual Sample Plan,Version 1.0, User's Guide, PNNL-13490.
Ensys. TNT Soil Test System, Strategic Diagnostics Inc. Newark, DE.
Ensys. RDX Soil Test System, Strategic Diagnostics Inc., Newark, DE.
Florida Department of Environmental Protection. 2000. Final Site Inspection Report for FormerB & M Laundromat Site, Pensacola, Florida.
Florida Department of Environmental Protection. 2000. Site Inspection Work Plan for Former B& M Laundromat Site, Pensacola, Florida.
Gibbons, R.D. 1994. Statistical Methods for Groundwater Monitoring. Wiley, New York.
Gilbert, R.O. 1987. Statistical Methods for Environmental Pollution Monitoring. Van NostrandReinhold, New York.
Gy, P. 1982. Sampling for Analytical Purposes. John Wiley & Sons, Chichester, England.

R-4
Jenkins, T.F, C.L. Grant, G.S. Brar, P.G. Thorne, T.A. Ranney, and P.W. Schumacher. 1996. Assessment of Sampling Error Associated with Collection and Analysis of Soil Samples atExplosives-Contaminated Sites. CRREL Special Report 96-15. U.S. Army Corps of EngineersCold Regions Research and Engineering Laboratory, Hanover, NH. http://www.crrel.usace.army.mil/techpub/CRREL_Reports/reports/SR96_15.pdf
Jenkins, T.F., P.G. Thorne, M.E. Walsh. 1994. Field Screening Method for TNT and RDX inGroundwater, CRREL Special Report 94-14, U.S. Army Corps of Engineers.
Jenkins, T.F., M.E. Walsh, P.G. Thorne, S. Thiboutot, G. Ampleman, T.A. Ranney, and C.L.Grant. 1997. Assessment of Sampling Error Associated with Collection and Analysis of SoilSamples at a Firing Range Contaminated with HMX. CRREL Special Report 97-22. U.S. ArmyCorps of Engineers Cold Regions Research and Engineering Laboratory, Hanover, NH.http://www.crrel.usace.army.mil/techpub/CRREL_Reports/reports/SR97_22.pdf
MARSSIM. 2000. Multi-Agency Radiation Survey and Site Investigation Manual, Revision 1.NUREG-1575 Rev 1, EPA 402-R-97-016 Rev 1. August 2000.http://www.epa.gov/radiation/marssim/filestoc.htm
McDonald, M.G. and A.W. Harbaugh. 1988. A Modular Three-Dimensional Finite DifferenceGround-Water Flow Model. U.S. Geological Survey Techniques of Water ResourcesInvestigations, Book 6, Chapter A1.
Myers, J.C. 1997. Geostatistical Error Management: Quantifying Uncertainty for Environ-mental Sampling and Mapping. Van Nostrand Reinhold, New York. http://www.gemdqos.com
New Jersey Department of Environmental Protection. 1994. Field Analysis Manual. Trenton,NJ. http://www.state.nj.us/dep/srp/publications/techguide.htm
New Jersey Department of Environmental Protection. 1997. Expanded Site InvestigationReport: Iceland Coin Laundry and Dry Cleaning, Vineland, New Jersey.
Pitard, F.F. 1993. Pierre Gy’s Sampling Theory and Sampling Practice: Heterogeneity,Sampling Correctness, and Statistical Process Control. 2nd ed. CRC Press, Boca Raton, FL.
Remtech, Inc. 2000a. Field Sampling Plan for Treatment System Operation and MaintenanceServices, Contaminated Groundwater Remediation, Explosives Washout Lagoons, UmatillaChemical Depot Hermiston, Oregon, Revision 1. West Richland, Washington.
Remtech, Inc. 2000b. Quality Assurance Project Plan for Treatment System Operation andMaintenance Services, Contaminated Groundwater Remediation, Explosives Washout Lagoons,Umatilla Chemical Depot Hermiston, Oregon, Revision 1. West Richland, Washington.
Robbat, A. 1997a. A Dynamic Site Investigation Adaptive Sampling and Analysis Program forOperable Unit 1 at Hanscom Air Force Base, Bedford, Massachusetts, Funded by the U.S.Environmental Protection Agency, Washington, DC. http://www.epa.gov/tio/char.htm

R-5
Robbat, A. 1997b. A Guideline for Dynamic Workplans and Field Analytics: The Keys to Cost-effective Site Characterization and Cleanup, Environmental Technology Initiative, through theU.S. Environmental Protection Agency, Washington, DC.http://clu-in.org/download/char/dynwkpln.pdf
Ryti, R. T. 1993. Superfund soil cleanup: Developing the piazza road remediation design. Journal of the Air and Waste Management Association, v. 43, February. pp. 197- 202.
Simmons, B.P. 1999. Using field methods–experiences and lessons: defensibility of field data.The 18th Annual National Conference on Managing Quality Systems for EnvironmentalPrograms, 13-16 April 1999, Cincinnati, Ohio.http://moe.krellinst.org/cmst/Cmst-Cp_reports/Jun99/td-legalpap.pdf
Thiboutot S., G. Ampleman, T. F. Jenkins, C. L. Grant, P. G. Thorne, M. E. Walsh, T. A.Ranney, J. Esparza, M. H. Stutz. 1998. Site characterization for explosives contamination atmilitary firing ranges. Proceedings of Third Tri-Service Environmental Technology Workshop,Environmental Technology: Preserving the Balance, 18-20 August 1998, San Diego, CA. http://aec-www.apgea.army.mil:8080/prod/usaec/et/etw/13.htm
Thorne, P. G. and T. F. Jenkins. 1995. Development of a field method for quantifyingammonium picrate and picric acid in soil and water. Special Report 95-20. Cold RegionsResearch and Engineering Laboratory, USACE.http://www.crrel.usace.army.mil/techpub/CRREL_Reports/reports/SR95_20.pdf
U.S. ACE. 1997. Chemical Quality Assurance for Hazardous, Toxic, and Radioactive Waste(HTRW) Projects. Manual No. 200-1-6. Washington, DC.http://www.usace.army.mil/inet/usace-docs/eng-manuals/em200-1-6/entire.pdf
U.S. ACE. 1998. Remedial Action Report: Contaminated Groundwater Remediation Project,Explosives Washout Lagoons, Groundwater Operable Unit, Umatilla Chemical Depot. SeattleDistrict, U.S. Army Corps of Engineers.
U.S. ACE. 1999. Breakthrough Study and Plant Optimization Report, Umatilla ChemicalDepot. Seattle District, U.S. Army Corps of Engineers.
U.S. DOE. 1995a. ELIPGRID-PC: PC-Based Hot-Spot Probability Calculations [software]. http://www.hanford.gov/dqo/project/level6/level6.html
U.S. DOE. 1995b. Guidance for Radiochemical Data Validation, Draft RD4.
U.S. DOE. 1998. Expedited Site Characterization, Innovative Technology Summary Report,EM-0420. Office of Environmental Management, Gaithersburg, MD. http://ost.em.doe.gov/pubs/itsrs/itsr77.pdf
U.S. DOE. 2000. Visual Sampling Plan, beta version 0.9h [Software]. http://dqo.pnl.gov/vsp/
R-6
U.S. EPA [web page]. Superfund Sites, Hazard Ranking System Documentation Package,Iceland Coin Laundry Area Ground Water Plume, Vineland, Cumberland County, New Jersey. http://www.epa.gov/oerrpage/superfund/sites/docrec/pdoc1561.pdf
U.S. EPA [web page]. RCRA Corrective Action Workshop on Results-Based ProjectManagement, Cambridge, Massachusetts. July 11-13, 2000.http://www.epa.gov/epaoswer/hazwaste/ca/workshop.htm#Workshop
U.S. EPA. 1988. Guidance for Conducting Remedial Investigations and Feasibility StudiesUnder CERCLA, Interim Final, EPA/540/G-89/004. OSWER Directive No. 9355.3-01, Officeof Emergency and Remedial Response, Washington, D.C.
U.S. EPA. 1989a. Methods for Evaluating the Attainment of Cleanup Standards, Vol. 1: Soilsand Solid Media. EPA/230/02-89/042. Office of Policy, Planning & Evaluation, Washington,DC. http://www.epa.gov/swertio1/download/stats/vol1soils.pdf
U.S. EPA. 1989b. Risk Assessment Guidance for Superfund, Volume 1: Human HealthEvaluation Manual, Part A. EPA/540/1-89/002. Office of Emergency and Remedial Response,Washington, DC. http://www.epa.gov/superfund/programs/risk/ragsa/index.htm
U.S. EPA. 1990. A Rationale for the Assessment of Errors in the Sampling of Soils. EPA/600/4-90/013. Environmental Monitoring Systems Laboratory, U.S. Environmental Protection Agency,Las Vegas, NV. http://www.clu-in.org/download/stats/rationale.pdf
U.S. EPA. 1991. GEO-EAS 1.2.1: Geostatistical Environmental Assessment Software. User’sGuide. EPA/600/8-91/008. Environmental Monitoring Systems Laboratory, Las Vegas, NV.http://www.epa.gov/ada/csmos/models/geoeas.html
U.S. EPA. 1992a. Compendium of ERT Field Analytical Procedures. OSWER 9360.4-04,NTIS: PB92-963405. Office of Emergency and Remedial Response, Washington, DC.http://www.ert.org/
U.S. EPA. 1992b. Guidance for Data Useability in Risk Assessment (Part A). Publication9285.7-09A, NTIS: PB92-963356. Office of Emergency and Remedial Response, Washington,DC.
U.S. EPA. 1992c. Guidance for Methods Development and Methods Validation for the RCRAProgram. Office of Solid Waste, Washington, DC. http://www.epa.gov/epaoswer/hazwaste/test/methdev.pdf
U.S. EPA. 1992d. Methods for Evaluating Attainment of Cleanup Standards, Vol. 2: GroundWater. EPA/230-R/92/014, NTIS: PB94-138815. Office of Policy, Planning, and Evaluation,Washington, DC. http://www.epa.gov/swertio1/download/stats/vol2gw.pdf

R-7
U.S. EPA. 1992e. Preparation of Soil Sampling Protocols: Sampling Techniques andStrategies. EPA/600/R92/12b. Office of Research and Development, Washington, DC. http://www.epa.gov/ORD/publications/
U.S. EPA. 1992f. Test Methods for Evaluating Solid Waste, Final Update of Third Edition,SW-846. Office of Solid Waste, Washington, D.C. http://www.epa.gov/epaoswer/hazwaste/test/sw846.htm
U.S. EPA. 1993a. Data Quality Objectives Process for Superfund: Interim Final Guidance,EPA 540-R-93-071, NTIS PB94-963203, Washington, DC.
U.S. EPA. 1993b. Preparation of Soil Sampling Protocols: Sampling Techniques andStrategies, EPA/600/R-92/128. Environmental Monitoring Systems Laboratory, Office ofResearch and Development, Las Vegas, NV.
U.S. EPA. 1993c. Subsurface Characterization and Monitoring Techniques: A Desk ReferenceGuide. Volume I: Solids and Ground Water, Appendices A and B. EPA/625/R-93/003a, NTIS:PB94-136272. and Volume II: The Vadose Zone, Field Screening and Analytical Methods,Appendices C and D. EPA/625/R-93/003b, NTIS: PB94-131497. Office of Research andDevelopment, Washington, DC.
U.S. EPA. 1994a. Data Quality Objectives Decision Error Feasibility Trials (DQO/DEFT):User’s Guide (EPA QA/G-4D). EPA/600/R-96/056. Office of Research and Development,Quality Assurance Division, Washington, DC. http://www.epa.gov/quality/qa_docs.html
U.S. EPA. 1994b. Method 8330: Nitroaromatics and Nitramines by High Performance LiquidChromatography (HPLC). Test Methods for Evaluating Solid Waste, Physical/ChemicalMethods, SW-846. Office of Solid Waste, Washington, DC.http://www.epa.gov/epaoswer/hazwaste/test/main.htm
U.S. EPA. 1994c. QA/G-4 Guidance for the Data Quality Objectives Process, EPA/600/R-96/055.
U.S. EPA. 1994d. SOP #2109: Photovac GC Analysis for Air, Soil Gas, Water, and Soil.Compendium of ERT Field Analytical Procedures, OSWER Directive 9360.4-04.
U.S. EPA. 1994e. Statistical Methods for Evaluating the Attainment of Cleanup Standards, Vol.3: Reference-Based Standards for Soils and Solid Media. EPA/230/R-94/004. Office of Policy,Planning & Evaluation, Washington, DC. http://www.epa.gov/swertio1/download/stats/vol3-refbased.pdf
U.S. EPA. 1994f. USEPA Contract Laboratory Program National Functional Guidelines forInorganic Data Review. EPA/540/R-94/013. Office of Emergency and Remedial Response,Washington, DC. http://www.epa.gov/superfund/programs/clp/guidance.htm

R-8
U.S. EPA. 1995a. Cost and Performance Report: Soil Washing at the King of Prussia TechnicalCorporation Superfund Site Winslow Township, New Jersey. U.S. Environmental ProtectionAgency, Office of Solid Waste and Emergency Response, Technology Innovation Office. http://bigisland.ttclients.com/frtr/full_reports/vol_4/Kop/Kop.htm
U.S. EPA. 1995b. EPA Directive 2185—Good Automated Laboratory Practices: Principles andGuidance to Regulations for Ensuring Data Integrity in Automated Laboratory Operations.EPA/220/B-95/006. Office of Information Resources Management. http://www.epa.gov/irmpoli8/irm_galp/index.html
U.S. EPA. 1995c. Superfund Program Representative Sampling Guidance, Volume 1: Soil.Interim Final. EPA/540/R-95/141, NTIS: PB96-963207. Office of Emergency and RemedialResponse, Washington, DC. http://www.ert.org
U.S. EPA. 1995d. Superfund Program Representative Sampling Guidance, Volume 5: Waterand Sediment, Part I -- Surface Water and Sediment. Interim Final. OSWER 9360.4-16. Officeof Emergency and Remedial Response, Washington, DC. http://www.ert.org
U.S. EPA. 1996a. Environmental Investigations Standard Operating Procedures and QualityAssurance Manual (EISOPQAM). Region 4, Science and Ecosystem Support Division, Athens,GA. http://www.epa.gov/region04/sesd/eisopqam/eisopqam.html
U.S. EPA. 1996b. Explosives in Water Field Screening Technologies UMDA and SUBASEBangor (draft). Prepared by Black & Veatch Special Projects Corp., Tacoma, WA, for U.S.Environmental Protection Agency Region 10, Project Number 71370
U.S. EPA. 1996c. Sampler’s Guide to the Contract Laboratory Program. EPA/540/R-96/032.Office of Solid Waste and Emergency Response, Washington, DC.http://www.epa.gov/oerrpage/superfund/programs/clp/guidance.htm
U.S. EPA. 1996d. Soil Screening Guidance: Technical Background Document (TBD).EPA/540/R-95/128. Office of Emergency and Remedial Response, Washington, DC. http://www.epa.gov/superfund/resources/soil/introtbd.htm
U.S. EPA. 1996e. Soil Screening Guidance: User’s Guide. EPA/540/R-96/018. Office ofEmergency and Remedial Response, Washington, DC. http://www.epa.gov/superfund/resources/soil/index.htm#user
U.S. EPA. 1997a. Data Quality Assessment Statistical Toolbox (DataQUEST) (EPA QA/G-9D).EPA/600/R-96/085. Office of Research and Development, Quality Assurance Division,Washington, DC. http://www.epa.gov/quality/qa_docs.html
U.S. EPA. 1997b. Draft Final Remedial Investigation Report for Operable Units 1 and 2Marine Corps Air Facility Tustin, California, CTO-0049/1165.

R-9
U.S. EPA. 1997c. Expedited Site Assessment Tools For Underground Storage Tank Sites: AGuide for Regulators, EPA 510-B-97-001. Office of Solid Waste and Emergency Response,Washington, DC. http://www.epa.gov/swerust1/pubs/index.htm
U.S. EPA. 1997d. Test Methods for Evaluating Solid Waste, SW-846. Office of Solid Waste,Washington, DC. http://www.epa.gov/epaoswer/hazwaste/test/main.htm
U.S. EPA. 1998a. Guidance for Quality Assurance Project Plans (EPA QA/G-5). EPA/600/R-98/018. Office of Research and Development, Quality Assurance Division, Washington, DC. http://www.epa.gov/quality/qa_docs.html
U.S. EPA. 1998b. Environmental Technology Verification Report: Immunoassay Kit—StrategicDiagnostics, Inc., EnviroGard PCB Test Kit. EPA/600/R-98/113. Office of Research andDevelopment, Washington, DC. http://www.epa.gov/etv/02/egard.pdf
U.S. EPA. 1999a. Contract Laboratory Program (CLP) Statement of Work (SOW) forInorganics Analysis, Multi-Media, Multi-Concentration. SOW ILM04.1. http://www.epa.gov/superfund/programs/clp/methods.htm
U.S. EPA. 1999b. Contract Laboratory Program (CLP) Statement of Work (SOW) for OrganicsAnalysis , Multi-Media, Multi-Concentration. SOW OLM04.2. http://www.epa.gov/superfund/programs/clp/methods.htm
U.S. EPA. 1999c. 40 CFR Part 136—Guidelines Establishing Test Procedures for the Analysisof Pollutants. http://www.epa.gov/epacfr40/chapt-I.info/subch-D/40P0136.pdf
U.S. EPA. 1999d. 40 CFR Part 300—National Oil and Hazardous Substance PollutionContingency Plan. http://www.epa.gov/docs/epacfr40/chapt-I.info/subch-J/40P0300.pdf
U.S. EPA. 1999e. Hazard Ranking System Documentation Package: Iceland Coin LaundryArea Ground Water Plume, Vineland, Cumberland County, New Jersey. CERCLIS ID No.:NJDOOO1360882. http://www.epa.gov/oerrpage/superfund/sites/docrec/pdoc1561.pdf
U.S.EPA. 1999f. HRS Documentation Record: Jacobs Smelter, UT0002391472. U.S.Environmental Protection Agency, Region VIII.http://www.epa.gov/oerrpage/superfund/sites/docrec/pdoc1566.pdf
U.S. EPA. 1999g. Sampling Analysis Report, Jacobs Smelter, Stockton, Utah. TDD No. 9806-0015.
U.S. EPA. 1999h. USEPA Contract Laboratory Program National Functional Guidelines forOrganic Data Review. EPA/540/R-99/008, OSWER 9240.1-05A-P. Office of Emergency andRemedial Response, Washington, DC. http://www.epa.gov/superfund/programs/clp/guidance.htm

R-10
U.S. EPA. 2000a. EPA Manual for Quality Environmental Programs. Manual 5360 A1. Officeof Environmental Information Quality, Washington, DC. http://www.epa.gov/quality/qa_docs.html
U.S. EPA. 2000b. Field Operations and Records Management System II Lite (FORMS II Lite)Version 5.0 Software. Superfund Contract Laboratory Program, Washington, D.C.
U.S. EPA. 2000c. Guidance for the Data Quality Assessment: Practical Methods for DataAnalysis (EPA QA/G-9). EPA/600/R-96/084. Office of Research and Development, QualityAssurance Division, Washington, DC. http://www.epa.gov/quality/qa_docs.html
U.S. EPA. 2000d. Guidance for the Data Quality Objectives Process (EPA QA/G-4).EPA/600/R-96/055. Office of Research and Development, Quality Assurance Division,Washington, DC. http://www.epa.gov/quality/qa_docs.html
U.S. EPA. 2000e. Guidance for the Data Quality Objectives Process for Hazardous Waste Sites(EPA QA/G-4HW). EPA/600/R-00/007. Office of Research and Development, Quality AssuranceDivision, Washington, DC. http://www.epa.gov/quality/qa_docs.html
U.S. EPA. 2000f. Guidance for Data Quality Assessment: Practical Methods for Data Analysis(EPA QA/G-9—QA00 Update). EPA/600/R-96/084. Office of Research and Development,Quality Assurance Division, Washington, DC. http://www.epa.gov/quality/qa_docs.html
U.S. EPA. 2000g. Guidance on Technical Audits and Related Assessments for EnvironmentalData Operations, (EPA QA/G-7). EPA/600/R-99/080. Office of Environmental Information,Washington, DC. http://www.epa.gov/quality/qa_docs.html
U.S. EPA. 2000h. Innovations in Site Characterization, Case Study: Site Cleanup of theWenatchee Tree Fruit Test Plot Site Using a Dynamic Work Plan, EPA/542/R-00/009. Office ofSolid Waste and Emergency Response, Washington, DC. http://www.epa.gov/tio/download/char/treefruit/wtfrec.pdf
U.S. EPA. 2000i. Policy and Program Requirements for the Mandatory Agency-Wide QualitySystem. EPA Order 5360.1 A2. http://www.epa.gov/quality/qa_docs.html
U.S. EPA. 2000j. Quality Manual for Environmental Programs, EPA Order 5360.a1. Office ofEnvironmental Information, Washington, DC. http://www.epa.gov/quality1/qa_docs.html
U.S. EPA. 2000k. Superfund/RCRA Regional Procurement Operations Division ContractsGuidance Document No. 00-01.
U.S. EPA. 2001a. EPA Requirements for Quality Assurance Project Plans (EPA QA/R-5).EPA/240/B-1/003. Office of Environmental Information, Quality Assurance Staff, Washington,DC. http://www.epa.gov/quality/qa_docs.html
U.S. EPA. 2001b. EPA Requirements for Quality Management Plans. (EPA QA/R-2).

R-11
EPA/240/B-1/002. Office of Environmental Information, Quality Assurance Staff, Washington,DC. http://www.epa.gov/quality/qa_docs.html
U.S. EPA. 2001c. Guidance for the Preparation of Standard Operating Procedures (SOPs) forQuality-Related Documents (EPA QA/G-6). EPA/240/B-01/004. Office of EnvironmentalInformation, Quality Assurance Staff, Washington, DC. http://www.epa.gov/quality/qa_docs.html
U.S. EPA. 2001d. Superfund Community Involvement Handbook. OSWER Directive 9230.0-94.http://www.epa.gov/oerrpage/superfund/tools/cag/ci_handbook.pdf
U.S. EPA. 2001e. Supplemental Guidance for Developing Soil Screening Levels for SuperfundSites: Peer Review Draft. OSWER 9355.4-24.http://www.epa.gov/superfund/resources/soil/ssgmarch01.pdf
U.S. EPA. 2002a. Standard Operating Procedure for PCB Field Testing for Soil and SedimentSamples. Unpublished document developed by EPA Region 1.http://www.epa.gov/superfund/programs/dfa/download/pcb_sop.pdf
U.S. EPA. 2002b. Handbook of Groundwater Protection and Cleanup Policies for RCRACorrective Action: For Facilities Subject to Corrective Action Under Subtitle C of the ResourcesConservation and Recovery Act. EPA/530/R-01/015. Office of Solid Waste and EmergencyResponse. Washington, D.C. http://www.epa.gov/correctiveaction/resource/guidance/gw/gwhandbk/gwhndbk.htm
U.S. EPA. 2002c. Dynamic Field Activity Case Study: Soil and Groundwater Characterization,Marine Corps Air Station Tustin. EPA/540/R-02/005. OSWER No. 9200.1-43. Office of SolidWaste and Emergency Response, Washington, D.C. http://www.epa.gov/superfund/programs/dfa/casestudies
U.S. EPA. 2002d. Dynamic Field Activity Case Study: Treatment System Optimization,Umatilla Chemical Depot. EPA/540/R-02/007. OSWER No. 9200.1-45. Office of Solid Wasteand Emergency Response, Washington, D.C. http://www.epa.gov/superfund/programs/dfa/casestudies
U.S. EPA. 2002e. Guidelines for Ensuring and Maximizing the Quality, Objectivity, Utility, andIntegrity of Information Disseminated by the Environmental Protection Agency, EPA/260/R-02/008. Office of Environmental Information, Washington, DC. http://www.epa.gov/oei/qualityguidelines/index.html.
U.S. EPA. 2003. Dynamic Field Activity Case Study: Soil and Sediment Cleanup, Loring AirForce Base. EPA/540/R-02/006. OSWER No. 9200.1-44. Office of Solid Waste andEmergency Response, Washington, D.C. http://www.epa.gov/superfund/programs/dfa/casestudies
U.S. Naval Facilities Engineering, Southwest Division. 1995a. Draft Final Remedial Investiga-

R-12
tion Work Plan for OU-1 and OU-2, Marine Corps Air Station, Tustin, California.
U.S. Naval Facilities Engineering, Southwest Division. 1995b. Draft Final Sampling andAnalysis Plan Marine Corps Air Station, Tustin, California. .
U.S. Naval Facilities Engineering, Southwest Division. 1995c. Marine Corps Air Station TustinData Quality Objectives IRP-12 (Drum Storage Area No. 2). Draft Final Remedial InvestigationWork Plan for OU-1 and OU-2, Marine Corps Air Station, Tustin, California.
U.S. Naval Facilities Engineering, Southwest Division. 1997. Draft Final Remedial Investiga-tion Report for Operable Units 1 and 2, Marine Corps Air Facility, Tustin, California.
Zheng, C. 1990. MT3D: A Modular Three-Dimensional Transport Model for Simulation ofAdvection, Dispersion, and Chemical Reactions of Contaminants in Groundwater Systems. S.S.Papadopulos & Associates, Inc. Software and user guide prepared for U.S. EPA.http://www.epa.gov/ada/csmos/models.html

Appendix A Daily and Weekly Activity Summary
Reports


Appendix A Daily and Weekly Activity Summary Reports
Summary reports are a convenient way for technical team leaders to communicate the highlights of site activities to all interested parties and to provide a succinct historical record. The following daily and weekly summary reports are provided as examples of the type of information that should be included in these documents. They may be modified to meet the data needs of specific projects or simply copied and used as is. These reports are not intended to record a detailed listing of all data collected or to replace data evaluations that result in a detailed picture of the nature and extent of contamination. The following discussion provides an explanation of the requested information.
Equipment On Site
This section should include any major equipment, such as a mobile laboratory, drilling rig, DP rig, or well development rig, that has been used on site during the assigned time period. Designate the type of rig, such as CME-51 hollow stem auger. In addition, this section should discuss any new equipment that is expected to be needed during the following period.
Summary of Surface/Subsurface Activities and On-Site Chemical Analysis
This section should not be overly specific but should be sufficiently detailed such that a person familiar with the field activities will know what is being accomplished. The chemical analysis discussion should also be general with significant findings highlighted. Any QA/QC problems and subsequent corrective action should be noted. Examples of the type of text to include in this section are:
• 1,500 cubic yards of soil were removed from area B for offsite disposal at the designated PCB landfill. Immunoassay results indicate there is a remaining hotspot in the southeast corner of this area. I have scheduled the chemist to come in early tomorrow so we can take two deeper soil samples by hand auger to determine the depth to which the soil should be removed in this area. There were no noted QA/QC or equipment problems.
• Seven DP locations were pushed to 20 feet in area C. The onsite GC indicated five were not in contaminated areas but two were. Soil contamination is associated with the presence of groundwater, which also contains TCE (15 and 100 :g/l) at the two contaminated locations. In accordance
A-1

with the FSP, DP activities tomorrow will try to bound the plume width and then look for the source. No QA/QC or equipment problems were encountered.
• Twenty surficial samples (less than 1-inch deep) were taken in area D according to the gridding scheme and analyzed onsite. XRF readings for lead ranged from 40 mg/kg to 530 mg/kg. Three of these are above the action level. However, a QC sample taken one foot away from the designated grid location was 200 mg/kg higher than the regular sample. This denotes an unexpected heterogeneity in the sampling grid. The site will be resampled tomorrow using the alternate compositing scheme provided in the FSP. The regular sample and the duplicate will be included in the confirmation samples being sent offsite. In the past week the creosote release at the drip pad was delineated by CPT/LIF. Forty pushes on 10-foot centers revealed a pool of creosote resting on a clay unit at 12 feet bgs. The creosote did not penetrate into the clay at sufficiently high concentrations to be detected by the LIF. The soil above the clay unit in the release area is contaminated throughout its depth. The pooling extends 15 feet to the east beyond the contaminated overburden foot print. The attached cross sections give the approximate concentration distributions. No QA/QC or equipment problems were encountered. We anticipate moving the investigation to the impoundment area the first of next week.
Location of Samples Collected for Off-Site Analysis and Requested Analyses
If the sample identification system includes sample location information, such as GPS coordinates, then a copy of the chain-of-custody can simply be attached because it indicates the requested analyses. On the other hand, if the identification system does not include location information, as is often the case with radionuclide samples, then this information should be added.
Other Activities and Problems Encountered
This section provides an opportunity to document activities that occur only occasionally, such as an EPA laboratory audit or a visit by the project manager. It should also include problems encountered that are not described as part of the sampling and analysis activities above.
A-2
C

Attachments
Depending on the site conditions, purpose of the field work, and the needs of interested parties, copies of various types of information can be attached to weekly and in some cases, daily summary reports. If the data for the field work are available on a website, however, attachments may not be necessary.
A-3

Sheet 1 of 2
Daily Activity Summary Report
Date:
Project Name: Weather Bright Sun
Clear Overcast Rain Snow
Temp (F) Under 32 32-50 51-70 71-85 Over 85
Wind Still Mod. High Report No.
Project Number: Humidity Dry Mod. High
Equipment on site (include any expected changes): ____________________________________
_________________________________________________________________________________
_________________________________________________________________________________
_________________________________________________________________________________
Summary of surface/subsurface activities and results of on-site chemical analysis: _________
_________________________________________________________________________________
_________________________________________________________________________________
_________________________________________________________________________________
_________________________________________________________________________________
_________________________________________________________________________________
_________________________________________________________________________________
_________________________________________________________________________________
_________________________________________________________________________________
_________________________________________________________________________________
_________________________________________________________________________________
_________________________________________________________________________________
_________________________________________________________________________________
_________________________________________________________________________________
_________________________________________________________________________________

Daily Activity Summary Report Con’t
Project Name:
Project No./Task No.: Date:
Location of samples collected for off-site analysis and requested analyses: ________________
_________________________________________________________________________________
_________________________________________________________________________________
_________________________________________________________________________________
_________________________________________________________________________________
_________________________________________________________________________________
_________________________________________________________________________________
_________________________________________________________________________________
_________________________________________________________________________________
Other activities/problems encountered: ______________________________________________
_________________________________________________________________________________
_________________________________________________________________________________
_________________________________________________________________________________
_________________________________________________________________________________
_________________________________________________________________________________
_________________________________________________________________________________
_________________________________________________________________________________
_________________________________________________________________________________
_________________________________________________________________________________
_________________________________________________________________________________
Sheet 2 of 2

Weekly Activity Summary Report
Project Name:
Project Number: Date: Week of:
Equipment used on site (include any expected changes): ______________________________________
____________________________________________________________________________________________
____________________________________________________________________________________________
____________________________________________________________________________________________
____________________________________________________________________________________________
Summary of surface/subsurface activities and on-site chemical analysis results: ________________
____________________________________________________________________________________________
____________________________________________________________________________________________
____________________________________________________________________________________________
____________________________________________________________________________________________
____________________________________________________________________________________________
____________________________________________________________________________________________
____________________________________________________________________________________________
____________________________________________________________________________________________
____________________________________________________________________________________________
____________________________________________________________________________________________
____________________________________________________________________________________________
____________________________________________________________________________________________
____________________________________________________________________________________________
____________________________________________________________________________________________
____________________________________________________________________________________________
____________________________________________________________________________________________
____________________________________________________________________________________________
____________________________________________________________________________________________
Sheet 1 of 3

Weekly Activity Summary Report Con’t
Location of samples collected for off-site analysis and requested analyses: ____________________
____________________________________________________________________________________________
____________________________________________________________________________________________
____________________________________________________________________________________________
____________________________________________________________________________________________
____________________________________________________________________________________________
____________________________________________________________________________________________
____________________________________________________________________________________________
____________________________________________________________________________________________
____________________________________________________________________________________________
____________________________________________________________________________________________
____________________________________________________________________________________________
Other activities/problems encountered: _________________________________________________
____________________________________________________________________________________
____________________________________________________________________________________
____________________________________________________________________________________
____________________________________________________________________________________
____________________________________________________________________________________
____________________________________________________________________________________
____________________________________________________________________________________
____________________________________________________________________________________
____________________________________________________________________________________
____________________________________________________________________________________
____________________________________________________________________________________
____________________________________________________________________________________
Sheet 2 of 3

Weekly Activity Summary Report Con’t
Field activities planned for following week: ______________________________________________
____________________________________________________________________________________
____________________________________________________________________________________
____________________________________________________________________________________
____________________________________________________________________________________
____________________________________________________________________________________
____________________________________________________________________________________
____________________________________________________________________________________
____________________________________________________________________________________
____________________________________________________________________________________
Attachments (check box and describe):
~ Drilling Logs: __________________________________________________________________
~ Well Construction Logs: _________________________________________________________
~ Well Development Data Sheets: ___________________________________________________
~ Field Change Notice: ____________________________________________________________
~ Aquifer Test Data: ______________________________________________________________
~ Geotechnical Soil Data Sheets: ___________________________________________________
~ Fence Diagram: ________________________________________________________________
~ In-Plan Diagram (sample locations, groundwater contours, contaminant plume): _________
____________________________________________________________________________________
~ Laboratory Data: _______________________________________________________________
~ In Situ Water Quality Data: _______________________________________________________
~ Interpreted CPT Logs: ___________________________________________________________
~ Chains of Custody: _____________________________________________________________
Sheet 3 of 3

Appendix B Qualification Work Sheets


Appendix B Qualification Worksheets
This appendix contains three worksheets that are designed to aid EPA project managers in evaluating the experience and qualifications of the personnel and firms proposed by the project leads (e.g., Army Corps of Engineers, contractor, EPA). It does not specify minimum requirements; rather it provides a summary of key information that the Agency project manager can use to quickly review qualifications and identify information gaps and areas, such as level of experience, that need clarification. As such, the worksheets can be used to supplement resumes provided by project leads.
Worksheet I
Worksheet I asks for names and experience levels of the planning team members. This worksheet should only include the names of the principals who will be responsible for the planning and execution of field work, decision making, data evaluation and management (including QA/QC activities), and report writing. This list should not include personnel who will be involved only in the field (e.g., a junior level geologist who assists in data collection but is not part of the decision-making team).
The third and fourth columns of this worksheet ask for the planning team members’ years of experience in environmental work and in their area of expertise. For example, if an individual is a geologist with 10 years experience but 8 of those years were as an exploratory geologist with a mining company and only 2 years were related to environmental investigations, then 2 years would be entered in the third column and 10 would be entered in the fourth column. The key issue covered by this worksheet is to reveal the amount of relevant experience for key personnel.
Worksheet II
The purpose of Worksheet II is to clarify the level of experience of individuals conducting the field work. The worksheet asks for two essential pieces of information: the years of experience in performing the specific field task the individual will be assigned; and the years of experience an individual has in general in their area of expertise. For example, if the work plan calls for having a hollow stem auger on site, then this would be listed and the name and qualifications of the individual assigned to work with the driller would be listed (e.g., geologist, 2 years logging borings and installing wells with hollow stem augers, 5 years overall).
B-1

Individuals that perform multiple tasks at a site will have multiple entries on the worksheet. For example, if a geologist is logging soil but will also collect soil and groundwater samples, his or her years of experience with all three activities should be provided.
Worksheet III
Worksheet III is designed to provide information about the capabilities of technical specialty firms and their personnel. The second column dealing with the firm’s experience in the designated work area is easily obtained from its qualifications statement. The third column addresses the qualifications of the individual assigned to operate the equipment. As with the questions for prime contractors, the years of experience of the individual doing the actual work should be provided.
B-2

Ho
w m
uch
tim
e w
ill t
his
in
div
idu
al s
pen
d in
th
e fi
eld
?
No
ne
Par
t-ti
me
Fu
ll-ti
me
Yea
rs E
xper
ien
ce
in P
rin
cip
al A
rea
of
Exp
erti
se
Yea
rs E
xper
ien
ce1
in A
pp
rop
riat
e2
En
viro
nm
enta
l W
ork
Pla
nn
ing
Tea
m M
emb
er N
ame
Job
Tit
le
1 Yea
rs o
f ex
peri
ence
exc
lusi
ve o
f ed
ucat
ion;
for
dat
a m
anag
emen
t/IT
pos
itio
ns, y
ears
of
expe
rien
ce a
ppli
es to
the
prop
osed
dat
a m
anag
emen
t
soft
war
e an
d eq
uipm
ent i
nter
face
s.
2 I
f ac
tion
is a
soi
l rem
oval
, “ap
prop
riat
e” m
eans
soi
l rem
oval
. If
act
ion
is c
hara
cter
izat
ion,
then
“ap
prop
riat
e” m
eans
cha
ract
eriz
atio
n.
Wo
rksh
eet
I
Pla
nn
ing
Tea
m M
emb
er Q
ual
ific
atio
ns
B-3

Yea
rs E
xper
ien
ce
in P
rin
cip
al A
rea
of
Exp
erti
se
Yea
rs E
xper
ien
ce in
A
pp
rop
riat
e1 Fie
ld
Wo
rk
Pro
po
sed
Ind
ivid
ual
Job
Tit
leN
ame
Pro
po
sed
Fie
ld
Eq
uip
men
tF
ield
Act
ivit
y
Dril
ling/
DP
(1)
Soi
l log
ging
Soi
l sam
plin
g
DP
Gro
undw
ater
sam
plin
g
Mon
itorin
g w
ell i
nsta
llatio
n
Dril
ling/
DP
(2)
Soi
l log
ging
Soi
l sam
plin
g
DP
Gro
undw
ater
sam
plin
g
Mon
itorin
g w
ell i
nsta
llatio
n
Dril
ling/
DP
(3)
Soi
l log
ging
Soi
l sam
plin
g
DP
Gro
undw
ater
sam
plin
g
Mon
itorin
g w
ell i
nsta
llatio
n
1 If
the
acti
vity
is s
oil s
ampl
ing,
“ap
prop
riat
e” m
eans
soi
l sam
plin
g al
one.
If
the
acti
vity
is o
pera
ting
a f
ield
GC
, “ap
prop
riat
e” m
eans
ope
rati
ng a
fi
eld
GC
not
oth
er f
ield
equ
ipm
ent.
Wo
rksh
eet
II
Fie
ld T
eam
Qu
alif
icat
ion
s
B-4

Yea
rs E
xper
ien
ce
in P
rin
cip
al A
rea
of
Exp
erti
se
Yea
rs E
xper
ien
ce in
A
pp
rop
riat
e1 Fie
ld
Wo
rk
Pro
po
sed
Ind
ivid
ual
Job
Tit
leN
ame
Pro
po
sed
Fie
ld
Eq
uip
men
tF
ield
Act
ivit
y
DP
ana
lytic
al
mea
sure
men
ts
Fie
ld a
naly
tical
m
easu
rem
ents
Geo
phys
ical
sur
veys
Dat
a M
anag
emen
t/IT
Air
Sam
plin
g (s
peci
fy ty
pe)
Gro
undw
ater
sam
plin
g (m
onito
ring
syst
em)
If th
e ac
tivity
is o
pera
ting
a fi
eld
GC
, “ap
prop
riat
e” m
eans
ope
rati
ng a
fie
ld G
C n
ot
Wo
rksh
eet
II
Fie
ld T
eam
Qu
alif
icat
ion
s (C
on
tin
ued
)
1 If
the
activ
ity is
soi
l sam
plin
g, “
appr
opri
ate”
mea
ns s
oil s
ampl
ing
alon
e.
othe
r fi
eld
equi
pmen
t.
B-5

Yea
rs
Exp
erie
nce
in
Pri
nci
pal
Are
a o
f E
xper
tise
Yea
rs E
xper
ien
ce
in A
pp
rop
riat
e1
Fie
ld W
ork
Pro
po
sed
Ind
ivid
ual
Job
Tit
leN
ame
Pro
po
sed
Fie
ld
Eq
uip
men
tF
ield
Act
ivit
y
Soi
l sam
plin
g (n
on-r
ig r
elat
ed)
Bio
ta s
ampl
ing
Sed
imen
t sam
plin
g
Sur
face
wat
er s
ampl
ing
Est
uarin
e sa
mpl
ing
Tid
al s
ampl
ing
Oth
er
If th
e ac
tivity
is o
pera
ting
a fi
eld
GC
, “ap
prop
riat
e” m
eans
ope
rati
ng a
fie
ld G
C n
ot
Wo
rksh
eet
II
Fie
ld T
eam
Qu
alif
icat
ion
s (C
on
tin
ued
)
1 If
the
activ
ity is
soi
l sam
plin
g, “
appr
opri
ate”
mea
ns s
oil s
ampl
ing
alon
e.
othe
r fi
eld
equi
pmen
t.
B-6

Worksheet III Technical Specialty Firm Qualifications
Technical Specialty Firm Field Activity1 Firm’s Experience in
Designated Work2
Principal Operator’s Experience3 with
Equipment
Driller (specify type)
Direct Push (specify type)
Direct Push Chemical Analyzer Probe (specify type)
Soil Gas Analysis (specify type)
Air Sampling (specify type)
Mobile Laboratory (list proposed instrumentation)
Portable Field Instrumentation (specify type)
Geophysics (specify instrument)
Other
1 This checklist provides an estimate of the experience being placed in the field by the specialty firm. For example, if the driller is providing three hollow-stem auger rigs, then three should be listed below “Driller.” 2 Provides experience of the firm in the given area or equipment type—for example, the years the firm has been performing soil gas surveys. 3 Operator experience with the instrument in question. For example, a field GC (specify brand) is proposed and the operator has been using this type of instrument for 4 years.
B-7


Appendix C Summary of Detection Limits for Selected
Field-Based Analytical Methods


Appendix C Summary of Detection Limits for Selected
Field-Based Analytical Methods
This appendix is designed to provide the reader with a list of estimated detection limits that can be attained with some commonly used field-based analytical methods. It is not intended to be comprehensive because the total number of field-based analytical methods is overwhelmingly large and it is not intended to provide definitive detection limits because their performance is extremely site specific. Rather, the tables provided below should be used as a starting point in the search for analytical methods that are appropriate for your site. As such, they should be used with numerous other sources of information, including the advice of an experienced chemist. Readers can find additional sources of information on the Internet as listed in Chapter IV, including the dynamic field activities web page at http://www.epa.gov/superfund/programs/dfa and the Field Analytic Technologies Encyclopedia at http://fate.clu-in.org. In addition, the dynamic field activities web page provides detailed tables with estimates of samples per day, interferences, and performance tips/limitations for each of the methods listed in this appendix.
The information provided in these tables was assembled from SW-846; Appendix A of 40 CFR 136 (Guidelines Establishing Test Procedures for the Analysis of Pollutants); California Military Environmental Coordination Commit-tee (CMECC): Field Analytical Measurement Technologies, Applications, and Selection, Standard Methods for the Examination of Water and Wastewater; Environmental Technology Verification (ETV) reports; and manufacturer docu-mentation. Although manufacturer documentation should be examined critically, for the purposes of this appendix, the information was acceptable because the data are designed to be used as a starting point in the method selection process. When multiple manufacturers of specific technologies had very similar equipment (e.g., conventional ion-specific electrodes, colorimetric analysis with spectrophoto-meter), detection limits were evaluated for —reasonableness“ before a value was selected. For example, if one manufacturer had a detection limit well below the others, the lowest detection limit was not used in the table.
The field-based analytical methods included in this appendix have been limited to organic methods using three instruments:
C GC/MS; C GC; and C Immunoassay.
C-1

And inorganic methods using five instruments:
C Immunoassay for mercury; C XRF; C Colorimetric with spectrophotometer; C Conventional ion-specific electrode; and C In situ ion-specific electrode.
The number of field-based analytical methods that are potentially useful for contaminated activities are too numerous to evaluate completely in this document, and new instruments are continually being developed. In addition to the field-based analytical methods summarized here, project planners may also be interested in considering detector tubes, fiber optic chemical sensors, turbidi-metric test kits, infrared detectors, open path techniques (e.g. fourier transform infrared spectroscopy) and the numerous probes and sensors that can be attached to DPT rods (e.g., laser-induced fluorescence).
C-2

Inor
gani
c Fi
eld-
Bas
ed A
naly
tical
Met
hod
Det
ectio
n Li
mits
Col
orim
etric
Sp
ectr
opho
tom
eter
m
g/L
Con
vent
iona
l Io
n-Sp
ecifi
c El
ectr
ode
mg/
L
In S
itu Io
n-Sp
ecifi
c El
ectr
ode
mg/
L
X-ra
y Fl
uore
scen
ce1
mg/
L
X-ra
y Fl
uroe
scen
ce2
mg/
kg
Imm
unoa
ssay
3
mg/
kg
Med
ia
Wat
er
Wat
er
Wat
er
Wat
er
Soil
Soil
Alu
min
um
0.03
0.
5
Am
mon
ium
0.
02
0.09
Ant
imon
y 1.
3 40
Ars
enic
0.
04
40
Bar
ium
N
o de
tect
ion
limit
prov
ided
, <10
0.
Prec
isio
n of
± 1
.0
10
1.4
0.08
20
Bor
on
0.02
Bro
mid
e 0.
4 0.
4
Bro
min
e 0.
03
Cad
miu
m
0.00
1 0.
2 0.
1 0.
24
100
Cal
cium
0.
02
0.02
0.
03
70
Car
bona
te
0.00
8
Chl
orid
e 0.
3 1.
8 1
Chl
orin
e 0.
01
0.01
0
Chl
orin
e D
ioxi
de
0.03
Chr
omiu
m
0.03
15
0
C-3

Inor
gani
c Fi
eld-
Bas
ed A
naly
tical
Met
hod
Det
ectio
n Li
mits
(Con
tinue
d)
Col
orim
etric
Sp
ectr
opho
tom
eter
m
g/L
Con
vent
iona
l Io
n-Sp
ecifi
c El
ectr
ode
mg/
L
In S
itu Io
n-Sp
ecifi
c El
ectr
ode
mg/
L
X-ra
y Fl
uore
scen
ce1
mg/
L
X-ra
y Fl
uroe
scen
ce2
mg/
kg
Imm
unoa
ssay
3
mg/
kg
Med
ia
Wat
er
Wat
er
Wat
er
Wat
er
Soil
Soil
Chr
omiu
m, h
exav
alen
t 0.
01
Cob
alt
0.03
0.
03
60
Cop
per
0.02
0.
3 0.
008
0.03
50
Cya
nide
N
o de
tect
ion
limit
prov
ide,
<0.
2.
Prec
isio
n of
± 0
.004
3 0.
03
0.03
Fluo
ride
0.02
0.
01
0.20
Iodi
de
0.02
0.
005
Iron
0.
03
0.03
60
Lead
0.
003
1.0
0.20
0.
16
20
Man
gane
se
0.03
0.
03
70
Mer
cury
0.
2 30
0.
5
Mol
ybde
num
0.
03
0.04
10
Nic
kel
0.02
0.
03
50
C-4

Inor
gani
c Fi
eld-
Bas
ed A
naly
tical
Det
ectio
n Li
mits
(Con
tinue
d)
Col
orim
etric
Sp
ectr
opho
tom
eter
m
g/L
Con
vent
iona
l Io
n-Sp
ecifi
c El
ectr
ode
mg/
L
In S
itu Io
n-Sp
ecifi
c El
ectr
ode
mg/
L
X-ra
y Fl
uore
scen
ce1
mg/
L
X-ra
y Fl
uroe
scen
ce2
mg/
kg
Imm
unoa
ssay
3
mg/
kg
Med
ia
Wat
er
Wat
er
Wat
er
Wat
er
Soil
Soil
Nitr
ogen
(Nitr
ate)
N
o de
tect
ion
limit
prov
ided
, <0.
40.
Prec
isio
n of
0.08
0.
40
Nitr
ogen
(Nitr
ite)
0.00
1 0.
02
0.18
Perc
hlor
ate
0.7
0.20
Phos
phor
us, P
hosp
hate
0.
01
0.25
Pota
ssiu
m
0.04
0.
04
0.07
20
0
Rub
idiu
m
0.07
10
Sele
nium
0.
12
40
Silv
er
No
dete
ctio
n lim
it pr
ovid
ed, <
0.6.
Pr
ecis
ion
of ±
0.0
067
0.01
0.
01
0.6
70
Sodi
um
0.00
1 0.
001
0.18
Stro
ntiu
m
0.04
10
Sulfa
te
7
Sulfi
de
0.00
3
± 0.
01
C-5

Inor
gani
c Fi
eld-
Bas
ed A
naly
tical
Met
hod
Det
ectio
n Li
mits
(Con
tinue
d)
Col
orim
etric
Sp
ectr
opho
tom
eter
m
g/L
Con
vent
iona
l Io
n-Sp
ecifi
c El
ectr
ode
mg/
L
In S
itu Io
n-Sp
ecifi
c El
ectr
ode
mg/
L
X-ra
y Fl
uore
scen
ce1
mg/
L
X-ra
y Fl
uroe
scen
ce2
mg/
kg
Imm
unoa
ssay
3
mg/
kg
Med
ia
Wat
er
Wat
er
Wat
er
Wat
er
Soil
Soil
Thal
lium
0.
06
20
Thor
ium
10
Tin
0.3
60
Tita
nium
0.
04
50
Van
adiu
m
0.04
50
Zinc
0.
03
50
Zirc
oniu
m
0.04
10
1 X
RF
wat
er n
umbe
rs a
re fr
om K
evex
spec
trace
(wat
er q
ualit
y 20
0 m
g/L
TDS)
dry
ing
mus
t be
done
in a
cle
an a
rea.
TD
S do
es e
ffec
t sen
sitiv
ity o
f mea
sure
men
t. 2 EP
A M
etho
d 62
00 In
terf
eren
ce fr
ee d
etec
tion
limits
. 3 EP
A M
etho
d 45
00 M
ercu
ry b
y Im
mun
oass
ay.
C-6
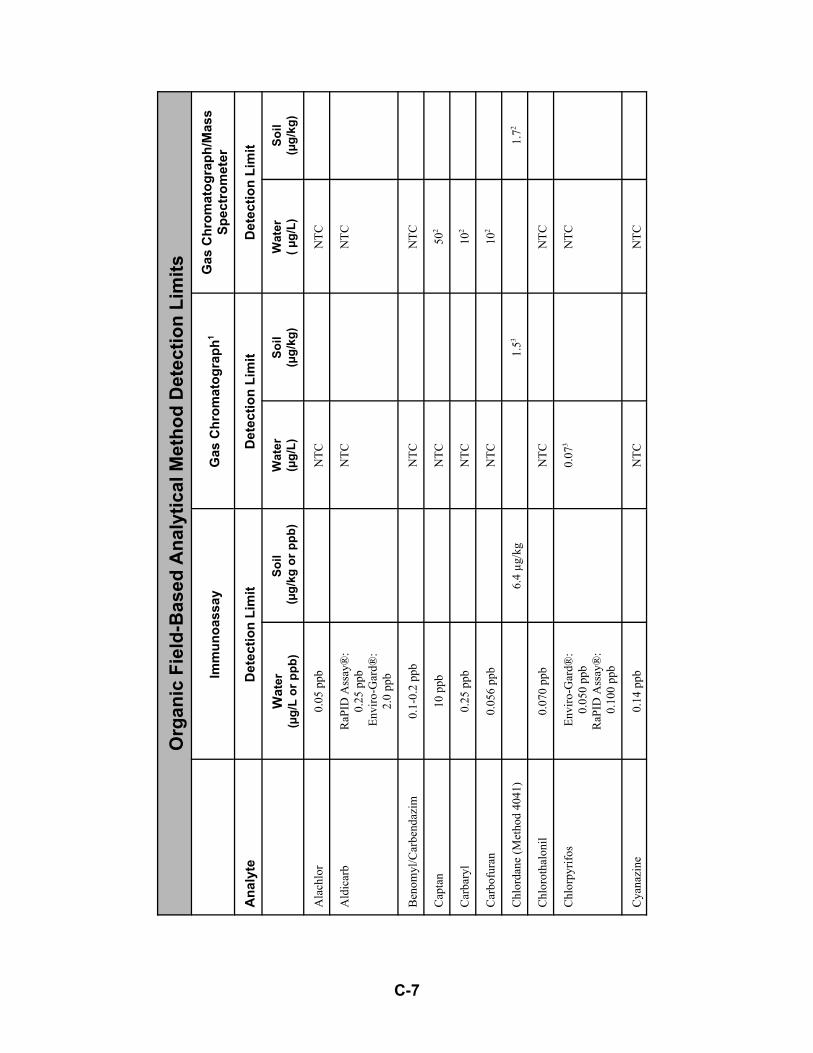
Org
anic
Fie
ld-B
ased
Ana
lytic
al M
etho
d D
etec
tion
Lim
its
Imm
unoa
ssay
G
as C
hrom
atog
raph
1 G
as C
hrom
atog
raph
/Mas
s Sp
ectr
omet
er
Ana
lyte
D
etec
tion
Lim
it D
etec
tion
Lim
it D
etec
tion
Lim
it
Wa t
er
(µg/
L or
ppb
) So
il (µ
g/kg
or p
pb)
Wat
er
(µg/
L)
Soil
(µg/
kg)
Wat
er
( µg/
L)
Soil
(µg/
kg)
Ala
chlo
r 0.
05 p
pb
NTC
N
TC
Ald
icar
b R
aPID
Ass
ay®
: 0.
25 p
pb
Envi
ro-G
ard®
: 2.
0 pp
b
NTC
N
TC
Ben
omyl
/Car
bend
azim
0.
1-0.
2 pp
b N
TC
NTC
Cap
tan
10 p
pb
NTC
50
2
Car
bary
l 0.
25 p
pb
NTC
10
2
Car
bofu
ran
0.05
6 pp
b N
TC
102
Chl
orda
ne (M
etho
d 40
41)
6.4
µg/k
g 1.
53 1.
72
Chl
orot
halo
nil
0.07
0 pp
b N
TC
NTC
Chl
orpy
rifos
Env
iro-G
ard®
: 0.
050
ppb
RaP
ID A
ssay
®:
0.10
0 pp
b
0.07
3 N
TC
Cya
nazi
ne
0.14
ppb
N
TC
NTC
C-7

Org
anic
Fie
ld-B
ased
Ana
lytic
al M
etho
d D
etec
tion
Lim
its (C
ontin
ued)
Imm
unoa
ssay
G
as C
hrom
atog
raph
1 G
as C
hrom
atog
raph
/Mas
s Sp
ectr
omet
er
Ana
lyte
D
etec
tion
Lim
it D
etec
tion
Lim
it D
etec
tion
Lim
it
Wa t
er
(µg/
L or
ppb
) So
il (µ
g/kg
or p
pb)
Wat
er
(µg/
L)
Soil
(µg/
kg)
Wat
er
( µg/
L)
Soil
(µg/
kg)
Cyc
lodi
enes
En
viro
-Gar
d®:0
.6 p
pb a
s En
dosu
lfan.
is
not
the
cycl
odie
ne o
f in
tere
st, c
heck
the
kit
dire
ctio
ns to
see
wha
t the
de
tect
ion
limit
for t
he ta
rget
co
mpo
und
of in
tere
st is
.
RaP
ID A
ssay
®: 0
.6 p
pb
NTC
N
TC
Dia
zino
n 0.
022
ppb
0.23
NTC
Dic
hlor
o-di
phen
yl-
trich
loro
etha
ne (D
DT)
44
ppb
(M
etho
d 40
42)
0.63
330
4
2, 4
-Dic
hlor
ophe
noxy
-ace
tic
Aci
d (2
,4-D
) 16
0 pp
b (M
etho
d 40
15)
0.11
3 N
TC
2, 4
-Dic
hlor
ophe
noxy
-ace
tic
Aci
d (2
,4-D
) 2
µg/L
0.
23 N
TC
Endo
sulfa
n 0.
08 p
pb
0.9-
1.33
NTC
Endo
thal
l 3.
0 pp
b N
TC
NTC
Flur
idon
e 0.
02 p
pb
NTC
N
TC
Hex
ahyd
ro-1
,3,5
-trin
itro-
1,3,
5-tri
azin
e (R
DX
) 4
µg/L
80
0 µg
/Kg5
(Met
hod
4051
) N
TC
NTC
N
TC
NTC
Endo
sulfa
nIf
C-8

Org
anic
Fie
ld-B
ased
Ana
lytic
al M
etho
d D
etec
tion
Lim
its (C
ontin
ued)
Im
mun
oass
ay
Gas
Chr
omat
ogra
ph1
Gas
Chr
omat
ogra
ph/M
ass
Spec
trom
eter
Ana
lyte
D
etec
tion
Lim
it D
etec
tion
Lim
it D
etec
tion
Lim
it
Wa t
er
(µg/
L or
ppb
) So
il (µ
g/K
g or
ppb
) W
ater
(µ
g/L)
So
il (µ
g/K
g)
Wat
er
( µg/
L)
Soil
(µg/
Kg)
Isop
rotu
ron
0.02
ppb
N
TC
NTC
Lind
ane
400
ppb
1.43
NTC
Met
olac
hlor
En
viro
-Gar
d®: 0
.07
ppb
RaP
ID A
ssay
®: 0
.05
ppb
NTC
N
TC
Para
quat
0.
02 p
pb
NTC
N
TC
Para
thio
n 0.
03 p
pb
0.06
3 10
2
Pent
achl
orop
heno
l µg
/kg
(kit
spec
ific)
0.
163
3300
2
Pent
achl
orop
heno
l 5
µg/L
(kit
spec
ific)
0.
0763
502
Petro
leum
Hyd
roca
rbon
s 50
00 p
pb
NTC
N
TC
Picl
oram
0.
87 p
pb
NTC
N
TC
Poly
arom
atic
Hyd
roca
rbon
s (P
AH
s)
200
to 1
000
ppb
depe
ndin
g up
on th
e ki
t.
No
publ
ishe
d da
ta.
6602
500
C-9

Org
anic
Fie
ld-B
ased
Ana
lytic
al M
etho
d D
etec
tion
Lim
its (C
ontin
ued)
Im
mun
oass
ay
Gas
Chr
omat
ogra
ph1
Gas
Chr
omat
ogra
ph/M
ass
Spec
trom
eter
Ana
lyte
D
etec
tion
Lim
it D
etec
tion
Lim
it D
etec
tion
Lim
it
Wa t
er
(µg/
L or
ppb
) So
il (µ
g/K
g or
ppb
) W
ater
(µ
g/L)
So
il (µ
g/K
g)
Wat
er
( µg/
L)
Soil
(µg/
Kg)
Poly
chlo
rinat
ed B
iphe
nyls
(P
CB
s)
5000
µg/
L bu
t has
diff
eren
t de
tect
ion
leve
ls fo
r eac
h A
rocl
or. C
heck
sp
ecifi
c nu
mbe
r.
250-
1000
ppb
de
pend
ing
on te
st
kit.
No
publ
ishe
d da
ta.
57-7
03 N
o pu
blis
hed
data
. 33
-674
Sem
ivol
atile
Org
anic
s 0.
04-2
3002
0.02
-702
10-2
002
6602
Silv
ex
Envi
ro-g
ard®
: 20
ppb
RaP
ID A
ssay
®:
14 p
pb
0.28
3 N
TC
Sim
azin
e 0.
03 p
pb
NTC
N
TC
Spin
osad
0.
02 µ
g/L
spin
osyn
A.
NTC
N
TC
Thia
bend
azol
e 0.
2 pp
b N
TC
NTC
Tota
l Ben
zene
, Tol
uene
, Et
hylb
enze
ne, a
nd X
ylen
es
(BTE
X)
100
ppb
0.00
9-0.
023
0.04
-0.0
82
Toxa
phen
e 50
0 µg
/kg
No
publ
ishe
d da
ta.
1704
test
kit
for
C-10

Org
anic
Fie
ld-B
ased
Ana
lytic
al M
etho
d D
etec
tion
Lim
its (C
ontin
ued)
Im
mun
oass
ay
Gas
Chr
omat
ogra
ph1
Gas
Chr
omat
ogra
ph/M
ass
Spec
trom
eter
Ana
lyte
D
etec
tion
Lim
it D
etec
tion
Lim
it D
etec
tion
Lim
it
Wa t
er
(µg/
L or
ppb
) So
il (µ
g/K
g or
ppb
) W
ater
(µ
g/L)
So
il (µ
g/K
g)
Wat
er
( µg/
L)
Soil
(µg/
Kg)
Tria
sulfu
ron
0.04
ppb
N
TC
NTC
Tria
zine
Her
bici
des
0.03
µg/
L N
TC
NTC
Tric
hlor
opyr
idin
ol
0.25
µg/
L N
TC
NTC
Trin
itrot
olue
ne (T
NT)
5
µg/L
50
0 to
700
ppb
de
pend
ing
upon
the
kit.
No
publ
ishe
d da
ta.
No
publ
ishe
d da
ta.
NTC
N
TC
Ure
a H
erbi
cide
s Se
e in
terf
eren
ts.
NTC
N
TC
Vol
atile
Org
anic
s 0.
04-3
0 µg
/L2
0.04
-30
µg/k
g2 5
µg/L
2 5
µg/k
g2
1 V
alue
s are
for m
ost e
ffec
tive
dete
ctor
.
2 SW
-846
est
imat
ed q
uant
itatio
n lim
it. D
etec
tion
limit
may
be
low
er.
3
SW-8
46 m
etho
d de
tect
ion
limit.
4 C
ontra
ct L
abor
ator
y Pr
ogra
m C
RQ
L.
5
EnSy
s Tes
t Kit.
NTC
: Non
-targ
et c
ompo
und.
The
det
ectio
n lim
its a
nd e
stim
ated
qua
ntita
tion
limits
for t
he G
C a
nd G
C/M
S m
etho
ds a
re ta
ken
from
pub
lishe
d EP
A m
etho
ds.
Th
ese
met
hods
pro
vide
info
rmat
ion
on p
rogr
am sp
ecifi
c ta
rget
com
poun
ds. N
on-ta
rget
com
poun
ds m
ay b
e an
alyz
ed b
y G
C o
r GC
/MS
but d
etec
tion
limits
, and
the
ab
ility
to a
naly
ze th
ese
com
poun
ds, s
houl
d be
ver
fied
by a
pro
ject
man
ager
prio
r to
begi
nnin
g fie
ld w
ork.
C-11


Glossary


Glossary€
accuracy: The degree of agreement between an observed value and an accepted reference value. Accuracy includes a combination of random error (precision) and systematic error (bias) components that are due to sampling and analytical opera-tions; a data quality indicator. Examples of QC measures for accuracy include PE samples, matrix spikes, laboratory control samples (LCSs), and equipment blanks.
action level: The numerical value that causes the decision maker to take a response action. It may be a regulatory threshold standard, such as a Maximum Contaminant Level for drinking water; a risk-based concentration level; an analytical technology limitation; or a reference-based standard. Note: the action level generally is specified during the planning phase of a data collection activity;. It is usually not calculated from the sampling data.
air sparging: A cleanup technique where air is forced into wells with screens set below the water table. As the air moves into the formation it promotes volatili-zation of dissolved contaminants and encourages biodegradation by enriching the groundwater as well as the overlying vadose zone with oxygen. This method is usually employed in conjunction with a vadose zone soil gas capture system.
Aroclor: A trade name for mixtures of polychlorinated biphenyls( PCBs) of various chlorine content sold for many years in the United States by Monsanto Company. Although Aroclors are no longer marketed, the PCBs remain in the environment and are sometimes found as residues in foods, especially fish.
Base Realignment and Closure Program (BRAC): The federal program that identifies and closes surplus military bases.
benzo(a)pyrene (BAP): A carcinogenic polyaromatic hydrocarbon consisting of five fused benzene rings having the general chemical formula C20H12.
bias: The systematic or persistent distortion of a measurement process, which causes errors in one direction (i.e., the expected sample measurement is different from the sample’s true value).
blank: A sample subjected to the usual analytical or measurement process to establish a zero baseline or background value. A sample that is intended to contain none of the analytes of interest. A blank is used to detect contamination during sample handling preparation and/or analysis.
BRAC Cleanup Team: The group responsible for remediation activities at a military base that is within the Base Realignment and Closure Program (BRAC).
G-1

The team usually consists of representatives from the Department of Defense, their contractors, as well as State and Federal regulators along with their experts.
calibration: Comparison of a measurement standard, instrument, or item with a standard or instrument of higher accuracy to detect and quantify inaccuracies and to report or eliminate those inaccuracies by adjustments.
calibration standard: A substance or reference material used to calibrate an instrument.
chain-of-custody: An unbroken trail of accountability that ensures the physical security of samples, data, and records.
chlordane: A chlorinated insecticide consisting of isomers of the general formula C10H6Cl8.
column: The tubing that provides support for the stationary phase (i.e., material that promotes separation of the target analytes present in the sample) in gas chromatography or high performance liquid chromatography.
community involvement plan: A plan described in 40 CFR 300.430(c) of the National Contingency Plan that lays out how the lead agency informs and involves the surrounding community in the remedial investigation/feasibility study, remedy selection, remedial design, and remedial action. This plan may also be referred to as the “community relations plan.”
Comprehensive Environmental Response, Compensation, and Liability Act (CERCLA): A federal law enacted in 1980 and nicknamed “Superfund” that provides Federal cleanup authority. It also created a trust fund, known as the Superfund, to assist with the cleanup of inactive and abandoned waste sites.
conceptual site model: A model of how chemicals were released at a site, their transport mechanisms, and exposure routes for both ecological and human receptors. It should be constructed during the systematic planning process and updated throughout the life of a project as new information becomes available.
confirmation data: Those data that are used to verify a decision (risk exists, cleanup is complete) or to show that a sampling and analysis program is performing as expected.
constituents of concern: The matrix-specific list of chemical compounds and analytes determined pertinent to a specific site or project. Sometimes used interchangeably with “contaminants of concern.”
contaminants of concern: See “constituents of concern.”
G-2

Contract Laboratory Program (CLP): A national network of EPA personnel, commercial laboratories, and support contractors whose fundamental mission is to provide data of known and documented quality in support of the EPA’s Superfund efforts by setting standards for analysis of samples by contracted laboratories.
Contract Laboratory Program method: A method of analysis specified for laboratories participating in the EPA Contract Laboratory Program.
Corrective Action: An EPA program to address the investigation and remedi-ation of contamination at or from hazardous waste treatment, storage, or disposal.
Corrective Action Plan: OSWER Directive 9902.3-2A, May 1994. Provides an overall program implementation framework; and model scopes of work for site characterizations, interim actions, evaluations of remedial alternatives, and remedy implementation.
Corrective Measures Implementation: Components of corrective action in which the owner and operator performs detailed design, construction, operation, maintenance, and monitoring of a chosen cleanup remedy.
Corrective Measures Study: An evaluation, if deemed necessary by the over-seeing regulatory program, in which the owner/operator identifies and evaluates remediation alternatives at a given contaminated site.
data management plan: One of the series of documents that make up the quality assurance project plan (QAPP). It details the procedures the project will follow in collecting, transcribing, storing, and displaying data.
data quality assessment (DQA): The scientific and statistical evaluation of data to determine if data obtained from environmental operations are of the right type, quality, and quantity to support their intended use. The five steps of the data quality assessment process include (1) reviewing the DQOs and sampling design, (2) conducting a preliminary data review, (3) selecting the statistical test, (4) verifying the assumptions of the statistical test, and (5) drawing conclusions from the data.
data quality indicators: The quantitative statistics and qualitative descriptors that are used to interpret the degree of acceptability or utility of data to the user. The principal data quality indicators are precision, accuracy, representativeness, comparability, completeness, and sensitivity. Also referred to as data quality attributes.
data quality objectives (DQOs): Qualitative and quantitative statements derived from the DQO process that clarify a study’s objectives, define the appropriate type of data, and specify tolerable levels of potential decision errors. DQOs will be
G-3

used as the basis for establishing the quality and quantity of data needed to support decisions.
data quality objective (DQO) process: A systematic strategic planning tool based on the scientific method that identifies and defines the type, quality, and quantity of data needed to satisfy a specified use. DQOs are the qualitative and quantitative outputs from the DQO process. For additional information about the DQO process, please refer to Guidance for the Data Quality Objectives Process (G-4) at http://www.epa.gov/quality/qa_docs.html.
data review: The process of examining and/or evaluating data to varying levels of detail and specificity by a variety of personnel who have different responsibili-ties within the data management process. It includes, but is not limited to, data verification, data validation, and data usability assessment.
data usability assessment: Evaluation of data based upon the results of data validation and verification for the decisions being made. In the usability step, one should assess whether the process execution and resulting data meets quality objectives based on criteria established in the QAPP.
data validation: The process of determining the reliability of reported results by a rigorous technical assessment that encompasses a review of the documentation related to sample collection, preparation, analysis, quality control, data reduction, and reporting.
data verification: The process of reviewing data to ensure that data are collected and analyzed by project-prescribed methods, transcribed accurately from an analytical logbook into an electronic database when necessary, and recorded consistently between laboratory hard and electronic copy.
decision memoranda: A paper issued by a technical team leader to the lead agency’s project manager at any critical decision point in a field activity. The paper asks for concurrence that a project goal for that decision point has been met and either work can be stopped or moved to other objectives.
definitive data: Analytical data of known quality, concentration, and level of uncertainty. The levels of quality and uncertainty of the analytical data are consistent with the requirements for the decision to be made. Suitable for final decision-making.
dense nonaqueous phase liquid (DNAPL): A hydrophobic liquid with a specific gravity greater than one.
detection limit: A measure of the capability of an analytical method to disting-uish samples that do not contain a specific analyte from samples that contain low
G-4

concentrations of the analyte; the lowest concentration or amount of the target analyte that can be determined to be different from zero by a single measurement at a stated level of probability. Detection limits are analyte- and matrix-specific and may be instrument- and laboratory-dependent.
dichloro-diphenyl-trichloroethane (DDT): A pesticide which was widely used in the United States before it was banned in 1972 due to its toxicity, environ-mental persistence, and tendency to bioaccumulate in the food-chain.
direct push (DP): A broad family of tools used for performing subsurface investigations by driving, pushing, and/or vibrating small-diameter hollow steel rods into the ground. Various probes, tips, or instruments can be attached to rods in order to collect soil, soil gas, or groundwater samples; install monitoring points; collect continuous logs on a variety of subsurface data; as well as perform numerous other tasks for the investigation and remediation of contaminated sites. Also known as “direct drive,” “drive point,” or “push” technology
duplicate analysis: The analysis of two samples that are expected to yield closely similar results by measuring the same variable (or set of variables) in each of them. It can be used to assess both laboratory and total measurement precision. Also refer to “laboratory duplicate” and “field duplicate” for additional information.
dynamic field activities: Contaminated site activities that combine on-site data generation with on-site decision making.
dynamic range: The concentration range that an instrument can accurately measure before a dilution is needed.
dynamic work plan: A work plan that is designed to allow decision making in the field based on analytical data that are generated as they are needed.
electron capture detector (ECD): An analytical measuring device that uses a stream of nitrogen to carry chemicals past a β-emitting material where they are ionized prior to passing between two electrodes which have a voltage differential of several hundred volts. As the ionized chemicals pass between the electrodes, the voltage differential drops, and the drop can be related to their concentration. An ECD is generally employed to detect halogenated chemicals, such as chlorinated pesticides.
ex situ thermal desorption: A cleanup technique in which contaminated materials (usually soils) are dug up and run through a unit that applies sufficient heat to cause the contaminants of concern to volatilize where upon they are either captured or destroyed.
G-5

Environmental Response Team (ERT): An EPA program with staff stationed in Edison, NJ, and Cincinnati, OH, that provides expertise in various problems associated with response actions. The group can offer call-in advice for local response actions and in the event of a major release can be mobilized to the scene.
feasibility study (FS): A study undertaken by the lead agency to develop and evaluate options for remedial action. The FS emphasizes data analysis and is generally performed concurrently and in an interactive fashion with the RI, using data gathered during the RI. The data are used to define the objectives of the response action, to develop remedial action alternatives, and to undertake an initial screening and detailed analysis of the alternatives. The term also refers to the report that describes the results of the study.
Field Analytical Support Program (FASP): A program operated by some of the EPA Regional offices through a contract in which mobile laboratories can be detailed to sites for on-site analyses.
field blank: A blank used to provide information about contaminants that may be introduced during sample collection, storage, and transport. A clean sample exposed to sampling conditions, transported to the laboratory, and treated as an environmental sample.
field boring log: A record of the lithology of a borehole.
field duplicate, co-located: Two or more separate portions collected from side-by-side locations at the same point in time and space so as to be considered identical. These separate samples are said to represent the same population and are carried through all steps of the sampling and analytical procedures in an identical manner. These samples are used to assess precision of the total method, including sampling, analysis, and site heterogeneity. This definition does not include a subsample field duplicate, which is one sample that is homogenized and then split into two or more portions.
field duplicate, subsample: Similar to a split sample except the same laboratory analyzes both samples. The sample is homogenized before being divided into two or more portions. These samples do not assess site heterogeneity, only specific sample point heterogeneity.
Field Operations and Records Management System II Lite (FORMS II Lite): EPA software that automates many of the manual procedures associated with documenting sample collection activities, including the completion of sample tags, sample labels, and chain-of-custody records.
field sampling plan: A component of a sampling and analysis plan that details how and where samples will be collected and handled. The plan generally
G-6

includes standard operating procedures for each sampling method and decontamination procedures.
field team: The environmental professionals responsible for implementing day-to-day field activities and decisions at the site.
field-based analytical methods (FAMs): A broad category of analytical methods that can be applied at the site of sample collection activities. They include methods that can be used outdoors, as well as methods that require the controlled environments of a mobile laboratory.
flame ionization detector (FID): An organic compound detector that uses a hydrogen flame to ionize organic vapors and then measures the electrical current generated by the free ions which is related to the concentration of the compounds present in the sample. It can be used as a stand alone detector to provide a rough indication of the concentration of all the compounds present in a sample or in conjunction with gas chromatography in order to provide the concentration of individual compounds in a sample.
Freon 113™: A trademark name for 1,1,2-trichloro-1,2,2-trifluoroethane which has commonly been used as a refrigerant and a degreaser.
full data validation: A rigorous technical evaluation of all aspects of either field or fixed laboratory analysis, involving the examination of raw data as well as quality control summary data.
gas chromatograph (GC): An instrument used to separate analytes on a stationary phase within a chromatographic column.
gas chromatography/mass spectrometry (GC/MS): An analytical technique that uses a gas chromatograph to separate constituents of concern and a mass spectrometer to identify and quantitate them.
global positioning system (GPS): A system that uses satellites to locate a position on the earth in terms of latitude and longitude coordinates by means of triangulation.
granular activated carbon (GAC): A material produced by heating carbonace-ous materials, such as wood or coconut shells, in the absence of air. The result is an extremely porous structure that can be used to filter (by absorption and adsorption) contaminants from water or air.
hazardous waste: Any waste material that satisfies the definition of hazardous waste given in 40 CFR 261, “Identification and Listing of Hazardous Waste.”
G-7

Hazard Ranking System (HRS): A numerically based screening system that uses information from initial investigations to assess the relative potential of sites to pose a threat to human health or the environment. As a matter of Agency policy, those sites that score 28.50 or greater with the HRS are eligible for inclusion on the NPL.
health and safety plan: A site-specific document that identifies the potential hazards that may be encountered at the site and specifically describes what shall be done to mitigate or eliminate them during field activities.
hollow stem auger: A large diameter pipe with flights welded to the outside that convey soil to the surface as the pipe is advanced by a drill rig. The lead auger is usually equipped with a cutter head and pilot bit. In situ soil samples can be taken by removing the cutter head and replacing it with a sampling tube (e.g., split spoon, Shelby).
immunoassay: An analytical method for detecting a substance by using anti-bodies (i.e., proteins developed by living organisms to identify foreign objects as part of their immune systems) to identify and measure target constituents (i.e., antigens) through the use of an antibody-antigen reaction. In order to facilitate interpretation of the analysis, immunoassay test kits utilize special reagents, called enzyme conjugates, to allow for color development that can then be associated with the target analyte concentration.
inductively coupled plasma (ICP) analysis: A technique for the simultaneous or sequential multi-element determination of elements in solution. The basis of the method is the measurement of atomic emission by an optical spectroscopic technique. Characteristic atomic line emission spectra are produced by excitation of the sample in a radio frequency inductively induced plasma.
interim measure: Under RCRA subtitle C corrective action, a short-term action to control ongoing risks while site characterization is underway or before a final remedy is selected.
infrared (IR) spectroscopy: An analytical technique that uses wavelength absorption in the infrared range for assessing the characteristics of a compound. A sample’s molecular structures are revealed through their characteristic frequency-dependent absorption bands.
inorganic chemical: A compound that is not a hydrocarbon or derived from a hydrocarbon through other than direct thermal oxidation processes.
Installation Restoration Program (IRP): A Department of Defense program that addresses environmental contamination at active and closing military facilities.
G-8

investigation derived waste (IDW): Wastes that are produced during a site assessment or investigation that are handled as hazardous materials until subse-quent evaluation identifies them as hazardous or nonhazardous. Examples would be soil cuttings from drilling activities in contaminated soil areas and contami-nated groundwater from well development and purging activities.
ion-specific electrode: A cyclindrical tube usually made of glass or plastic with an ion selective membrane at one end that comes into contact with the solution to be measured and a wire on the opposite side of the membrane that leads to a millivolt measuring device. The difference in potentials between a reference of known concentration and the ion-specific electrode allows for a calculation of the ion concentration. A variation of this design uses a solid state sensor that is specific to the target analyte and does not require the use of a reference electrode.
lead organization: An entity responsible for all phases of the data collection operation.
mass spectrometry (MS): An analytical technique that ionizes and fragments the target analytes present in a sample. An electric or magnetic field is then applied, and the trajectories of the particles are measured to determine their mass to charge ratios, which are subsequently used to identify and quantitate the target analytes in the sample.
matrix spike: A sample prepared by adding a known concentration of a target analyte to an aliquot of a specific homogenized environmental sample for which an independent estimate of the target analyte concentration is available. The matrix spike is accompanied by an independent analysis of the unspiked aliquot of the environmental sample. Spiked samples are used to determine the effect of the matrix on a method’s recovery efficiency.
matrix spike duplicate: A homogeneous sample used to determine the precision of the intralaboratory analytical process for specific analytes (organics only) in a sample matrix. Sample is prepared simultaneously as a split with the matrix spike sample, as each is spiked with identical, know concentrations of targeted analyte(s).
measurement error: Uncertainty associated with data caused by random and systematic errors being introduced into the measurement process by such activities as sample handling, sample preparation, sample analysis, and data reduction.
method: A body of procedures and techniques for performing an activity (e.g., sampling, modeling, chemical analysis, quantification) systematically presented in the order in which they are to be executed.
G-9

method applicability study: A study undertaken before a formal field activity begins to determine if the method will meet project measurement quality objectives. It is a field test of the method before mobilization.
method detection limit: The minimum concentration of a substance that can be reported with 99% confidence that the analyte concentration is greater than zero.
method reporting limit (MRL) : The concentration (usually the quantitation limit) below which any detected analytes will be reported as estimated quantities and to which non-detects will be reported.
method selectivity: The ability of an analytical method to detect or quantify a particular analyte when other chemically similar analytes are present.
method sensitivity: The ability of an analytical method to detect a change in response to a particular analyte at a particular concentration.
mobilization: The activities leading up to and including the implementation of field work at a site.
National Priorities List (NPL): An information and management tool of the Superfund program. A specific site may be listed on the NPL after the Hazard Ranking System (HRS) screening process has been completed and public comments about the proposed site have been solicited and addressed.
Office of Solid Waste and Emergency Response (OSWER): An EPA office that provides policy, guidance, and direction for the land disposal of hazardous waste, underground storage tanks, solid waste management, encouragement of innovative technologies, source reduction of wastes, and implementation of CERCLA.
on-scene coordinator (OSC): The federal official (EPA or the U.S. Coast Guard) who coordinates and directs federal responses under subpart D of the NCP (for oil) or removal actions under subpart E of the NCP (hazardous substances).
operable unit (OU): A distinct portion of the overall site cleanup. Sites can be divided into operable units based on the media to be addressed (e.g., groundwater or soil), geographic area, or other measures.
operation and maintenance (O&M): The measures initiated after the remedy has achieved the remedial action objectives and remediation goals in the Record of Decision, and is determined to be operational and functional, except for groundwater or surface-water restoration actions which enter O&M after the long-term response action (LARA) period is completed. O&M measures are designed
G-10

to ensure that the remedy remains protective to human health and the environment.
organic chemical: A compound that is a hydrocarbon or is derived from a hydrocarbon other than through thermal oxidation.
organic vapor analyzer (OVA): A device that provides an averaged concen-tration of organic molecules in an air stream in units of parts per million. The most common devices contain flame ionization detectors and are calibrated using a mixture of gases of different atomic weights.
performance evaluation (PE) sample: A sample, the composition of which is unknown to the laboratory or analyst, which is provided to that analyst or labora-tory to assess capability to produce results within acceptable criteria. PE samples can fall into three categories: (1) prequalification, conducted prior to a laboratory beginning project work, to establish initial proficiency; (2) periodic (e.g., quar-terly, monthly, or episodic) to establish ongoing laboratory proficiency; and (3) batch-specific, which is conducted simultaneously with analysis of a sample batch. Also called a proficiency testing sample.
photoionization detector (PID): A detector that uses an ultraviolet lamp to ionize compounds in a carrier gas (usually ultrapure air or nitrogen) that are then collected at positively charged electrodes where the change in current is measured. It can be used as a stand alone detector to provide a rough indication of the concentration of all the compounds present in a sample or in conjunction with gas chromatography in order to provide the concentration of individual compounds in a sample.
planning team: The group of technical experts that develops the planning documents for a Dynamic Field Activity. It is generally comprised of individuals who fill the roles of technical team leader, project hydrogeologist, project chemist, quality assurance specialist, statistician, risk assessor, community relations expert, health and safety expert, data management expert, information technology expert, and depending upon the need, a geophysicist.
polyaromatic hydrocarbon (PAH): Aromatic hydrocarbons containing more than one benzene ring. (Also called “polycyclic aromatic hydrocarbon.”)
polychlorinated biphenyls (PCBs): A chemical family of over 200 congeners derived from the progressive substitution of chlorine for hydrogen in the biphenyl ring system.
potentially responsible party (PRP): An individual, business, or other entity that is potentially liable for cleaning up a site. The four types of responsible parties include a site’s present owner(s) and operator(s), its previous owner(s) and
G-11

operator(s) during the time when hazardous substances were released, as well as those who arrange and transport for disposal.
precision: The degree to which a set of observations or measurements of the same property, obtained under similar conditions, conform to themselves. Precision is usually expressed as standard deviation, variance or range, in either absolute or relative terms. Examples of QC measures for precision include field duplicates, laboratory duplicates, analytical replicates, and internal standards.
preliminary remediation goal (PRG): Chemical concentration set by regulatory agencies that defines a minimum, preliminary human health risk goal. Concentra-tions of contaminants found above their respective PRGs at a site necessitate a full characterization and a risk assessment.
pump and treat: A remediation technique in which contaminated groundwater is pumped to a surface treatment unit. The treated water is either re-injected or discharged to a local surface water or publically owned wastewater treatment plant.
pumping test: A test that measures the transmissivity of an aquifer by pumping water from one well and measuring drawdown in other wells placed at specified distances and depths from the pumping well.
quality assurance (QA): An integrated system of management activities involv-ing planning, implementation, assessment, reporting, and quality improvement to ensure that a process, item, or service is of the type and quality needed and expected by the client.
quality assurance audit: A documented activity performed to verify, by examination and evaluation of objective evidence, that applicable elements of the quality system are suitable and have been developed, documented, and effectively implemented in accordance with specified requirements.
quality assurance project plan (QAPP): A formal document describing in comprehensive detail the necessary quality assurance, quality control, and other technical activities that must be implemented to ensure that the results of the work performed will satisfy the stated performance criteria.
quality control (QC): The overall system of technical activities that measures the attributes and performance of a process, item, or service against defined standards to verify that they meet the stated requirements established by the customer; operational techniques and activities that are used to fulfill require-ments for quality. The system of activities and checks used to ensure that measurement systems are maintained within prescribed limits, providing protection against “out of control” conditions and ensuring the results are of acceptable quality.
G-12

quality control sample: One of any number of samples, such as a PE sample, intended to demonstrate that a measurement system or activity is in control.
quality control sample validation: The review of the results from calibration standards, blank samples, spiked samples, duplicate samples, and replicate samples that are presented on the quality control summary forms in a data package. Also known as “summary forms-only” validation.
quantitation limit: The minimum concentration of an analyte or category of analytes in a specific matrix that can be identified and quantified above the method detection limit and within specified limits of precision and bias during routine analytical operating conditions.
readiness review: A systematic, documented review of the readiness for the start-up or continued use of a facility, process, or activity. Readiness reviews are typically conducted before proceeding beyond project milestones and prior to initiation of a major phase of work.
Record of Decision (ROD): The document explaining EPA’s remedy decision.
remedial action (RA): In general, the longer-term remedy at an NPL site (CERCLA §101 has broad definition).
remedial design (RD): The engineering plan for cleaning up a site or portion of a site. The design generally includes technical specifications for equipment, loading rates, and other information necessary to construct and/or implement the remedial action.
remedial investigation (RI): In general, a Superfund site study that involves gathering data to determine the type, extent, and level of risk posed by contami-nation at a site.
remedial project manager (RPM): EPA staff person responsible for overseeing cleanup activities at NPL sites.
replicate samples: Multiple duplicate samples.
representativeness: A measure of the degree to which data accurately and precisely represent a characteristic of a population, a parameter variation at a sampling point, a process condition, or an environmental condition.
Resource Conservation and Recovery Act (RCRA): 42 U.S.C. s/s 6901 et seq. (1976) gives EPA the authority to control hazardous waste from the “cradle-to-grave.” This includes the generation, transportation, treatment, storage, and disposal of hazardous waste. RCRA also set forth a framework for the manage-
G-13

ment of non-hazardous wastes. Amended in 1984 to require phasing out of land disposal of hazardous waste. Some other parts of this amendment include increased enforcement authority for EPA, more stringent hazardous waste management standards, and a comprehensive underground storage tank program.
RCRA Facility Assessment: Element of RCRA Corrective Action where regula-tors and/or owners and operator compile existing information on environmental conditions at a given facility, including information on actual and potential releases.
RCRA Facility Investigation: Site characterization that should describe the facility and releases of hazardous waste and constituents as necessary to enable the identification and implementation remedies needed to achieve the desired results.
required detection limit: Project specific method detection limit that is usually specified as part of the measurement quality objectives.
Royal Demolition Explosive (RDX): Hexahydro-1,3,5-trinitro-1,3,5-triazine, commonly referred to as RDX.
sample quantitation limit: Quantitation limit adjusted for dilutions, changes to sample volume/sizes and extract/digestate volumes, percent solids and clean-up procedures.
sampling and analysis plan (SAP): The overarching quality assurance plan that normally includes a field sampling plan and a quality assurance project plan.
screening data: Analytical data of know quality, concentration, and level of uncertainty. The levels of quality and uncertainty of the analytical data are consistent with the requirements for the decision to be made. Screening data are of sufficient quality to support an intermediate or preliminary decision but must eventually be supported by definitive data before a project is complete.
semi-volatile organic compound (SVOC): An organic compound that volatili-zes slowly at 20o C and 1 atm pressure.
sensitivity: The capability of a test method or instrument to discriminate between measurement responses representing different levels (e.g., concentrations) of a variable of interest. Examples of QC measures for determining the sensitivity include laboratory-fortified blanks, a method detection limit study, and initial calibration low standards at the quantitation limit.
site assessment: Generally, a screening-level environmental evaluation of an area (e.g., site, property) to determine where an environmental cleanup action may be
G-14

required. Within the Superfund program, site assessment involves data collection and analysis to determine which sites may need cleanup under EPA’s removal (short-term) or remedial (long-term) cleanup programs. Examples of site assessment activities include preliminary assessments and site inspections.
site inspection (SI): The second stage of the EPA process for screening a contaminated site to determine if it warrants inclusion on the National Priorities List. The site inspection normally involves collection and analysis of a limited number of soil and water samples.
soil vapor extraction: A cleanup technique in which extraction wells (vertical or horizontal) are placed in the unsaturated zone of a contaminated area and a vacuum applied to collect volatilized contaminants and move them to an above-ground treatment system.
Solid Waste Management Unit: For purposes of RCRA corrective action, any discernible unit at which solid wastes have been placed at any time, irrespective of whether the unit was intended for the management of solid or hazardous wastes. Such units include any area of a facility at which solid wastes have been routinely and systematically released.
speciality technical firm: A vendor that provides specific technical expertise such as geophysical surveys, soil gas monitoring, and on-site laboratory services. They generally do not perform services outside of their core area of expertise.
spectrophotometer: An instrument used to identify and quantitate chemicals based on their absorption of characteristic spectral wavelengths.
spike: A substance that is added to an environmental sample to increase the concentration of target analytes by known amounts; used to assess measurement accuracy (spike recovery). Spike duplicates are used to assess measurement precision.
split samples: Two or more representative portions taken from a sample in the field or laboratory, analyzed by at least two different laboratories. Prior to split-ting, a sample is mixed (except volatiles) to minimize sample heterogeneity. These are quality control samples used to assess precision, variability, and data comparability between different laboratories. (Should be used when accompanied by a PE sample.)
staged field activity: A field approach consisting of a series of mobilizations with each subsequent mobilization being based on an evaluation of data collected during the previous mobilization.
G-15

standard operating procedure (SOP): A written document that details the method for an operation, analysis, or action with thoroughly prescribed techniques and steps and that is officially approved as the method for performing certain routine or repetitive tasks.
statement of work: The specifications or other description that describes the general scope, nature, complexity, and purpose of the supplies or services the Government requires in a manner that will enable the contractor to develop a technical plan or proposal, schedule, and a cost estimate.
SW-846: An EPA publication entitled Test Methods for Evaluating Solid Waste, Physical/Chemical Methods and developed by the Office of Solid Waste (OSW). It is OSW's official compendium of analytical and sampling methods that have been evaluated and approved for use in complying with the RCRA regulations. SW-846 functions primarily as a guidance document setting forth acceptable, although not required, methods for the regulated and regulatory communities to use in responding to RCRA related sampling and analysis requirements. It has become widely adopted and used throughout the hazardous waste site remediation community.
systematic planning process: A planning approach for environmental data operations that is based upon two primary elements: (1) the scientific method and (2) a common sense, graded approach to ensure that the level of detail in planning is commensurate with the importance and intended use of the work and the available resources.
technical team leader: The experienced individual who is responsible for the overall development of work plans, execution of field activities, data evaluation, and final deliverables. The technical team leader must be a cross-trained, experienced individual who can quickly integrate information from multiple disciplines to guide the investigation activities. This individual has the final decision-making responsibilities in the field and is responsible for communicating those decisions and/or recommendations to the Agency. Many times OSCs perform the role of technical team leader for the Agency during removal actions.
total recoverable petroleum hydrocarbons (TRPH): The concentration measured by a method that uses an extractant chemical to selectively dissolve hydrocarbons from a media for measurement. As indicated by its name, the process may not remove all of the hydrocarbons from the target media.
trinitrotoluene (TNT): An explosive that consists of a benzene ring with three nitrogens and a methyl group.
validation – sampling and analysis validation: Confirmation by examination and provision of objective evidence that the particular requirements for a specific intended use are fulfilled. Data validation is a sampling and analytical process
G-16

evaluation that includes evaluating method, procedural, or contractual compli-ance, and extends to criteria based upon the quality objectives developed in the project QAPP. The purpose of data validation is to assess the performance associated with the sampling and analysis to determine the quality of specified data. [Compliance with method, procedural, and contractual requirements. Comparison to project quality criteria from the QAPP.]
verification – sampling and analysis verification: Confirmation by examina-tion and provision of objective evidence that the specified requirements (sampling and analytical) have been completed. [Completeness check.]
volatile organic compound (VOC): Any hydrocarbon-based chemical with a vapor pressure equal to or greater than 0.1 mm Hg or with a boiling point below
o200 C.
work plan: A document that explains in general terms the approach that will be used for a field activity.
x-ray fluorescence: An analytical method that depends on the emission of characteristic x-ray line spectra when an unknown substance is exposed to x-rays for identification and quantitation.
G-17