Using Data to Inform Instructional Practice - ERIC · Using Data to Inform Instructional Practice...
38
Using Data to Inform Instructional Practice ___________________________________________________________________ An Action Research Project Presented In Partial Fulfillment of the Requirements for the Master of Education in Early Childhood Education ___________________________________________________________________ By Angela L. Barnett April 30, 2011 ___________________________________________________________________ Mercer University Douglas Regional Academic Center Ronald M. Knorr, Advisor
Transcript of Using Data to Inform Instructional Practice - ERIC · Using Data to Inform Instructional Practice...
Using Data to Inform Instructional Practice
___________________________________________________________________
An Action Research Project Presented In Partial Fulfillment of the Requirements for the
Master of Education in Early Childhood Education
___________________________________________________________________
By Angela L. Barnett
April 30, 2011 ___________________________________________________________________
Mercer University
Douglas Regional Academic Center
Ronald M. Knorr, Advisor
2
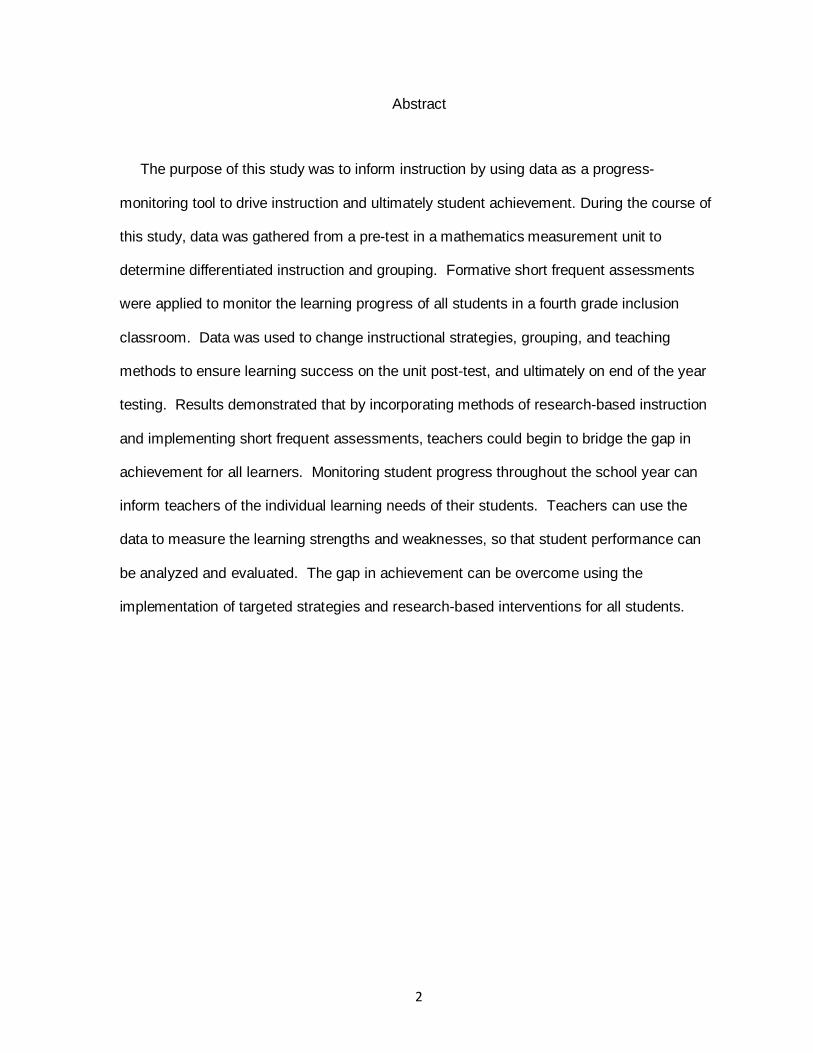
Abstract
The purpose of this study was to inform instruction by using data as a progress-
monitoring tool to drive instruction and ultimately student achievement. During the course of
this study, data was gathered from a pre-test in a mathematics measurement unit to
determine differentiated instruction and grouping. Formative short frequent assessments
were applied to monitor the learning progress of all students in a fourth grade inclusion
classroom. Data was used to change instructional strategies, grouping, and teaching
methods to ensure learning success on the unit post-test, and ultimately on end of the year
testing. Results demonstrated that by incorporating methods of research-based instruction
and implementing short frequent assessments, teachers could begin to bridge the gap in
achievement for all learners. Monitoring student progress throughout the school year can
inform teachers of the individual learning needs of their students. Teachers can use the
data to measure the learning strengths and weaknesses, so that student performance can
be analyzed and evaluated. The gap in achievement can be overcome using the
implementation of targeted strategies and research-based interventions for all students.
3
Table of Contents
CHAPTER I- Introduction……………………………………………………………..5
Statement of the Research Problem……..………………….…...6
Definitions of Terms……………………………………….…..…...7
Assumptions of the Researcher…………………………….…….8
Limitations of the Research……………...………………..…..….9
Summary….……………………………………………………..….9
CHAPTER II- Literature Review…………………………………………………....10
How Teaching is Affected by Testing Accountability………....10
Progress Monitoring to Build Student Achievement…………..11
Building Instructional Communities……………………………..12
Data-Driven Instruction that Provides Student Success……...13
Research Question…………………………………….....……...15
CHAPTER III- Research Method……………………………………………..……17
Overview of the Project...........................................................17
Hypothesis and the Null..........................................................18
Description of Sample.............................................................18
Data Collection........................................................................19
Design.....................................................................................19
Procedures..............................................................................20
Method of Data Analysis.........................................................20
CHAPTER IV- Results and Conclusions...........................................................21
Results....................................................................................23
Conclusions............................................................................23
Discussion...............................................................................25
Limitations...............................................................................27
Implications for Classroom Practice.......................................28

4
Recommendations for Further Research...............................30
REFERENCES.................................................................................................32
APPENDIX.......................................................................................................36
5
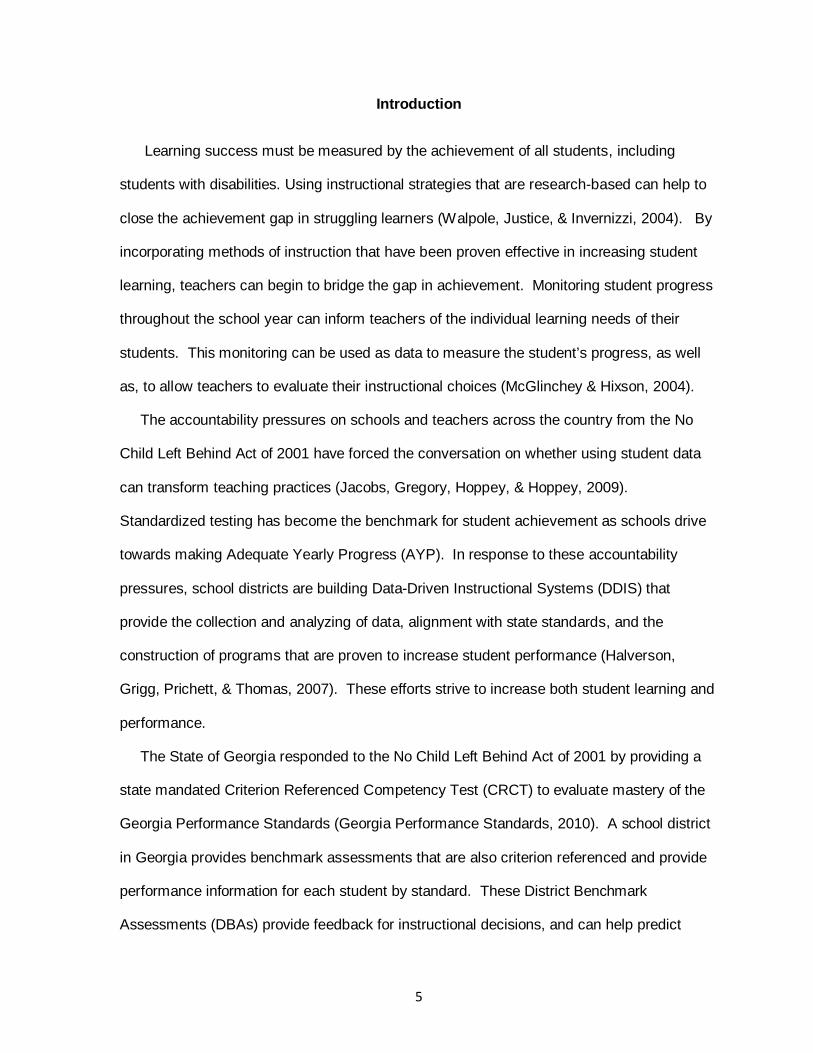
Introduction
Learning success must be measured by the achievement of all students, including
students with disabilities. Using instructional strategies that are research-based can help to
close the achievement gap in struggling learners (Walpole, Justice, & Invernizzi, 2004). By
incorporating methods of instruction that have been proven effective in increasing student
learning, teachers can begin to bridge the gap in achievement. Monitoring student progress
throughout the school year can inform teachers of the individual learning needs of their
students. This monitoring can be used as data to measure the student’s progress, as well
as, to allow teachers to evaluate their instructional choices (McGlinchey & Hixson, 2004).
The accountability pressures on schools and teachers across the country from the No
Child Left Behind Act of 2001 have forced the conversation on whether using student data
can transform teaching practices (Jacobs, Gregory, Hoppey, & Hoppey, 2009).
Standardized testing has become the benchmark for student achievement as schools drive
towards making Adequate Yearly Progress (AYP). In response to these accountability
pressures, school districts are building Data-Driven Instructional Systems (DDIS) that
provide the collection and analyzing of data, alignment with state standards, and the
construction of programs that are proven to increase student performance (Halverson,
Grigg, Prichett, & Thomas, 2007). These efforts strive to increase both student learning and
performance.
The State of Georgia responded to the No Child Left Behind Act of 2001 by providing a
state mandated Criterion Referenced Competency Test (CRCT) to evaluate mastery of the
Georgia Performance Standards (Georgia Performance Standards, 2010). A school district
in Georgia provides benchmark assessments that are also criterion referenced and provide
performance information for each student by standard. These District Benchmark
Assessments (DBAs) provide feedback for instructional decisions, and can help predict

6
future student performance on the CRCT. This data is used to inform instruction, provide
needs-based instruction to individual students, and evaluate present programs and
curriculum.
Performance Matters, a formative assessment system that provides teachers and
educational leaders with assessment data by standard on both the district and state
assessments, provides the software to access student progress (Performance Matters,
2010). Teachers utilize the data to measure strengths and weaknesses, so that student
performance can be analyzed and evaluated.
One school in a Georgia County implemented a data feedback system that provides
teachers with information for both formative and summative assessments. Teachers build
summative testing that covers a unit that is taught. This unit covers multiple standards.
Students are pre-tested before they are exposed the material to measure prior knowledge,
and develop a baseline. After evaluating the pre-test, teachers differentiate instruction
based on the results of the assessment. During the course of the unit, students are tested
weekly to appraise mastery over the material taught. These short, frequent assessments
are formative, and measure the learning progress of the students. Using these
assessments to inform instruction, teachers create flexible grouping, and change
instructional strategies and interventions to meet the learning needs of all students (Volante,
2010). Clearly the goal of teaching is to maximize learning for all students, and this is
possible by using continuous forms of data collection to positively influence student growth
and performance on a unit test. My goal is that measurable growth on a post-test in
measurement will translate into achievement on the CRCT (Georgia Department of
Education, 2010). My objective during this study was to observe measurable growth in all
learners by using data to drive my instruction.
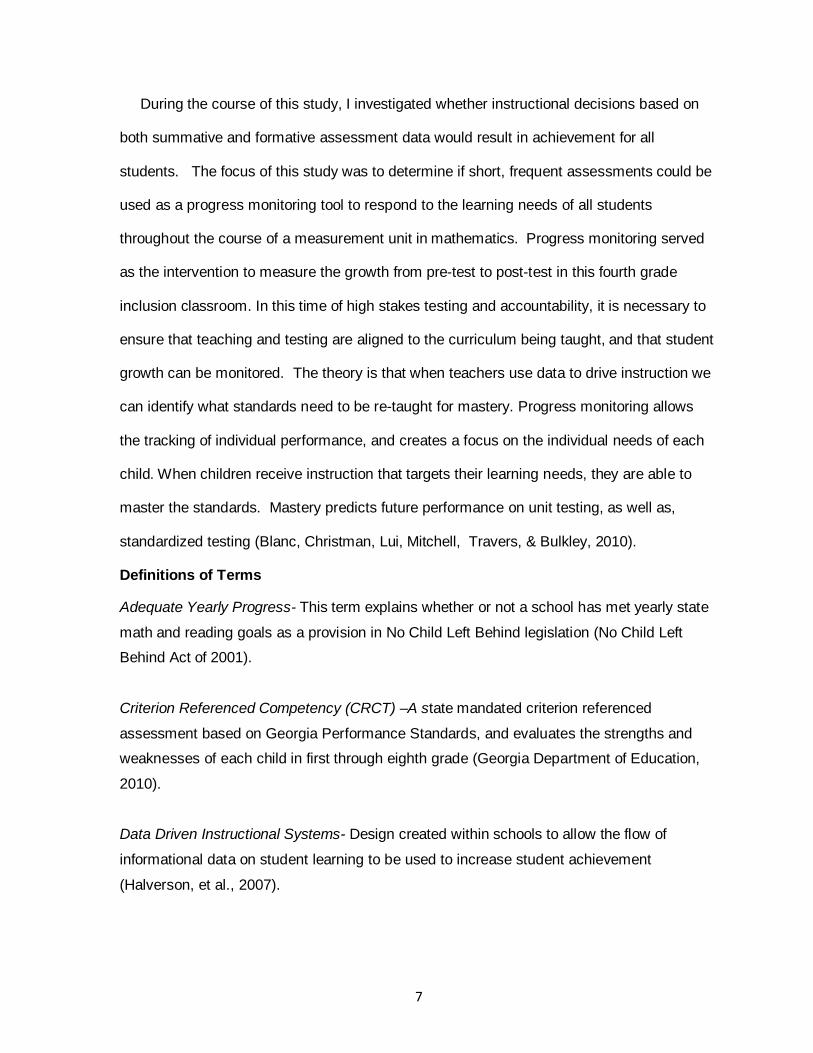
Statement of the Research Problem
7
During the course of this study, I investigated whether instructional decisions based on
both summative and formative assessment data would result in achievement for all
students. The focus of this study was to determine if short, frequent assessments could be
used as a progress monitoring tool to respond to the learning needs of all students
throughout the course of a measurement unit in mathematics. Progress monitoring served
as the intervention to measure the growth from pre-test to post-test in this fourth grade
inclusion classroom. In this time of high stakes testing and accountability, it is necessary to
ensure that teaching and testing are aligned to the curriculum being taught, and that student
growth can be monitored. The theory is that when teachers use data to drive instruction we
can identify what standards need to be re-taught for mastery. Progress monitoring allows
the tracking of individual performance, and creates a focus on the individual needs of each
child. When children receive instruction that targets their learning needs, they are able to
master the standards. Mastery predicts future performance on unit testing, as well as,
standardized testing (Blanc, Christman, Lui, Mitchell, Travers, & Bulkley, 2010).
Definitions of Terms
Adequate Yearly Progress- This term explains whether or not a school has met yearly state
math and reading goals as a provision in No Child Left Behind legislation (No Child Left
Behind Act of 2001).
Criterion Referenced Competency (CRCT) –A state mandated criterion referenced
assessment based on Georgia Performance Standards, and evaluates the strengths and
weaknesses of each child in first through eighth grade (Georgia Department of Education,
2010).
Data Driven Instructional Systems- Design created within schools to allow the flow of
informational data on student learning to be used to increase student achievement
(Halverson, et al., 2007).
8
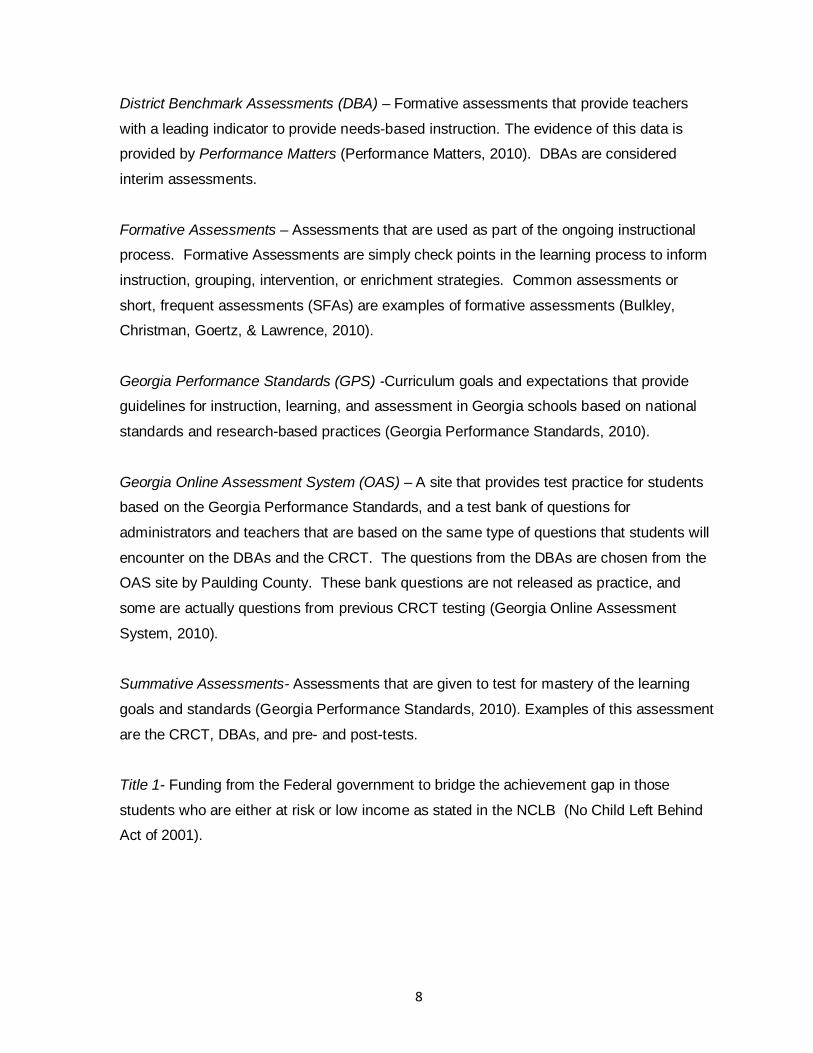
District Benchmark Assessments (DBA) – Formative assessments that provide teachers
with a leading indicator to provide needs-based instruction. The evidence of this data is
provided by Performance Matters (Performance Matters, 2010). DBAs are considered
interim assessments.
Formative Assessments – Assessments that are used as part of the ongoing instructional
process. Formative Assessments are simply check points in the learning process to inform
instruction, grouping, intervention, or enrichment strategies. Common assessments or
short, frequent assessments (SFAs) are examples of formative assessments (Bulkley,
Christman, Goertz, & Lawrence, 2010).
Georgia Performance Standards (GPS) -Curriculum goals and expectations that provide
guidelines for instruction, learning, and assessment in Georgia schools based on national
standards and research-based practices (Georgia Performance Standards, 2010).
Georgia Online Assessment System (OAS) – A site that provides test practice for students
based on the Georgia Performance Standards, and a test bank of questions for
administrators and teachers that are based on the same type of questions that students will
encounter on the DBAs and the CRCT. The questions from the DBAs are chosen from the
OAS site by Paulding County. These bank questions are not released as practice, and
some are actually questions from previous CRCT testing (Georgia Online Assessment
System, 2010).
Summative Assessments- Assessments that are given to test for mastery of the learning
goals and standards (Georgia Performance Standards, 2010). Examples of this assessment
are the CRCT, DBAs, and pre- and post-tests.
Title 1- Funding from the Federal government to bridge the achievement gap in those
students who are either at risk or low income as stated in the NCLB (No Child Left Behind
Act of 2001).

9
Assumptions of the Researcher
Given a safe learning environment and instruction that is based on the individual needs
of each student, I believe that all children can learn. Because of this belief, any gap in
achievement with the implementation of targeted strategies and interventions can be
overcome, and this includes students with disabilities or students that are economically-
disadvantaged. It is assumed that student growth on the unit post-test in this study will
translate to growth on the District Benchmark Assessments and the CRCT.
Limitations of the Research
As a teacher in a public school taking this course, I was limited by my available time to
conduct this research. I was also limited to the number of students that returned their
permission slips from their parents as consent to be involved. The results from this research
may not be generalized, that is they may not apply to other classrooms.
Summary
This study used data from a pre-test in a measurement unit to determine differentiated
instruction and grouping, and then used formative short, frequent assessments (SFAs) to
monitor the learning progress of all students in this fourth grade inclusion classroom. Data
was used to change instructional strategies, grouping, and teaching methods to ensure
learning success on the unit post-test, and ultimately on the District Benchmark
Assessments (DBAs) and the CRCT. Using formative assessments helped to gauge the
level of understanding, as well as, when to know that a particular teaching method or
strategy was working and changing when it did not (Bakula, 2010). By continuously
monitoring student progress, it was clear when the standards were mastered.

10
Literature Review
With the passage of the No Child Left Behind Act of 2001, all states have to provide
state assessments based on rigorous standards. States and local school districts are held
accountable for providing measurable goals for all students in an effort to bridge the gap in
achievement especially with low income and minority students. Educational reform has
driven the discussion how to use the data from assessments to inform instruction. One
argument is that if teachers engage all learners with a rigorous curriculum, monitor their
progress, and change instruction as needed, that all students can be successful (Diamond,
2007). When teachers meet the needs of all students, then the achievement gap can be
eliminated. Data has become an issue because of testing accountability, and the response
to intervention model because of recent legislation. Using this data can provide more
focused and precise instruction that is based on the individual needs of each child (Jacobs,
et al., 2009).
How Teaching is Affected by Testing Accountability
Certainly, there are cases where students are taught the test by well-intentioned
educators in an effort to increase standardized testing scores to meet accountability
measures. Additionally, there are teachers that use both formative and summative
assessments to collect data on measured growth, and then do not allow that data to inform
their instructional practice (Olah, Lawrence, & Riggan, 2010). In many cases, teachers hold
the belief that in order to raise test scores they must use the explicit teaching of isolated
skills, worksheets, and assessments that are visually similar to standardized multiple choice
testing. During a two-year study, teachers found that by using performance-based
assessments, collaborative grouping, and authentic writing that their scores on standardized

11
tests actually increased (Miller, 1995). Please note that each state chooses their own
assessments that comply with the federal law, and meet their own state standards.
Many states are beginning to see the value in performance-based assessments that are
more relevant and connected to student’s lives. According to Parke, Lane, and Stone
(2006), in a study in Maryland using the Maryland School Performance Assessment
Program (MSPAP) in both reading and writing, there was a significant increase in scores
over the five years represented in this study. Performance-based assessments can be
effectively used as an alternative method of providing valuable data, and measuring
achievement. Testing accountability does not have to translate into teaching to a test
(Parke, Lane, and Stone, 2006).
Progress Monitoring to Build Student Achievement
Many local districts are turning to the use of interim district benchmarks to continuously
assess students to build data that can be analyzed to target instruction toward standards
that are not mastered. According to Bulkley, Christman, Goertz, & Lawrence (2010), a
district in Philadelphia used benchmarks to measure growth every six weeks throughout the
school year. As a prelude, this case laid the groundwork for understanding how the link
between the district and teachers can be a cohesive one, and how collaboration on all levels
can improve student learning and performance (Bulkley, et al., 2010). Another excellent tool
that measures student learning is curriculum-based measurement (CBM). CBM, which
assesses reading fluency, has proven to be reliable and valid, and provides a great way to
both collect data and provide a continuous monitoring of student progress (McGlinchey &
Hixson, 2004).
Progress monitoring enables teachers to collect constant feedback on the standards
already mastered, and identify specific gaps in learning that need to be re-taught. Using this
12
data, teachers can group students for needs-based instruction so that all students can
develop proficiency. Based on a controlled experiment Ysseldyke & Bolt (2010),
implemented progress monitoring by administered a pre- and a post-test, and an
instructional management system with their math curriculum. In this study the experimental
group was assessed frequently, and based on the data, instruction and interventions were
changed in response to their performance. The control group simply used the math
curriculum. Results showed great gains in standards mastery and post-test scores through
this use of data collection. Progress monitoring provides teachers a way to measure what
each student needs to learn, and then the ability to ensure that mastery has been obtained.
Building Instructional Communities
Much research has been completed on school systems that can maximize the use of
data and translate that knowledge into student achievement. In a study, data was collected
from four schools over a period of a year to build a data-driven instructional system (DDIS)
that reflected how schools align standards and instruction, as well as, use assessments that
provide formative feedback and instructional guidance (Halverson, et al., 2007). This
framework also provides rich collaborative communities that collect, analyze, respond, and
reflect on data. If teachers are to use data successfully, they must continuously interpret
data to drive their instructional decision-making, and translate that data into differentiated
instruction. Districts that build successful collaboration experience higher student
performance and achievement.
Many local school systems across the country are constructing benchmark assessments
that are used to measure student growth, inform teaching practice, and predict future
success on state standardized tests. For instance, Bulkley, Christman, Goertz, and
Lawrence (2010) determined that success is maximized when school districts build
13
instructional communities that share data and communicate strategies that work.
Constructing communities that provide a system of support and communication must be
based on three types of sense making; “strategic, affective, and reflective” (Blanc,et al.,
2010, p. 212). It is not enough to simply collect data. This knowledge must be utilized to
transform teaching practice, so that the instructional needs of each student are met.
Creating an instructional community includes the professional development of teachers,
because they have the greatest impact on student achievement. Professional development
provides the necessary knowledge, proficiency, and beliefs to build a community of learners.
Hayes and Robnolt (2008) describe how student achievement is affected by using data-
driven decision making to inform professional development for their teachers as a result of a
federal grant through the Reading Excellence Act. Educators incorporated informal
assessments that were already in use for student placement to determine the greatest
instructional need for their students. To determine what professional development each
grade level needed to best meet the needs of their students, the grant coordinator and staff
analyzed the data. Building communities encourages a discussion that allows teachers to
seek those instructional strategies and interventions, as well as, professional learning that
will enhance both their practice and student achievement (Blanc, et al., 2010).
Data-Driven Instruction That Provides Student Success
Using data to inform instructional practice has transformed many school districts by
providing increased student achievement. According to Dappen, Isemhagen, and Anderson
(2005), the Nebraska STARS Program is based on local district control and accountability.
Testing data produced steady growth for their students. Teachers determined that by being
able to make critical judgments in the assessing of their students, they were able to provide
a more individualized and targeted instruction that resulted in greater success. In this

14
program, teachers were afforded the necessary control so that they could respond
immediately to the instructional needs of their students, and this translated into higher
student achievement.
In three Maryland schools, a survey was completed to determine if there was a
relationship between instruction and assessment performance (Guthrie, Schafer, & Secker,
2000). More specifically, educators wanted to identify what those schools that were reliably
increasing their reading standardized testing scores were doing that was different. By
constructing data that revealed what practices were working to monitor students’ growth,
they changed their instruction in response to the growth of their students. In this study,
some local Maryland schools began using reflection to evaluate students’ existing
knowledge, build the understanding of their educational experience, and enrich their
experience to build new knowledge. Reflection provides constant re-evaluation of
instructional methods that allows both teachers and students to change their experience and
actively engage in the learning process (Bulkley, et al., 2010).
Many school districts have created more performance-based assessments in response to
accountability. One such school district in Pittsburg, Pennsylvania has constructed a Work
Sampling System, or WSS (Meisles, Bickel, Nicholson, & Atkins-Burnett, 2001). By
implementing this study, they wanted to judge the validity of WSS in kindergarten through
third grade in five schools. WSS is based greatly on the effectiveness of teacher judgments
using curriculum-embedded performance assessments. Given individually, the WSS
correlated with a standardized psycho-educational battery, and determined that in students
that were above the first grade teacher judgments based on the WSS were highly
correlated.
15
Clearly the question that needs to be answered about data-driven instruction is whether it
can actually close the achievement gap between high achievers and low achievers,
especially with low income and minority students. In an urban school district, a quantitative
study with 98% minorities and 95% free or reduced lunches located in Southern California
raised their test scores by a minimum of 12% (Shanahan, Hyde, Mann, & Manrique, 2005).
Changes implemented included; benchmark assessments to inform instruction, curriculum
guides that were aligned with state standards, and professional learning. Professional
learning included guidance on interpreting data, and learning new strategies to teach math
in a concrete, hands-on way. Demonstrating the importance of using data to inform
instruction, this study implemented proven researched-based practices that provided results.
Using benchmarks assessments for data that are aligned with standards, allowing data to
inform teaching practice, and participating in professional development that provides
research-based methods can positively affect the achievement gap.
Research Question
In order to effectively use data to increase student achievement, it is important to
establish the relationship between data-driven instruction and student achievement. This
study determined that there was a positive relationship between data-driven instruction and
student achievement, and tested it by measuring the outcomes on a pre- and post- test.
Instruction was driven based on the results of the pre-test and the common formative
assessments, in a fourth grade inclusion classroom on a measurement unit in mathematics.
In response to the data on these assessments instruction, interventions, and grouping were
change based on the individual needs of the students. The grade level staff used this data
in collaboration to determine research-based strategies, reflect on student knowledge, and
make judgments on assessment results.
16
The literature review provided studies that have been used to transform districts and
schools by effectively using data to drive the instructional decision-making of teachers. This
study used data-driven instruction to increase student performance from a pre-test to a post-
test using short frequent assessments as a measure of student understanding, and a guide
to daily instruction. This study was conducted to determine if there was a relationship
between data-driven instruction and student achievement using the methods of the studies
provided in the literature review as a guide.
17
Research Method
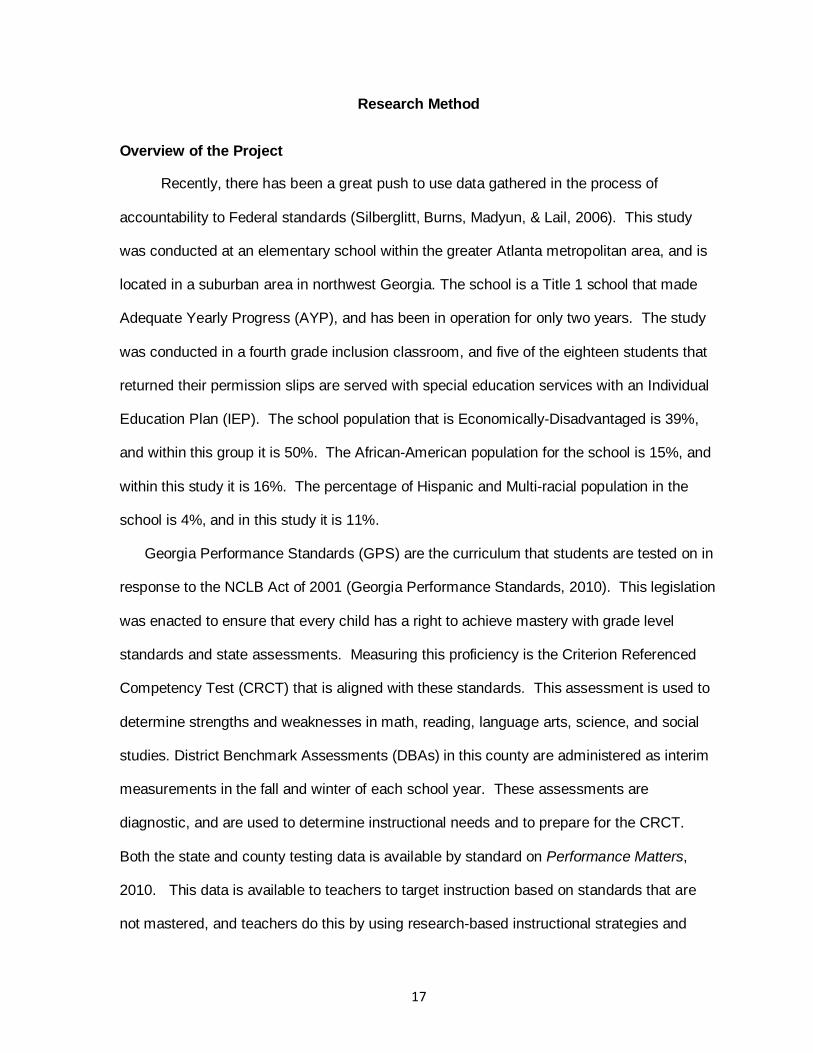
Overview of the Project
Recently, there has been a great push to use data gathered in the process of
accountability to Federal standards (Silberglitt, Burns, Madyun, & Lail, 2006). This study
was conducted at an elementary school within the greater Atlanta metropolitan area, and is
located in a suburban area in northwest Georgia. The school is a Title 1 school that made
Adequate Yearly Progress (AYP), and has been in operation for only two years. The study
was conducted in a fourth grade inclusion classroom, and five of the eighteen students that
returned their permission slips are served with special education services with an Individual
Education Plan (IEP). The school population that is Economically-Disadvantaged is 39%,
and within this group it is 50%. The African-American population for the school is 15%, and
within this study it is 16%. The percentage of Hispanic and Multi-racial population in the
school is 4%, and in this study it is 11%.
Georgia Performance Standards (GPS) are the curriculum that students are tested on in
response to the NCLB Act of 2001 (Georgia Performance Standards, 2010). This legislation
was enacted to ensure that every child has a right to achieve mastery with grade level
standards and state assessments. Measuring this proficiency is the Criterion Referenced
Competency Test (CRCT) that is aligned with these standards. This assessment is used to
determine strengths and weaknesses in math, reading, language arts, science, and social
studies. District Benchmark Assessments (DBAs) in this county are administered as interim
measurements in the fall and winter of each school year. These assessments are
diagnostic, and are used to determine instructional needs and to prepare for the CRCT.
Both the state and county testing data is available by standard on Performance Matters,
2010. This data is available to teachers to target instruction based on standards that are
not mastered, and teachers do this by using research-based instructional strategies and

18
interventions based on the needs of the individual child. Within the classroom, teachers
construct both formative and summative tests that are also based on GPS. Students
received pre-testing to provide a baseline for their knowledge in the beginning of a unit.
Academic gains are monitored through the use of short, frequent assessments (SFAs) that
measure their level of understanding. The results of the pre-test and the SFAs inform
instruction, allow grouping of students based on their instructional needs, and monitor
student progress (Roehrig Duggar, Moats, Glover, & Mincey, 2008).
Hypothesis and the Null
In order to effectively use this data, it is important to establish the relationship between
data-driven instruction and student achievement. For the purpose of this study, instruction
was driven based on the results of the pre-test and the short, frequent assessments in a
fourth grade inclusion classroom on a measurement unit in mathematics. So, this study was
conducted to determine if there was a significant increase in student achievement when
data-driven instruction was used for a unit in measurement. If no growth or correlation is
present in the findings of this study, it is reasonable to state that there is no significant
relationship between data-driven instruction and student achievement.
Description of the Sample
The sample that was collected for this study was a convenience sample in an inclusion
classroom where eight of the twenty-five students have a learning disability. Within this
classroom, there are also two students served in the Title 1 Program. Of the students that
returned their permission slips there are 10 females and 8 males (n=18). One student is
served in a gifted program called Venture. This group consisted of 13 White students, 3
Black students, 1 Hispanic student, and 1 Multi-racial student. In this study, there are nine
students that receive free or reduced breakfast and lunch. I gained permission or informed
consent from all of the parents of these students. There were no risks, physically or
19
mentally, from the implementation of this study. The identities of the students and their
scores have been protected, and they are referred to by a number.
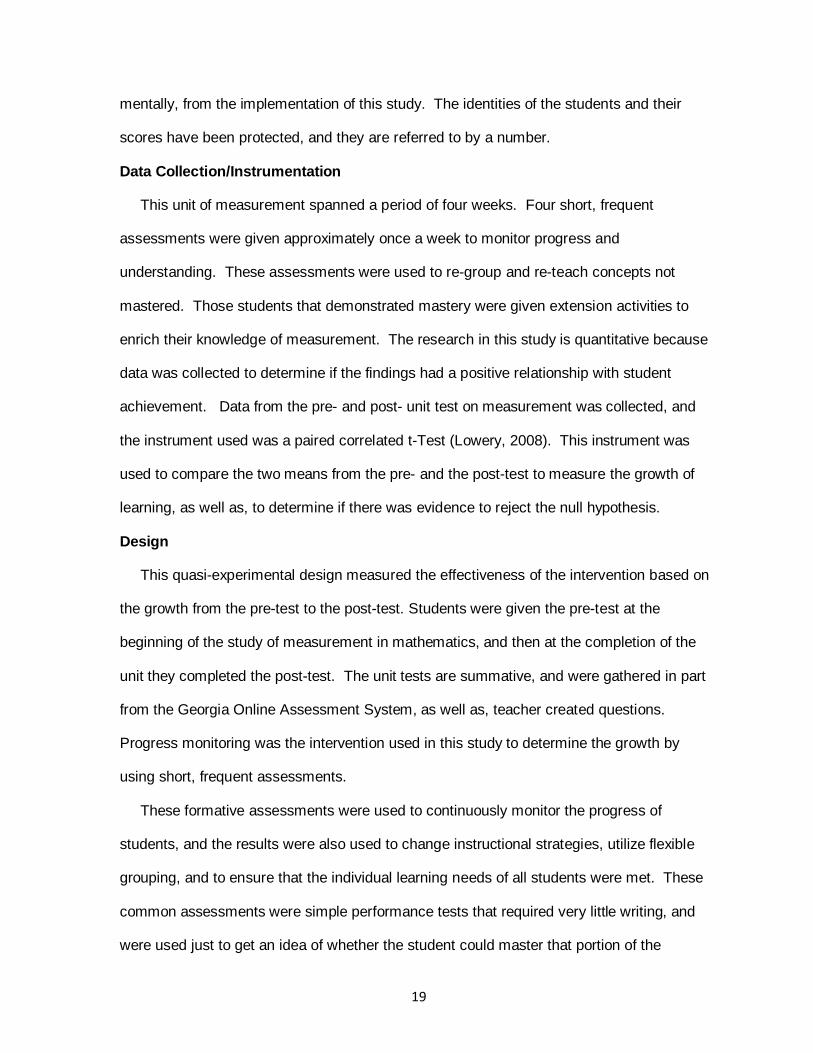
Data Collection/Instrumentation
This unit of measurement spanned a period of four weeks. Four short, frequent
assessments were given approximately once a week to monitor progress and
understanding. These assessments were used to re-group and re-teach concepts not
mastered. Those students that demonstrated mastery were given extension activities to
enrich their knowledge of measurement. The research in this study is quantitative because
data was collected to determine if the findings had a positive relationship with student
achievement. Data from the pre- and post- unit test on measurement was collected, and
the instrument used was a paired correlated t-Test (Lowery, 2008). This instrument was
used to compare the two means from the pre- and the post-test to measure the growth of
learning, as well as, to determine if there was evidence to reject the null hypothesis.
Design
This quasi-experimental design measured the effectiveness of the intervention based on
the growth from the pre-test to the post-test. Students were given the pre-test at the
beginning of the study of measurement in mathematics, and then at the completion of the
unit they completed the post-test. The unit tests are summative, and were gathered in part
from the Georgia Online Assessment System, as well as, teacher created questions.
Progress monitoring was the intervention used in this study to determine the growth by
using short, frequent assessments.
These formative assessments were used to continuously monitor the progress of
students, and the results were also used to change instructional strategies, utilize flexible
grouping, and to ensure that the individual learning needs of all students were met. These
common assessments were simple performance tests that required very little writing, and
were used just to get an idea of whether the student could master that portion of the
20
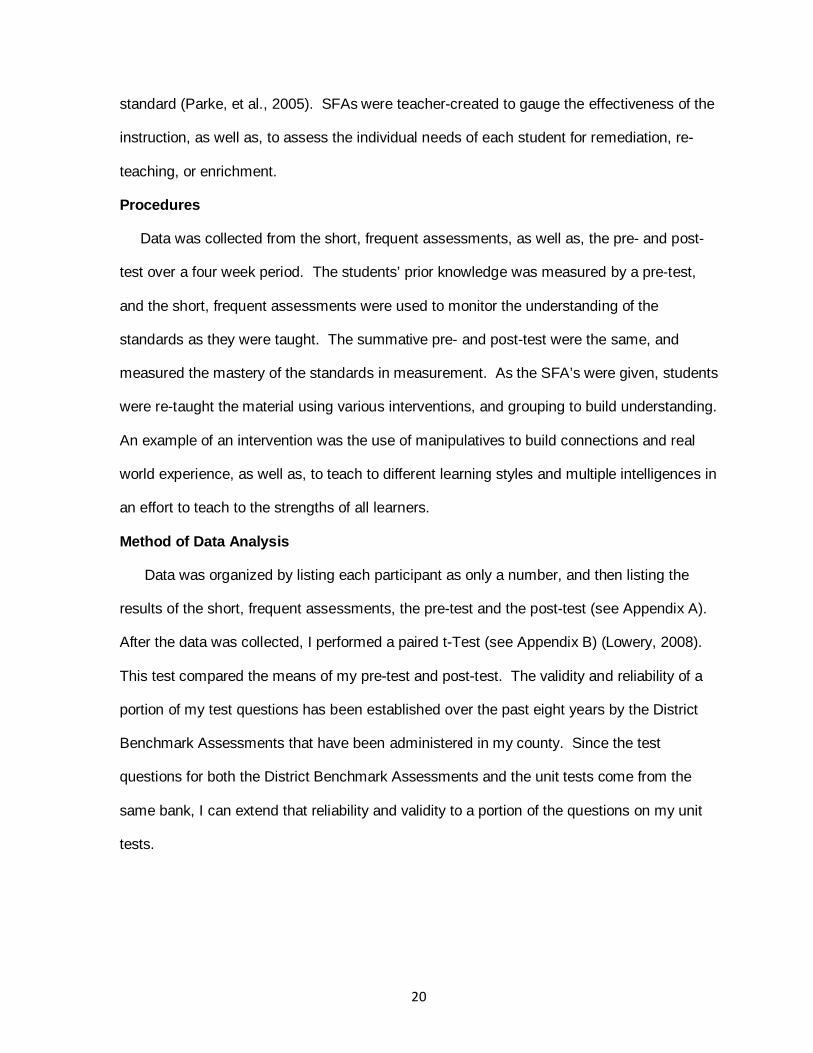
standard (Parke, et al., 2005). SFAs were teacher-created to gauge the effectiveness of the
instruction, as well as, to assess the individual needs of each student for remediation, re-
teaching, or enrichment.
Procedures Data was collected from the short, frequent assessments, as well as, the pre- and post-
test over a four week period. The students’ prior knowledge was measured by a pre-test,
and the short, frequent assessments were used to monitor the understanding of the
standards as they were taught. The summative pre- and post-test were the same, and
measured the mastery of the standards in measurement. As the SFA’s were given, students
were re-taught the material using various interventions, and grouping to build understanding.
An example of an intervention was the use of manipulatives to build connections and real
world experience, as well as, to teach to different learning styles and multiple intelligences in
an effort to teach to the strengths of all learners.
Method of Data Analysis
Data was organized by listing each participant as only a number, and then listing the
results of the short, frequent assessments, the pre-test and the post-test (see Appendix A).
After the data was collected, I performed a paired t-Test (see Appendix B) (Lowery, 2008).
This test compared the means of my pre-test and post-test. The validity and reliability of a
portion of my test questions has been established over the past eight years by the District
Benchmark Assessments that have been administered in my county. Since the test
questions for both the District Benchmark Assessments and the unit tests come from the
same bank, I can extend that reliability and validity to a portion of the questions on my unit
tests.

21
Results and Conclusions
This study examines the relationship between data-driven instruction and student
achievement. Students were given a pre-test to determine prior knowledge, and then a
series of short, frequent assessments after each skill was taught to determine understanding
(Halverson, et al., 2006). The students were then re-taught the skill using various
instructional interventions and grouping strategies (Guthrie, Schafer, & Secker, 2000). The
short, frequent assessments were used as a progress monitoring tool, and for feedback on
what individual students needed to be re-taught. Instruction was fluid in that it varied with
the needs of the students, and the data served as the catalyst for change. The data shows
that all students passed the post-test, and all demonstrated growth from the pre-test to the
post-test. The mean of the correct score on the pre-test was approximately 42%, and the
mean on the post-test was 83.5%. The growth illustrated in the table below shows that the
students, as a group, nearly doubled their score from pre-test to post-test. The average
growth was approximately 42% (see Table 1). Although all students demonstrated growth,
67% progressed by 40% or better. This growth is illustrated in Figure 1. The category is the
student’s assigned number, and the value is the score the student received on the pre- and
post-tests.

22
Table 1
Results of the Summative Testing
Student Number Pre-test Post-test Difference
1 45 90 45
2 85 90 5
3 25 80 55
4 50 85 35
5 45 95 50
6 30 75 45
7 35 80 45
8 55 85 30
9 30 85 55
10 30 70 40
11 45 70 25
12 25 70 45
13 75 95 20
14 60 90 30
15 30 78 48
16 25 95 70
17 25 80 55
18 40 90 50 41.94444444 83.5 41.55555556

23
Figure 1
0102030405060708090
100
1 3 5 7 9 11 13 15 17 19
Growth on Measurement Unit
Pre-testPost-test
Results
Table 1 compares the difference between the two observations, the pre- and post-test.
Using the One-tailed interpretation, since p < .05 and t > 0, there is an increase (t=8.97,
df=34, p=<.0001) (Lowery, 2008). There was a statistically significant increase in student
performance in the fourth grade inclusion classroom during this measurement unit. Using
the Two-tailed t-Test, since p < .05 and t > 0, there is evidence that there is a significant
difference across the paired observations (Lowery, 2008). There is evidence to reject the
null hypothesis that states that if no growth or correlation is present in the findings, than it is
reasonable to state that there is no significant relationship between data driven instruction
and student achievement.

24
Conclusions
During the course of this study on measurement, data was used to evaluate the choice of
instructional methods based on the prior knowledge, learning styles, and multiple
intelligences of each individual child. Because the school in this study is in a rural area of
Georgia, it was consistently noted that many students lacked background experience in
measurement.
The first skill within the standard of measurement was weight conversion (Georgia
Performance Standards, 2010). Many students had no experience with weight and mass.
As a class, we weighed paper clips, pencils, fruit, and books to build prior knowledge.
Students were supposed to convert grams to kilograms, ounces to pounds, pounds to tons,
as well as, the inverse of these. One great difficulty was differentiating between grams and
ounces. Students are required to be able to pick out real world examples of each. For this
reason, we used examples in all conversions to build the necessary connections. For
example, when we worked with grams, we connected grams to the mass of paper clips, and
ounces to the weight of an apple. By using both visual and concrete examples in our
discussions, we constructed both conceptual and procedural knowledge. By connecting both
real world examples and experience, most students did well on this abstract skill. (Appendix
A).
During the teaching of rotation, students used their bodies to perform the rotations of 90⁰,
180⁰, and 360⁰. They were also able to use objects, as well as, letters on their paper to
demonstrate their understanding in ways that covered all learning styles. The success of
using different instructional strategies was demonstrated in the results of the second short,
frequent assessment. All students in the class that participated in this study made 100%
(Appendix A).

25
Measuring angles using protractors proved to be the hardest concept that students had
to master in this unit. One third of the students did not pass the short, frequent assessment,
but on the unit post-test all students were successful (Appendix A). By using performance-
based activities like modeling the angles with folded paper helped them visually, and
provided the students with a concrete example. As a grade level, we discovered that
building conceptual knowledge needed to begin with concrete hands-on activities and
modeling. After the data was reviewed from the third SFA, those students who did not pass
were given more instruction and practice. The re-teaching of this skill was successful based
on the results of the post test.
Students also needed to know that the sum of all angles is 180⁰. So, they had to
determine the measurement of an unknown angle with only knowing the measure of the
other two angles within a given triangle. Students had to engage in a two-step process by
adding the two known angles, and subtracting that sum from 180⁰. Because the process
involved two steps, as well as two different operations, it was a difficult concept to master for
many students. As a class, we started off with multiples of ten making it easy for students to
add and subtract before they were challenged. Students were given extensive practice
before the SFA was given to provide small successes to build confidence and mastery. All
students passed this short, frequent assessment (Figure A).
Discussion
Many times teachers will gauge the understanding of their students by classroom
discussion and the completion of worksheets only to discover on summative testing that the
students actually did not demonstrate mastery. Using common formative assessments
provides continuous feedback on the progress of learning (Bakula, 2010). It is simply not
enough to collect data. Without interpreting the results of data instruction, performance will
remain unchanged. Teachers must use data to reflect, change, and build their practice to
26
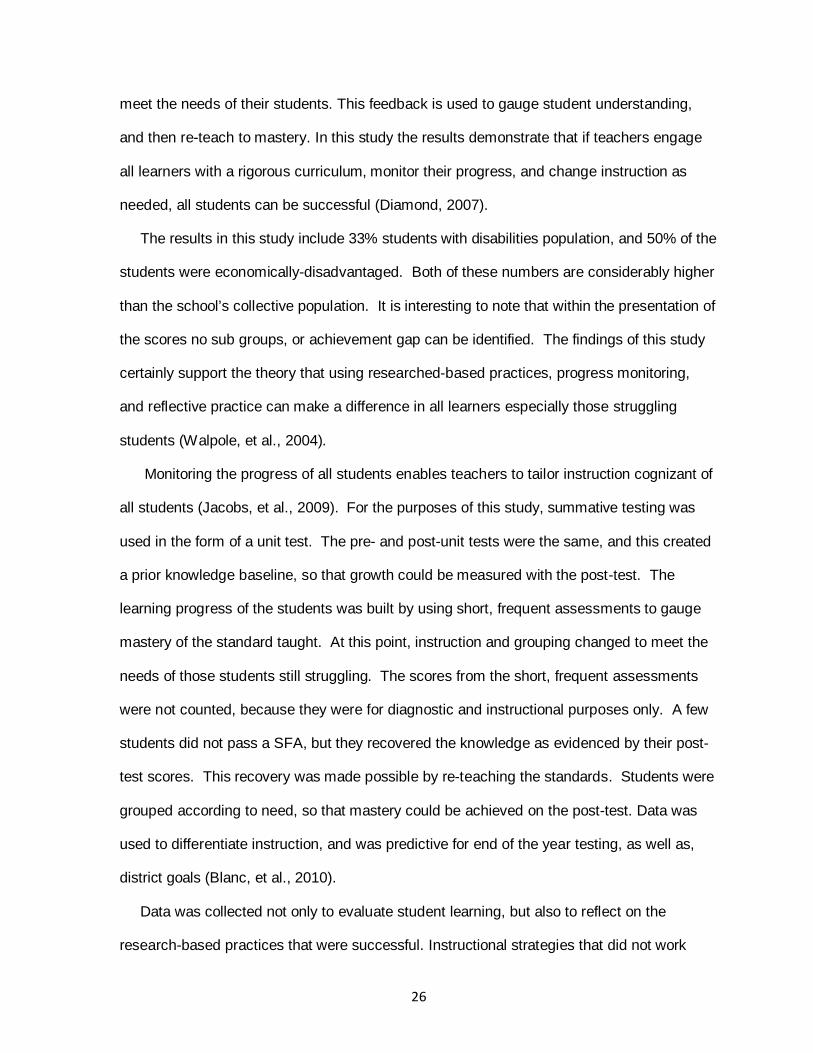
meet the needs of their students. This feedback is used to gauge student understanding,
and then re-teach to mastery. In this study the results demonstrate that if teachers engage
all learners with a rigorous curriculum, monitor their progress, and change instruction as
needed, all students can be successful (Diamond, 2007).
The results in this study include 33% students with disabilities population, and 50% of the
students were economically-disadvantaged. Both of these numbers are considerably higher
than the school’s collective population. It is interesting to note that within the presentation of
the scores no sub groups, or achievement gap can be identified. The findings of this study
certainly support the theory that using researched-based practices, progress monitoring,
and reflective practice can make a difference in all learners especially those struggling
students (Walpole, et al., 2004).
Monitoring the progress of all students enables teachers to tailor instruction cognizant of
all students (Jacobs, et al., 2009). For the purposes of this study, summative testing was
used in the form of a unit test. The pre- and post-unit tests were the same, and this created
a prior knowledge baseline, so that growth could be measured with the post-test. The
learning progress of the students was built by using short, frequent assessments to gauge
mastery of the standard taught. At this point, instruction and grouping changed to meet the
needs of those students still struggling. The scores from the short, frequent assessments
were not counted, because they were for diagnostic and instructional purposes only. A few
students did not pass a SFA, but they recovered the knowledge as evidenced by their post-
test scores. This recovery was made possible by re-teaching the standards. Students were
grouped according to need, so that mastery could be achieved on the post-test. Data was
used to differentiate instruction, and was predictive for end of the year testing, as well as,
district goals (Blanc, et al., 2010).
Data was collected not only to evaluate student learning, but also to reflect on the
research-based practices that were successful. Instructional strategies that did not work
27
were replaced. For example, the strategy of guessing and checking were used to determine
the sum of all of the angles in a given triangle. The students were given two angles and had
to find the third based on the knowledge that the sum of all angles in a triangle is equal to
180⁰. The process of this strategy did help to build conceptual knowledge, but did not prove
to be a helpful strategy, especially when the numbers were odd. Student progress was
discussed to share different strategies and interventions to develop and deliver instruction
that would ensure student mastery. Based on this collaboration, a new strategy using the
addition of the two known angles and then subtracting that sum from 180⁰ was used. As
fourth grade teachers, we discovered that students found this strategy easier. Using
reflective practice transforms teachers into instructional leaders (Halverson, et al., 2007).
Reflection provides the necessary re-evaluation of teaching practice to enhance the
engagement and learning of all students.
Limitations
The limitations of this study were time, limited participation, and generalization. The
teaching of this unit in measurement was limited to a four week study, because all standards
must be taught before the administering the CRCT in April. Another limitation was the
number of students that returned their permission slips with the written consent of their
parents. Finally, this study is limited to the parameters of this individual classroom. The
results from this study may not be generalized to other classrooms without the same
demographic composition and standards. The short, frequent assessments were teacher
created with future assessments in mind. The District Benchmarks have not been tested for
validity, but have been used reliably for both diagnostic and predictive value for the CRCT.
It is not known how these county and state assessments are comparable or relevant with
other district or state testing.

28
Because students knew that they were being observed during this unit in measurement,
it is possible that the Hawthorne Effect could be a factor in the internal validity of this study
(McMillian, 2008). However, informed consent from both parents and students was
completed a month in advance of the actual study. It is not known if the students actually
remembered that I was observing them. So, it is unclear if this threat had any effect of the
outcome of this study.
Another limitation to this study is the testing accommodations given to the students that
are served in special education. Those students make up 33% of the students in this study,
and their accommodations included, reading the test questions, testing in a small group, and
repeating and paraphrasing the directions.
Implications for Classroom Practice
The implications from this study can be used in schools to build Data-Driven Instructional
Systems (DDIS) in an effort to build the knowledge and practice of using data to drive
instruction (Halverson, et al., 2007). It is apparent that testing accountability will continue
due to NCLB, and that school districts across the country will still feel the pressure of high
stakes testing. For this reason, school systems that can gather, analyze, respond, and
reflect on data will be successful in building student achievement (Halverson, et al., 2007).
This system can be used to select professional learning, evaluate both instruction and
curriculum, and as a prognostication for future performance on assessments to bridge the
gap in student achievement.
Schools should use data discussions to inform the decisions they make about teacher
development (Hayes & Robnolt, 2007). Professional learning that is strategic can build
teacher knowledge in areas where data has revealed weaknesses. This will directly impact
the instructional needs within the classroom. Teachers that reflect on the data from their
students will seek out instructional strategies and interventions that can help change their
practice, and districts can support them by providing professional learning that targets the

29
instructional needs within their county, school, and grade level. This reflection provides the
necessary re-evaluation of practice to enhance the engagement and learning of all students
(Bulkey, et al., 2010). It makes sense to develop proficient teachers, because they have
the greatest impact on the achievement of students.
Using data is a way to evaluate student understanding, assessments, and curriculum.
The use of short, frequent assessments as a continuous monitoring process is a great way
to ensure that students understand the skills being taught before the unit test is given. By
allowing teachers to fill in the gaps of learning, they can proactively target instruction. Using
short, frequent assessments enables teachers to reflect and change their practice based on
the needs of their students (Bakula, 2010). They can serve as a prelude to those important
conversations on whether the curriculum is aligned with standards and testing. Reflecting on
the entire learning process can build a better understanding by providing constant
feedback, and can lead to better plans for action and change in student achievement.
Accordingly, the bottom line is whether or not data-driven instruction can bridge the
achievement gap with struggling learners. In this study, all learners made gains and met the
standard, including students with low income and students with disabilities. Simply teaching
the standards, and recording grades will not translate into successful learners. Teaching is
a practice that must respond to all students, and instruction must be given using different
strategies and methods to engage all learners (Shanahan, et al., 2005).
For my students, this unit of math provided a much needed success. Because so many
of my students struggle with all domains, using data-driven instruction allowed me to change
my instructional strategies and interventions to meet their needs. If a particular method of
instruction did not work, the short, frequent assessments informed me. I was able to re-
teach all of the skills my students struggled with so that they could be confident and

30
successful on the post-test. Data-driven instruction informed not only my practice, but also
the instructional needs of my students.
Recommendations for Further Research
It is clear that benchmark testing is successful in driving instruction, as well as,
predicting future testing performance. However, the research on benchmark assessments is
limited. More understanding and research is needed on how often students should be
tested. In the literature review of this study, Philadelphia uses interim benchmarks every six
weeks to change instruction based on the assessment data (Olah,et al., 2010). These
schools actually have a week after the results are realized to re-teach all of the skills that
were not mastered. The school district in this study uses fall and winter benchmarks for
diagnostic and predictive purposes. Is it any better to use these benchmarks every six
weeks instead of twice a year? Would there be any change in student achievement?
Would using the benchmarks better predict student success on high stakes standardized
testing?
Most teaching is based on skills, and not authentic learning experiences. One study was
based on performance-based assessments in Maryland in reading and writing, and has
experienced an increase in their scores (Parke, et al., 2006). Another study that was used
in my research increased test scores by using performance-based assessments,
collaborative grouping, and authentic writing (Miller, 1995). More research needs to be
done to determine if performance-based learning experiences and assessments will
increase all student achievement. Could this help close the achievement gap for struggling
learners?
There has been some research on Data-Driven Instructional Systems (DDIS) that builds
a framework of data. DDIS creates a community throughout a district to collect, analyze,
respond, and reflect on data (Halverson, et al., 2007). These communities analyze the
alignment of the standards, instruction, and assessments. Certainly these discussions are

31
needed in education if we are truly willing to put our students first. Teaching and learning
should be focused on the individual needs of the students. Although more research is
needed on this concept, it is clear that teachers should be an active part of the choices that
directly affect their students, and their practice.
32
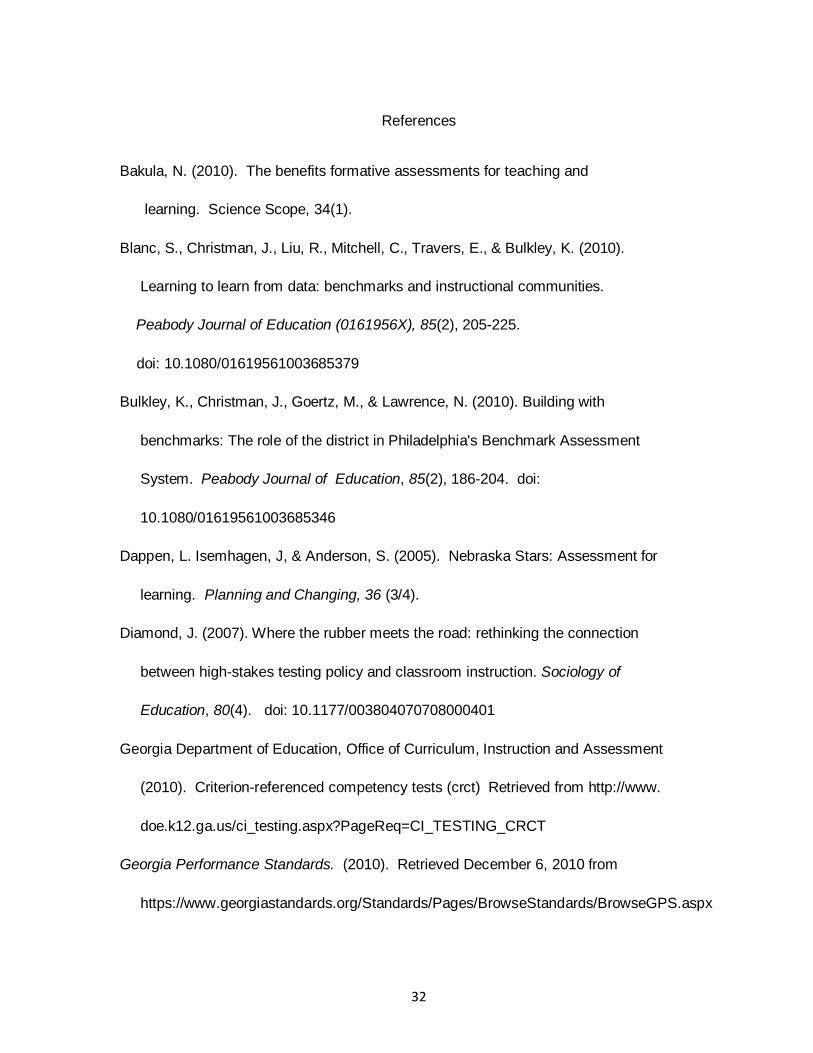
References
Bakula, N. (2010). The benefits formative assessments for teaching and
learning. Science Scope, 34(1).
Blanc, S., Christman, J., Liu, R., Mitchell, C., Travers, E., & Bulkley, K. (2010).
Learning to learn from data: benchmarks and instructional communities.
Peabody Journal of Education (0161956X), 85(2), 205-225.
doi: 10.1080/01619561003685379
Bulkley, K., Christman, J., Goertz, M., & Lawrence, N. (2010). Building with
benchmarks: The role of the district in Philadelphia's Benchmark Assessment
System. Peabody Journal of Education, 85(2), 186-204. doi:
10.1080/01619561003685346
Dappen, L. Isemhagen, J, & Anderson, S. (2005). Nebraska Stars: Assessment for
learning. Planning and Changing, 36 (3/4).
Diamond, J. (2007). Where the rubber meets the road: rethinking the connection
between high-stakes testing policy and classroom instruction. Sociology of
Education, 80(4). doi: 10.1177/003804070708000401
Georgia Department of Education, Office of Curriculum, Instruction and Assessment
(2010). Criterion-referenced competency tests (crct) Retrieved from http://www.
doe.k12.ga.us/ci_testing.aspx?PageReq=CI_TESTING_CRCT
Georgia Performance Standards. (2010). Retrieved December 6, 2010 from
https://www.georgiastandards.org/Standards/Pages/BrowseStandards/BrowseGPS.aspx

33
Guthrie, J., Schafer, W., & Von Secker, C. (2000). Contributions of instructional
practices to reading achievement in a statewide improvement program. The
Journal of Educational Research (Washington, D.C.), 93(4), 211-25.
doi: 10.1080/00220670009598710
Halverson, R., Grigg, J., Prichett, R., & Thomas, C. (2007). The New Instructional
Leadership: Creating Data-Driven Instructional Systems in School. Journal of
School Leadership, 17(2), 159-94.doi: 10.1080/01619561003685270
Hayes, L., & Robnolt, V. (2007). Data-Driven professional development: The
professional development plan for a reading excellence act school. Reading
Research and Instruction, 46(2), 95-119. Retrieved from Education Full Text
database doi: 10.1080/19388070709558463
Jacobs, J., Gregory, A., Hoppey, D., and Hoppey, D.Y. (2009). Data literacy:
Understanding teachers’ data use in a context of accountability and response to
intervention. Action in Teacher Education 31(3), 41-55.
Lowery, R. (2008, April 15). Vassarstats. Retrieved from http://faculty.vassar.edu/lowry
/VassarStats.html
McGlinchey, M., & Hixson, M. (2004). Using curriculum-based measurement to
predict performance on state assessments in reading. The School Psychology
Review, 33(2),193-203.
McMillian, J. H. (2008). Educational research: Fundamentals for the consumer. (5th ed.).
Boston: Pearson Education, Inc.
Meisels, S., Bickel, D., Nicholson, Y., & Atkins-Burnett, S. (2001). Trusting teachers’

34
judgments: A validity study of a curriculum-embedded performance assessment
in kindergarten to grade 3. American Educational Research Journal, 38(1), 73-95.
doi: 10.3102/00028312038001073
Miller, S. (1995). Teachers’ respond to test-driven accountability pressures:
“If I change will my scores drop?” Reading Research and Instruction, 34.
doi: 10.1080/19388079509558190
No Child Left Behind Act of 2001, Pub. L. No. 107-110, 115 Stat. 1425 (2002).
Olah, L., Lawrence, N., & Riggan, M. (2010). Learning to learn from benchmark
assessment data: How teachers analyze results. Peabody Journal of Education
85 (2), 226-245.
Parke, C., Lane, S., & Stone, C. (2006). Impact of a state performance assessment
program in reading and writing. Educational Research & Evaluation, 12(3), 239-
269. doi:10.1080/13803610600696957
Performance Matters, (2010). A comprehensive assessment and data management
platform. Retrieved November 17, 2010, from http://www4.
performancematters.com/web/
Roehrig, A., Duggar, S., Moats, L., Glover, M., & Mincey, B. (2008). When teachers
work to use progress monitoring data to inform literacy instruction: Identifying
potential supports and challenges. Remedial and Special Education, 29(6)
doi: 10.1177/0741932507314021
Shanahan, T., Hyde, K., Mann, V., & Manrique, C. (2005). Integrating curriculum guides,
quarterly benchmark assessments and professional development to improve

35
learning in mathematics. Retrieved from http://www.cfep.uci.edu/focus
/library/UCI_MSP_Pres_091505.pdf
Silberglitt, B., Burns, M., Madyun, N., & Lail, K. (2006). Relationship of reading
fluency assessment data with state accountability test scores: A longitudinal
comparison of grade levels. Psychology in the Schools, 43(5). doi: 10.1002/pits.20175
Volante, L. (2010). Assessment of, for, and as learning within schools: Implications
for transforming classroom practice. Action in Teacher Education, 31(4), 66-75.
Walpole, S., Justice, L., & Invernizzi, M. (2004). Closing the gap between research
and practice: case study of school-wide literacy reform. Reading & Writing
Quarterly, 20(3), 261-283. doi: 10.1080/10573560490429078
Ysseldyke, J., & Bolt, D. (2007). Effect of technology-enhanced continuous progress
monitoring on math achievement. School Psychological Review, 36(3), 453-467.

36
Appendix A
Student Achievement on Summative and Formative Assessments
Students Pre Test Score
SFA # 1 Score
SFA # 2
Score
SFA # 3
Score
SFA # 4
Score
Post-Test Score
Student Growth from pre to post
Test
1 45 100 100 55 85 90 +45
2 85 100 100 100 100 90 +5
3 25 100 100 85 100 80 +55
4 50 100 100 40 85 85 +35
5 45 100 100 85 100 95 +50
6 30 80 100 85 85 75 +45
7 35 100 100 55 85 80 +45
8 55 100 100 100 85 85 +30
9 30 100 100 85 100 85 +55
10 30 80 100 55 100 70 +40
11 45 100 100 85 100 70 +30
12 25 100 100 70 85 70 +45
13 75 100 100 100 100 95 +20
14 60 60 100 55 70 90 +30
15 30 60 100 85 100 78 +48
16 25 100 100 40 85 95 +70
17 25 80 100 85 85 80 +55
18 40 80 100 85 70 90 +50

37
Appendix B
Vassarstats Calculations
P
one-tailed
<.0001
two-tailed
<.0001
Vassarstats
Independent Samples
Independent Samples
Data Entry
Sample A Sample B
909080859575808585707070959078
45 8525504530355530304525756030
Data Summary
A B
Total
n 18 18 36
- X 1503 755 2258
- X2 126759 36975 163734
SS 1258.5 5306.944 22107.22
mean 83.5 41.9444 62.7222
Meana—Meanb t df
41.5556
+8.97
34

38
F-Test for the Significance of the Difference between the Variances of the Two SamplesQ
df1 df2 F P
17 17 4.22 0.002452 [Applicable only to independent samples.]
P>.05 indicates no significant difference detected between the variances of the two samples.
t-Test Assuming Unequal Sample Variances
[Applicable only to independent samples.]Q
Observed
Confidence Intervals
0.95 0.99
Meana 83.5 ±4.2791 ±
5.8812
Meanb 41.9444 ±8.7871 ±
12.077
Meana−Meanb [Assuming equal
sample variances.]
41.5556 ±9.403 ±
12.6454
Meana−Meanb [Assuming unequal sample variances.]
41.5556 ±9.1381 ±
12.2892
Independent
Meana—Meanb t df
41.5556
9.23
24.63
P
one-tailed
<.0001
two-tailed
<.0001