
Using Data in Santa Clara County · Santa Clara County Homeless Census & Surveyiii • Sheltered...
28
1 USING DATA IN SANTA CLARA COUNTY’S SUPPORTIVE HOUSING SYSTEM July 11, 2018 California Homeless Coordinating and Financing Council
Transcript of Using Data in Santa Clara County · Santa Clara County Homeless Census & Surveyiii • Sheltered...

1
USING DATA IN SANTA CLARA COUNTY’S SUPPORTIVE HOUSING SYSTEM
July 11, 2018 California Homeless Coordinating and Financing Council

-
2
The “Perfect” System
Everyone is assessed for necessary housing services.
Completely reliable assessment tool to determine the appropriate housing interventions that are needed for each household.
All agree on how scarce housing resources are prioritized.
All programs only take referrals from the countywide system.
All programs adhere to common performance measures and record all information in a common data system.
We have consistent access to administrative data to support the assessment tools and to report on the impact of housing programs on safety-net systems.

-
3
AGENDA
Office of Supportive Housing Data Sources
Coordinated Assessment System (CAS)
Performance Reporting and Outcomes
Office of the County Executive
Housing & Community Development
Permanent & Temporary Housing Programs
Continuum of Care

-
l/) C
8,000
~ 6,000 L.. a,
(L
l/)
~ 4,000 a, E 0
I 2,000
Santa Clara County Homeless Census & Survey iii
• Sheltered • Unsheltered
7,067 7,631
6,556
7,394
0 ----------------------January January January January 2011 2013 2015 2017
4
Typical Data Source: PIT / Census & Survey
Sheltered vs. Unsheltered
Demographics
Veteran Status and Special Populations
Jurisdictions / Locations
Causes of Homelessness
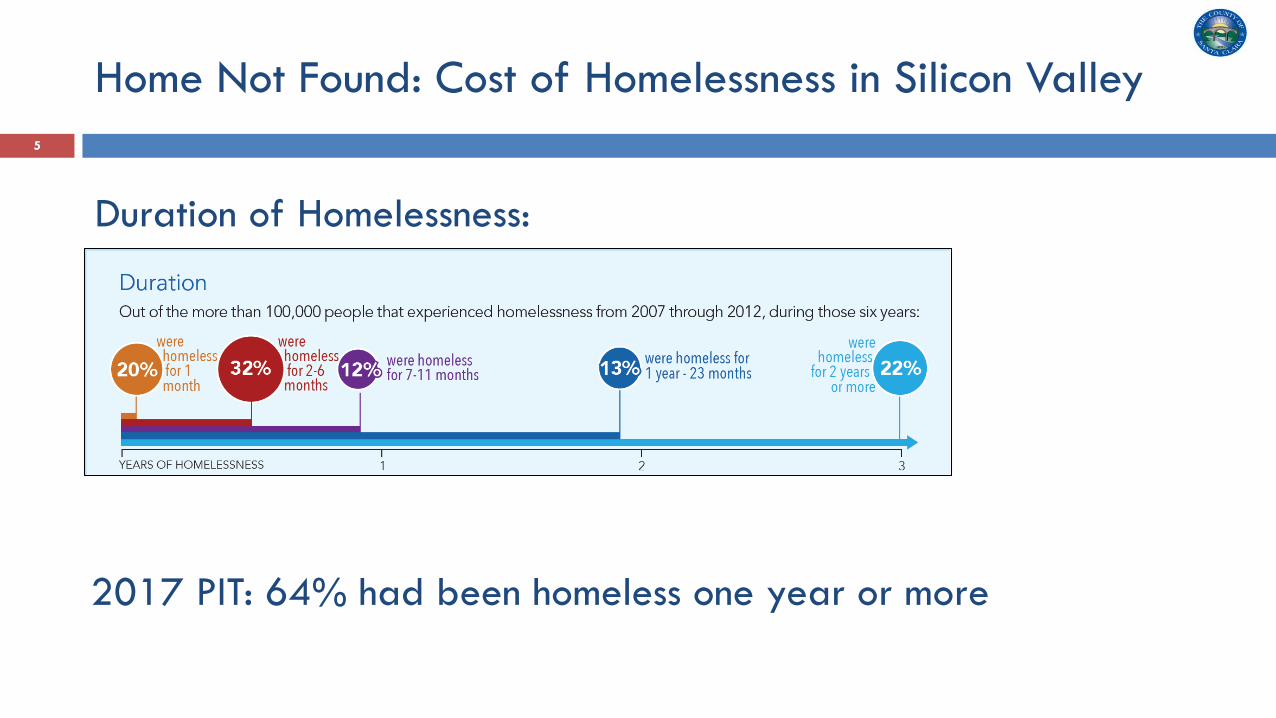
-Duration Out of the more than 100,000 people that experienced homelessness from 2007 through 2012, during those six years:
were
-
homeless for 1 month
YEARS O F HOMELESSN ESS
were homeless. were homeless fo r2-6 • for7-11 months months
• were homeless for 1 year -23 months
2
were. homeless for 2 years • •
or more
3
5
Home Not Found: Cost of Homelessness in Silicon Valley
Duration of Homelessness:
2017 PIT: 64% had been homeless one year or more

-$5,20 Ml ,LLION /YEAR
providing: s,ervices for homeless residents over the six-year study
~USTIC SYSTEM
THE LARGEST & MOST COMPREHENSIVE COST STUDY OF HOMELESSNESS IN THE USA 104,206 individuals in Santa Clara County over 6 years - between 2007 and 2012
HOUSING 1000
Pre-housing $62,473
Post-housing $19,767
--n.n
n.n
Reduction of $42,706
For the 103 homeless residents in the tenth cost decile who were housed through Housing 1000 program, the estimated average annual pre-housing public cost was $62,473. The estimated average post-housing cost was $19,767, a reduction of $42,706 annually.
6
Costs and Cost-Avoidance

-- �
� � � � � � -
I � � � � � � �
= • � -= iiiiiiil ii • � - �
7
Annual Agency Costs for Homeless Residents by Decile
$90,000 Cost data in 2011-2012,
Probation shown in 2014$ $80,000 Custody Mental Health
Custody Medical $70,000 Jail and Courts
80% received <$8,000 Foster Care $60,000
in benefits & services
Annu
al C
ost i
n 20
14 $
General Assistance
CalWORKs $50,000
Food Stamps Top, 10th Decile = 54%
of public costs $40,000 Homeless Services
Drug & Alcohol Rehab. $30,000 Emerg. Med. Transport.
Mental Health Outpatient
1st d
ecile
2nd
decil
e
3rd
decil
e
4th
decil
e
5th
decil
e
6th
decil
e
7th
decil
e
8th
decil
e
9th
decil
e
10th
dec
ile
Top
5%
$202
$952
$1,8
72
$6,1
89
$4,8
18
$3,8
85
$2,8
73
$46,
995
$7,6
72
$83,
083
Priv. Hosp. Inpatient & ER
$11,
294
$10,000
$20,000 Top 5% = 42% of public Mental Health Inpatient
costs VMC ER & Clinic
VMC Inpatient $0 Source: Economic Roundtable analysis; Source: Linked records for 96,857 individuals with costs in 2011 and/or 2012, presented in $2014.

8 --I
llllllllt--I
I I ..._
� ~ ~ �
-----I � 111111111-I 11111111.. � I ... ..,_
--� -- � I ........ I
a I
1111111-I
I I
111111111-11111111---I I I
I
~ I ! I I I I I I I I
. , 111111111111111 1 111111111
Odds Compared to All Homeless of Being in Different Cost Groups based on Individual Attributes
AGE 0-17 Years
18-24 Years 25-34 Years 35-44 Years 45-54 Years
55+ Years ETHNICITY
African American Asian
Euro. American Latino
Pacific Islander Other
SEX Female
Male OTHER FACTORS
Foreign Born Chronic Homeless Substance Abuse
Mental Illness Dual Diagnosed
Tri-Morbid Foster Youth
Bottom 95% of costs
Costs that spike into the top 5% and then drop
Top 5% with continuing high costs
0 1 2 3 4 5 6 Odds of Being in Different Cost Groups
(>1 = Higher Odds)
Odds Compared to All Homeless of Being in Different Cost Groups Based on Medical Diagnosis
Infectious Disease (001-139)
Neoplasm (140-239)
Endocrine Disorder (240-279)
Blood Disease (280-289)
Mental Disorder (290-319)
Nervous Sys. Disease (320-389)
Circulatory Diseases (390-459)
Respiratory Diseases (460-519)
Digestive Disease (520-579)
Genitourinary Disease (580-629)
Comp. of Pregnancy (630-679)
Skin Diseases (680-709)
Musculoskeletal Dis. (710-739)
Congenital Anomalies (740-759)
Perinatal Conditions (760-779)
Ill-Defined Conditions (780-799)
Injury and Poisoning (800-999)
Health Hazards (E & V codes)
Psychosis (290-299)
Schizophrenia (295)
Bottom 95% of costs
Costs that spike into the top 5% and then drop
Top 5% with continuing high costs
0 1 2 3 4 5 Odds of Being in Different Cost Groups
(>1 = Higher Odds) Source: 33,582 persons with complete cost data from all departments who were in Santa Clara County all years 2007-2012.
6

-Total Permanently Housed ITOTALI 5,154
1,212 1201sltttttttttttt· 12m6lttttttttttttttttttt 120111tttttttttttttttttttt•
1,883 2,059
9
Progress
As measured by biannual point-in-time counts: Continued reductions in chronic homelessness
Continued reductions in veteran homelessness

-Access Points Standard Assessment
~ Shelters
Outreach
fl>I Services
THP
Community Queue Housing Referrals
t -- - -- - -- - -- - --•
PSH
t -- ---- --- -----•
Moderate AcultV..,
--------,, t RRH
Refer to Other Services
---. ~
EAN ~ / ~ Public Benefits
Affordable Housing
TH
·----------------------------------------
~---------------------------------------~ I I I I I I I I I I I I I
·-----------------------------------------
Coordinated Assessment System
Permanent Supportive Housing
Score of 9+ for Families w/Children
Score of 8+ for Individuals
Rapid Rehousing Score of 4-8 for Families
w/Children Score of 4-7 for Individuals
Minimal Intervention Score of 0-3

-
� � �
Acuity of assessed households over time
3500 60.0% 56.5%
Ded
uplic
ated
Firs
t Ass
essm
ents
0 2015 2016 2017 Projected 0.0%
2018 2015 2016 2017 2018 Calendar Year Acuity
19.2% 21.8%
18.1% 16.0%
47.3% 49.4%
47.2%
24.3%
30.9% 32.5% 36.9%
No housing intervention RRH PSH No housing intervention RRH PSH
3000
Perc
emt o
f H
ouse
hold
s A
sses
sed
50.0%
2500 40.0%
2000
1500 30.0%
1000 20.0%
500 10.0%

-
� � �
� � �
For example: Acuity by gender
Trans Male
Trans Female
Gender Non-Conforming
Male
Female
No housing intervention RRH PSH
0.0% 10.0% 20.0% 30.0% 40.0% 50.0% 60.0% 70.0% 80.0% 90.0% 100.0%
Female
16.1% 48.3% 35.5%
Male
24.0% 54.9% 21.1%
Gender Non-Conforming
0.0% 63.6% 36.4%
Percent oh Households Assessed
Trans Female
5.9% 49.0% 45.1%
Trans Male
22.2% 33.3% 44.4%
No housing intervention RRH PSH

\
15,296 VI-SPDATs Households
1,543 Families with
7 Justice Discharge
Nov 15, 2015 – Dec 31, 2017 12,138 Unduplicated
10,008 Individual 580 Youth Children Adults VI-SPDAT Type

-Referrals by intervention range over time
Refe
rral
s
1200
1000
800
600
400
200
0
815
238
PSH RRH
259 463
197
60
2016 2017 Jan-Apr 2018 Calendar Year

-� �
Inflow Exceeds Housing Placements
421 460
380 416
395
449 425 433 422
348 385
367
161 181
139 178
143 152 124
146 134 128 162 148
Households Entering the Coordinated Assessment System and the Number of
Households Housed
Households who took the VI-SPDAT Assessment for the First Time
Households Placed in Housing
73 79 66 66 77 83 74 78 81 57 59 73
208 209 194 200 195 218 228 238 212 169 193 160
140 172
120 150 123
148 123 117 129
122 133 134
421 460
380 416 395
449 425 433 422
348 385 367
Number of Households Entering the Coordinated Assessment System at Each Level of Intervention
PSH, RRH, Minimal Intervention
-
- - - - - - - - -
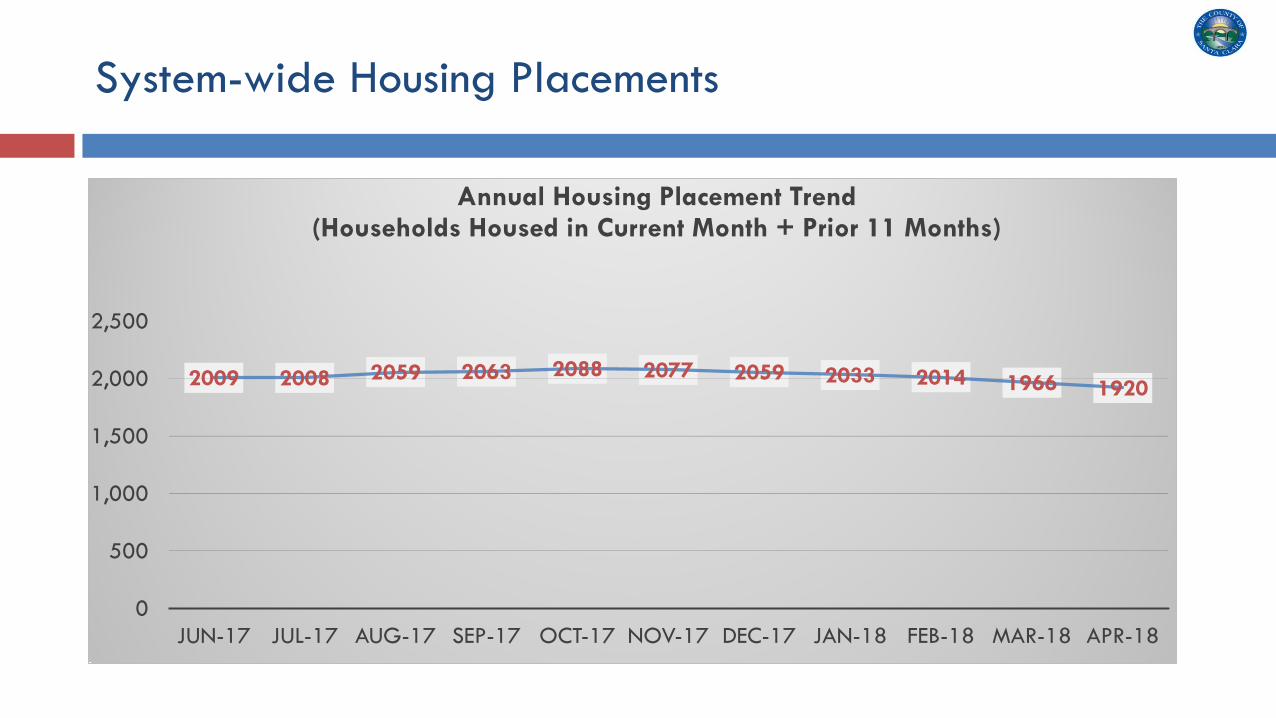
System-wide Housing Placements
Annual Housing Placement Trend (Households Housed in Current Month + Prior 11 Months)
2,500
2059 2063 2088 2077 2059 19662033 20142,000 2009 2008 1920
1,500
1,000
500
0 JUN-17 JUL-17 AUG-17 SEP-17 OCT-17 NOV-17 DEC-17 JAN-18 FEB-18 MAR-18 APR-18

-iiii Iii - - - - - -
,'I " ,'I ,'I ,eo ,eo ,eo ,eo ,'I ,'I ,'I ~ '<~- ~ ~
,'I ,.__, ~- u ~ ~ ~ .:i>'v 0' ~- oc; ~o <:)'¢ --,'?'
4.' ~ ~'<) ~ ~
,<o ,<o ,<o ,<o ,'I ,'I ,'I ,'I ,'I ,'I ,'I " ~ '<~ ~ ~ ,.__, ~- u
~ ~ .:i>'v 0' ~- ,;)'¢ --,'?' 4.' ~ q:; oc; ~o ~ ~ ~
- - - - - -- - -
Housing Placements by Program Type
Permanent Supportive
Housing
Rapid Rehousing
48 60
50
76
42 40 31 36 32 29
41 44
Number of Households Housed Monthly via a Permanent Supportive Housing (PSH) Program
53 66
60 51 47
37 48
41
26 34 34
47
Number of Households Housed Monthly via a Rapid Re-Housing (RRH) Program
Note: PSH placements include Veterans placed in housing with VASH vouchers
576 590 579 595 590 582 577 573 567 569 551 529
0
200
400
600
800
Annual PSH Placement Trend (Current Month + Prior 11 Months)
542 578 600 615 625 625 631 615 587 568 543 544
0
200
400
600
Annual RRH Placement Trend (Current Month + Prior 11 Months)

-- - - - - - - - - -
- -- - - - - - - -
Housing Placements by Program Type
22 22 21
34
22 27 24
18 23 19
11 11
Number of Households Exiting a Transitional Housing (TH) Program to Permanent Housing (PH), by Month
Annual Housing Placement Trend from TH to PH (Current Month + Prior 11 Months)
400 336 332 326 335 333 340 335 317 306 294 284 254
200
0
Transitional Housing
30 24 25 36 35
47 38
49 44 37
68
48
Number of Households Exiting an Emergency Shelter (ES) Program to Permanent Housing (PH), by Month
464 448 444 434 431 443 440 449 457 457 474 481
0
200
400
600
Annual Housing Placement Trend from ES to PH (Current Month + Prior 11 Months)
Emergency Shelter

-
� � �
System Performance Measures
Returns to Homelessness After exiting to Permanent Housing Destinations, the Percentage of People who Return to Homelessness in less than 6 Months, 1 Year, and 2 Years (N = Exits to PH between
05/2015 to 4/2016)
6 Months 1 Year 2 Years 20%
10%
0%
8%
1% 3%
8% 11%12%
3% 6%
13% 17%18%
6%
11%
19% 23%
SYSTEM (N=1929) PERMANENT HOUSING RAPID REHOUSING TRANSITIONAL EMERGENCY SHELTER (N=88) (N=526) HOUSING (N=592) (N=709)
Benchmarks:
6 -12 Months 12% 2% 2% 4% 10%
2 Years 12% 2% 2% 6% 15%

-
� �
�
3
1System Performance Measures (cont.)
Exits to Permanent Housing Destinations Of Persons in ES, TH, and RRH who Exited, the Percentage of Successful
Exits to Permanent Housing
05/01/16-04/30/16 05/01/16-04/30/17
05/01/17-04/30/18
Permanent Housing Retention 4 Percentage of People in Permanent Housing Programs (excluding Rapid Rehousing) Retaining Housing during the Reporting Year
(Benchmark = 95%)
33%
64% 58%
18%
32%
70%
55%
17%
40%
72%
55%
24%
96.5%
92.6%
97.9%
SYSTEM RAPID TRANSITIONAL EMERGENCY (40%) REHOUSING HOUSING SHELTER (30%)
(95%) (75%) 05/01/15- 05/01/16- 05/01/17-04/30/16 04/30/17 04/30/18

-
� � � �
Utilization Outcomes for PSH Programs (excluding PWH) 21
Outpatient Mental Health Service Encounters 12000
10000
8000
6000
4000
2000
0 25-36 mos. 13-24 mos. 0-12 mos. 0-12 mos. 13-24 mos. 25-36 mos.
Outpatient Drug/Alcohol Service Encounters 5000
4500
4000
3500
3000
2500
2000
1500
1000
500
0 25-36 mos. 13-24 mos. 0-12 mos. 0-12 mos. 13-24 mos. 25-36 mos.
Pre Housed Post Housed Pre Housed Post Housed

-
� � � �
Utilization Outcomes for PSH Programs (cont.) 22
County Emergency Room Admits
900
800
700
600
500
400
300
200
100
0 25-36 mos. 13-24 mos. 0-12 mos. 0-12 mos. 13-24 mos. 25-36 mos.
County Inpatient Hospital Stays
1000
900
800
700
600
500
400
300
200
100
0 25-36 mos. 13-24 mos. 0-12 mos. 0-12 mos. 13-24 mos. 25-36 mos.
Pre Housed Post Housed Pre Housed Post Housed

-
� � � �
23
Utilization Outcomes for PSH Programs (cont.)
Admits to Emergency Psychiatric Services
350
300
250
200
150
100
50
0 25-36 mos. 13-24 mos. 0-12 mos. 0-12 mos. 13-24 mos. 25-36 mos.
Pre Housed Post Housed
Psychiatric Inpatient Service Days
200
180
160
140
120
100
80
60
40
20
0 25-36 mos. 13-24 mos. 0-12 mos. 0-12 mos. 13-24 mos. 25-36 mos.
Pre Housed Post Housed

-
� � � �
Utilization Outcomes for PSH Programs (cont.) 24
Number of Arrests
700
600
500
400
300
200
100
0 25-36 mos. 13-24 mos. 0-12 mos. 0-12 mos. 13-24 mos. 25-36 mos.
Pre Housed Post Housed
Number of Days Incarcerated
9000
8000
7000
6000
5000
4000
3000
2000
1000
0 25-36 mos. 13-24 mos. 0-12 mos. 0-12 mos. 13-24 mos. 25-36 mos.
Pre Housed Post Housed
-
: : : I I
...... ...... ...... ...... ...... ......
25
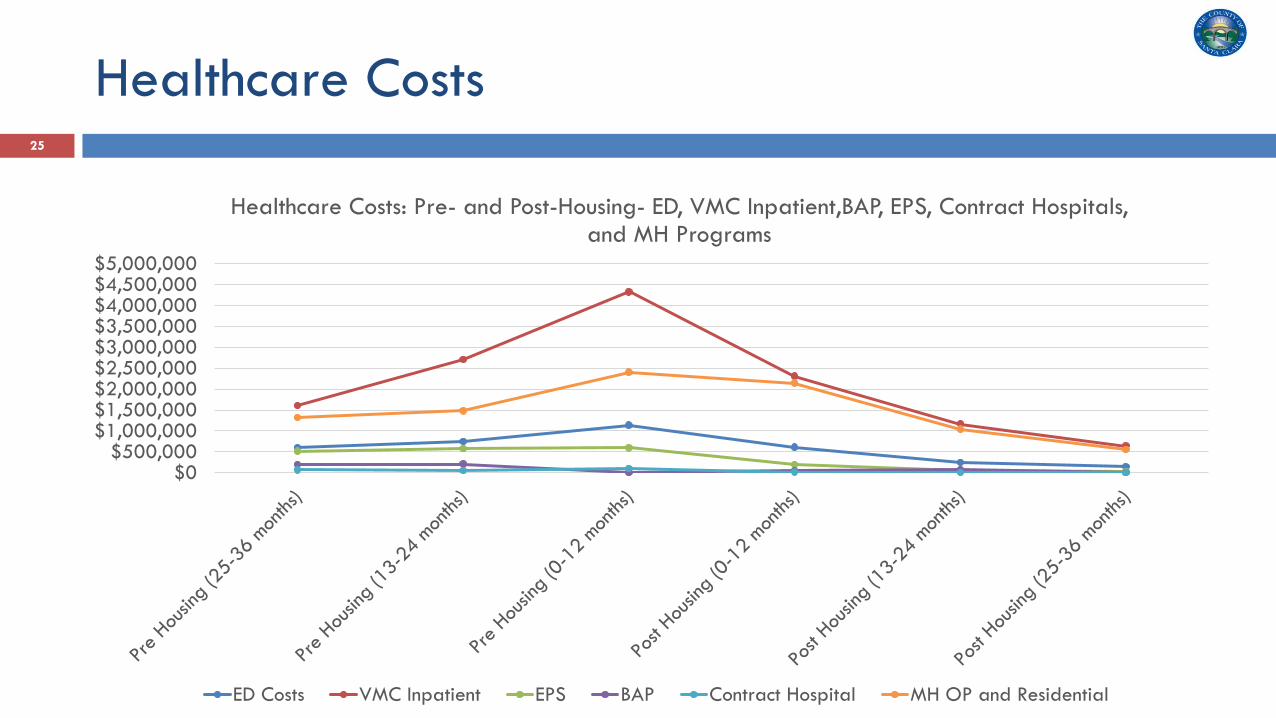
Healthcare Costs
Healthcare Costs: Pre- and Post-Housing- ED, VMC Inpatient,BAP, EPS, Contract Hospitals, and MH Programs
$5,000,000 $4,500,000 $4,000,000 $3,500,000 $3,000,000 $2,500,000 $2,000,000 $1,500,000 $1,000,000
$500,000 $0
ED Costs VMC Inpatient EPS BAP Contract Hospital MH OP and Residential

-
1 0
70
30
0
Top Services Breakdti n
'VMCTICU • zzVMCJR, .. e VMC EtlP. ,3
• VMC B .·p __ _
• · MC 2.A ••• • V. iC !ICC • VMC SA ... • :Z2VMCT,f::_ ..
VM . 4$U .. . e VMC 6A .. .
VM [) • Z-ZVMCii •• • -v C ~SU __ _
• VMC EPS
e VMC E:D
f'ER l:�D
rnonth.;..
F~L'fER SE~ VICES
V.M·C. ijA ~ IJ
V."11,C ~P4� 0 lC
VM'C !ED X
VM'C TICU X
. C ,EflS \t'M:C iMICC
ZLV~CJR B X
26
Project Welcome Home after 36 months

-
27
What’s Missing? Next Steps
Augmenting Coordinated Assessment Utilization Tool for Project Welcome
Home
High Users of Multiple Systems (HUMS)
Silicon Valley Triage Tool
Specialized Outreach and Programs
Randomized Controlled Trials
Automation
System Impact for non-PSH Programs
Coordinated Assessment 2.0 Emergency Shelter & Transitional
Housing System
New/Better VI-SPDAT
More access points
DV System / Emergency Assistance System
Homelessness Prevention SPDAT
Homelessness Prevention using risk factors among safety-net populations

An end to homelessness means that every community will have a systematic response in place that ensures homelessness is prevented whenever possible or is otherwise a rare, brief, and non-recurring experience.
Moving on all Fronts Parkside Studios, Sunnyvale, CA Charities Housing Development Corporation


![FEUP | PDEEC | Decision Support January 3 rd, 2011 Metaheuristics: GRASP Group 1: Clara Gouveia Daniel Oliveira Fabrício Sperandio Filipe Sousa [Presenter]](https://static.fdocuments.net/doc/165x107/56649d2c5503460f94a02eba/feup-pdeec-decision-support-january-3-rd-2011-metaheuristics-grasp-group.jpg)


