Using data and evidence to drive effective policy and practice for children Best Start Forum...
43
Using data and evidence to drive effective policy and practice for children Best Start Forum Melbourne, November 27, 2007 Professor Frank Oberklaid Director, Centre for Community Child Health Royal Children’s Hospital, Melbourne, Australia
-
date post
19-Dec-2015 -
Category
Documents
-
view
217 -
download
0
Transcript of Using data and evidence to drive effective policy and practice for children Best Start Forum...

Using data and evidence to drive effective policy and practice for
children
Best Start Forum
Melbourne, November 27, 2007
Professor Frank Oberklaid
Director, Centre for Community Child Health
Royal Children’s Hospital, Melbourne, Australia
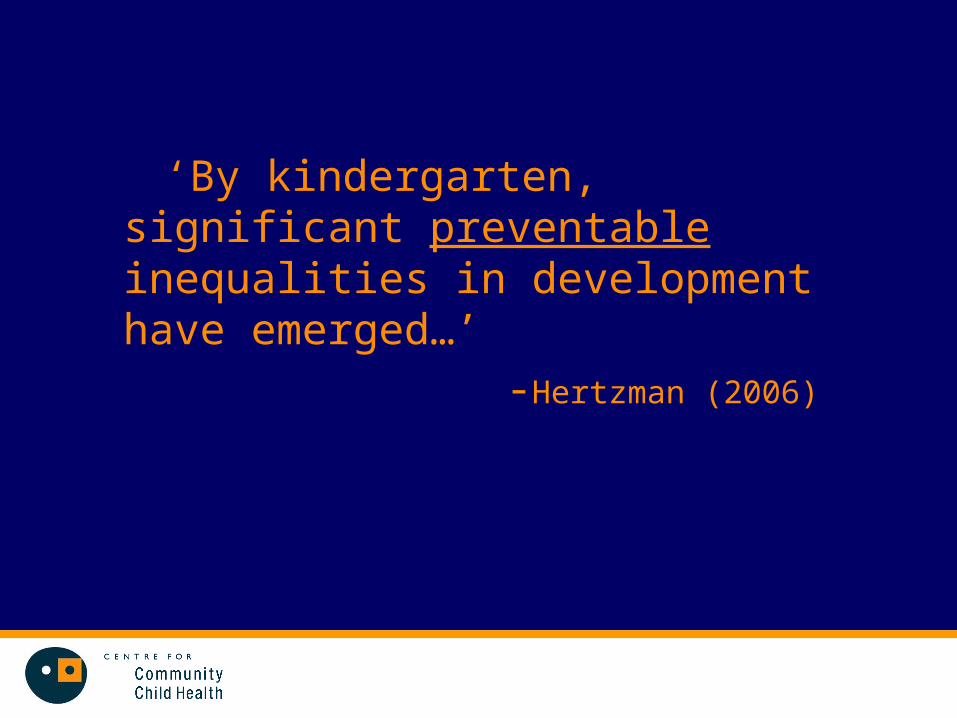
‘By kindergarten, significant preventable inequalities in development have emerged…’
-Hertzman (2006)
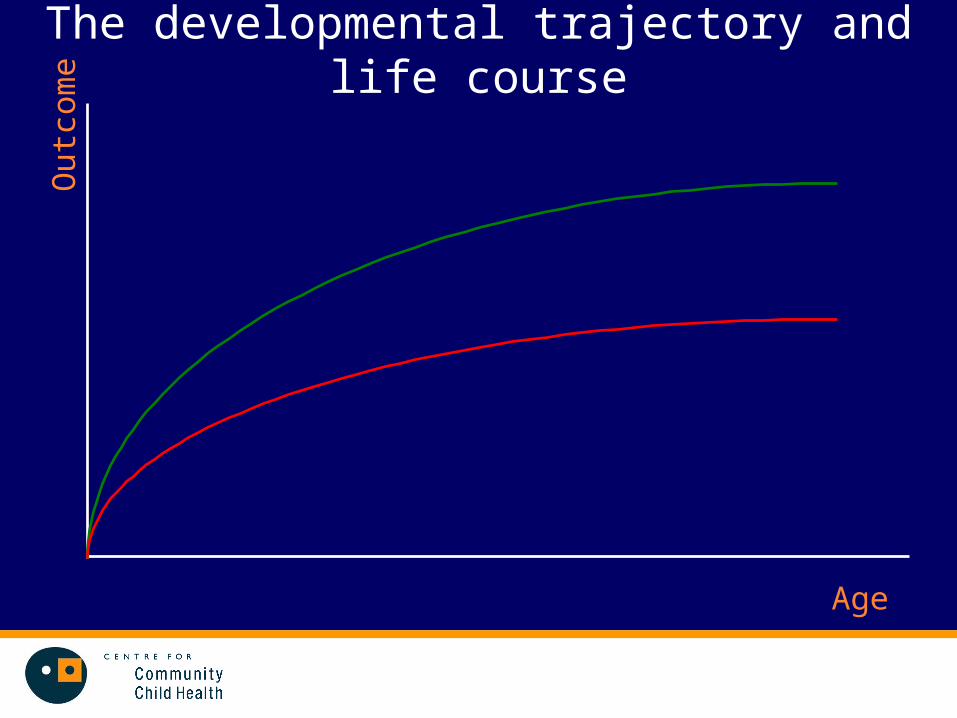
The developmental trajectory and life courseO
utco
me
Age

Sub-optimal developmental trajectory…
• Unfulfilled potential and problems in childhood• Beginning of pathways to problems later in life• Evidence that many problems in adult life have
their origins in pathways that begin in childhood
• Loss of potential of achievement in multiple domains and facets of life

Intervention effects and costs of social-emotional mental health problems over time (Bricker)
Time
High
Low
Cost
Intervention effectiveness
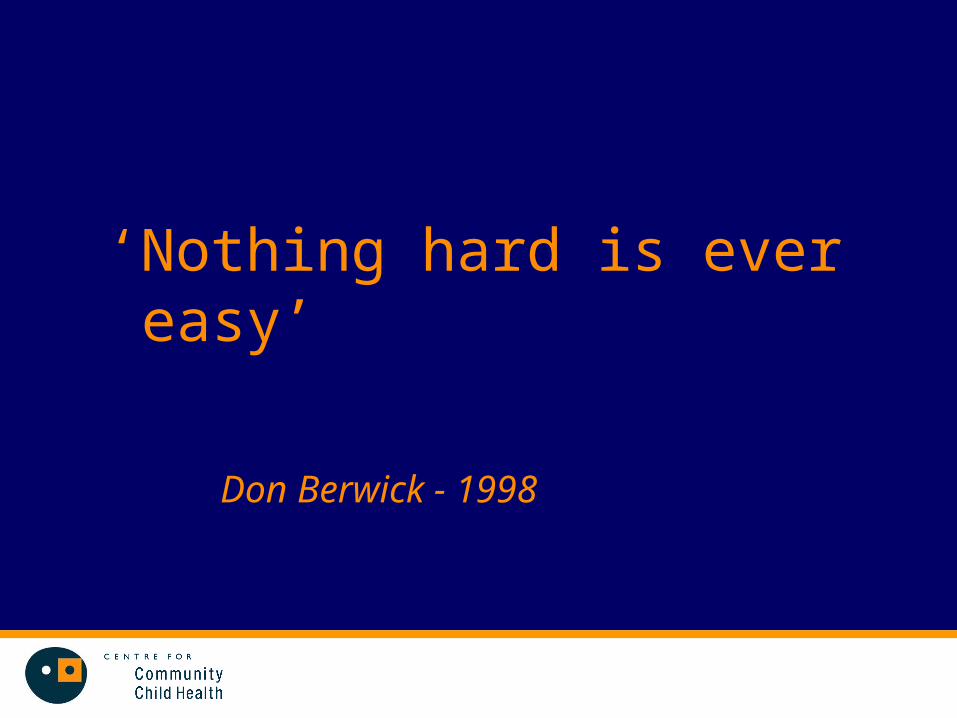
‘Nothing hard is ever easy’
Don Berwick - 1998

The importance of data
‘Data should be at the centre of child health (and policy), not in the periphery of monitoring.’
Child Health Indicators of Life and Development (CHILD) - Report to the European Union 2002

Data collection• Reliable• Valid• Relevant• Meaningful• Simple to collect • Coverage adequate for validity - universal• Useful - can be utilised to inform policy or
programs

Uses of community data
• Measuring variables relevant to ECD• Evaluating change in variables over time• Comparisons with other communities• Informing community about ECD• Assessment of community support for ECD
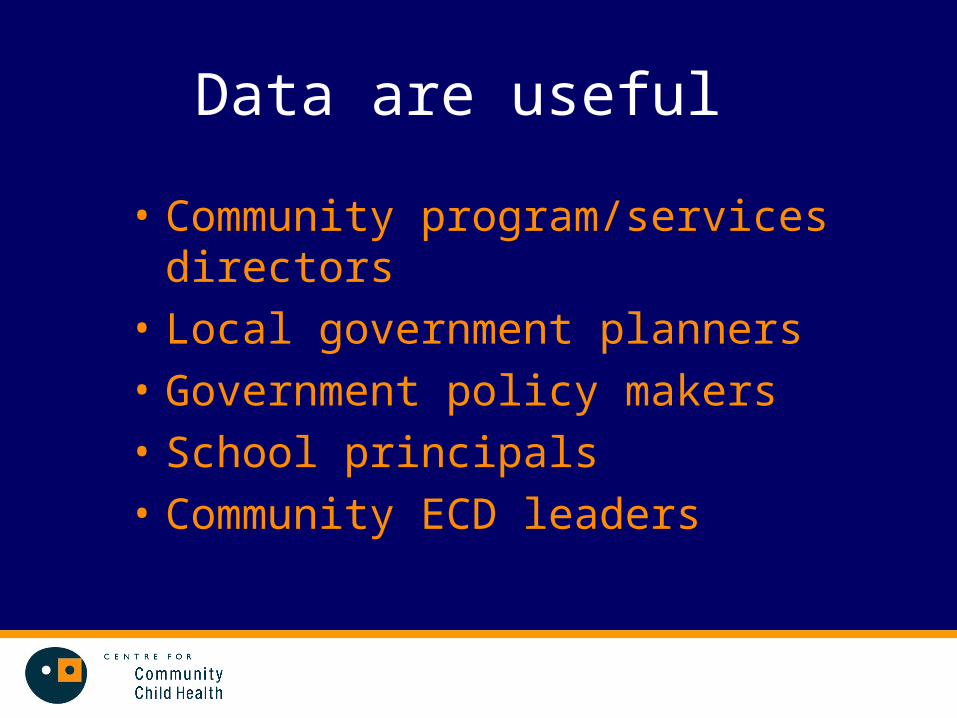
Data are useful
• Community program/services directors
• Local government planners
• Government policy makers
• School principals
• Community ECD leaders

ECD data help break down service and professional silos
‘…maps invite observers to contemplate a broad understanding of early development that transcends the boundaries of any single policy envelope…education, health,childcare, welfare or justice…’
-Hertzman (2006)

Data help create partnerships
• Interpreting and acting on the results• Asking the question why?• Community responses to results• Provides best chance of local community
ownership and sustainability (Offord)
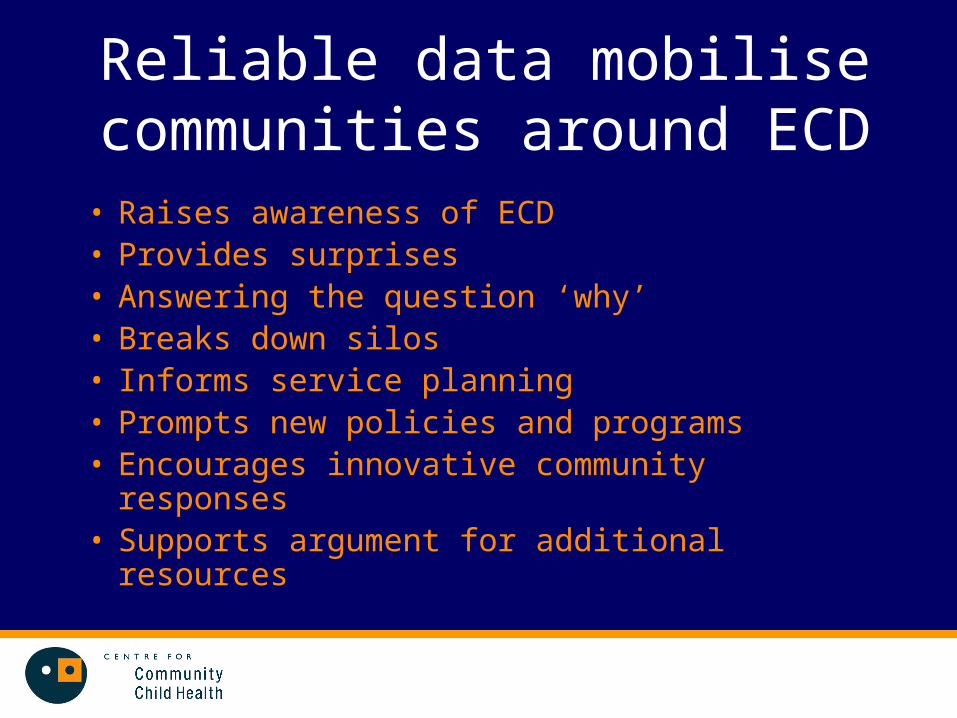
Reliable data mobilise communities around ECD
• Raises awareness of ECD• Provides surprises• Answering the question ‘why’• Breaks down silos• Informs service planning• Prompts new policies and programs• Encourages innovative community responses• Supports argument for additional resources

Data can guide community interventions
• Allows the provision of specific recommendations that can be implemented at population and community-wide level
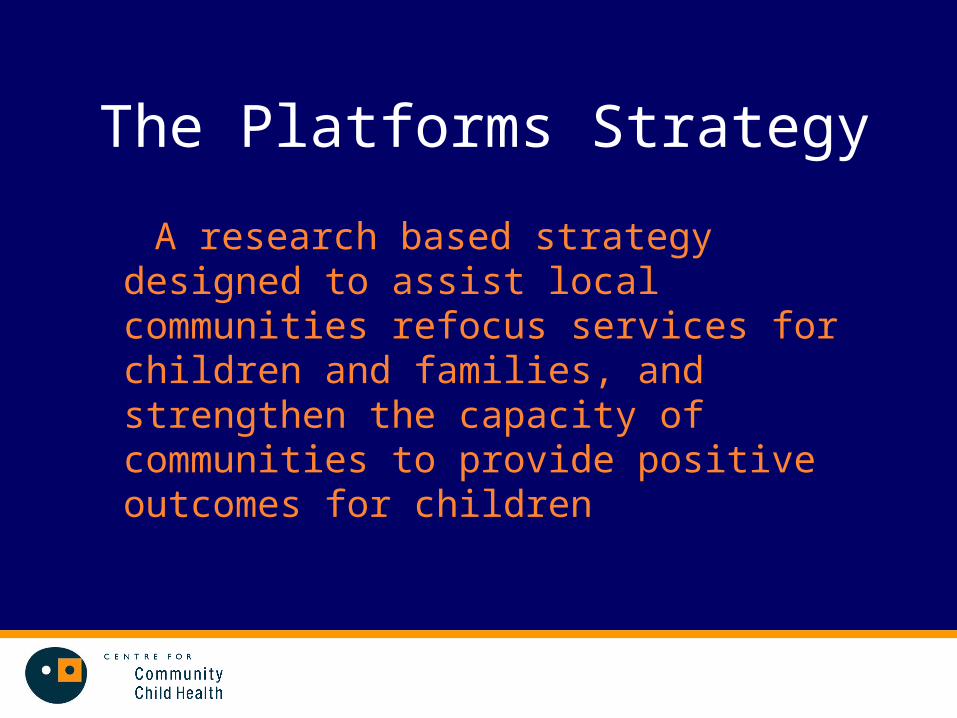
The Platforms Strategy
A research based strategy designed to assist local communities refocus services for children and families, and strengthen the capacity of communities to provide positive outcomes for children
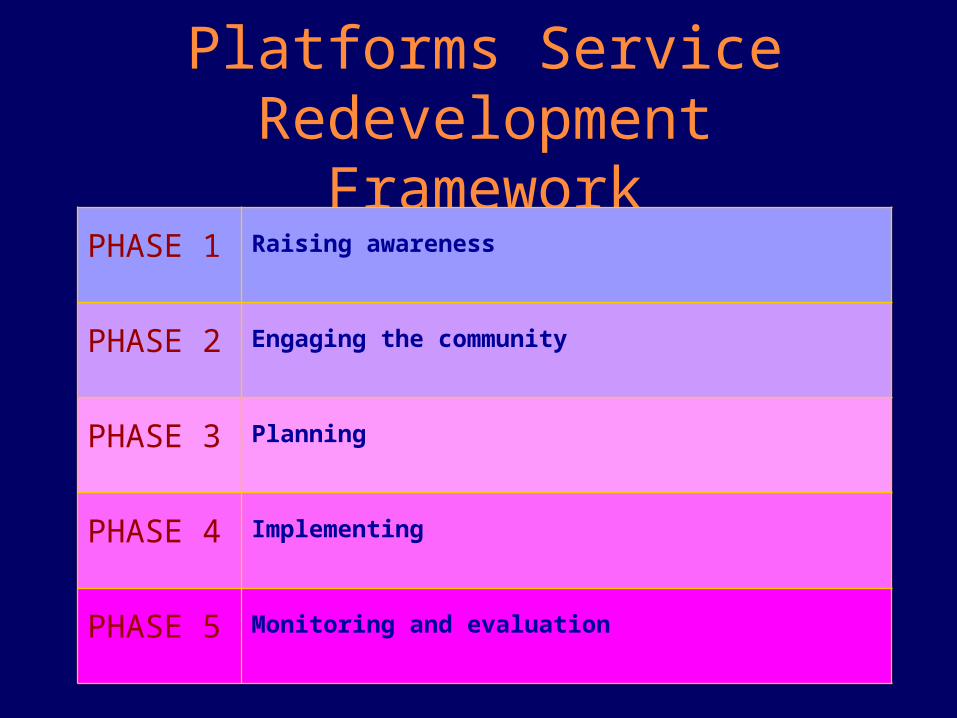
Platforms Service Redevelopment Framework
PHASE 1 Raising awareness
PHASE 2 Engaging the community
PHASE 3 Planning
PHASE 4 Implementing
PHASE 5 Monitoring and evaluation
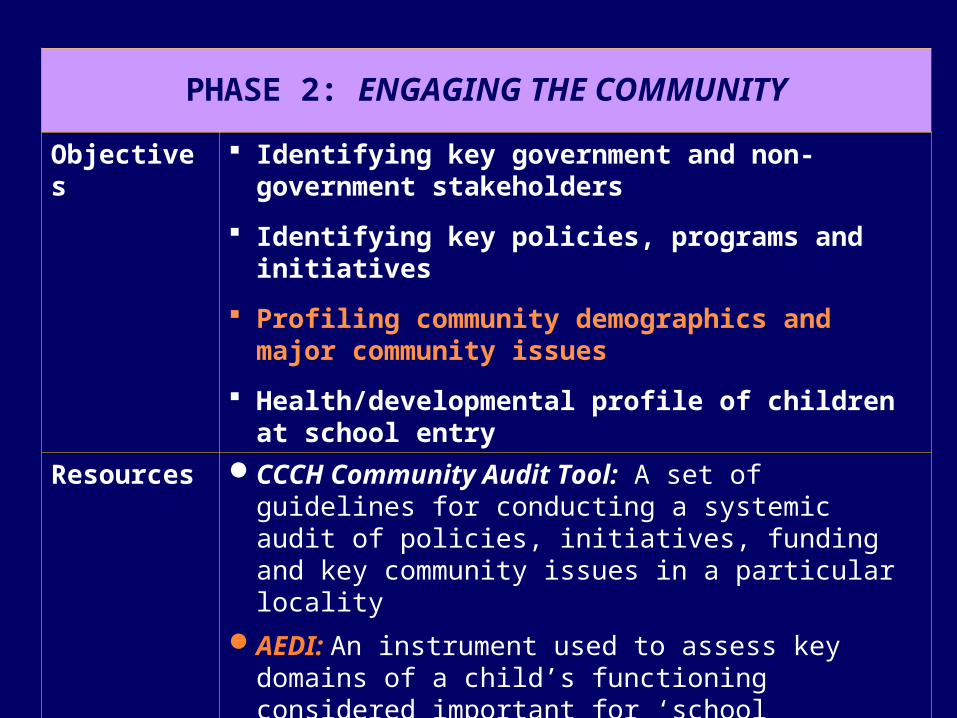
PHASE 2: ENGAGING THE COMMUNITY
Objectives Identifying key government and non-government stakeholders
Identifying key policies, programs and initiatives
Profiling community demographics and major community issues
Health/developmental profile of children at school entry
Resources CCCH Community Audit Tool: A set of guidelines for conducting a systemic audit of policies, initiatives, funding and key community issues in a particular locality
AEDI: An instrument used to assess key domains of a child’s functioning considered important for ‘school readiness’
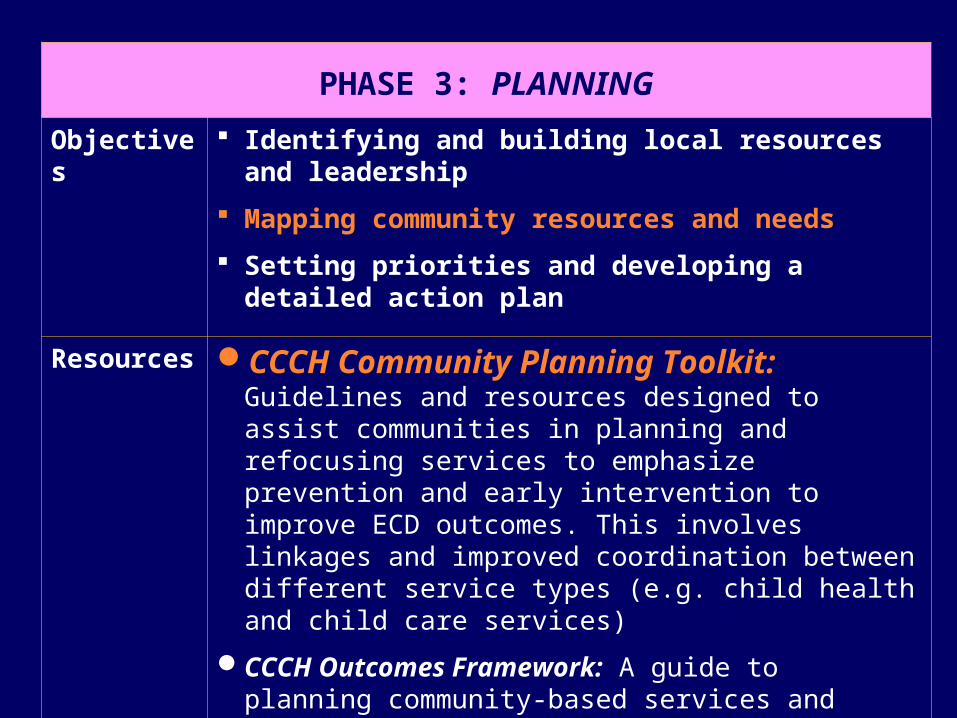
PHASE 3: PLANNING
Objectives Identifying and building local resources and leadership
Mapping community resources and needs
Setting priorities and developing a detailed action plan
Resources CCCH Community Planning Toolkit: Guidelines and resources designed to assist communities in planning and refocusing services to emphasize prevention and early intervention to improve ECD outcomes. This involves linkages and improved coordination between different service types (e.g. child health and child care services)
CCCH Outcomes Framework: A guide to planning community-based services and service systems to optimize outcomes for ECD
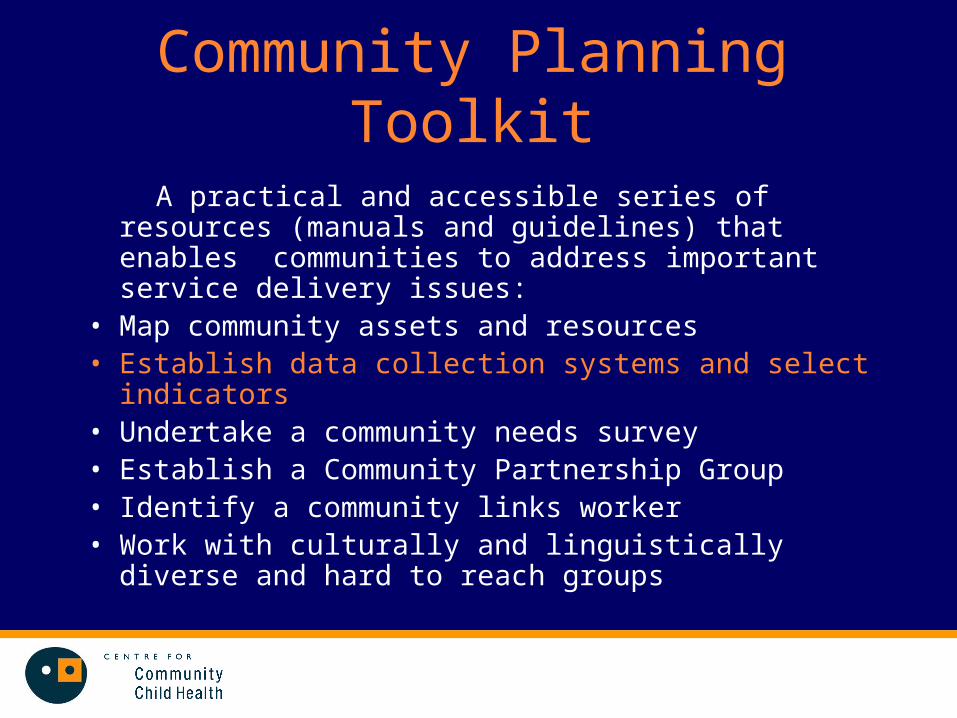
Community Planning Toolkit
A practical and accessible series of resources (manuals and guidelines) that enables communities to address important service delivery issues:
• Map community assets and resources • Establish data collection systems and select indicators• Undertake a community needs survey• Establish a Community Partnership Group • Identify a community links worker• Work with culturally and linguistically diverse and hard
to reach groups

Domains of the AEDI
• The EDI measures a child’s development in 5 areas: – physical health and well-being– social competence
– emotional maturity
– language and cognitive development
– communication skills and general knowledge

Abbreviations used:Phys Physical health and wellbeingSoc Social competenceEmo Emotional maturityLang Language and cognitive skillsCom Communication and general knowledgeVul 1 Vulnerable on one or more domainsVul 2 Vulnerable on two or more domainsNo Total number of children surveyed
AEDI Profile Summary
LOGAN BEAUDESERT, Queensland
Prepared by: AEDI National Support Centre, GIS Source: AEDI Communities Data 2007
Proportion of children developmentally
vulnerable (% ) Average Scores
(0-10)
Local community
No
Phys Soc Emo Lang Com Vul1 Vul 2
Phys Soc Emo Lang Com
Beaudesert 52 9.8 21.6 3.9 25.5 21.6 37.3 27.5 9.09 8.75 8.65 9.23 9.38
Beenleigh 96 11.4 14.8 11.4 12.5 26.1 33.0 21.6 9.55 8.33 8.43 9.40 8.13
Boronia Heights 83 15.2 48.1 13.9 22.8 29.1 59.5 34.2 7.73 5.63 7.88 9.23 5.00
Cedar Grove 46 4.3 4.3 8.7 8.7 6.5 17.4 10.9 9.55 9.17 9.23 9.42 9.38
Coomera 59 1.8 8.9 0.0 3.6 7.1 14.3 5.4 9.55 9.38 9.42 9.62 10.0
Crestmead 158 26.6 40.3 15.1 21.6 25.2 54.7 37.4 7.73 6.88 7.69 8.85 5.00
Eagleby 97 9.3 27.9 18.6 15.1 17.4 41.9 23.3 8.64 7.92 8.08 9.60 7.19
Edens Landing 69 10.1 13.0 18.8 10.1 20.3 29.0 14.5 8.64 8.33 7.88 10.0 6.25
Hope I sland 36 2.9 5.9 0.0 2.9 2.9 11.8 2.9 9.77 9.69 9.62 9.81 10.0
J imboomba 65 15.4 15.4 7.7 14.1 14.1 30.8 15.4 9.09 8.54 8.80 9.23 7.81
Kingsholme-Upper Coomera
206 6.4 13.4 7.5 6.9 7.4 22.8 11.9 9.55 9.26 8.80 9.62 9.38
Logan Reserve 21 0.0 4.8 0.0 9.5 9.5 14.3 9.5 9.55 9.79 9.42 9.62 7.50
Logan Village 81 1.3 6.3 5.1 6.3 7.6 12.7 10.1 9.50 9.38 9.23 9.62 9.38
Loganholme 66 4.8 14.5 6.5 11.3 9.7 19.4 9.7 10.0 8.33 8.85 9.62 8.75
Marsden 137 11.1 21.4 8.8 10.3 15.1 31.7 22.2 8.76 8.85 8.64 9.60 8.13
Mt Warren Park 42 7.5 5.0 2.5 7.5 10.0 22.5 7.5 9.55 9.58 9.52 9.58 10.0
Ormeau-Yatala 164 3.2 10.8 7.0 7.6 8.2 19.0 9.5 8.64 9.15 8.85 9.62 9.38
Pimpama 18 13.3 0.0 0.0 0.0 6.7 13.3 6.7 9.55 9.17 9.23 10.0 9.38
Rathdowney-Kooralbyn
19 6.7 13.3 13.3 6.7 20.0 26.7 13.3 8.64 8.96 8.27 9.62 8.13
Shailer Park 73 11.3 19.7 7.0 4.2 11.3 32.4 11.3 8.64 8.33 8.65 9.62 7.50
Tamborine 47 11.1 9.1 7.1 8.9 6.7 24.4 6.7 9.09 9.58 9.02 9.60 7.50
Tanah Merah 21 10.0 5.0 0.0 0.0 0.0 15.0 0.0 9.09 8.23 8.46 9.62 8.44
Veresdale 24 4.5 4.5 4.5 13.6 7.2 18.2 13.6 10.0 8.13 8.17 9.42 4.50
Woodridge 138 10.1 28.0 15.3 23.7 23.5 43.7 28.6 8.18 7.92 8.08 8.21 6.25

LOGAN BEAUDESERT Geographic Area,
Queensland. 60km South of Brisbane
Proportion of children vulnerable
on one or more domains
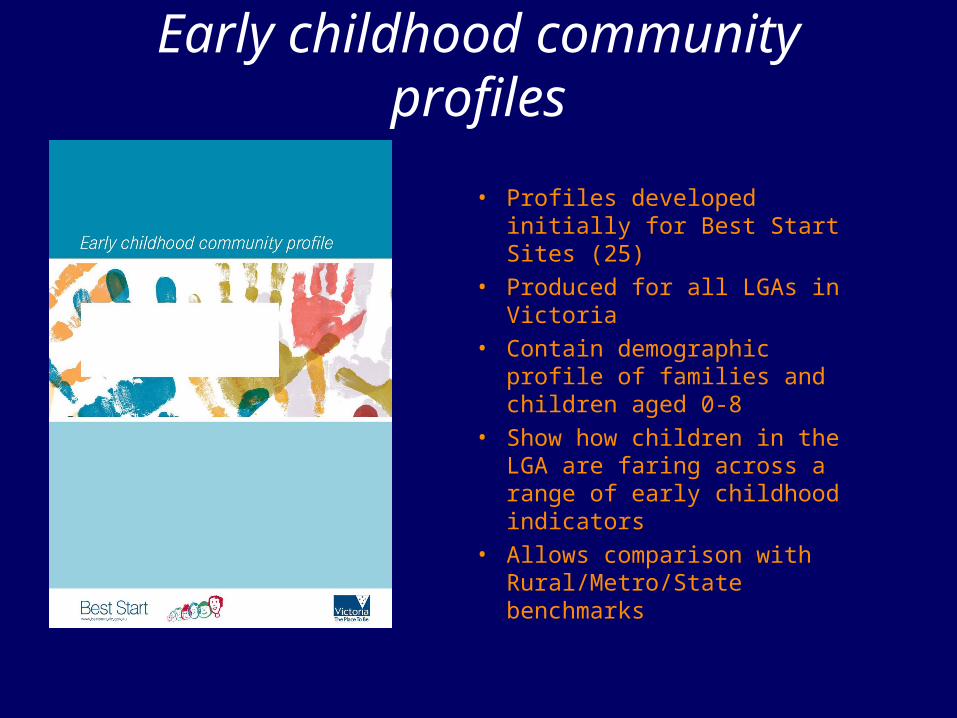
Early childhood community profiles
• Profiles developed initially for Best Start Sites (25)
• Produced for all LGAs in Victoria
• Contain demographic profile of families and children aged 0-8
• Show how children in the LGA are faring across a range of early childhood indicators
• Allows comparison with Rural/Metro/State benchmarks

Demographic Data
79.9% 83.1%
16.9%20.1%
0%
10%
20%
30%
40%
50%
60%
70%
80%
90%
Couple Families One-Parent Families
Perc
en
tag
e o
f fa
mili
es
Elsewhere (C) VictoriaSource: ABS 2001 Census
Couple and one-parent families with children 0 to 8 years in Elsewhere and Victoria

Demographic Data
MEDI AN WEEKLY I NCOME FOR FAMI LI ES WI TH CHI LDREN AGED 0 TO 8 YEARS.
Source: 2001 Census. Note: not all families reported income
•
•
•
•
Couple Families One-Parent Families
Elsewhere (C)
Victoria
$1,175 $470
$1,409 $540
Based on the 2001 Census, the median weekly income for couple families with children aged 0 to 8 in Elsewhere (C) is $1,175. This is less than the median weekly income for couple families in Victoria with children in this age-group.
Elsewhere (C) was ranked 48 out of all LGAs on the median income for couple families with children aged 0 to 8. A rank of 1 was assigned to the LGA with the highest median income.
Based on the 2001 Census, the median weekly income for one-parent families with children aged 0 to 8 in Elsewhere (C) is $470. This is less than the median weekly income for one-parent families in Victoria with children in this age-group.
Elsewhere (C) was ranked 52 out of all LGAs on the median income for one-parent families with children aged 0 to 8. A rank of 1 was assigned to the LGA with the highest median income.
Median income for families with children 0 to 8 years in Elsewhere and Victoria

Demographic Data
Elsewhere (C)
Source: 2001 Census Note: not all families report education information
Couple families where the highest school qualification of both parents is
less than Year 12 or equivalent
One-parent families where the highest school qualification of parent is less
than Year 12 or equivalent
FAMI LI ES WI TH CHI LDREN AGED 0 TO 8 I N ELSEWHERE (C) WHERE NO PARENT HAS COMPLETED YEAR 12.
Number Percent Number Percent
1,572 44.0% 635 70.6%
60.6%Victoria 85,385 30.5% 34,524
Elsewhere (C)
Source: 2001 Census Note: Not all families report education information
*Non-school qualifications include Diploma level, Advance Diploma level, Bachelor Degree and Postgraduate level.
FAMI LI ES WI TH CHI LDREN AGED 0 TO 8 I N ELSEWHERE (C) WHERE PARENT(S) HAVE A NON-SCHOOL QUALI FI CATI ON.*
Couple families where both parents have a non-school qualification
One-parent families where parent has a non-school qualification
Number Percent Number Percent
310 8.7% 164 18.2%
25.9%Victoria 51,234 18.3% 14,768
Parental education for families with children 0 to 8 years in Elsewhere and Victoria

Breastfeeding rates in Elsewhere
Number % Number % Number % Number %
840 369 43.9% 290 34.5% 779 355 45.6% 258 33.1%
45,159 23,623 52.3% 17,414 38.6% 46,114 23,330 50.6% 17,209 37.3%
16,511 8,453 51.2% 6,501 39.4% 16,605 8,381 50.5% 6,538 39.4%
Number % Number % Number % Number %
809 371 45.9% 281 34.7% 789 366 46.4% 260 33.0%
46,560 23,619 50.7% 17,854 38.3% 48,026 22,819 47.5% 17,300 36.0%
16,724 8,325 49.8% 6,328 37.8% 16,555 8,509 51.4% 6,611 39.9%
Elsewhere (C)
Metropolitan Victoria
Rural Victoria
CHI LDREN FULLY BREASTFED AT 3 MONTHS AND 6 MONTHS I N ELSEWHERE (C).
Rural Victoria
2003 - 2004 2004 - 2005
Infant Record Cards
At 3 Months At 6 MonthsInfant Record Cards
At 3 Months At 6 Months
2002 - 2003
Metropolitan Victoria
Elsewhere (C)
At 3 Months At 6 MonthsInfant Record Cards
Infant Record Cards
At 3 Months At 6 Months
2001 - 2002
Elsewhere (C) was ranked 62 out of 78 LGAs on the percentage of infants fully breastfed at 3 months. A rank of 1 was assigned to the LGA with the highest percentage of infants fully breastfed.
Elsewhere (C) was ranked 67 out of 78 LGAs on the percentage of infants fully breastfed at 6 months. A rank of 1 was assigned to the LGA with the highest percentage of infants fully breastfed.
Based on 2004-05
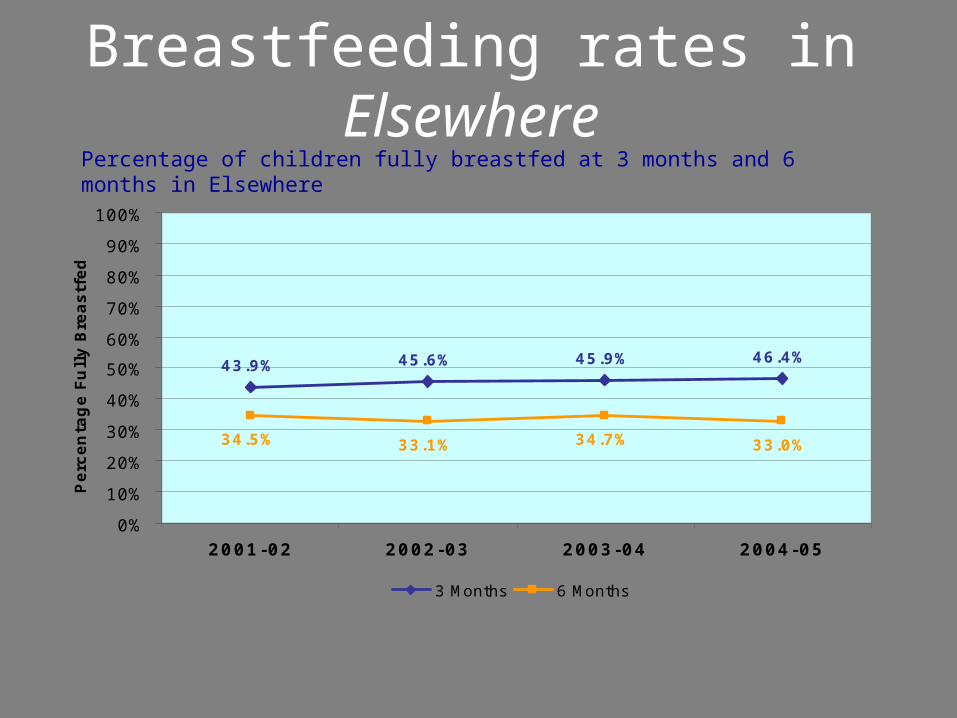
Breastfeeding rates in Elsewhere
43.9% 45.6% 45.9% 46.4%
34.5% 33.1% 34.7% 33.0%
0%
10%
20%
30%
40%
50%
60%
70%
80%
90%
100%
2001-02 2002-03 2003-04 2004-05
Perc
en
tag
e F
ull
y B
reastf
ed
3 Months 6 Months
Percentage of children fully breastfed at 3 months and 6 months in Elsewhere
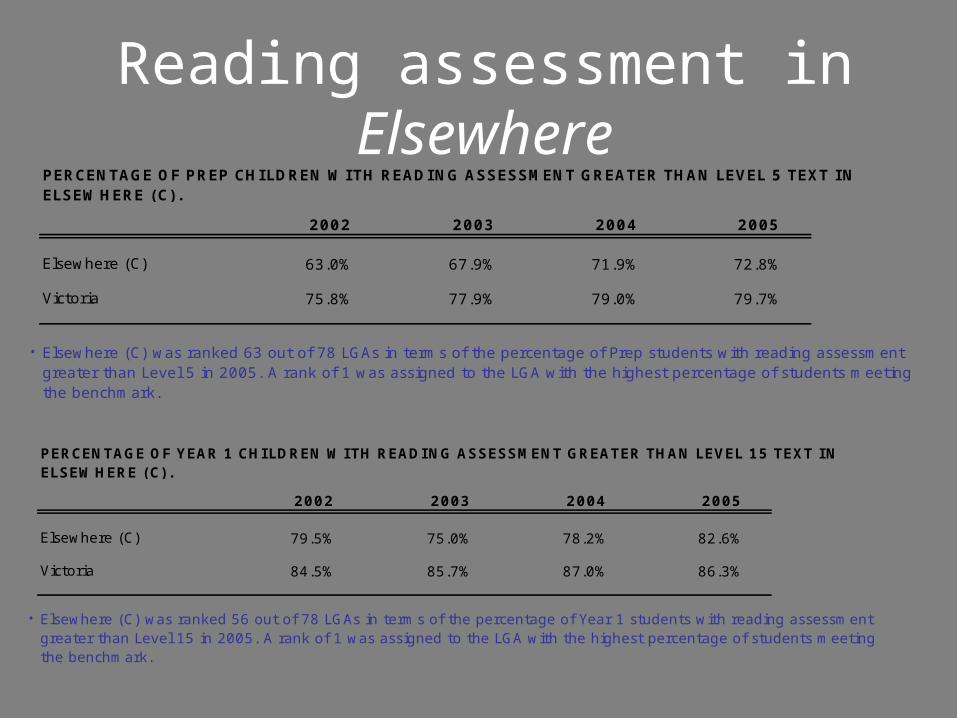
Reading assessment in Elsewhere
2002 2003 2004 2005
63.0% 67.9% 71.9% 72.8%
75.8% 77.9% 79.0% 79.7%
•
Elsewhere (C)
Victoria
PERCENTAGE OF PREP CHI LDREN WI TH READI NG ASSESSMENT GREATER THAN LEVEL 5 TEXT I N ELSEWHERE (C).
Elsewhere (C) was ranked 63 out of 78 LGAs in terms of the percentage of Prep students with reading assessment greater than Level 5 in 2005. A rank of 1 was assigned to the LGA with the highest percentage of students meeting the benchmark.
2002 2003 2004 2005
79.5% 75.0% 78.2% 82.6%
84.5% 85.7% 87.0% 86.3%
•
Elsewhere (C)
Victoria
Elsewhere (C) was ranked 56 out of 78 LGAs in terms of the percentage of Year 1 students with reading assessment greater than Level 15 in 2005. A rank of 1 was assigned to the LGA with the highest percentage of students meeting the benchmark.
PERCENTAGE OF YEAR 1 CHI LDREN WI TH READI NG ASSESSMENT GREATER THAN LEVEL 15 TEXT I N ELSEWHERE (C).
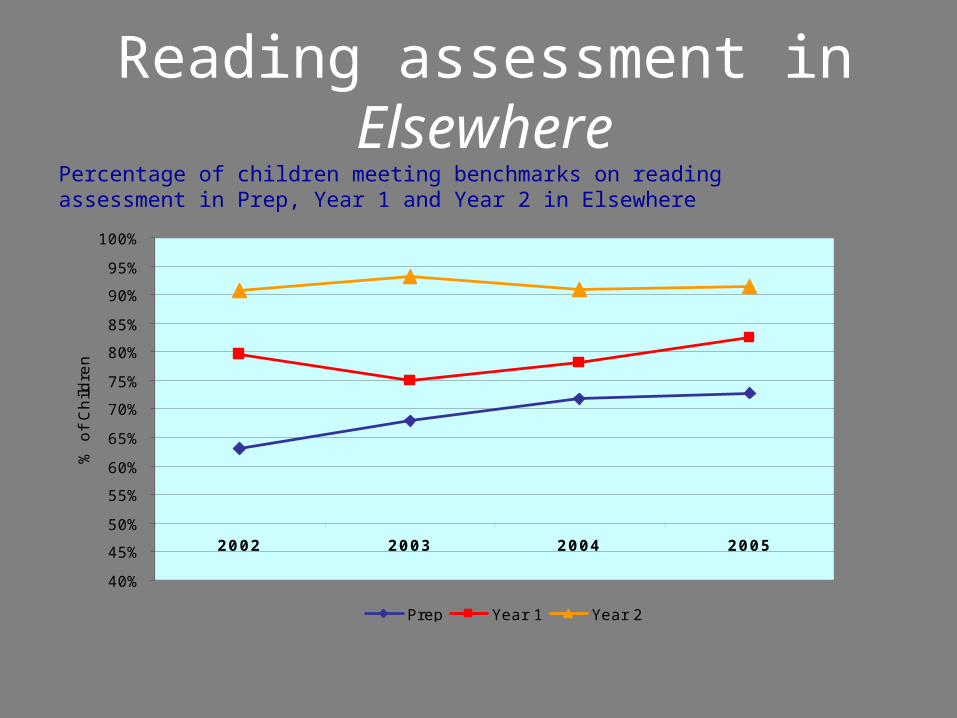
Reading assessment in Elsewhere
40%
45%
50%
55%
60%
65%
70%
75%
80%
85%
90%
95%
100%
2002 2003 2004 2005
% o
f C
hild
ren
Prep Year 1 Year 2
Percentage of children meeting benchmarks on reading assessment in Prep, Year 1 and Year 2 in Elsewhere
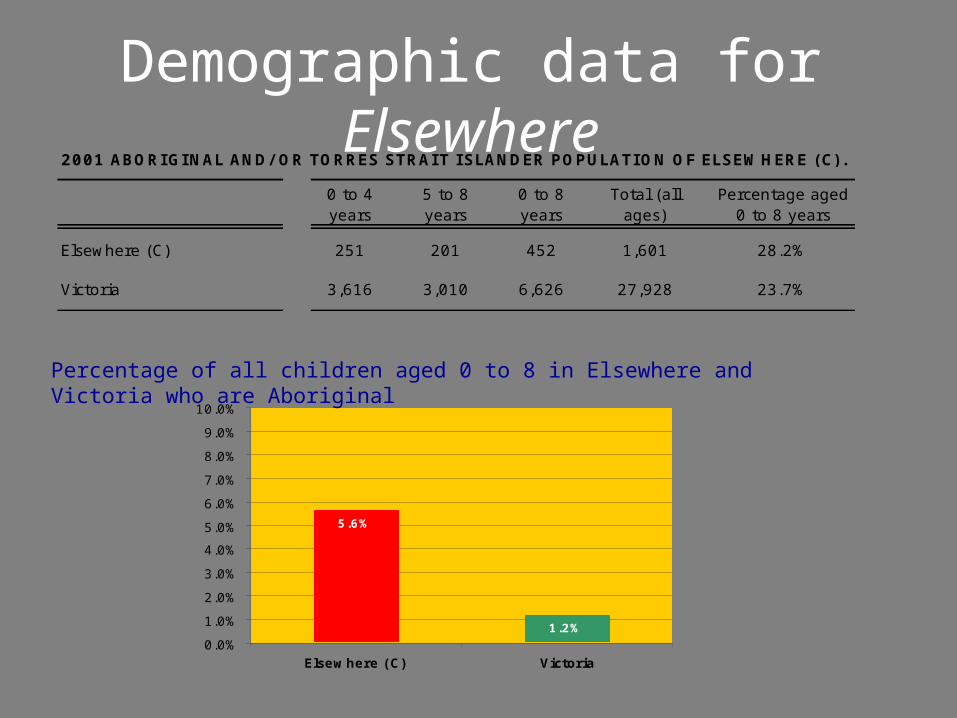
Demographic data for Elsewhere
2001 ABORI GI NAL AND/ OR TORRES STRAI T I SLANDER POPULATI ON OF ELSEWHERE (C).
0 to 4 years
5 to 8 years
0 to 8 years
Total (all ages)
Percentage aged 0 to 8 years
Elsewhere (C) 251 201 452 1,601 28.2%
Victoria 3,616 3,010 6,626 27,928 23.7%
5.6%
1.2%0.0%
1.0%
2.0%
3.0%
4.0%
5.0%
6.0%
7.0%
8.0%
9.0%
10.0%
Elsewhere (C) Victoria
Percentage of all children aged 0 to 8 in Elsewhere and Victoria who are Aboriginal

Teen births in ElsewhereTHE NUMBER OF BI RTHS TO TEENAGERS I N ELSEWHERE (C), 2002 TO 2005.
29 86 178 1,999
330 1,376 6,992 161,833
Elsewhere (C)
Victoria
Aboriginal Teen Births Total Teen Births
Number of births to females aged
15 to 19
Estimated population aged 15 to 19 years
Number of births to females aged
15 to 19
Estimated population aged 15 to 19 years
337.2
239.8
89.0
43.20.0
50.0
100.0
150.0
200.0
250.0
300.0
350.0
400.0
Elsewhere (C) Victoria
Rate
per
10
00
fem
ale
s
Aboriginalbirths
All births
The rate of births per 1000 females aged 15 to 19 in Elsewhere and Victoria
Note: births data pooled for 4 years, single year population denominator
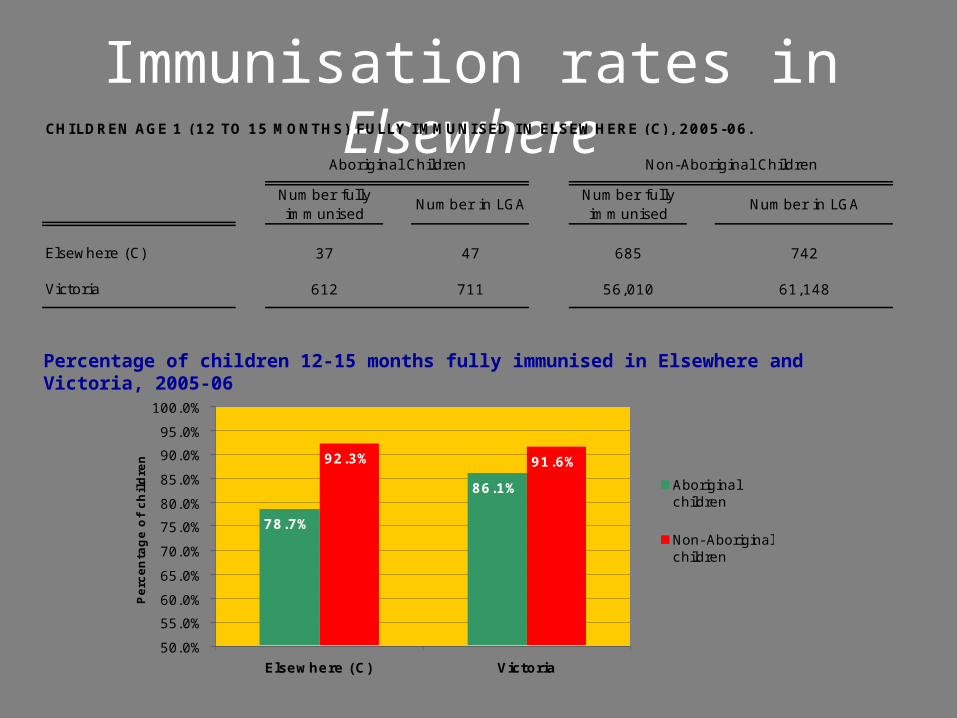
Immunisation rates in ElsewhereCHI LDREN AGE 1 (12 TO 15 MONTHS) FULLY I MMUNI SED I N ELSEWHERE (C), 2005-06.
37 47 685 742
612 711 56,010 61,148Victoria
Aboriginal Children Non-Aboriginal Children
Number fully immunised
Number in LGANumber fully immunised
Number in LGA
Elsewhere (C)
78.7%
86.1%
92.3% 91.6%
50.0%
55.0%
60.0%
65.0%
70.0%
75.0%
80.0%
85.0%
90.0%
95.0%
100.0%
Elsewhere (C) Victoria
Perc
en
tag
e o
f ch
ild
ren
Aboriginalchildren
Non- Aboriginalchildren
Percentage of children 12-15 months fully immunised in Elsewhere and Victoria, 2005-06

Child protection substantiations in Elsewhere
54 452 208 8,047
1,024 6,626 8,633 572,226
Total Substantiations
Estimated population aged 0
to 8 years
Elsewhere (C)
Victoria
Estimated population aged
0 to 8 years
Number of Substantiations
Aboriginal Substantiations
Number of Substantiations
THE NUMBER OF CHILD PROTECTION SUBSTANTIATIONS FOR CHILDREN AGED 0 TO 8 IN ELSEWHERE (C), 2003-05 (POOLED).
119.5
154.5
25.815.1
0.0
20.0
40.0
60.0
80.0
100.0
120.0
140.0
160.0
180.0
Elsewhere (C) Victoria
Rate
per
10
00
ch
ild
ren
Aboriginalchildren
All children
Rate of child protection substantiations per 1000 children aged 0 to 8 in Elsewhere and Victoria, 2003-005
Note: child protection data pooled for 2 years, single year population denominator


‘Nothing hard is ever easy’
Don Berwick - 1998
“The way in which the world is imagined determines at any particular moment what men will do.”
- Walter Lippmann, Public Opinion, 1921