
USING COMPLEXITY, COUPLING, AND COHESION METRICS AS EARLY
104
USING COMPLEXITY, COUPLING, AND COHESION METRICS AS EARLY INDICATORS OF VULNERABILITIES by Istehad Chowdhury A thesis submitted to the Department of Electrical and Computer Engineering in conformity with the requirements for the degree of Masters of Science in Engineering Queen’s University Kingston, Ontario, Canada (September 2009) Copyright © Istehad Chowdhury, 2009
Transcript of USING COMPLEXITY, COUPLING, AND COHESION METRICS AS EARLY

USING COMPLEXITY, COUPLING, AND COHESION METRICS
AS EARLY INDICATORS OF VULNERABILITIES
by
Istehad Chowdhury
A thesis submitted to the Department of Electrical and Computer Engineering
in conformity with the requirements for
the degree of Masters of Science in Engineering
Queen’s University
Kingston, Ontario, Canada
(September 2009)
Copyright © Istehad Chowdhury, 2009
ii
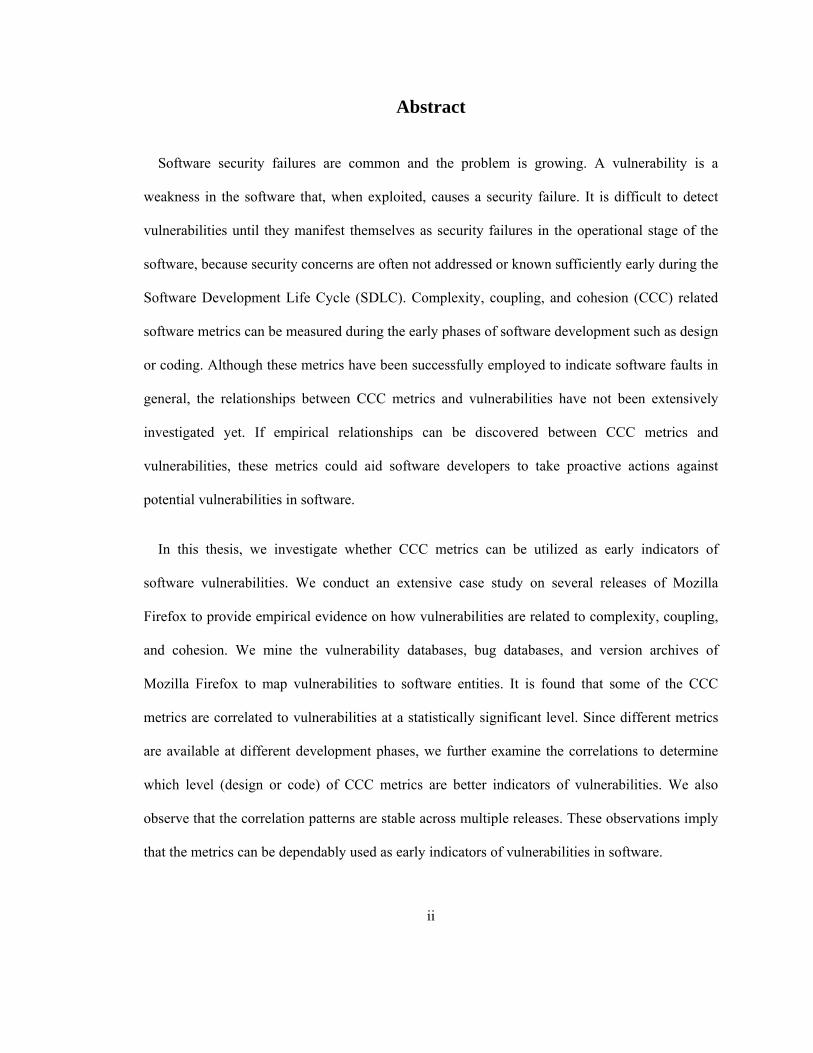
Abstract
Software security failures are common and the problem is growing. A vulnerability is a
weakness in the software that, when exploited, causes a security failure. It is difficult to detect
vulnerabilities until they manifest themselves as security failures in the operational stage of the
software, because security concerns are often not addressed or known sufficiently early during the
Software Development Life Cycle (SDLC). Complexity, coupling, and cohesion (CCC) related
software metrics can be measured during the early phases of software development such as design
or coding. Although these metrics have been successfully employed to indicate software faults in
general, the relationships between CCC metrics and vulnerabilities have not been extensively
investigated yet. If empirical relationships can be discovered between CCC metrics and
vulnerabilities, these metrics could aid software developers to take proactive actions against
potential vulnerabilities in software.
In this thesis, we investigate whether CCC metrics can be utilized as early indicators of
software vulnerabilities. We conduct an extensive case study on several releases of Mozilla
Firefox to provide empirical evidence on how vulnerabilities are related to complexity, coupling,
and cohesion. We mine the vulnerability databases, bug databases, and version archives of
Mozilla Firefox to map vulnerabilities to software entities. It is found that some of the CCC
metrics are correlated to vulnerabilities at a statistically significant level. Since different metrics
are available at different development phases, we further examine the correlations to determine
which level (design or code) of CCC metrics are better indicators of vulnerabilities. We also
observe that the correlation patterns are stable across multiple releases. These observations imply
that the metrics can be dependably used as early indicators of vulnerabilities in software.

iii
We then present a framework to automatically predict vulnerabilities based on CCC metrics.
To build vulnerability predictors, we consider four alternative data mining and statistical
techniques – C4.5 Decision Tree, Random Forests, Logistic Regression, and Naïve-Bayes – and
compare their prediction performances. We are able to predict majority of the vulnerability-prone
files in Mozilla Firefox, with tolerable false positive rates. Moreover, the predictors built from the
past releases can reliably predict the likelihood of having vulnerabilities in future releases. The
experimental results indicate that structural information from the non-security realm such as
complexity, coupling, and cohesion are useful in vulnerability prediction.

iv
Acknowledgements
First of all, I would like to express my gratitude to my supervisor, Dr. Mohammad Zulkernie,
for his all round guidance and advice during my M.Sc. studies. Without his supervision, this
thesis would still be half-baked. His advice often proved helpful beyond my academic life.
I would like to thank Dr. Ahmed E. Hassan and Dr. Ying Zou as the knowledge gained from
their courses helped me to pursue this research topic. I also thank all the members of Queen’s
Reliable Software Technology (QRST) research group for a great time working together and for
numerous thoughtful discussions.
I am grateful to my brother, Imtiaz Chowdhury, and sister-in-law, Syeda Leeza, for their love
and support during the last two years of my stay in Canada. I am indebted to my sister-in-law for
sending delicious food consignments all the way from Toronto to Kingston and making sure that I
do not have many things to worry about other than research. I am also grateful to my loving
parents and sister for staying in constant touch from across the globe and not asking me to visit
them during my M.Sc. study. Thanks to all the great friends in Kingston who accompanied me
during the random escapes from studies.
This research is partially funded by the Natural Sciences and Engineering Research Council of
Canada (NSERC). I thank Stephan Neuhaus of Saarland University, Saarbrücken, Germany for
sharing his dataset on vulnerabilities in Mozilla Firefox and for his suggestions on how to obtain
an updated dataset. I also thank Yonghee Shin of North Carolina State University, USA for taking
the time to answer our queries about her technique of extracting vulnerability data from Mozilla
archives. Moreover, I thank Mr. Shahriar Khan of Queen’s University for his comments on the
statistical analysis.

v
I would like to acknowledge Scientific Toolworks, Inc. at St. George, UT, USA for their
generous four-month extension of the trial license of Understand 2.0, the tool used to
automatically computing the metrics.

vi
Statement of Originality
I hereby certify that all of the work described within this thesis is the original work of the author.
Any published (or unpublished) ideas and/or techniques from the work of others are fully
acknowledged in accordance with the standard referencing practices.
Istehad Chowdhury
September, 2009
vii
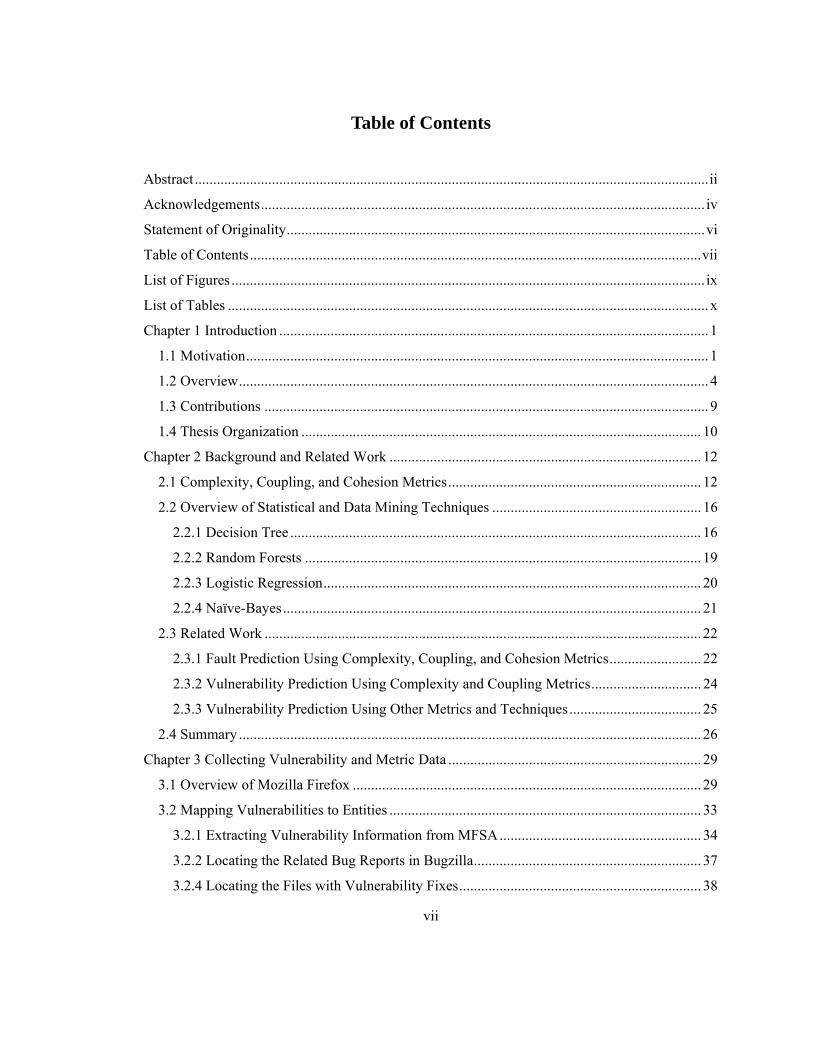
Table of Contents
Abstract ............................................................................................................................................ ii
Acknowledgements ......................................................................................................................... iv
Statement of Originality .................................................................................................................. vi
Table of Contents ........................................................................................................................... vii
List of Figures ................................................................................................................................. ix
List of Tables ................................................................................................................................... x
Chapter 1 Introduction ..................................................................................................................... 1
1.1 Motivation .............................................................................................................................. 1
1.2 Overview ................................................................................................................................ 4
1.3 Contributions ......................................................................................................................... 9
1.4 Thesis Organization ............................................................................................................. 10
Chapter 2 Background and Related Work ..................................................................................... 12
2.1 Complexity, Coupling, and Cohesion Metrics ..................................................................... 12
2.2 Overview of Statistical and Data Mining Techniques ......................................................... 16
2.2.1 Decision Tree ................................................................................................................ 16
2.2.2 Random Forests ............................................................................................................ 19
2.2.3 Logistic Regression ....................................................................................................... 20
2.2.4 Naïve-Bayes .................................................................................................................. 21
2.3 Related Work ....................................................................................................................... 22
2.3.1 Fault Prediction Using Complexity, Coupling, and Cohesion Metrics ......................... 22
2.3.2 Vulnerability Prediction Using Complexity and Coupling Metrics .............................. 24
2.3.3 Vulnerability Prediction Using Other Metrics and Techniques .................................... 25
2.4 Summary .............................................................................................................................. 26
Chapter 3 Collecting Vulnerability and Metric Data ..................................................................... 29
3.1 Overview of Mozilla Firefox ............................................................................................... 29
3.2 Mapping Vulnerabilities to Entities ..................................................................................... 33
3.2.1 Extracting Vulnerability Information from MFSA ....................................................... 34
3.2.2 Locating the Related Bug Reports in Bugzilla .............................................................. 37
3.2.4 Locating the Files with Vulnerability Fixes .................................................................. 38
viii
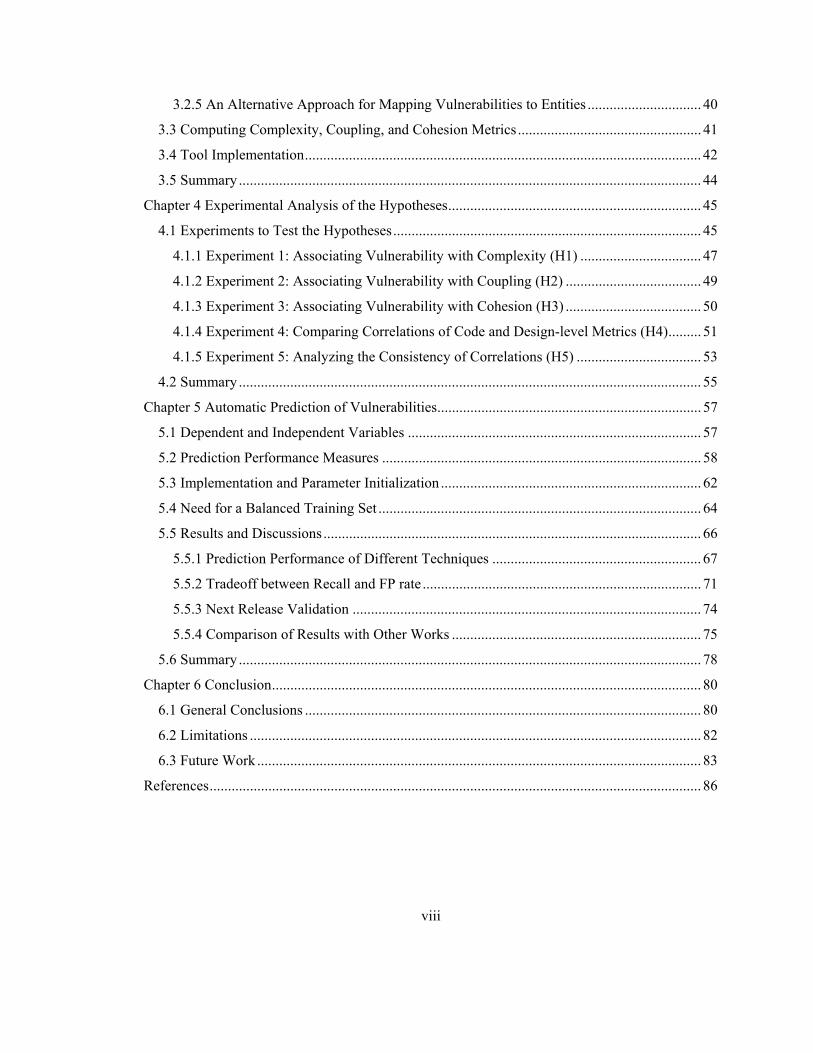
3.2.5 An Alternative Approach for Mapping Vulnerabilities to Entities ............................... 40
3.3 Computing Complexity, Coupling, and Cohesion Metrics .................................................. 41
3.4 Tool Implementation ............................................................................................................ 42
3.5 Summary .............................................................................................................................. 44
Chapter 4 Experimental Analysis of the Hypotheses ..................................................................... 45
4.1 Experiments to Test the Hypotheses .................................................................................... 45
4.1.1 Experiment 1: Associating Vulnerability with Complexity (H1) ................................. 47
4.1.2 Experiment 2: Associating Vulnerability with Coupling (H2) ..................................... 49
4.1.3 Experiment 3: Associating Vulnerability with Cohesion (H3) ..................................... 50
4.1.4 Experiment 4: Comparing Correlations of Code and Design-level Metrics (H4) ......... 51
4.1.5 Experiment 5: Analyzing the Consistency of Correlations (H5) .................................. 53
4.2 Summary .............................................................................................................................. 55
Chapter 5 Automatic Prediction of Vulnerabilities ........................................................................ 57
5.1 Dependent and Independent Variables ................................................................................ 57
5.2 Prediction Performance Measures ....................................................................................... 58
5.3 Implementation and Parameter Initialization ....................................................................... 62
5.4 Need for a Balanced Training Set ........................................................................................ 64
5.5 Results and Discussions ....................................................................................................... 66
5.5.1 Prediction Performance of Different Techniques ......................................................... 67
5.5.2 Tradeoff between Recall and FP rate ............................................................................ 71
5.5.3 Next Release Validation ............................................................................................... 74
5.5.4 Comparison of Results with Other Works .................................................................... 75
5.6 Summary .............................................................................................................................. 78
Chapter 6 Conclusion ..................................................................................................................... 80
6.1 General Conclusions ............................................................................................................ 80
6.2 Limitations ........................................................................................................................... 82
6.3 Future Work ......................................................................................................................... 83
References ...................................................................................................................................... 86
ix
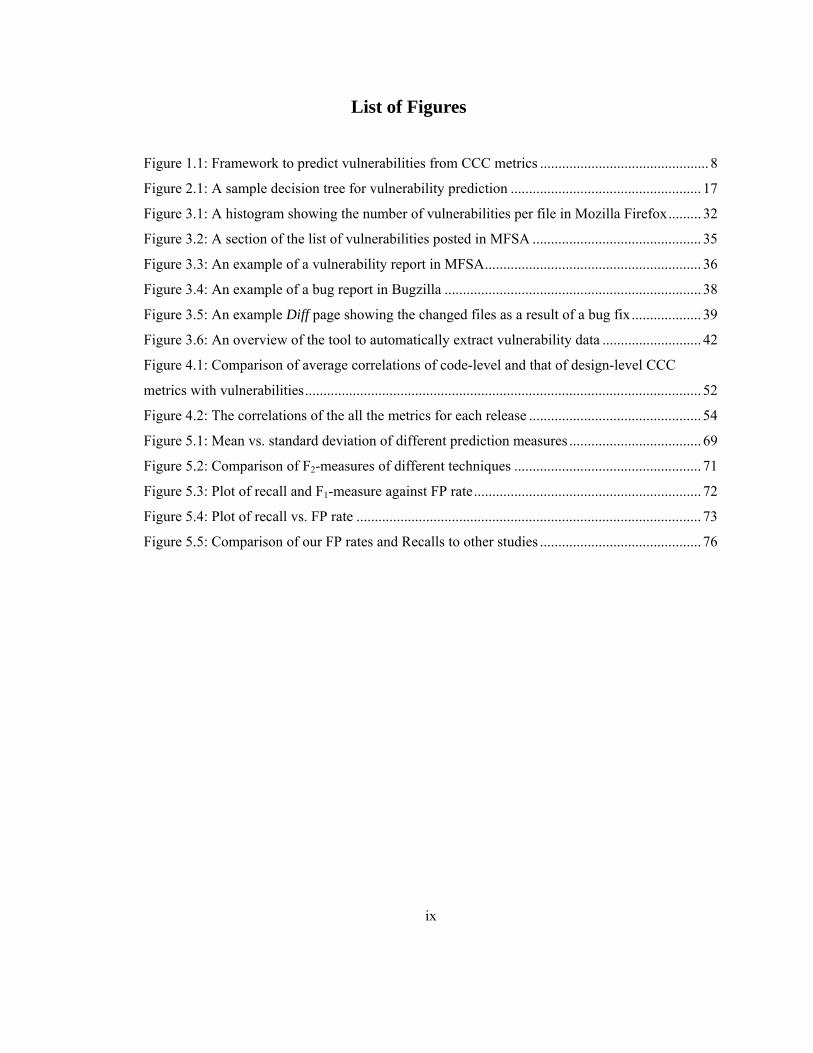
List of Figures
Figure 1.1: Framework to predict vulnerabilities from CCC metrics .............................................. 8
Figure 2.1: A sample decision tree for vulnerability prediction .................................................... 17
Figure 3.1: A histogram showing the number of vulnerabilities per file in Mozilla Firefox ......... 32
Figure 3.2: A section of the list of vulnerabilities posted in MFSA .............................................. 35
Figure 3.3: An example of a vulnerability report in MFSA ........................................................... 36
Figure 3.4: An example of a bug report in Bugzilla ...................................................................... 38
Figure 3.5: An example Diff page showing the changed files as a result of a bug fix ................... 39
Figure 3.6: An overview of the tool to automatically extract vulnerability data ........................... 42
Figure 4.1: Comparison of average correlations of code-level and that of design-level CCC
metrics with vulnerabilities ............................................................................................................ 52
Figure 4.2: The correlations of the all the metrics for each release ............................................... 54
Figure 5.1: Mean vs. standard deviation of different prediction measures .................................... 69
Figure 5.2: Comparison of F2-measures of different techniques ................................................... 71
Figure 5.3: Plot of recall and F1-measure against FP rate .............................................................. 72
Figure 5.4: Plot of recall vs. FP rate .............................................................................................. 73
Figure 5.5: Comparison of our FP rates and Recalls to other studies ............................................ 76
x
List of Tables
Table 1.1: Hypotheses ...................................................................................................................... 4
Table 2.1: CCC metrics that are hypothesized to indicate vulnerabilities ..................................... 13
Table 4.1: Information about different Mozilla Firefox releases ................................................... 47
Table 4.2: Correlations between complexity metrics and vulnerabilities ...................................... 48
Table 4.3: Correlations between coupling metrics and vulnerabilities .......................................... 50
Table 4.4: Correlations between the lack of cohesion metric and vulnerabilities .......................... 51
Table 5.1: Confusion matrix .......................................................................................................... 59
Table 5.2: Performance of a biased predictor built from imbalanced data set ............................... 65
Table 5.3: Prediction performance of different techniques ............................................................ 68
Table 5.4: Prediction performance of DT in next release validation ............................................. 75
Table 5.5: Vulnerability prediction results of other studies ........................................................... 76

1
Chapter 1
Introduction
1.1 Motivation
There is an increasing number of critical processes supported by software systems in the
modern world. Think of the current prevalence of air-traffic control and online banking. When
combined with the growing dependence of valuable assets (including human health and wealth, or
even human lives) on the security and dependability of computer support for these processes, we
see that secure software is a core requirement of the modern world. Unfortunately, there is an
escalating number of incidences of software security failures. A security failure is a violation or
deviation from the security policy, and a security policy is “a statement of what is, and what is
not, allowed as far as security is concerned” [8]. WhiteHat Security Inc. found that nine out of ten
websites had at least one security failure when they conducted a security assessment of over 600
public-facing and pre-production websites between January 1, 2006 and February 22, 2008 [28].
The number of security-related software failures reported to the Computer Emergency Response
Team Coordination Center (CERT/CC) has increased five-fold over the past seven years [17].
Security failures in a software system are the mishaps we wish to avoid, but they could not
occur without the presence of vulnerabilities in the underlying software. “A vulnerability is an
instance of a fault in the specification, development, or configuration of software such that its
execution can violate an implicit or explicit security policy” [65]. A fault is an accidental
condition that, when executed, may cause a functional unit to fail to perform its required or
expected function [32, 52]. We use the term ‘fault’ to denote any software fault or defect, and
reserve vulnerability for those exploitable faults which might lead to a security failure. An

Chapter 1. Introduction 2
example of a vulnerability can be improper or insufficient input validation which can lead to a
security failure such as an unauthorized access into a software system.
Vulnerabilities are generally introduced during the development of software. However, it is
difficult to detect vulnerabilities until they manifest themselves as security failures in the
operational stage of the software, because security concerns are not always addressed or known
sufficiently early during the Software Development Life Cycle (SDLC). Therefore, it would be
very useful to know the characteristics of software artifacts that can indicate post-release
vulnerabilities – vulnerabilities that are uncovered by at least one security failure during the
operational phase of the software. Such indications can help software managers and developers
take proactive action against potential vulnerabilities. For our work, we use the term
‘vulnerability’ to denote post-release vulnerabilities only.
Software metrics are often used to assess the ability of software to achieve a predefined goal
[36]. A software metric is a measure of some property of a piece of software. Complexity,
coupling, and cohesion (CCC) can be measured during various software development phases
(such as design or coding) and are used to evaluate the quality of software [25]. The term
software complexity is often applied to the interaction between a program and a programmer
working on some programming task [37]. In this context, complexity measures typically depend
on program size and control structure, among many other factors. High complexity hinders
program comprehension [37]. Coupling refers to the level of interconnection and dependency
between software entities. A goal in software development is to have a low coupling: a
relationship in which one entity interacts with another entity through a stable interface and does
not need to be concerned with the other module's internal implementation. Systems that do not
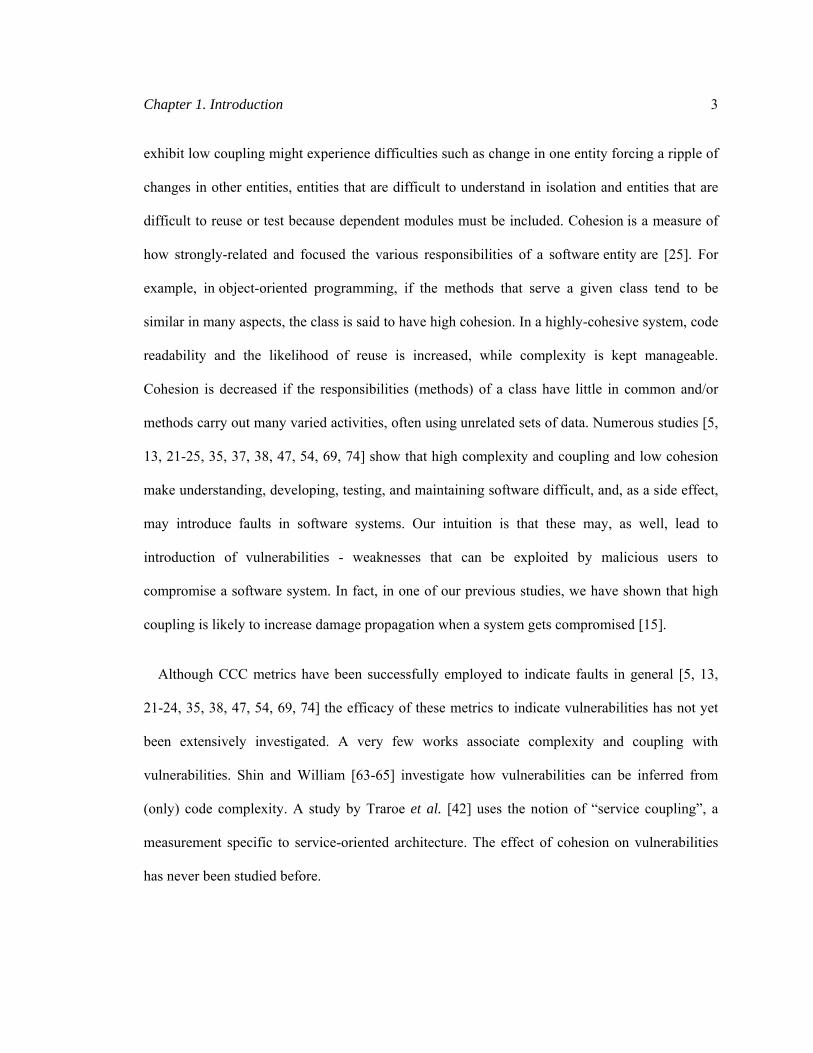
Chapter 1. Introduction 3
exhibit low coupling might experience difficulties such as change in one entity forcing a ripple of
changes in other entities, entities that are difficult to understand in isolation and entities that are
difficult to reuse or test because dependent modules must be included. Cohesion is a measure of
how strongly-related and focused the various responsibilities of a software entity are [25]. For
example, in object-oriented programming, if the methods that serve a given class tend to be
similar in many aspects, the class is said to have high cohesion. In a highly-cohesive system, code
readability and the likelihood of reuse is increased, while complexity is kept manageable.
Cohesion is decreased if the responsibilities (methods) of a class have little in common and/or
methods carry out many varied activities, often using unrelated sets of data. Numerous studies [5,
13, 21-25, 35, 37, 38, 47, 54, 69, 74] show that high complexity and coupling and low cohesion
make understanding, developing, testing, and maintaining software difficult, and, as a side effect,
may introduce faults in software systems. Our intuition is that these may, as well, lead to
introduction of vulnerabilities - weaknesses that can be exploited by malicious users to
compromise a software system. In fact, in one of our previous studies, we have shown that high
coupling is likely to increase damage propagation when a system gets compromised [15].
Although CCC metrics have been successfully employed to indicate faults in general [5, 13,
21-24, 35, 38, 47, 54, 69, 74] the efficacy of these metrics to indicate vulnerabilities has not yet
been extensively investigated. A very few works associate complexity and coupling with
vulnerabilities. Shin and William [63-65] investigate how vulnerabilities can be inferred from
(only) code complexity. A study by Traroe et al. [42] uses the notion of “service coupling”, a
measurement specific to service-oriented architecture. The effect of cohesion on vulnerabilities
has never been studied before.
Chapter 1. Introduction 4
1.2 Overview
In this thesis, we explore how the likelihood of having vulnerabilities is affected by all three
aforementioned aspects - complexity, coupling, and cohesion - both at the design and code level.
Our first objective is to determine whether complex, coupled and non-cohesive software entities
are less secure and, if so, what CCC metrics can be used to identify the type of complexity,
coupling, and cohesion that leads to decreased security. Our second objective is to investigate
whether structural information from the non-security realm such as complexity, coupling, and
cohesion metrics can be helpful in automatically predicting vulnerabilities in software.
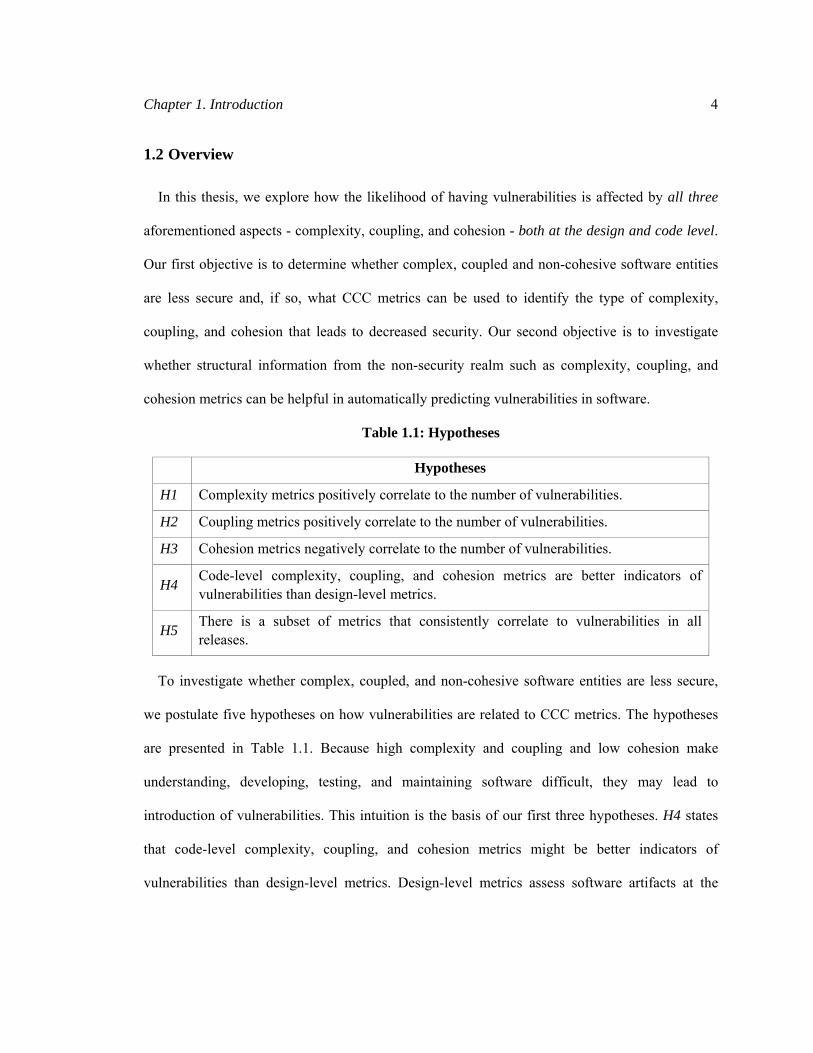
Table 1.1: Hypotheses
Hypotheses
H1 Complexity metrics positively correlate to the number of vulnerabilities.
H2 Coupling metrics positively correlate to the number of vulnerabilities.
H3 Cohesion metrics negatively correlate to the number of vulnerabilities.
H4 Code-level complexity, coupling, and cohesion metrics are better indicators of vulnerabilities than design-level metrics.
H5 There is a subset of metrics that consistently correlate to vulnerabilities in all releases.
To investigate whether complex, coupled, and non-cohesive software entities are less secure,
we postulate five hypotheses on how vulnerabilities are related to CCC metrics. The hypotheses
are presented in Table 1.1. Because high complexity and coupling and low cohesion make
understanding, developing, testing, and maintaining software difficult, they may lead to
introduction of vulnerabilities. This intuition is the basis of our first three hypotheses. H4 states
that code-level complexity, coupling, and cohesion metrics might be better indicators of
vulnerabilities than design-level metrics. Design-level metrics assess software artifacts at the

Chapter 1. Introduction 5
design phase, whereas code-level metrics specifically look into code structures and
implementation language issues [15]. We believe that the code more closely represents the
operational behavior of the software than the design specifications because the code sometimes
diverges from what is specified in the design. The magnitude of correlations of CCC metrics with
vulnerabilities may vary from one release to another. However, we hope that at least a subset of
the selected CCC metrics will consistently correlate to vulnerabilities in all releases, and hence
put forward H5. If the hypothesized relationships can be empirically validated, this information
can be used during the early stages of software development to improve the ultimate security of
software products.
To validate the hypotheses, we will first select a set of standard metrics that measure
complexity, coupling, and cohesion so that we can analyze their correlations with vulnerabilities.
Then, we will conduct an empirical study on Mozilla Firefox [49], a popular open source
browser. We will mine the vulnerability reports, bug repositories, and software version archives
of Mozilla Firefox to map the vulnerabilities back to their associated entities. An entity can be a
function, file, class, module, or component. We then compute the CCC metrics for these entities
and analyze how these metrics correlate with the number of vulnerabilities the entities have had
in the past. The results of the case study in this thesis show that CCC metrics correlate to
vulnerabilities at a statistically significant level. Since different metrics are available during
different development phases, the correlations are further examined to determine whether design-
level or code-level CCC metrics are better indicators of vulnerabilities. We observed that the
correlation patterns are stable across multiple releases of the software. This observation shows
that the metrics can be dependably used as early indicators of vulnerabilities in software.
Chapter 1. Introduction 6
The aforementioned findings allow us to coin the idea of employing CCC metrics to
automatically predict vulnerabilities. However, monotonic models based on correlations with the
raw or monotonically transformed data cannot be used effectively to identify vulnerability-prone
entities under many situations. This is because complexity, coupling, and cohesion may interact
in ways that collectively affect vulnerability-proneness. For example, larger entities may be more
vulnerability-prone when they are more complex and less cohesive but may not be as
vulnerability-prone when they are highly cohesive. The statistical and data mining techniques we
used for vulnerability prediction account for such multivariate interactions. Note that, analyzing
correlations between vulnerabilities and each metric separately is not necessarily a prerequisite
for making predictions. However, such univariate analysis helps to identify the individual
importance of each metric in vulnerability prediction. Therefore, the univariate and multivariate
analysis are complementary.
There are two main approaches to software vulnerability prediction. First, count-based
techniques focus on predicting the number of vulnerabilities in a software system. Managers can
use these predictions to determine if the software is ready for release or if it is likely to have
many lurking vulnerabilities. An example of such work is [1]. Second, classification1-based
techniques emphasize predicting the entities in a software system that are vulnerability-prone, i.e.,
those which are likely to have vulnerabilities. A vulnerability-prone entity can be a function, file,
class or other component defined by a manager or a software security engineer which is likely to
have at least one vulnerability in a release. These predictions can assist managers in focusing their
1 Classification is one of the most common inductive learning tasks that categorizes a data item into one of several predefined categories [47].
Chapter 1. Introduction 7
resource allocation in a release by paying more attention to vulnerability-prone entities. Examples
of such studies are [63-65]. In this study, we treat vulnerability prediction as a classification
problem – predicting whether an entity is vulnerability-prone or not.
We observed in our preliminary investigation that a very small proportion of entities contain
more than one vulnerability in a given release. Various previous studies have also made similar
observations and therefore have treated fault and vulnerability prediction as a classification
problem [5, 13, 35, 38, 21, 22, 63-65, 69]. To facilitate efficient vulnerability detection during the
SDLC, we need to identify those areas of the software which are most likely to have
vulnerabilities (vulnerability-prone), and thus require most of our attention. This approach has the
potential to find more vulnerabilities with the same amount of effort. We can draw an analogy
between this approach and weather prediction; we are predicting the areas that are likely to
experience rainfall (which might include areas that did not experience rainfall before) as opposed
to predicting the amount of rainfall.
In this thesis, we present a framework for how CCC metrics can be used to automatically
predict vulnerability-prone entities, illustrated in Figure 1.1. In the step Map Post Release
Vulnerabilities to Entities, one can map vulnerabilities (reported in the vulnerability reports) to
fixes (in the version archives) and thus to the locations in the code that caused the problem [3, 54,
56, 64]. This mapping is the basis for automatically associating metrics with vulnerabilities. A
methodical description of this step is provided in Chapter 3. In Compute CCC Metrics, a set of
standard CCC metrics is computed for each entity. There are numerous tools available for
automatically computing CCC metrics from the source code [3, 67]. A detailed description of
how we have computed the metrics and what tools we have used for our case study is also
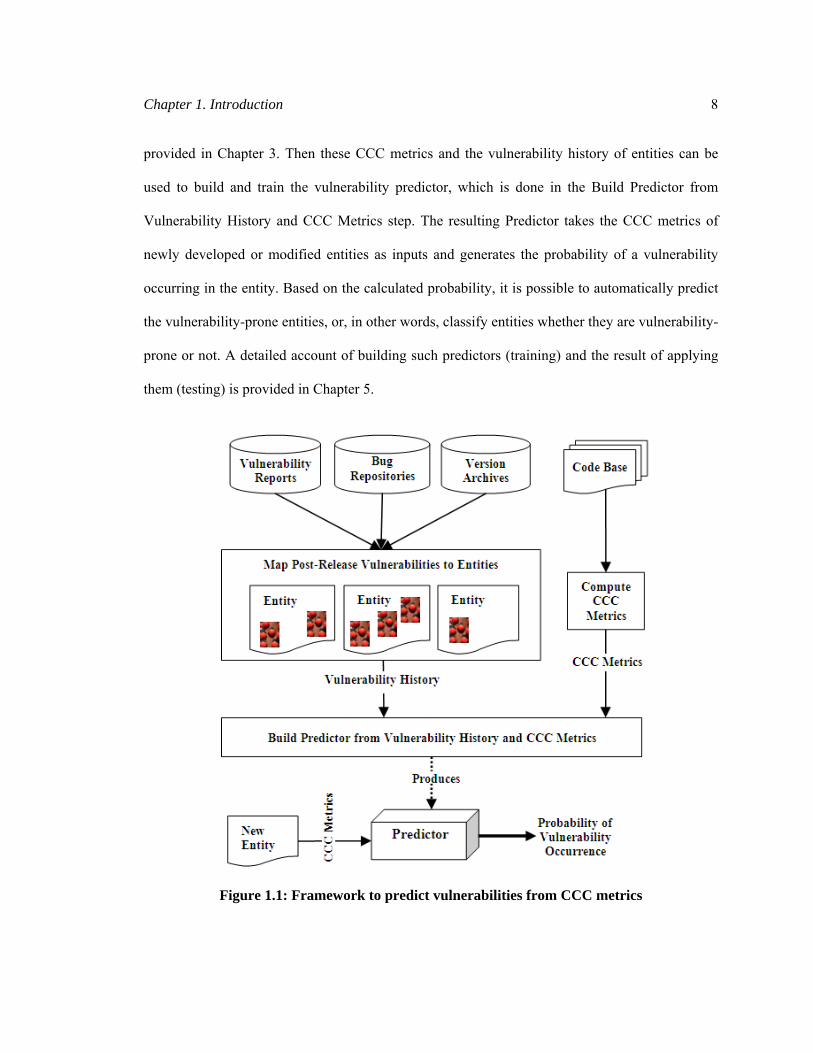
Chapter 1. Introduction 8
provided in Chapter 3. Then these CCC metrics and the vulnerability history of entities can be
used to build and train the vulnerability predictor, which is done in the Build Predictor from
Vulnerability History and CCC Metrics step. The resulting Predictor takes the CCC metrics of
newly developed or modified entities as inputs and generates the probability of a vulnerability
occurring in the entity. Based on the calculated probability, it is possible to automatically predict
the vulnerability-prone entities, or, in other words, classify entities whether they are vulnerability-
prone or not. A detailed account of building such predictors (training) and the result of applying
them (testing) is provided in Chapter 5.
Figure 1.1: Framework to predict vulnerabilities from CCC metrics
Chapter 1. Introduction 9
Several statistical and machine learning techniques are considered to build vulnerability
predictors so that the conclusions drawn from the prediction results are not overly influenced by
any specific technique. We first use a basic but popular decision-tree-based data mining technique
called C4.5 Decision Tree. Then, we compare its prediction capability with Random Forests, an
advanced form of decision tree technique. We also consider Logistic Regression, a standard
statistical technique, and Naïve-Bayes, a simple but often useful probabilistic prediction
technique [73]. Logistic regression has been previously used in vulnerability prediction using
code complexity metrics [64]. The other machine learning techniques have never been applied to
vulnerability prediction before.
To empirically validate the prediction accuracy and usefulness of the framework, we conduct
an extensive case study on fifty-two Mozilla Firefox releases developed over a period of four
years. We are able to predict majority of the vulnerability-prone entities with tolerable false
positive rates. The results of our experiments show that the predictor developed from one release
performs consistently in predicting vulnerability-prone entities in the following release.
1.3 Contributions
The major contributions of this thesis are as follows:
• Provide empirical evidence whether complexity, coupling and lack of cohesion are enemies of
software security. Such knowledge will help avoid potential vulnerabilities in software by
keeping complexity, coupling and lack of cohesion at minimum.

Chapter 1. Introduction 10
• Propose a systematic framework to automatically predict vulnerability-prone entities from
CCC metrics. Such automatic predictions will assist software practitioners in taking proactive
action against potential vulnerabilities during the early stages of the software lifecycle. We
use statistical and machine learning techniques to build the predictor and compare the
prediction performances of four alternative techniques, namely C4.5 Decision Tree, Random
Forests, Logistic Regression and Naïve-Bayes. Among these, C4.5 Decision Tree, Random
Forests, and Naïve-Bayes have not been applied in any kind of vulnerability prediction
before.
• Conduct an extensive case study on several releases of Mozilla Firefox to validate the
usefulness of CCC metrics in vulnerability prediction. In doing so, we provide a tool to
automatically map vulnerabilities to entities by extracting information from software
repositories such as security advisories, bug databases, and concurrent version systems.
1.4 Thesis Organization
The rest of the thesis unfolds as follows. In Chapter 2, we provide background on CCC
metrics, give brief overviews of the statistical and machine learning techniques used for
vulnerability prediction, and also compare and contrast the related work on fault and vulnerability
prediction. In Chapter 3, we elaborate on how we extract vulnerability and metric data from
software repositories. In Chapter 4, we then present the results of the correlation analysis of CCC
metrics and vulnerabilities. In Chapter 5, we outline the design of the vulnerability prediction in
detail, report vulnerability prediction results and discuss the implications of the results. Finally,

Chapter 1. Introduction 11
we conclude the thesis, discuss some limitations of our approaches, and outline avenues for future
work in Chapter 6.
12
Chapter 2
Background and Related Work
This section provides background on complexity, coupling, and cohesion (CCC) metrics that
are hypothesized to affect vulnerability-proneness and furnishes brief overviews of the statistical
and machine learning techniques used in this study to predict vulnerabilities. It also compares and
contrasts the research on vulnerability prediction related to our work.
2.1 Complexity, Coupling, and Cohesion Metrics
Complexity, coupling, and cohesion (CCC) related structural metrics are designed to measure
certain attributes of code and design quality. Table 2.1 summarizes the CCC metrics that may (we
hypothesize) have some affect on the vulnerability-proneness of software. We have selected the
standard code-level metrics from prior research on fault and vulnerability prediction [23, 47, 54,
63-65, 74]. The design-level metrics are the structural measurements defined in the Chidamber-
Kemerer (CK) [14] metric suite for Object-Oriented (OO) architectures. Some of the design-level
metrics measure both complexity and coupling. In that case, the metrics appear in both the
complexity and coupling categories. For example, the Number of Children (NOC) metric
measures inheritance complexity by counting the number of sub-classes of a class. At the same
time, the higher the number of children of a class, the more methods and instance variables the
class is likely to be coupled to. Therefore, NOC indirectly measures coupling due to inheritance
as well.
Software complexity can be categorized into four types: problem complexity, algorithmic
complexity, cognitive complexity, and structural complexity [25]. Even though the four
Chapter 2. Background and Related Work 13
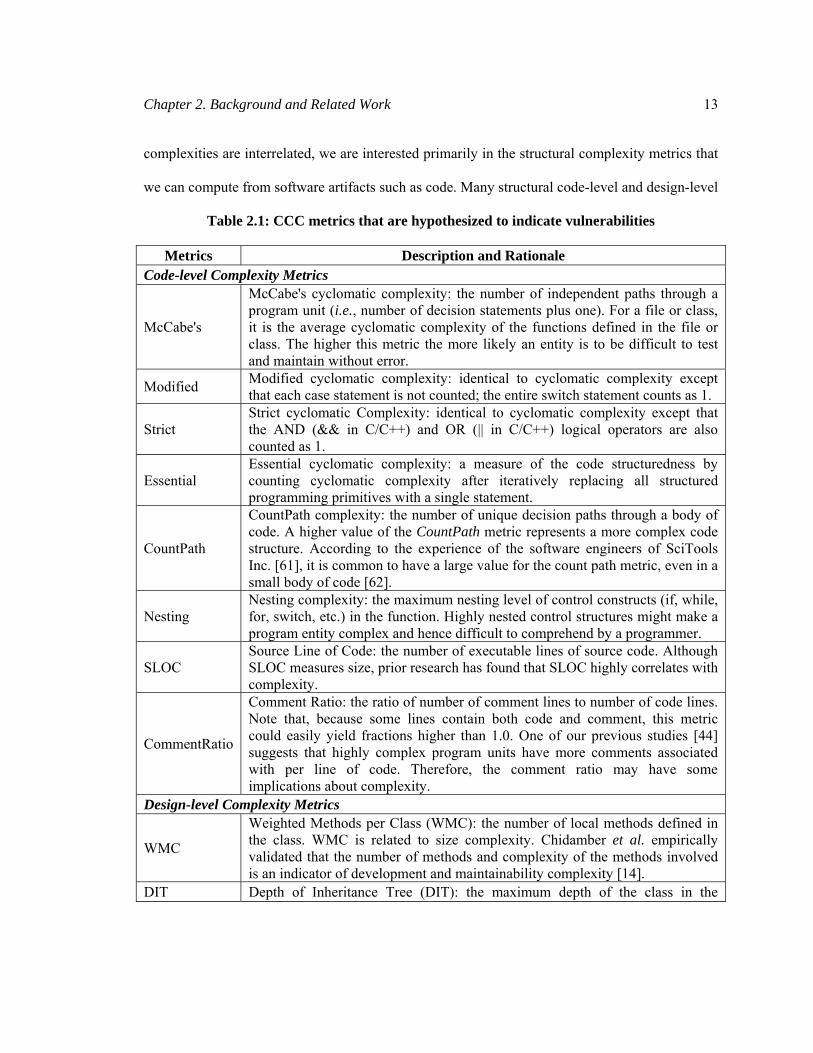
complexities are interrelated, we are interested primarily in the structural complexity metrics that
we can compute from software artifacts such as code. Many structural code-level and design-level
Table 2.1: CCC metrics that are hypothesized to indicate vulnerabilities
Metrics Description and Rationale Code-level Complexity Metrics
McCabe's
McCabe's cyclomatic complexity: the number of independent paths through a program unit (i.e., number of decision statements plus one). For a file or class, it is the average cyclomatic complexity of the functions defined in the file or class. The higher this metric the more likely an entity is to be difficult to test and maintain without error.
Modified Modified cyclomatic complexity: identical to cyclomatic complexity except that each case statement is not counted; the entire switch statement counts as 1.
Strict Strict cyclomatic Complexity: identical to cyclomatic complexity except that the AND (&& in C/C++) and OR (|| in C/C++) logical operators are also counted as 1.
Essential Essential cyclomatic complexity: a measure of the code structuredness by counting cyclomatic complexity after iteratively replacing all structured programming primitives with a single statement.
CountPath
CountPath complexity: the number of unique decision paths through a body of code. A higher value of the CountPath metric represents a more complex code structure. According to the experience of the software engineers of SciTools Inc. [61], it is common to have a large value for the count path metric, even in a small body of code [62].
Nesting Nesting complexity: the maximum nesting level of control constructs (if, while, for, switch, etc.) in the function. Highly nested control structures might make a program entity complex and hence difficult to comprehend by a programmer.
SLOC Source Line of Code: the number of executable lines of source code. Although SLOC measures size, prior research has found that SLOC highly correlates with complexity.
CommentRatio
Comment Ratio: the ratio of number of comment lines to number of code lines. Note that, because some lines contain both code and comment, this metric could easily yield fractions higher than 1.0. One of our previous studies [44] suggests that highly complex program units have more comments associated with per line of code. Therefore, the comment ratio may have some implications about complexity.
Design-level Complexity Metrics
WMC
Weighted Methods per Class (WMC): the number of local methods defined in the class. WMC is related to size complexity. Chidamber et al. empirically validated that the number of methods and complexity of the methods involved is an indicator of development and maintainability complexity [14].
DIT Depth of Inheritance Tree (DIT): the maximum depth of the class in the
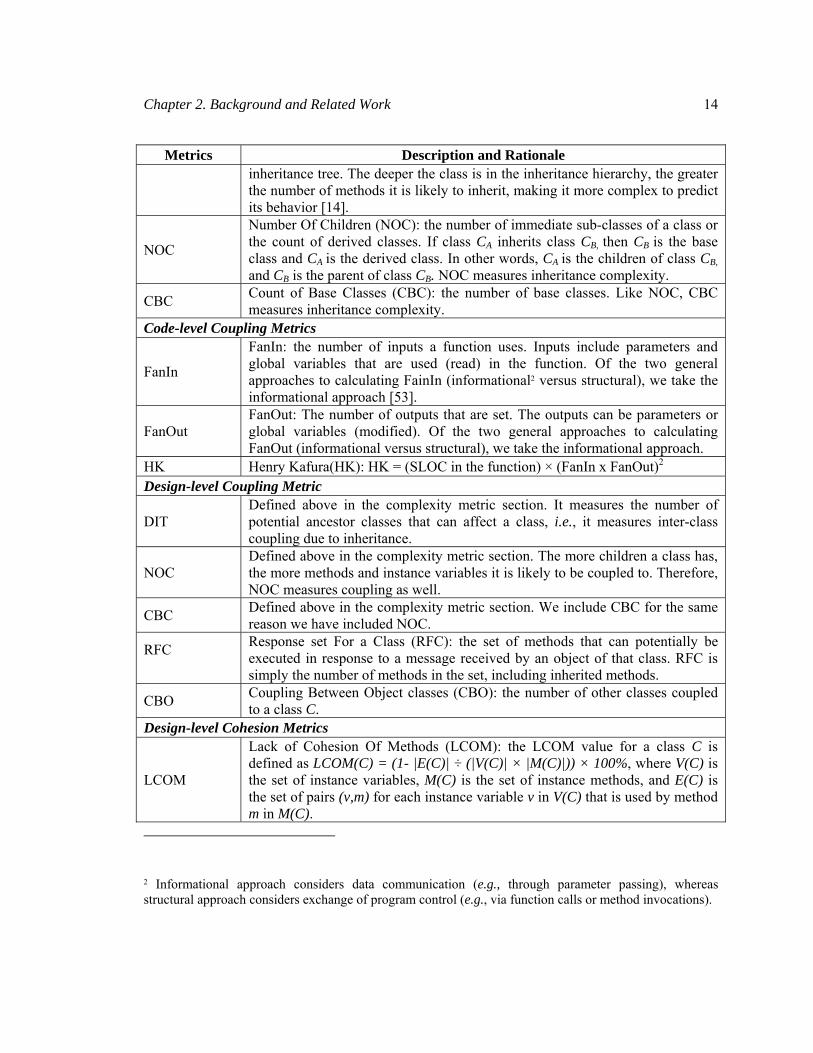
Chapter 2. Background and Related Work 14
Metrics Description and Rationale inheritance tree. The deeper the class is in the inheritance hierarchy, the greater
the number of methods it is likely to inherit, making it more complex to predict its behavior [14].
NOC
Number Of Children (NOC): the number of immediate sub-classes of a class or the count of derived classes. If class CA inherits class CB, then CB is the base class and CA is the derived class. In other words, CA is the children of class CB, and CB is the parent of class CB. NOC measures inheritance complexity.
CBC Count of Base Classes (CBC): the number of base classes. Like NOC, CBC measures inheritance complexity.
Code-level Coupling Metrics
FanIn
FanIn: the number of inputs a function uses. Inputs include parameters and global variables that are used (read) in the function. Of the two general approaches to calculating FainIn (informational2 versus structural), we take the informational approach [53].
FanOut FanOut: The number of outputs that are set. The outputs can be parameters or global variables (modified). Of the two general approaches to calculating FanOut (informational versus structural), we take the informational approach.
HK Henry Kafura(HK): HK = (SLOC in the function) × (FanIn x FanOut)2 Design-level Coupling Metric
DIT Defined above in the complexity metric section. It measures the number of potential ancestor classes that can affect a class, i.e., it measures inter-class coupling due to inheritance.
NOC Defined above in the complexity metric section. The more children a class has, the more methods and instance variables it is likely to be coupled to. Therefore, NOC measures coupling as well.
CBC Defined above in the complexity metric section. We include CBC for the same reason we have included NOC.
RFC
Response set For a Class (RFC): the set of methods that can potentially be executed in response to a message received by an object of that class. RFC is simply the number of methods in the set, including inherited methods.
CBO Coupling Between Object classes (CBO): the number of other classes coupled to a class C.
Design-level Cohesion Metrics
LCOM
Lack of Cohesion Of Methods (LCOM): the LCOM value for a class C is defined as LCOM(C) = (1- |E(C)| ÷ (|V(C)| × |M(C)|)) × 100%, where V(C) is the set of instance variables, M(C) is the set of instance methods, and E(C) is the set of pairs (v,m) for each instance variable v in V(C) that is used by method m in M(C).
2 Informational approach considers data communication (e.g., through parameter passing), whereas structural approach considers exchange of program control (e.g., via function calls or method invocations).
Chapter 2. Background and Related Work 15
complexity metrics have been proposed. The representative examples of code-level complexity
metrics are McCabe’s cyclomatic complexity [45] and Halstead’s complexity [29] metric that
measure complexity in terms of control constructs and lexical tokens, respectively. We consider
McCabe’s cyclomatic complexity metric and its several variations to capture different flavors of
code complexity. The different variations of McCabe’s cyclomatic complexity metric are
Modified cyclomatic complexity, Strict cyclomatic complexity, and Essential cyclomatic
complexity (a detailed description of how these metrics differ from McCabe’s cyclomatic
complexity metric is given in Table 2.1). Some metrics, such as Weighted Methods per Class
(WMC) and Depth of Inheritance Tree (DIT), are available after the completion of the design
phase. These design-level metrics can be used to indicate potential vulnerabilities prior to the start
of the coding phase, given that we can discover their relationships, if any, with vulnerabilities.
Note that these design-level metrics can be computed only when the software is developed based
on OO architecture.
Coupling metrics measure the relationships between entities [53]. “In ontological terms two
objects are coupled if and only if at least one of them acts upon the other” [14]. Therefore, if a
method invokes another method, then the two methods are coupled. If a class C1 has an instance
of another class C2 as one of its data members, C1 and C2 are coupled. Two entities are also
coupled when they act upon the same data (i.e., read or write the same global variables) or
communicate though data passing (parameter passing in case of functions and message passing in
case of objects). We can observe from the aforementioned examples that coupling measures
information flow complexity. FanIn and FanOut are coupling metrics that measure information
Chapter 2. Background and Related Work 16
flow (e.g., by parameter passing). Response set For a Class (RFC) is an example of a design-level
metric that measures the design coupling in OO architecture.
Cohesion metrics measure the relationships among the elements within a single module. Lack
of Cohesion Of Methods (LCOM) is one of most common metrics that measure cohesion [20],
and a method to measure LCOM is described in Table 2.1. Lack of cohesion in an entity implies
that it should be split into two or more sub entities. Non-cohesive entities are difficult to reuse,
and an attempt to reuse them might introduce vulnerabilities in the software [14]. This is the
rationale for including the LCOM metric. Some of the other cohesion metrics are Tight and Loose
Class Cohesion, more commonly known as TCC and LCC, respectively [25]. TCC and LCC are
not included in this study because these two metrics are not computed by the metric-computation
tool we have used.
2.2 Overview of Statistical and Data Mining Techniques
This section provides an overview of the four alternatives for statistical and data mining
techniques used to build vulnerability predictors that learn from the CCC metrics and
vulnerability history.
2.2.1 Decision Tree
A decision tree technique, such as a C4.5 Decision Tree (DT) [73], generates predictors in the
form of an abstract tree of decision rules. The decision rules accommodate non-monotonic and
nonlinear relationships among the combinations of independent variables. In a classification
Chapter 2. Background and Related Work 17
problem, the dependent variable is categorical. In our case, the categories3 are vulnerability-prone
(YES) or not vulnerability-prone (NO). The independent variables, also called exploratory
variables or features, are the CCC metrics. Each internal node represents a decision that is based
on an exploratory variable, and each edge leads to either a category (a leaf in the tree) or the next
decision. An entity is classified by traversing a path from the root of the tree to a leaf, according
to the values of the entity’s CCC metrics. Finally, the entity’s predicted category is assigned the
leaf’s category.
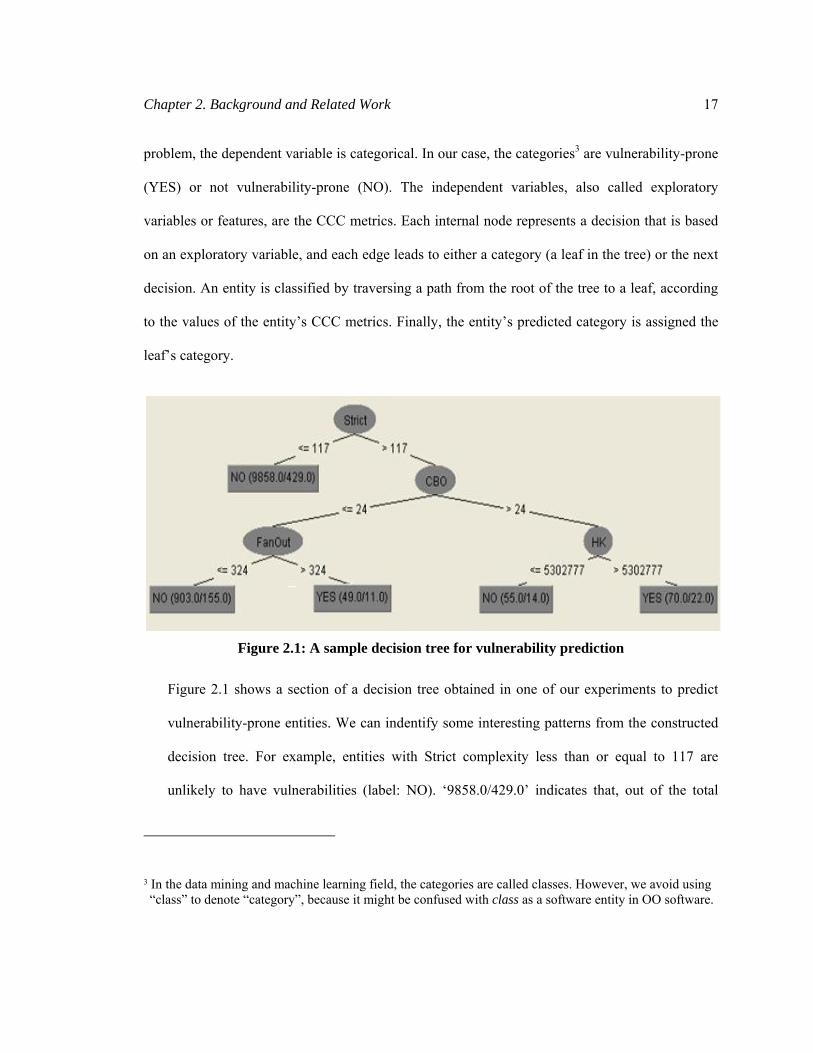
Figure 2.1: A sample decision tree for vulnerability prediction
Figure 2.1 shows a section of a decision tree obtained in one of our experiments to predict
vulnerability-prone entities. We can indentify some interesting patterns from the constructed
decision tree. For example, entities with Strict complexity less than or equal to 117 are
unlikely to have vulnerabilities (label: NO). ‘9858.0/429.0’ indicates that, out of the total
3 In the data mining and machine learning field, the categories are called classes. However, we avoid using “class” to denote “category”, because it might be confused with class as a software entity in OO software.
Chapter 2. Background and Related Work 18
number of samples, 9,858 samples with Strict complexity <=117 are not vulnerable and 429
samples are vulnerable. However, entities with Strict complexity greater than 117 and CBO
more than 24 and HK higher than 5,302,777 are vulnerability-prone (label: YES). We
observe that the DT generates predictors that are easy to interpret (logical rules associated
with probabilities). Therefore, they are easy to adopt in practice as practitioners can then
understand why they get a specific prediction.
Given a total learning set of N samples, a C4.5 Decision Tree "learns" or builds such a
decision tree using divide-and-conquer method as per the following steps (taken from [73]):
1. Check for base cases. The base cases are:
a. If all the remaining n sub-samples to be classified belong to the same category, simply
create a leaf node for the decision tree choosing that category. The value of n can be set
as a parameter in DT.
b. If none of the features provide any normalized information gain [40], i.e., no longer adds
value to the predictions, create a decision node higher up the tree using the expected
category.
c. If an instance of previously-unseen category is encountered, again, create a decision node
higher up the tree using the expected category.
2. For each feature f, find the normalized information gain from splitting on f. Let f_best be the
feature with the highest normalized information gain. Create a decision node that splits on
f_best.

Chapter 2. Background and Related Work 19
3. Apply Steps 1 and 2 on the subset of training samples obtained by splitting on f_best, and add
those nodes as children of the decision node representing f_best.
2.2.2 Random Forests
Random Forests (RF) [73] is an advanced form of decision-tree-based technique. In contrast to
a simple decision-tree-based technique such as C4.5 Decision Tree, RF builds a large number of
decision trees. Each tree is constructed by a different bootstrap sample from the original data
using a classification algorithm with the following steps (taken from [75]):
1. If the number of samples in the training data is N, the algorithm sub-samples n cases at
random with replacement from the original data. The chosen cases are used to construct the
tree.
2. If there are M features in the training set, RF chooses m features from them at random at each
node to ensure that all the trees have low correlation between them. The value of m is held
constant by setting a parameter of RF. After the best feature amongst the m options is selected
to split this node in the tree, the best feature makes the cases reaching the immediate
descendent nodes as pure as possible. The term”pure” refers here to a set of samples that
mostly fall into the same category. The process is repeated recursively for each node of the
tree.
3. After the forest, a collection of trees, is formed, a new sample that needs to be classified is
classified by each tree in the forest. Each tree thus gives a vote that indicates the tree’s
decision on the category of the entity (as vulnerability-prone or not). The forest chooses the
category with most votes for the sample.
Chapter 2. Background and Related Work 20
RF is typically found to outperform basic decision trees and some other advanced machine
learning techniques in prediction accuracy [44]. It is more resistant to noise in the data. This is an
important advantage as we are aware of the fact that the data used in our study will contain noise
due to inconsistencies in the record-keeping of software repositories. Furthermore, often the
prediction accuracy of basic decision tree algorithms suffers when many of the attributes are
correlated. Given that a number of metrics in our study are actually correlated (e.g., all the
complexity metrics), we need a technique that is relatively robust to correlated attributes. The
Random Forests deals well with correlated attributes, and we therefore expect it to maintain a
higher accuracy in its prediction.
2.2.3 Logistic Regression
A statistical analysis method that is often used for classification is Logistic Regression (LR)
[73]. Because we look forward to investigating the collective contribution of CCC metrics in
vulnerability-proneness, we use multivariate LR (as opposed to univariate analysis which
analyzes the affect of each independent variable separately). Multivariate LR is a way to classify
data into two groups depending on the probability of occurrence of an event for given values of
independent variables. In our case, LR computes the probability that an entity is vulnerability-
prone for given metric values. If the probability is greater than a certain cut-off point (e.g., 0.5),
then the entity is classified as vulnerability-prone, otherwise not.
)...( 22110 εββββ +++++ nn xxx
1)...( 22110 εββββ +++++ nnxxx
(1)

Chapter 2. Background and Related Work 21
The probability, P, is calculated as per Equation (1) where:
• xi = i-th metric in the set of CCC metrics (independent variables)
• βi = Regression co-efficient for metric xi (i.e., the average amount of increase in the
dependent variable when the other independent variables are held constant)
• β0 = Regression constant
• ε = Error probability
We use multivariate linear regression in our study because it is a standard statistical
classification technique and it is has been used in several earlier studies on predicting fault-prone
and vulnerability-prone entities [22, 42, 54, 64, 69].
2.2.4 Naïve-Bayes
Naïve-Bayes (NB) [43] is based on probability models that assume that the instances are
independent of one another. It can handle an arbitrary number of independent variables. Suppose,
there are a set of samples and each instance in the sample is represented by a set of attributes S,
where S = {x1, x2, …, xn}. Each instance in the sample can fall into any of the categories in set C,
where C = {c1, c2, …, ck}. Naïve-Bayes first constructs the posterior probability, P(cj), for each
category cj among a set of possible categories in C as the ratio of the number of instances of
category cj to the total number of instances in the sample (N) . Given a new sample X, NB
classifier calculates the conditional probability for each category in C, P(cj|X), and the predicted
category of X is the one with the highest probability. P(cj|X) is calculated as shown in Equation

Chapter 2. Background and Related Work 22
(2) where xi-s are the values for attributes in sample X. The other conditional probability, P(xi|cj),
can be computed from the training sample in a similar way P(cj) is calculated. In our context, x1
to xn represent the CCC metrics of an entity. The category set C = {vulnerability-prone, not
vulnerability-prone}. Therefore, for an entity, X, to be predicted as vulnerability-prone,
P(vulnerability-prone | X) has to be more than 0.5.
(2)
Although Naïve-Bayes tends to be unreliable when there are many inter-related attributes, this
simple technique often yields very accurate results. It is also computationally efficient. We
consider NB because it has often outperformed more sophisticated classification methods [43].
2.3 Related Work
The related research is presented in three parts. First, we describe the research on fault
prediction using complexity, coupling, and cohesion metrics [5, 13, 21, 22, 35, 37, 38, 47, 54, 69,
74]. Second, we compare and contrast recent work that predicts vulnerabilities from complexity
and coupling metrics [42, 63-65]. Finally, we describe some studies that use other phenomena
(e.g., import patterns or past vulnerabilities) to identify the vulnerable components in a software
system [1, 56].
2.3.1 Fault Prediction Using Complexity, Coupling, and Cohesion Metrics
Several prior studies [5, 13, 21, 22, 35, 38, 69] have used Object-Oriented (OO) design-level
CCC metrics (commonly known as the CK metric suite [14]) to identify fault-prone entities.

Chapter 2. Background and Related Work 23
These studies build statistical models with those metrics as independent variables and faults as the
dependent variables. In general, it has been shown that these OO design metrics can be used to
predict the fault-prone modules or the number of faults. Janes et al. [35] identify that coupling
metrics such as Response Set for a Class (RFC) and Coupling Between Object classes (CBO) are
good fault predictors. Succi et al. [69] report that inheritance related metrics such as Number of
Children (NOC) and Depth of Inheritance Tree (DIT) can also be used as indicators of the fault-
prone classes. Basili et al. [5] discover that five of the metrics of the CK metrics suite are useful
indicators of fault-prone classes, and in fact, they are better predictors than the best set of
“traditional” code metrics (code-level metrics defined in Table 2.1). Emam et al. [22] identifies
one more metric called export coupling as having a positive correlation with the fault-proneness
in software modules.
We use the CK metric suite in our work as well. However, unlike [5, 13, 21, 22, 35, 38, 69], we
use these metrics to predict vulnerabilities (security-related faults), not general faults. Moreover,
many of those studies [5, 13, 38, 69] use pre-release faults (i.e., those faults indentified during the
testing phase), whereas we use post-release vulnerabilities (i.e., the security-related faults found
during the operational phase). Although Janes et al. [35] use post-release faults, they use the
number of revisions (i.e., how many times a class has changed so far) as a proxy for the number
of faults. Using the sheer number of revisions as a proxy for the number of faults in a software
entity can be misleading, because changes can be made for perfective, adaptive, or corrective
reasons. Perfective changes are made to improve the product effectiveness (e.g., to add
functionality, to decrease the response time). Adaptive changes are made in response to the
changes in the product’s operational environment. Corrective changes are made to remove faults,
Chapter 2. Background and Related Work 24
leaving the specifications unchanged. Therefore, only corrective changes can be used as a proxy
for the number of faults, not the other types of changes. In this study, we have precisely
indentified those corrective changes resulting from vulnerability fixes (see Chapter 3 for detail).
2.3.2 Vulnerability Prediction Using Complexity and Coupling Metrics
Failure prediction using complexity, coupling, and cohesion metrics has been the subject of
much research in software engineering. However, vulnerability prediction using complexity and
coupling metrics is a fairly new area, and the applicability of cohesion metrics in vulnerability
prediction has never been studied before.
Complexity and Vulnerability
Recently, there have been a few attempts at identifying vulnerability-prone functions using
code-level complexity metrics by Shin and William [63-65]. However, we include both design
and code complexity metrics, whereas they use only code complexity metrics. Their results show
weak correlation between code complexity metrics and vulnerabilities. Therefore, our study
incorporates some coupling and cohesion metrics which are not considered in [63-65]. They use
Logistic Regression to build vulnerability predictors whereas we apply three additional statistical
and data mining techniques to build the predictors. We have replicated their case study on
Mozilla Firefox, and our improvements over their prediction performances are discussed in detail
in Chapter 5 where we present our results.
Chapter 2. Background and Related Work 25
Coupling and Vulnerability
The experimental investigations by Traroe et al. [42] somewhat substantiates the common
intuition that service coupling affects Denial of Service (DoS) attackability (the R-squared values
of their Logistic Regression analyses are 70% which means that their model explains about 70%
of the variation in attackability). Attackability is defined as the likelihood that a software system
or service can be compromised under an attack. By coupling, they mean service coupling which
is measured as “the number of shared components between a given pair of services”. Their
concept of service coupling can only be applied in a service-oriented architecture paradigm,
whereas we measure coupling within traditional and object oriented paradigms. Even though
service coupling is found to be a good explanatory factor for DoS attackability, there might be
other independent variables such as complexity and cohesion, and we include those factors in our
analysis. Moreover, their attackability data is obtained from simulated lab experiments whereas
our vulnerability data is gathered from real-life attacks. Furthermore, they considered only DOS
attacks whereas our analyzed vulnerability reports include a broader spectrum of attacks.
2.3.3 Vulnerability Prediction Using Other Metrics and Techniques
Neuhaus and Zimmerman [56] have found that vulnerabilities in Mozilla Firefox components
can be inferred from import and function-call patterns. A component is defined as a collection of
similarly named source and header files providing a specific service. They identify common
patterns of imports (#include in C/C++) and function calls in the vulnerable components using
pattern mining techniques, whereas we identify patterns of CCC metric-values using statistical
and machine learning techniques. There is a potential to combine these two approaches to build
Chapter 2. Background and Related Work 26
more accurate vulnerability predictions. They predict about half of the vulnerable components in
Mozilla Firefox and about two-third of these predictions are correct. We have conducted a case
study on Mozilla Firefox and achieved better results. We analyze vulnerabilities in Mozilla
Firefox at a different level of granularity (see Chapter 3 for explanations), not at the component
level. Moreover, the way we map vulnerabilities to entities is slightly different from that of
Neuhaus and Zimmerman. Their vulnerability data is as of January 4, 2007. We work on an up-
to-date vulnerability data as of March 1, 2009 (the time of our data collection). However, their
vulnerability data has been very helpful in cross checking the accuracy of our vulnerability
mapping technique.
Alhazmi et al. [1] investigate whether the number of vulnerabilities latent in a software system
can be predicted from the vulnerabilities which have already been discovered. They study the
Windows and Red Hat Linux operating systems and model the future trends of vulnerability
discovery which they call the vulnerability discovery rate. As Shin and William note, “Their
approach can be useful for estimating the effort required to identify and correct undiscovered
security vulnerabilities, but cannot identify the location of the vulnerabilities in the source code”
[65]. By location, Shin and William mean the entity (e.g., file or function) where the vulnerability
is present.
2.4 Summary
This chapter provides basic information about some complexity, coupling, and cohesion (CCC)
metrics. We also provide a brief overview of the statistical and machine learning techniques used
for vulnerability prediction based on those CCC metrics.
Chapter 2. Background and Related Work 27
We conduct an extensive survey on fault and vulnerability prediction using CCC metrics. The
survey clearly shows that, although CCC metrics have been successfully employed in fault
prediction, there is little work that includes complexity and coupling metrics in vulnerability
prediction. Moreover, the affect of cohesion on vulnerability-proneness has never been studied
before.
It may be worth mentioning that the prior studies on fault prediction may be replicated in the
context of vulnerabilities. However, the results might not necessarily be the same as for software
fault prediction. Although vulnerabilities can be viewed as exploitable faults in software, there is
a need to specifically investigate the efficacy of predicting vulnerabilities from CCC metrics.
Research has shown that vulnerable entities have distinctive characteristics from faulty-but-non-
vulnerable entities in terms of code characteristics [63-65]. Moreover, it has been found that
prediction of vulnerable functions from all functions provides better results than prediction of
vulnerable functions from faulty functions [27]. One of the implications of this research is that
techniques to automatically predict fault-prone entities from CCC metrics can be adopted or
leveraged to automatically predict vulnerable-prone entities as well, which has not been
systematically done as of now.
Note that, we do not intend to show that there exist cause-effect relationships between CCC
metrics and vulnerabilities. It is clearly not the case that having a McCabe’s complexity of 100
and a FanIn coupling of 60 causes a vulnerability. However, our intuition is that, because high
complexity and coupling and low cohesion make developing, understanding, testing, and
maintaining software difficult [25, 37], these may lead to introduction of vulnerabilities. By using
the learning algorithms discussed in Section 2.3.1, we intend to learn the patterns of association

Chapter 2. Background and Related Work 28
between CCC metrics of vulnerable entities from the past and use this knowledge to predict the
vulnerability-prone entities in future.
29
Chapter 3
Collecting Vulnerability and Metric Data
This chapter describes the vulnerability and metric data collection process that we used in order
to perform the case study. Such data is collected to (1) test the experimental hypotheses we
postulated about the relationships between vulnerabilities and complexity, coupling, and cohesion
(CCC) metrics, and (2) substantiate that these CCC metrics are applicable in predicting
vulnerability-prone entities.
This chapter begins by providing an overview of Mozilla Firefox (the source of data for our
case study), then provides a detailed description of how we map vulnerabilities to entities such as
files. To map vulnerabilities to entities we find out how many vulnerabilities an entity has had in
the past. In doing so, we outline how to extract vulnerability information from security advisories,
locate the related entries in bug repositories, and then trace the changes in the source code meant
to mitigate vulnerabilities via analyzing the version archives. The locations of vulnerability fixes
help us to determine the number of vulnerabilities that were present in those entities. We also
describe and compare an alternative approach to our vulnerability mapping technique. Then, we
specify how we have computed the set of CCC metrics from the code base of Mozilla Firefox.
Finally, we provide an overview of the tool we have developed to automatically map
vulnerabilities to entities in Mozilla Firefox.
3.1 Overview of Mozilla Firefox
We chose to conduct our case study on Mozilla Firefox, an open source browser. With an
approximate user-base of 270 million, it is one of the most popular internet browsers [62]. The

Chapter 3. Collecting Vulnerability and Metric Data 30
Mozilla Firefox project is large not only in terms of user base but also in terms of source code:
the code-base of each release of the browser measures more than 2 million lines of code.
Moreover, it has a rich history of publicly available vulnerability fixes over a period of four years
(January 26, 2005 to April 27, 2009). The integrated nature of the Mozilla repositories enables us
to accurately map vulnerabilities to their locations in the source code.
We have conducted case studies on different releases of Mozilla Firefox (releases are
analogous to versions). At the time of data collection (March 1, 2009), fifty-two releases of
Mozilla Firefox have had vulnerability fixes, from Release 1.0 (R1.0) to Release 3.0.6 (R3.0.6).
To validate this study, we have collected vulnerability information from all fifty-two releases as
the vulnerabilities are distributed amongst all the releases.
Like [31], we use a file as a logical unit of analysis based on the belief that a file is a
conceptual unit of development where developers tend to group related entities such as functions,
data types, etc. Other fine-grained units of code can be used, such as individual functions or
larger/smaller code chunks that can be determined by a person (system designer or programmer)
with good knowledge of the system. Sub-system or module level4 analysis is also possible. To
facilitate redesign, one might want to analyze from a higher level of abstraction such as
subsystems or modules. By contrast, to facilitate unit testing and code inspection, lower level of
abstractions such as file or class level analysis is more appropriate [2]. Analysis at the file level is
logical because not only files tend to represent developers' organizational choices, but also it is
4 A module is generally comprised of several source files implementing a set of related tasks.

Chapter 3. Collecting Vulnerability and Metric Data 31
particularly convenient for automated analysis as it does not require parsing the source code to
identify the unit of analysis.
To identify the vulnerable files, we count the number of files that were changed in the course
of vulnerability fixes. We know in which release a vulnerability was fixed; however, we do not
know when the vulnerability was introduced. Therefore, when there is a vulnerability fix in a file
of a release (e.g., R2.0.0.4), we assume that the same vulnerability existed in all the previous
releases of the file (i.e., from R2.0.0.3 to R1.0). We automate this cumulative-vulnerability-
collection approach initially introduced by Shin and Williams [65]. They count the number of
vulnerabilities per function in the Javascript Engine component of Mozilla Firefox. We do the
mapping at the file level and for the entire Mozilla Firefox code-base, not just for one component.
We only consider the source files (i.e., files with .c, .cpp, .java, and .h extensions) from which the
metrics are computed. The various configuration and scripting files to build or test Mozilla
Firefox are not examined as they do not represent the source code.
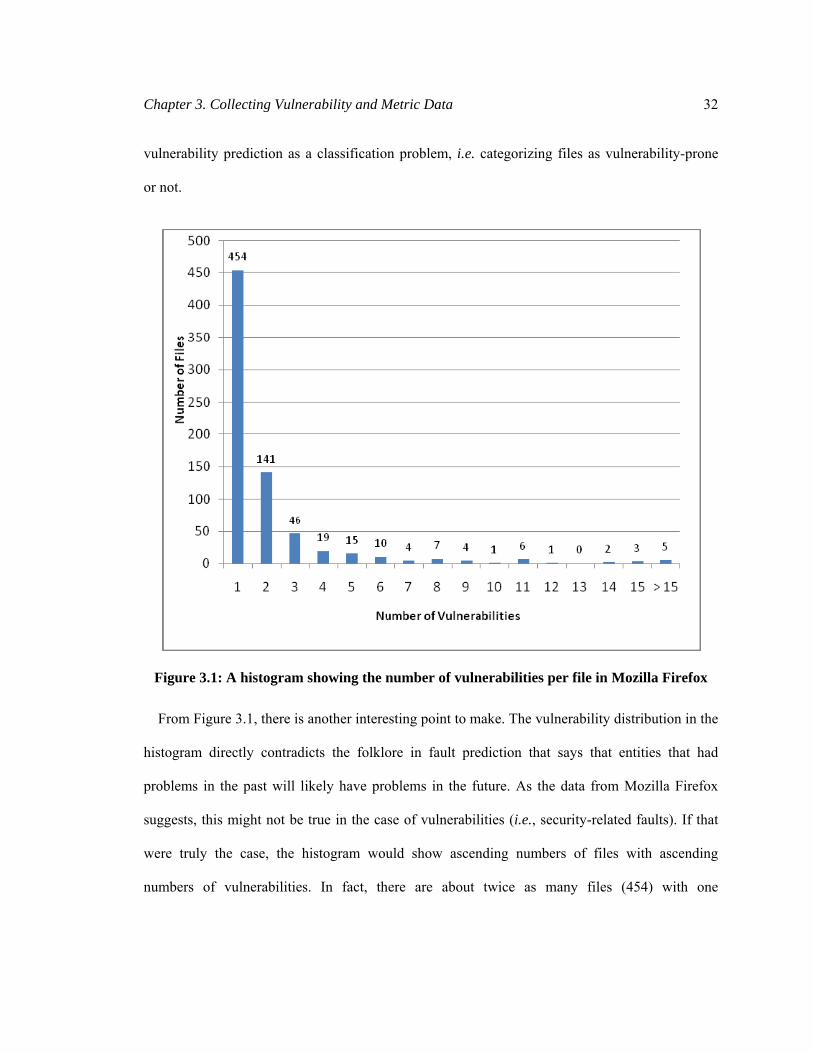
Over the aforementioned period of four years and fifty-two releases, 718 (6.4%) of the total of
11,139 files have had vulnerability fixes. In total, these 718 files suffered from about 1450
vulnerability fixes ranging from one vulnerability fix per file to more than five vulnerability fixes.
Figure 3.1 presents a histogram of the number of vulnerability fixes per file in Mozilla Firefox. It
shows that 454 files have had one vulnerability fix; 141 files have had two vulnerability fixes; 46
files have had three vulnerability fixes; and so on. We can observe that the majority (454) of the
718 vulnerable files have just one vulnerability. Therefore, instead of predicting how many
vulnerabilities a file is going to have, we find it logical to predict the vulnerability-prone files i.e.,
the files that are likely to have one or more vulnerabilities. Hence, we treat the problem of
Chapter 3. Collecting Vulnerability and Metric Data 32
vulnerability prediction as a classification problem, i.e. categorizing files as vulnerability-prone
or not.
Figure 3.1: A histogram showing the number of vulnerabilities per file in Mozilla Firefox
From Figure 3.1, there is another interesting point to make. The vulnerability distribution in the
histogram directly contradicts the folklore in fault prediction that says that entities that had
problems in the past will likely have problems in the future. As the data from Mozilla Firefox
suggests, this might not be true in the case of vulnerabilities (i.e., security-related faults). If that
were truly the case, the histogram would show ascending numbers of files with ascending
numbers of vulnerabilities. In fact, there are about twice as many files (454) with one
Chapter 3. Collecting Vulnerability and Metric Data 33
vulnerability fix than all files (264) with two or more vulnerability fixes combined. This implies
that majority of the files are not repeat offenders, i.e., they do not have vulnerability fixes in the
subsequent releases. This observation has been already made by Neuhaus et al. [56] and our
findings also confirm this. In fact, when Neuhaus et al. took the CVS (Concurrent Version
System) logs from July 24, 2007- encompassing changes due to vulnerability reports from
February 23, 2007 to July 17, 2007- they found that 149 components5 were changed in response
to those vulnerability reports. Of these newly fixed components, 81 were repeat offenders, having
at least one vulnerability-related fix before January 4, 2007. The remaining 68 components had
never had a security-related fix. Therefore, predicting only on the basis of past vulnerability fixes
would miss all the aforementioned 68 components. One implication of this observation is that, to
make accurate predictions, we have to go beyond vulnerability history and consider additional
factors (such as CCC metrics).
3.2 Mapping Vulnerabilities to Entities
For this research, we need three types of data: vulnerability reports, a history of source code
changes, and a method of tracing from vulnerabilities to the original and changed code of an
entity. The vulnerabilities in Mozilla Firefox are reported as Mozilla Foundation Security
Advisories (MFSAs) [51]. The source code change history is available from Concurrent Version
System (CVS) archives. However, there is no direct link from MFSA to CVS. The trace from
vulnerabilities to the original and changed code of an entity can be obtained via Bugzilla, a bug
5 Neuhaus et al. define a Mozilla Firefox component as a collection of similarly named source (.c/.cpp) and header (.h) files providing a specific service.

Chapter 3. Collecting Vulnerability and Metric Data 34
tracking system [12]. A bug tracking system is likely to contain all sorts of entries ranging from
corrective to perfective or even specifying preventive maintenance [3]. To avoid confusion, in
this section, we refer to any problem posted on Bugzilla as an issue and use the term bug6 only for
issues requiring corrective maintenance. Our approach of mapping vulnerabilities to files can be
summarized in the following three steps which are further explained in the next three subsections.
1. Retrieve the vulnerabilities from the Mozilla Foundation Security Advisories (MFSAs).
2. For each vulnerability found in Step 1, indentify the link(s) to the associated bug(s) in
Bugzilla.
3. For each bug found in Step 2, determine the file(s) that were modified to fix the bug and
increment the vulnerability count for those file(s).
3.2.1 Extracting Vulnerability Information from MFSA
Vulnerabilities are announced in security advisories that provide users workarounds or pointers to
fixed versions and help them avoid security problems. For example, Common Vulnerabilities and
Exposures (CVE) [18] lists publicly known information security vulnerabilities and exposures. In
the case of Mozilla, the mitigated vulnerabilities are also posted in the Mozilla Foundation
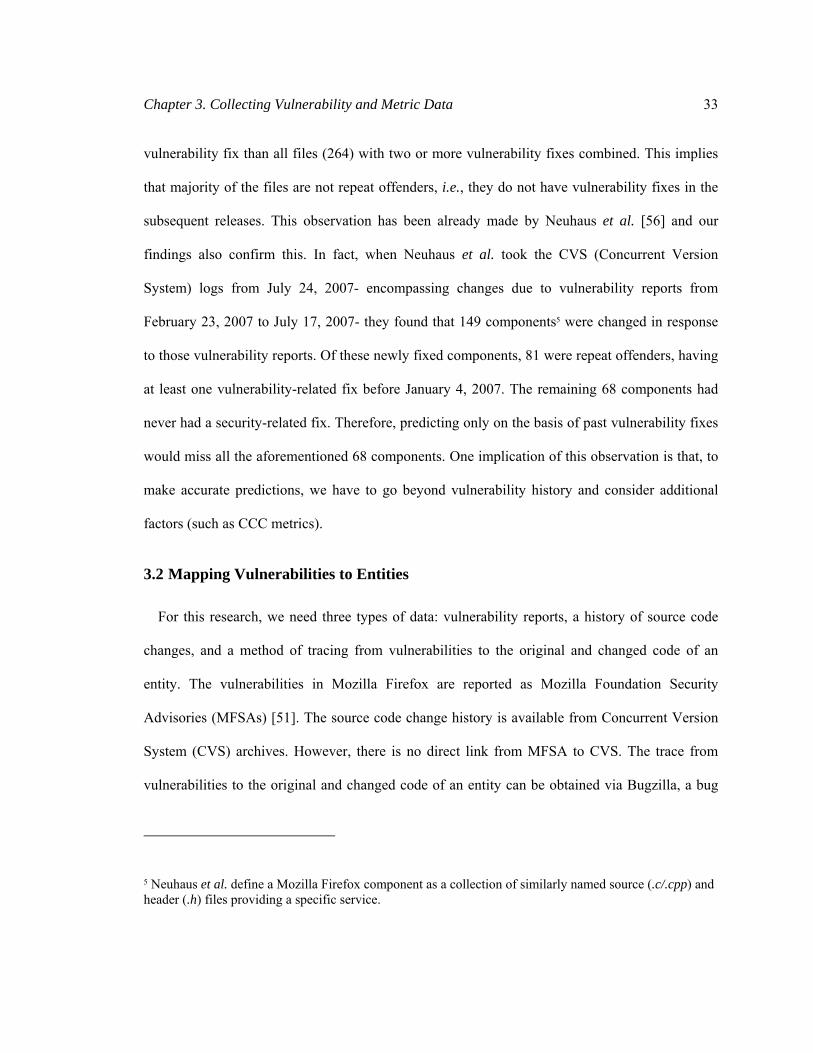
Security Advisories (MFSA) page. Figure 3.2 shows a section of the list of vulnerabilities posted
in MFSA page. Each vulnerability has a unique MFSA Identifier i.e., each MFSA entry
corresponds to a vulnerability. For example, MFSA 2008-27 (circled in Figure 3.2) means that it
6 It is important not to confuse this bug- a Bugzilla entry indicating a corrective maintenance requirement to fix a vulnerability- with the general definition of bug- a fault in the code [70].
Chapter 3. Collecting Vulnerability and Metric Data 35
is the 27th vulnerability discovered in the year 2008. The listing also shows which vulnerabilities
have been fixed in which releases. Note that, some vulnerabilities can affect multiple releases.
For example, the vulnerability MFSA 2008-65 was fixed in releases 2.0.0.20 and 2.0.0.19.
Figure 3.2: A section of the list of vulnerabilities posted in MFSA [60]
Chapter 3. Collecting Vulnerability and Metric Data 36
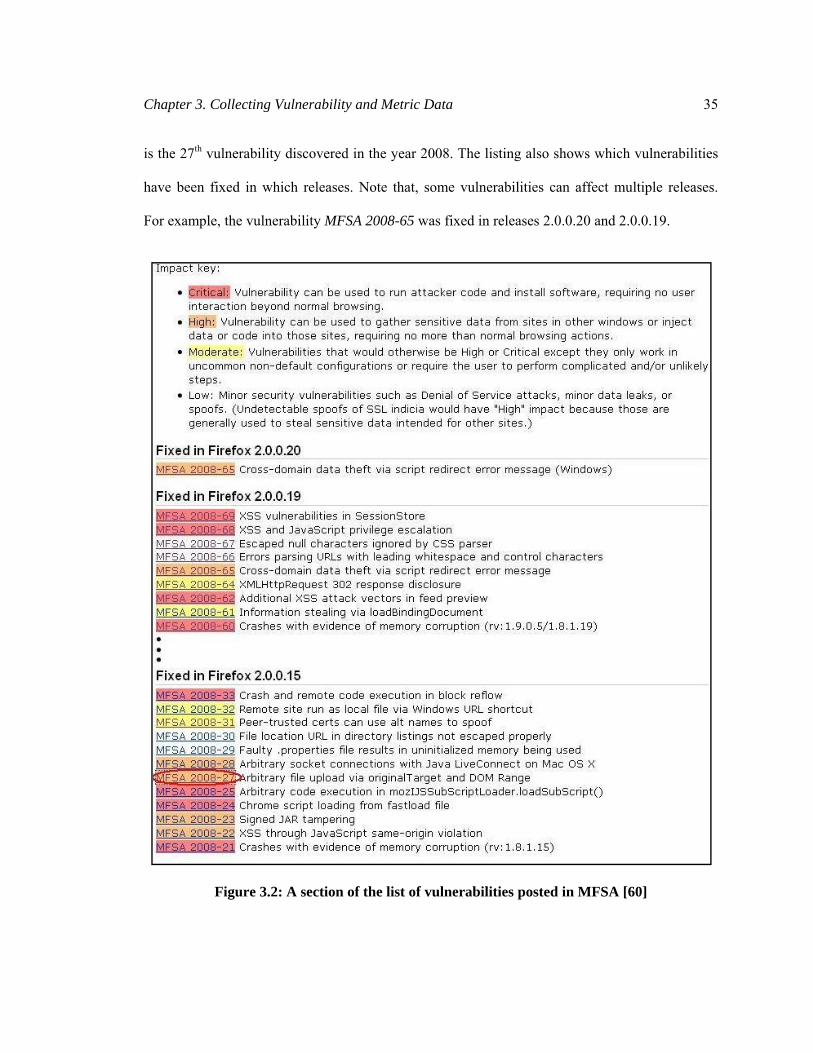
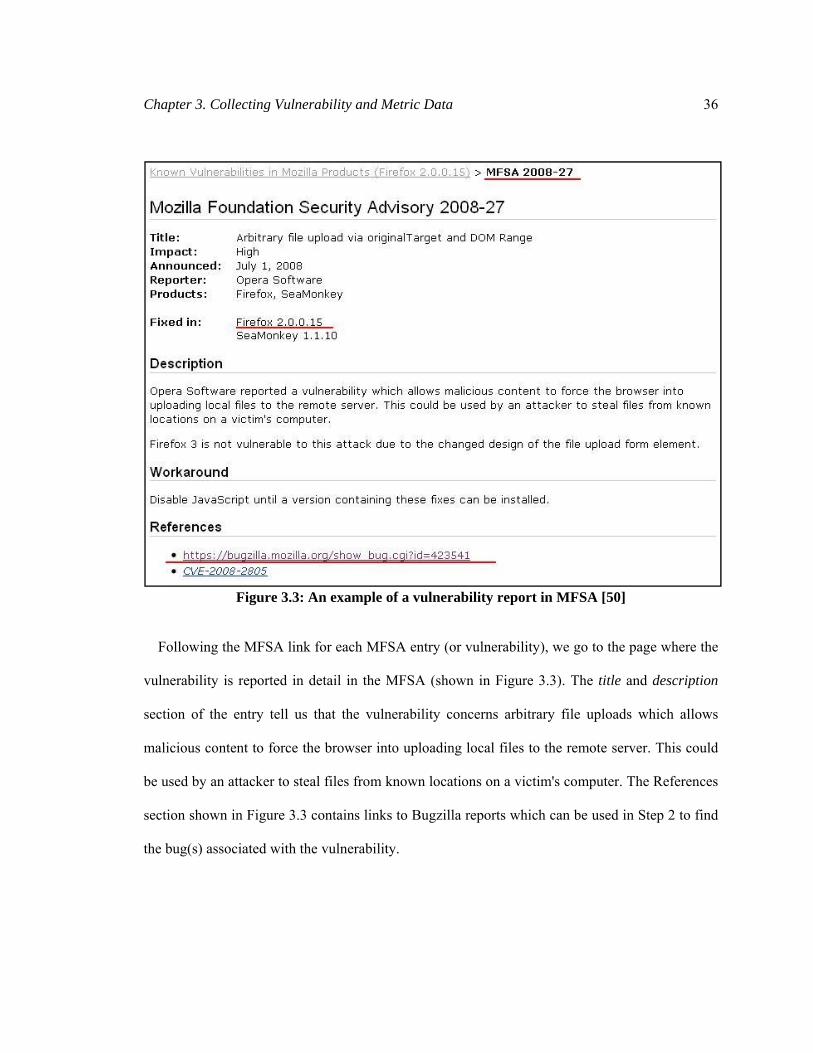
Figure 3.3: An example of a vulnerability report in MFSA [50]
Following the MFSA link for each MFSA entry (or vulnerability), we go to the page where the
vulnerability is reported in detail in the MFSA (shown in Figure 3.3). The title and description
section of the entry tell us that the vulnerability concerns arbitrary file uploads which allows
malicious content to force the browser into uploading local files to the remote server. This could
be used by an attacker to steal files from known locations on a victim's computer. The References
section shown in Figure 3.3 contains links to Bugzilla reports which can be used in Step 2 to find
the bug(s) associated with the vulnerability.
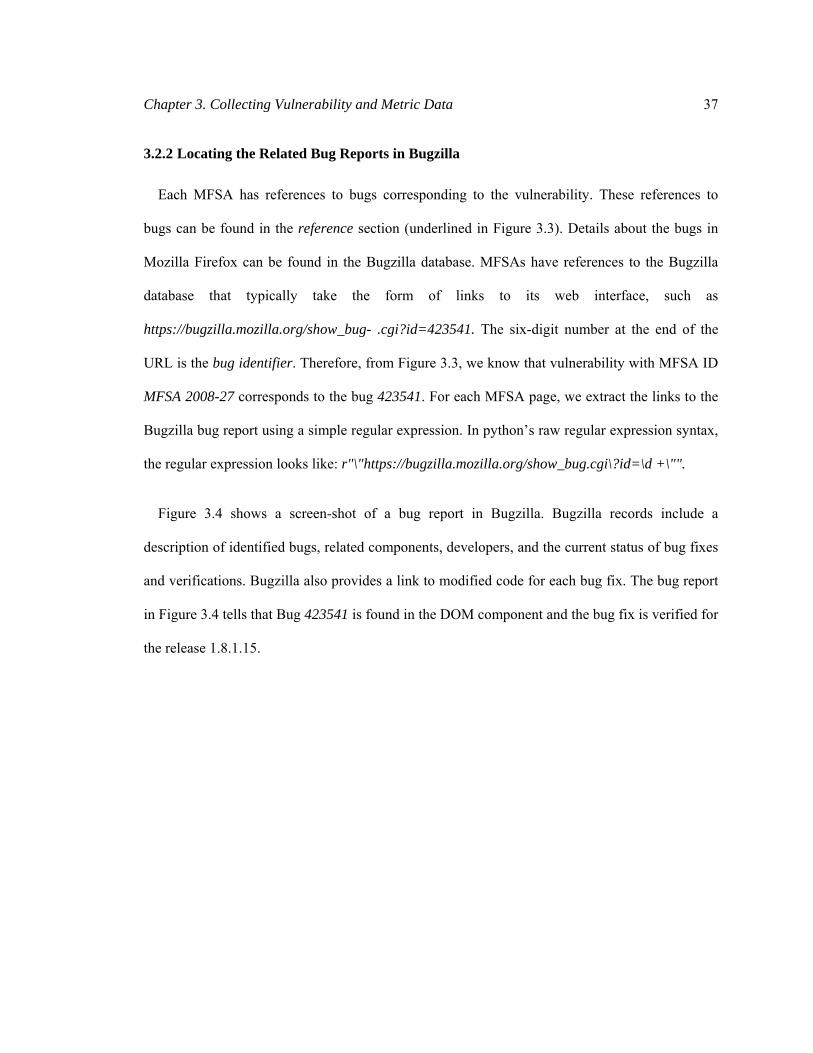
Chapter 3. Collecting Vulnerability and Metric Data 37
3.2.2 Locating the Related Bug Reports in Bugzilla
Each MFSA has references to bugs corresponding to the vulnerability. These references to
bugs can be found in the reference section (underlined in Figure 3.3). Details about the bugs in
Mozilla Firefox can be found in the Bugzilla database. MFSAs have references to the Bugzilla
database that typically take the form of links to its web interface, such as
https://bugzilla.mozilla.org/show_bug- .cgi?id=423541. The six-digit number at the end of the
URL is the bug identifier. Therefore, from Figure 3.3, we know that vulnerability with MFSA ID
MFSA 2008-27 corresponds to the bug 423541. For each MFSA page, we extract the links to the
Bugzilla bug report using a simple regular expression. In python’s raw regular expression syntax,
the regular expression looks like: r"\"https://bugzilla.mozilla.org/show_bug.cgi\?id=\d +\"".
Figure 3.4 shows a screen-shot of a bug report in Bugzilla. Bugzilla records include a
description of identified bugs, related components, developers, and the current status of bug fixes
and verifications. Bugzilla also provides a link to modified code for each bug fix. The bug report
in Figure 3.4 tells that Bug 423541 is found in the DOM component and the bug fix is verified for
the release 1.8.1.15.
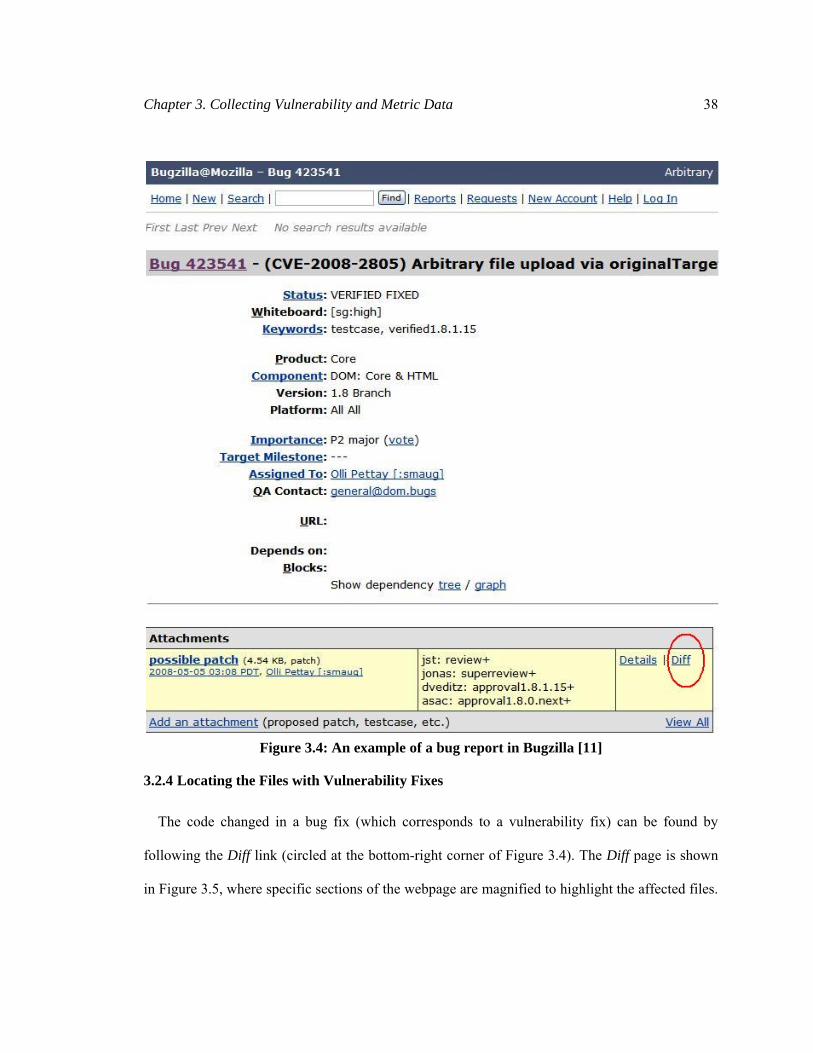
Chapter 3. Collecting Vulnerability and Metric Data 38
Figure 3.4: An example of a bug report in Bugzilla [11]
3.2.4 Locating the Files with Vulnerability Fixes
The code changed in a bug fix (which corresponds to a vulnerability fix) can be found by
following the Diff link (circled at the bottom-right corner of Figure 3.4). The Diff page is shown
in Figure 3.5, where specific sections of the webpage are magnified to highlight the affected files.
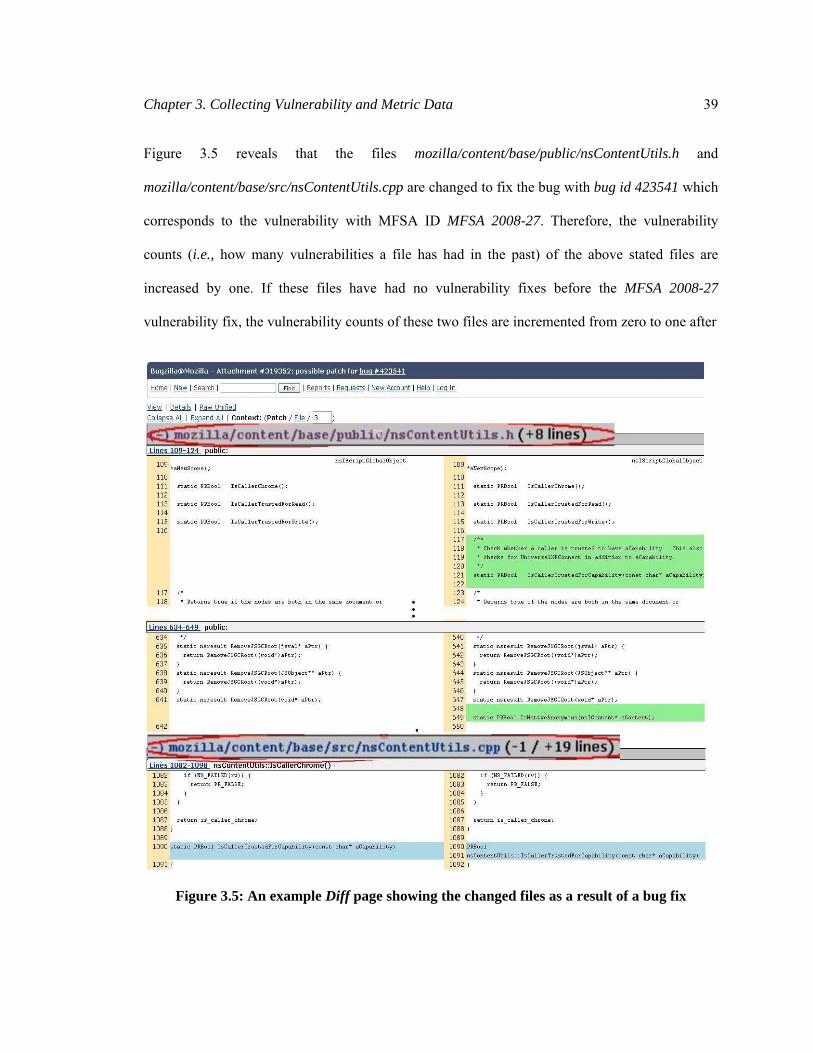
Chapter 3. Collecting Vulnerability and Metric Data 39
Figure 3.5 reveals that the files mozilla/content/base/public/nsContentUtils.h and
mozilla/content/base/src/nsContentUtils.cpp are changed to fix the bug with bug id 423541 which
corresponds to the vulnerability with MFSA ID MFSA 2008-27. Therefore, the vulnerability
counts (i.e., how many vulnerabilities a file has had in the past) of the above stated files are
increased by one. If these files have had no vulnerability fixes before the MFSA 2008-27
vulnerability fix, the vulnerability counts of these two files are incremented from zero to one after
Figure 3.5: An example Diff page showing the changed files as a result of a bug fix

Chapter 3. Collecting Vulnerability and Metric Data 40
this vulnerability fix. If the same files are modified to fix another vulnerability (which is
represented by a different MFSA ID, e.g., MFSA 2008-28), then the vulnerability counts of these
files are again incremented by one. That is, the vulnerability counts become two. However, we
make sure that the same vulnerability fixes are not counted multiple times. For example, from
Figure 3.3, we know that MFSA 2008-27 vulnerability is fixed in release 2.0.0.15. If the same
vulnerability is also fixed in release 2.0.0.16, i.e., the files mozilla/content/base/public/nsContent-
Utils.h and mozilla/content/base/src/nsContentUtils.cpp are also modified in release 2.0.0.16 to
fix MFSA 2008-27, we do not increment the vulnerability counts of these files again as this fix
had been already counted in the previous release. Once we have identified the fixes of bugs to
mitigate vulnerabilities, we can precisely find out how many vulnerabilities each file has had in
the past. Note that a security advisory reporting a vulnerability may refer to multiple bugs, and a
bug fix can involve several files.
3.2.5 An Alternative Approach for Mapping Vulnerabilities to Entities
Before this straightforward method of tracing vulnerability fixes to code was available via
these web interfaces, one would have to download the entire CVS log of commit messages and
search the CVS logs of each file for specific bug ids in Mozilla Firefox. In that case, the steps to
count the number of vulnerabilities per file would be:
1. Download the Mozilla CVS.
2. For each MFSA extract the bug ids.
3. Look for the bug ids in the commit messages of CVS log entries.
4. Increment vulnerability counter for the affected files.

Chapter 3. Collecting Vulnerability and Metric Data 41
This alternative approach is adopted by Neuhaus et al. [56], described in detail by Sliwerski et
al.[67], and extends the approaches introduced by Fischer et al. [26] and by Cubranic et al. [19].
3.3 Computing Complexity, Coupling, and Cohesion Metrics
The complexity, coupling, and cohesion metrics are computed by statically analyzing the
source code of Mozilla Firefox which can be obtained either by downloading a source archive or
by using a source control system like a CVS client. Because we do not intent to check-in (submit)
any code back into the source archives, we simply downloaded the source code of specific
releases. The source code for a release can be found on the Mozilla FTP (File Transfer Protocol)
server [33]. A detailed manual on how to acquire the source code of a specific release via FTP is
provided in the Developer Guide [48].
We used a commercial tool called Understand C++ [61] to automatically calculate the metrics
from the source code. This tool is used because it is user friendly and it has a good set of APIs to
interact with programming languages such as C++, Perl, and Python.
In this study, we compute the metrics at file-level granularity. The design-level metrics (the C-
K metric suite) are computed for each class and aggregated to the file level. For example, the file
nsAEClassDispatcher.h has the classes AEDispatchHandler and AEDispatchTree with Lack of
Cohesion of Methods (LCOM) scores of 55% and 33%, respectively. We take the average LCOM
of these two classes, 44%, to be the representative LCOM of the file. In case of all other design–
level OO metrics, we add the metric values to aggregate to the file level. For example, the values
of the Weighted Methods per Class (WMC) metric (which is basically the number of methods
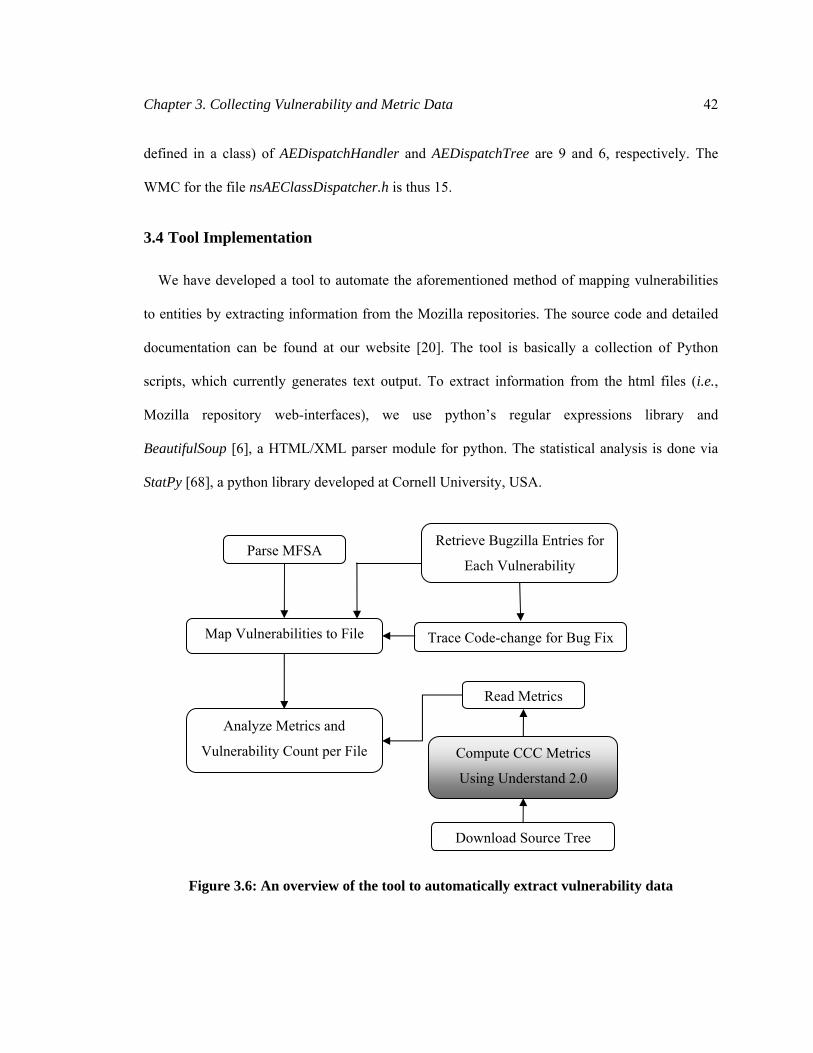
Chapter 3. Collecting Vulnerability and Metric Data 42
defined in a class) of AEDispatchHandler and AEDispatchTree are 9 and 6, respectively. The
WMC for the file nsAEClassDispatcher.h is thus 15.
3.4 Tool Implementation
We have developed a tool to automate the aforementioned method of mapping vulnerabilities
to entities by extracting information from the Mozilla repositories. The source code and detailed
documentation can be found at our website [20]. The tool is basically a collection of Python
scripts, which currently generates text output. To extract information from the html files (i.e.,
Mozilla repository web-interfaces), we use python’s regular expressions library and
BeautifulSoup [6], a HTML/XML parser module for python. The statistical analysis is done via
StatPy [68], a python library developed at Cornell University, USA.
Figure 3.6: An overview of the tool to automatically extract vulnerability data
Trace Code-change for Bug Fix
Compute CCC Metrics
Using Understand 2.0
Read Metrics
Download Source Tree
Retrieve Bugzilla Entries for
Each Vulnerability
Map Vulnerabilities to File
Parse MFSA
Analyze Metrics and
Vulnerability Count per File
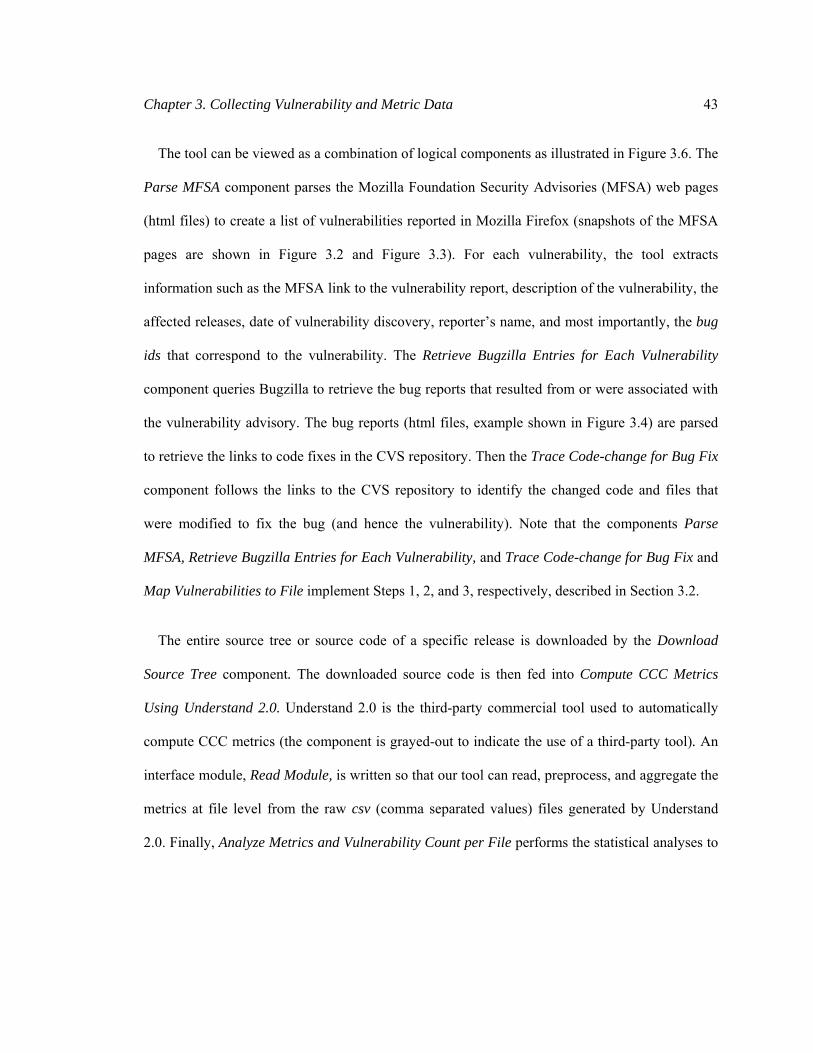
Chapter 3. Collecting Vulnerability and Metric Data 43
The tool can be viewed as a combination of logical components as illustrated in Figure 3.6. The
Parse MFSA component parses the Mozilla Foundation Security Advisories (MFSA) web pages
(html files) to create a list of vulnerabilities reported in Mozilla Firefox (snapshots of the MFSA
pages are shown in Figure 3.2 and Figure 3.3). For each vulnerability, the tool extracts
information such as the MFSA link to the vulnerability report, description of the vulnerability, the
affected releases, date of vulnerability discovery, reporter’s name, and most importantly, the bug
ids that correspond to the vulnerability. The Retrieve Bugzilla Entries for Each Vulnerability
component queries Bugzilla to retrieve the bug reports that resulted from or were associated with
the vulnerability advisory. The bug reports (html files, example shown in Figure 3.4) are parsed
to retrieve the links to code fixes in the CVS repository. Then the Trace Code-change for Bug Fix
component follows the links to the CVS repository to identify the changed code and files that
were modified to fix the bug (and hence the vulnerability). Note that the components Parse
MFSA, Retrieve Bugzilla Entries for Each Vulnerability, and Trace Code-change for Bug Fix and
Map Vulnerabilities to File implement Steps 1, 2, and 3, respectively, described in Section 3.2.
The entire source tree or source code of a specific release is downloaded by the Download
Source Tree component. The downloaded source code is then fed into Compute CCC Metrics
Using Understand 2.0. Understand 2.0 is the third-party commercial tool used to automatically
compute CCC metrics (the component is grayed-out to indicate the use of a third-party tool). An
interface module, Read Module, is written so that our tool can read, preprocess, and aggregate the
metrics at file level from the raw csv (comma separated values) files generated by Understand
2.0. Finally, Analyze Metrics and Vulnerability Count per File performs the statistical analyses to

Chapter 3. Collecting Vulnerability and Metric Data 44
report the correlations between CCC metrics and vulnerabilities in Mozilla Firefox files. The
results of this statistical analysis are presented in Chapter 4.
3.5 Summary
This chapter introduces our case study subject – Mozilla Firefox. It also provides a detailed
account of how one can map vulnerabilities to software entities by extracting information from
software repositories such as vulnerability reports, bug reports and Concurrent Version Systems
(CVS). For Mozilla Firefox, we mine the Mozilla Foundation Security Advisories (vulnerability
reports), their corresponding Bugzilla entries (bug reports) and CVS repositories to trace the
source files changed to mitigate each vulnerability. The vulnerable files are identified from the
location of the vulnerability fixes. We collect vulnerability information from fifty-two releases of
Mozilla Firefox developed over a period of four years. We provide an overview of the tool
developed to automatically collect such vulnerability information from the aforementioned
repositories. We also describe how we acquire the Mozilla source code and automatically
compute CCC metrics using a third party tool.
The collected vulnerability history of more than four years and CCC metrics from several
releases of Mozilla Firefox can be analyzed to test the five hypotheses we postulated about the
underlying relationships between CCC metrics and vulnerabilities. The next chapter reports the
results of the experiments conducted to test these hypotheses.

45
Chapter 4
Experimental Analysis of the Hypotheses
This chapter describes the experiments performed to validate the hypotheses about how
vulnerabilities relate to complexity, coupling, and cohesion (CCC) metrics. First, it gives an
overview of the experimental analysis. In doing so, it describes how to interpret the correlation
values, which correlation technique is most suitable in the experiment, and the data used in the
experimental analyses. Then it lays out each experiment in detail. The first, second, and third
experiments are conducted to investigate the association of complexity, coupling, and cohesion
metrics, respectively, with vulnerabilities in Mozilla Firefox. The fourth experiment is to
investigate which level of metrics, code or design level, more strongly correlate to vulnerabilities.
Finally, the fifth experiment is conducted to determine the subset of metrics that consistently
correlate to vulnerabilities across multiple releases of Mozilla Firefox. In the end, we provide an
overall summary of experimental findings and their implications.
We would like to remind the readers that in the previous chapter we described how we have
collected vulnerability and CCC metric data from several releases of Mozilla Firefox. In this
chapter, we use the collected data to test the hypothesis about the underlying relationship between
the CCC metrics and vulnerabilities. The discussion of classification and prediction of vulnerable
files based on that data has to wait until Chapter 5.
4.1 Experiments to Test the Hypotheses
As mentioned, we conduct five experiments to test the five hypotheses (see Table 1.1 in
Section 1.4) postulated about the underlying relationships between vulnerabilities and CCC

Chapter 4. Experimental Analysis of the Hypotheses 46
metrics. We test each hypothesis by computing the correlations between the CCC metrics and the
number of vulnerabilities in each file. The value of the correlation coefficient (denoted by
correlation in short) gives the strength of the relationship. However, the interpretation depends on
the context of the usage of correlation. Cohen et al. [16] suggest that a correlation of less than 0.3
means weak correlation, 0.3 to 0.5 means medium correlation, and greater than 0.5 means strong
correlation. We interpret the strength of correlation as per Cohen et al. The significance of the
correlation indicates whether the observed association has occurred by chance. In other words, it
asks if the correlation is significantly different than zero. Conventionally, the significance of a
correlation is determined in terms of p-value, the probability of the T-statistic. The smaller the p-
value, the higher is the confidence on the significance of the correlation. Traditionally,
correlations with p-values of less than or equal to 0.05 are considered statistically significant [16].
A p-value of 0.05 means that we are 95% confident that the observed correlation is not by chance.
The Pearson correlation coefficient (r) and Spearman rank correlation coefficient (ρ) are often
used to measure the strength of correlations between two variables. The Pearson correlation
assumes normal distribution of data, while the Spearman rank correlation is a non-parametric test
that does not assume any distribution. Spearman rank correlation is performed on the ranks of the
values without considering the magnitudes of the values, and therefore, it is not sensitive to
outliers. Spearman rank correlation is a commonly used and robust correlation technique because
it can be applied even when the association between elements is non-linear [16]. For these
reasons, we use the Spearman rank correlation for this study. We have used stats.py, a statistical
data analysis package written in python, to compute the Spearman rank correlation and its
corresponding p-value.
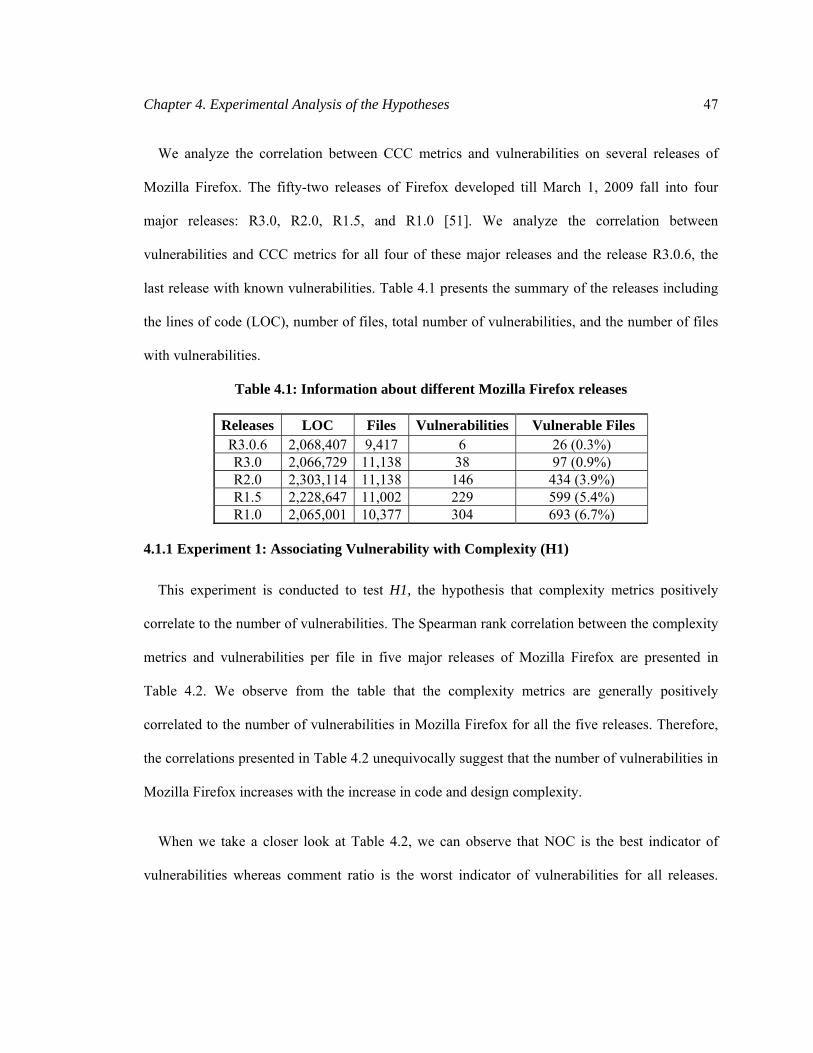
Chapter 4. Experimental Analysis of the Hypotheses 47
We analyze the correlation between CCC metrics and vulnerabilities on several releases of
Mozilla Firefox. The fifty-two releases of Firefox developed till March 1, 2009 fall into four
major releases: R3.0, R2.0, R1.5, and R1.0 [51]. We analyze the correlation between
vulnerabilities and CCC metrics for all four of these major releases and the release R3.0.6, the
last release with known vulnerabilities. Table 4.1 presents the summary of the releases including
the lines of code (LOC), number of files, total number of vulnerabilities, and the number of files
with vulnerabilities.
Table 4.1: Information about different Mozilla Firefox releases
Releases LOC Files Vulnerabilities Vulnerable Files R3.0.6 2,068,407 9,417 6 26 (0.3%) R3.0 2,066,729 11,138 38 97 (0.9%) R2.0 2,303,114 11,138 146 434 (3.9%) R1.5 2,228,647 11,002 229 599 (5.4%) R1.0 2,065,001 10,377 304 693 (6.7%)
4.1.1 Experiment 1: Associating Vulnerability with Complexity (H1)
This experiment is conducted to test H1, the hypothesis that complexity metrics positively
correlate to the number of vulnerabilities. The Spearman rank correlation between the complexity
metrics and vulnerabilities per file in five major releases of Mozilla Firefox are presented in
Table 4.2. We observe from the table that the complexity metrics are generally positively
correlated to the number of vulnerabilities in Mozilla Firefox for all the five releases. Therefore,
the correlations presented in Table 4.2 unequivocally suggest that the number of vulnerabilities in
Mozilla Firefox increases with the increase in code and design complexity.
When we take a closer look at Table 4.2, we can observe that NOC is the best indicator of
vulnerabilities whereas comment ratio is the worst indicator of vulnerabilities for all releases.
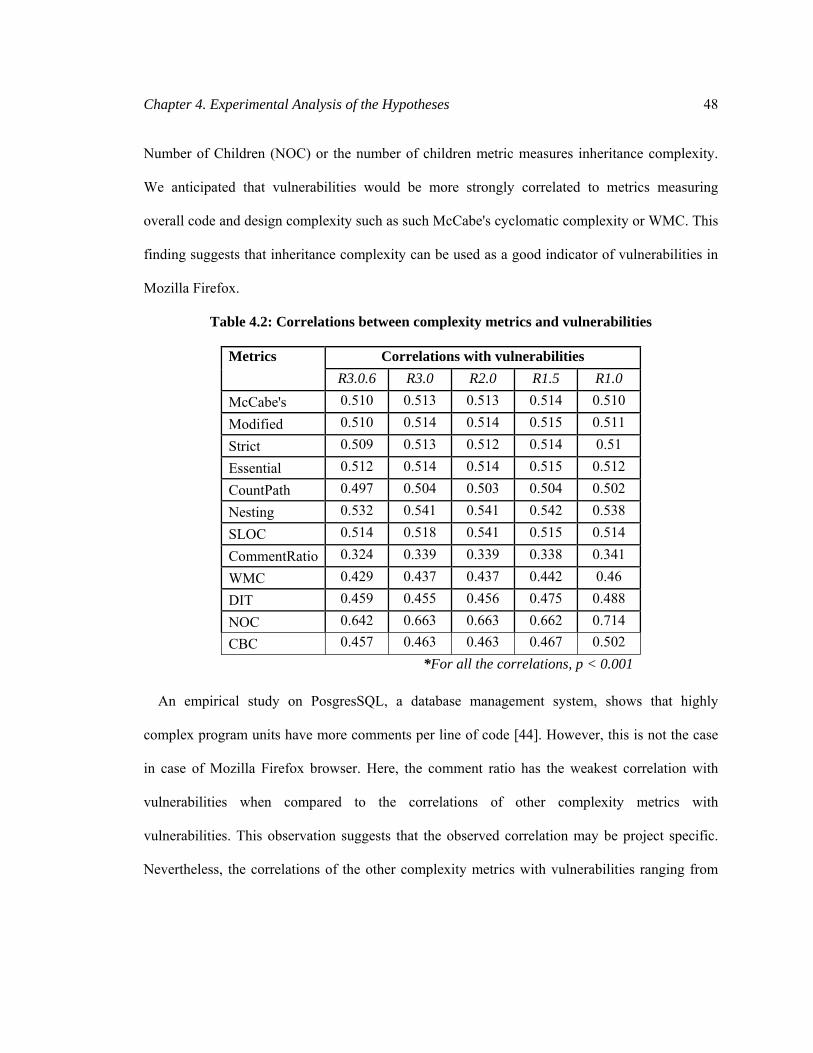
Chapter 4. Experimental Analysis of the Hypotheses 48
Number of Children (NOC) or the number of children metric measures inheritance complexity.
We anticipated that vulnerabilities would be more strongly correlated to metrics measuring
overall code and design complexity such as such McCabe's cyclomatic complexity or WMC. This
finding suggests that inheritance complexity can be used as a good indicator of vulnerabilities in
Mozilla Firefox.
Table 4.2: Correlations between complexity metrics and vulnerabilities
Metrics Correlations with vulnerabilities R3.0.6 R3.0 R2.0 R1.5 R1.0
McCabe's 0.510 0.513 0.513 0.514 0.510 Modified 0.510 0.514 0.514 0.515 0.511 Strict 0.509 0.513 0.512 0.514 0.51 Essential 0.512 0.514 0.514 0.515 0.512 CountPath 0.497 0.504 0.503 0.504 0.502 Nesting 0.532 0.541 0.541 0.542 0.538 SLOC 0.514 0.518 0.541 0.515 0.514 CommentRatio 0.324 0.339 0.339 0.338 0.341 WMC 0.429 0.437 0.437 0.442 0.46 DIT 0.459 0.455 0.456 0.475 0.488 NOC 0.642 0.663 0.663 0.662 0.714 CBC 0.457 0.463 0.463 0.467 0.502
*For all the correlations, p < 0.001
An empirical study on PosgresSQL, a database management system, shows that highly
complex program units have more comments per line of code [44]. However, this is not the case
in case of Mozilla Firefox browser. Here, the comment ratio has the weakest correlation with
vulnerabilities when compared to the correlations of other complexity metrics with
vulnerabilities. This observation suggests that the observed correlation may be project specific.
Nevertheless, the correlations of the other complexity metrics with vulnerabilities ranging from
Chapter 4. Experimental Analysis of the Hypotheses 49
0.4 to more than 0.5 with p < 0.001 suggest overall moderate but significant association. Thus,
these metrics can also be used as indicators of vulnerabilities in Mozilla Firefox. It is already
mentioned in the previous chapter that some of the vulnerabilities are fixed in more than one
release, e.g., MFSA 2008-65 is fixed in releases 2.0.0.20 and 2.0.0.19 (see Figure 3.2). Therefore,
some of the vulnerability fixes are overlapping across some releases, i.e., they are dependent.
This is why it is natural to have low p-values.
Interestingly, SLOC, a straight-forward metric like the number of executable lines of code, is
as strongly correlated to vulnerabilities as any of the other well-established complexity metrics.
However, prior research, e.g., the one by Briand et al. [5], has empirically validated that
component sizes (in terms of lines of code) are correlated to the number of failures in the
operational stage.
4.1.2 Experiment 2: Associating Vulnerability with Coupling (H2)
We conduct this experiment to test hypothesis H2 that coupling metrics positively correlate to
the number of vulnerabilities. We have computed the Spearman rank correlation between the
coupling metrics and vulnerabilities for the five releases of Mozilla Firefox as in Experiment 1.
Table 4.3 presents the correlations (for all the correlations, p < 0.001). We observe from the table
that all the coupling metrics are generally positively correlated to the number of vulnerabilities in
Mozilla Firefox across all five studied releases. This unequivocally suggests that highly coupled
files have higher number of vulnerabilities.
Similar to Experiment 1 for testing hypothesis H1, we observe in Table 4.3 that the Number of
Children (NOC) metric is the best indicator of vulnerabilities. We anticipated that vulnerabilities
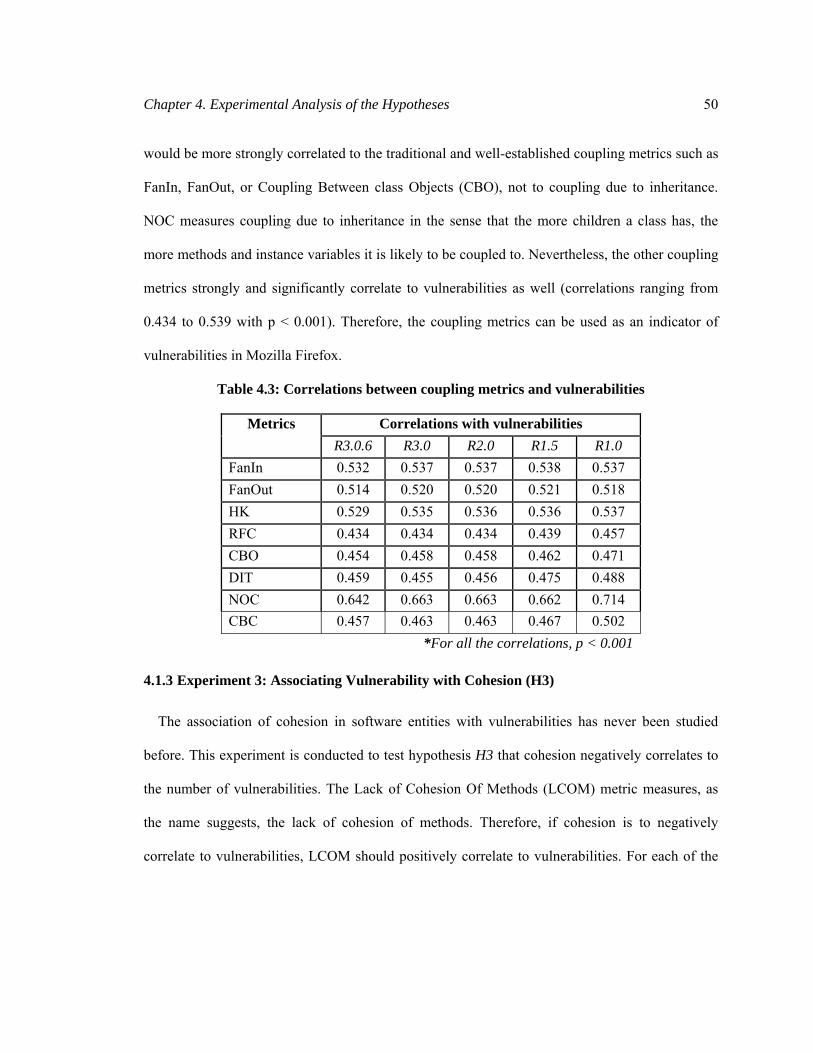
Chapter 4. Experimental Analysis of the Hypotheses 50
would be more strongly correlated to the traditional and well-established coupling metrics such as
FanIn, FanOut, or Coupling Between class Objects (CBO), not to coupling due to inheritance.
NOC measures coupling due to inheritance in the sense that the more children a class has, the
more methods and instance variables it is likely to be coupled to. Nevertheless, the other coupling
metrics strongly and significantly correlate to vulnerabilities as well (correlations ranging from
0.434 to 0.539 with p < 0.001). Therefore, the coupling metrics can be used as an indicator of
vulnerabilities in Mozilla Firefox.
Table 4.3: Correlations between coupling metrics and vulnerabilities
Metrics Correlations with vulnerabilities R3.0.6 R3.0 R2.0 R1.5 R1.0
FanIn 0.532 0.537 0.537 0.538 0.537 FanOut 0.514 0.520 0.520 0.521 0.518 HK 0.529 0.535 0.536 0.536 0.537 RFC 0.434 0.434 0.434 0.439 0.457 CBO 0.454 0.458 0.458 0.462 0.471 DIT 0.459 0.455 0.456 0.475 0.488 NOC 0.642 0.663 0.663 0.662 0.714 CBC 0.457 0.463 0.463 0.467 0.502
*For all the correlations, p < 0.001
4.1.3 Experiment 3: Associating Vulnerability with Cohesion (H3)
The association of cohesion in software entities with vulnerabilities has never been studied
before. This experiment is conducted to test hypothesis H3 that cohesion negatively correlates to
the number of vulnerabilities. The Lack of Cohesion Of Methods (LCOM) metric measures, as
the name suggests, the lack of cohesion of methods. Therefore, if cohesion is to negatively
correlate to vulnerabilities, LCOM should positively correlate to vulnerabilities. For each of the
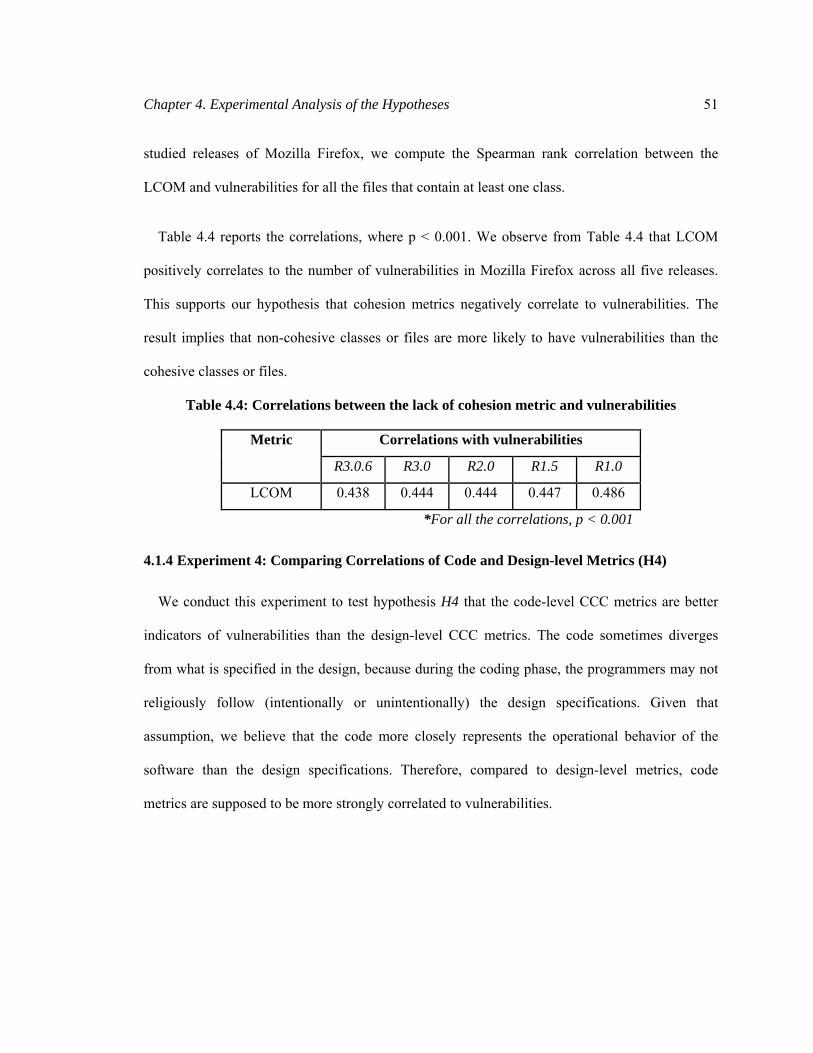
Chapter 4. Experimental Analysis of the Hypotheses 51
studied releases of Mozilla Firefox, we compute the Spearman rank correlation between the
LCOM and vulnerabilities for all the files that contain at least one class.
Table 4.4 reports the correlations, where p < 0.001. We observe from Table 4.4 that LCOM
positively correlates to the number of vulnerabilities in Mozilla Firefox across all five releases.
This supports our hypothesis that cohesion metrics negatively correlate to vulnerabilities. The
result implies that non-cohesive classes or files are more likely to have vulnerabilities than the
cohesive classes or files.
Table 4.4: Correlations between the lack of cohesion metric and vulnerabilities
Metric Correlations with vulnerabilities
R3.0.6 R3.0 R2.0 R1.5 R1.0
LCOM 0.438 0.444 0.444 0.447 0.486
*For all the correlations, p < 0.001
4.1.4 Experiment 4: Comparing Correlations of Code and Design-level Metrics (H4)
We conduct this experiment to test hypothesis H4 that the code-level CCC metrics are better
indicators of vulnerabilities than the design-level CCC metrics. The code sometimes diverges
from what is specified in the design, because during the coding phase, the programmers may not
religiously follow (intentionally or unintentionally) the design specifications. Given that
assumption, we believe that the code more closely represents the operational behavior of the
software than the design specifications. Therefore, compared to design-level metrics, code
metrics are supposed to be more strongly correlated to vulnerabilities.
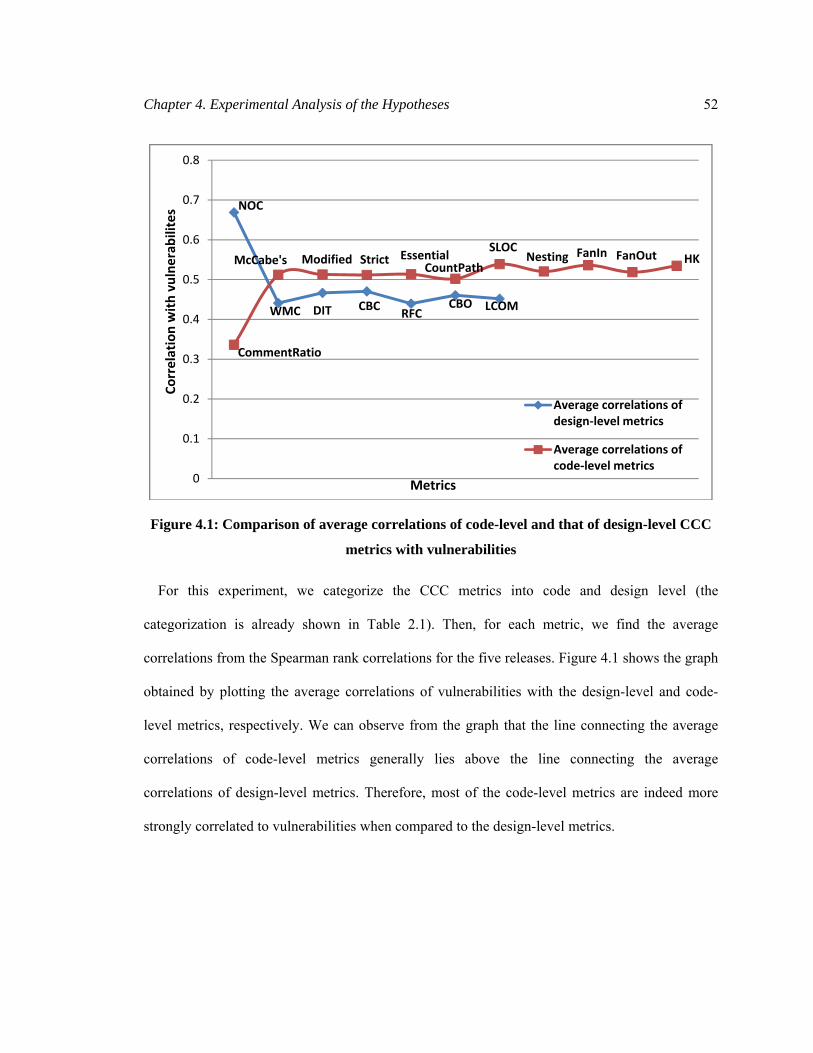
Chapter 4. Experimental Analysis of the Hypotheses 52
Figure 4.1: Comparison of average correlations of code-level and that of design-level CCC
metrics with vulnerabilities
For this experiment, we categorize the CCC metrics into code and design level (the
categorization is already shown in Table 2.1). Then, for each metric, we find the average
correlations from the Spearman rank correlations for the five releases. Figure 4.1 shows the graph
obtained by plotting the average correlations of vulnerabilities with the design-level and code-
level metrics, respectively. We can observe from the graph that the line connecting the average
correlations of code-level metrics generally lies above the line connecting the average
correlations of design-level metrics. Therefore, most of the code-level metrics are indeed more
strongly correlated to vulnerabilities when compared to the design-level metrics.
WMC DIT
NOC
CBC RFCCBO LCOM
CommentRatio
McCabe's Modified Strict EssentialCountPath
NestingSLOC FanIn FanOut HK
0
0.1
0.2
0.3
0.4
0.5
0.6
0.7
0.8Co
rrelation with vulnerab
ilites
Metrics
Average correlations of design‐level metrics
Average correlations of code‐level metrics

Chapter 4. Experimental Analysis of the Hypotheses 53
However, there are two exceptions. First, vulnerabilities are not as strongly correlated to the
CommentRatio code-level metric as they are to the design-level metrics. Second, the NOC
design-level metric shows the strongest correlation with vulnerabilities of all the metrics, more
than any of the code-level metrics. Although the experimental results support H4 in general, there
are counterexamples as well. Therefore, H4 should be revised as “most of the code-level
complexity, coupling, and cohesion metrics are better indicators of vulnerabilities than that of
design-level metrics”.
Although the correlations between code-level metrics and vulnerabilities are stronger than the
correlations between design-level metrics and vulnerabilities, it should be noted that both design-
level and code-level CCC metrics are strongly correlated to vulnerabilities. Therefore, the design-
level metrics can help developers to find the classes that require more careful design. After that,
the code-level metrics can help them to identify the code sections that require careful inspection,
refactoring, or rigorous testing.
4.1.5 Experiment 5: Analyzing the Consistency of Correlations (H5)
We conduct this experiment to test hypothesis H5 that there is a subset of metrics that
consistently correlate to vulnerabilities in all releases. If the values of correlations are stable for
all the releases, we can conclude that the metrics can be dependably used as vulnerability
indicators. Nagappan emphasizes that “for the early indicators to be meaningful, they must be
related (in a statistically significant and stable way) to the field quality of the product” [55].
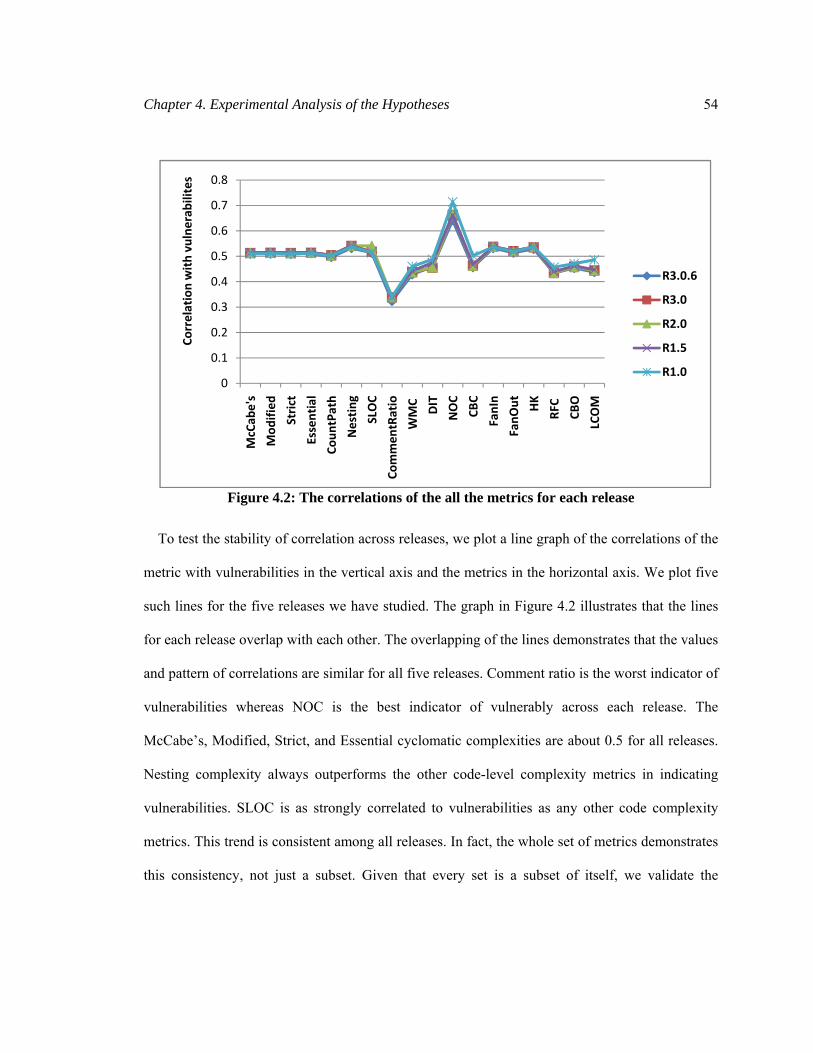
Chapter 4. Experimental Analysis of the Hypotheses 54
Figure 4.2: The correlations of the all the metrics for each release
To test the stability of correlation across releases, we plot a line graph of the correlations of the
metric with vulnerabilities in the vertical axis and the metrics in the horizontal axis. We plot five
such lines for the five releases we have studied. The graph in Figure 4.2 illustrates that the lines
for each release overlap with each other. The overlapping of the lines demonstrates that the values
and pattern of correlations are similar for all five releases. Comment ratio is the worst indicator of
vulnerabilities whereas NOC is the best indicator of vulnerably across each release. The
McCabe’s, Modified, Strict, and Essential cyclomatic complexities are about 0.5 for all releases.
Nesting complexity always outperforms the other code-level complexity metrics in indicating
vulnerabilities. SLOC is as strongly correlated to vulnerabilities as any other code complexity
metrics. This trend is consistent among all releases. In fact, the whole set of metrics demonstrates
this consistency, not just a subset. Given that every set is a subset of itself, we validate the
0
0.1
0.2
0.3
0.4
0.5
0.6
0.7
0.8
McCab
e's
Mod
ified
Strict
Essential
Coun
tPath
Nesting
SLOC
Commen
tRatio
WMC
DIT
NOC
CBC
FanIn
FanO
ut HK
RFC
CBO
LCOM
Correlation with vulnerab
ilites
R3.0.6
R3.0
R2.0
R1.5
R1.0

Chapter 4. Experimental Analysis of the Hypotheses 55
hypothesis (with respect to Mozilla Firefox) that there is a subset of metrics that correlate to
vulnerabilities in all releases.
4.2 Summary
In this chapter, we provide empirical evidence that complex, coupled, and non-cohesive
software entities are less secure. By conducting a case study on five releases of Mozilla Firefox,
we validate the five hypotheses about the underlying relationships between CCC metrics and
vulnerabilities. From the correlation analysis conducted on the CCC metrics of five major
releases and over four years of vulnerability history, we can conclude that in Mozilla Firefox:
• Complexity, coupling, and lack of cohesion metrics positively correlate to the number of
vulnerabilities at a statistically significant level. The correlation is on average 0.5
(approximately) with p < 0.001.
• Generally, vulnerabilities are more strongly correlated to code-level CCC metrics than that to
design-level CCC metrics. However, NOC, the design-level metric measuring inheritance
complexity and coupling, shows the strongest correlation with vulnerabilities.
• The CCC metrics are consistently correlated to vulnerabilities across several releases of
Mozilla Firefox. The stable correlation patterns imply that, once calibrated to a specific
project, the metrics can be dependably used to indicate vulnerabilities for new releases.
Given that CCC metrics are consistently correlated to vulnerabilities across several releases of
Mozilla Firefox, these metrics can be also be used to automatically predict vulnerability-prone

Chapter 4. Experimental Analysis of the Hypotheses 56
files. The next chapter reveals the results of automatic prediction of vulnerability-prone files
based on their CCC metrics.

57
Chapter 5
Automatic Prediction of Vulnerabilities
In this chapter, we employ complexity, coupling, and cohesion (CCC) metrics to automatically
predict vulnerability-prone entities. Recollect that a framework to predict vulnerabilities using
CCC metrics is presented in the introduction (Chapter 1) of this thesis. This chapter describes
how to build the vulnerability predictors and measures how accurate the predictors are when
applied to predict vulnerability-proneness for new files in Mozilla Firefox.
The rest of the chapter is organized as follows. First, we explain the dependent and
independent variables of the prediction task at hand. This is followed by the definitions of a
number of performance measures used to quantitatively evaluate the performances of the
vulnerability predictors developed by using several statistical and machine learning techniques.
We then describe the implementation and parameter initialization of these techniques that can be
used to build the predictors. We also show that the predictors must be trained on a balanced data-
set to avoid the problem of over-fitting. Finally, we present the result of vulnerability prediction
using different statistical and machine learning techniques and discuss the implications of the
results.
5.1 Dependent and Independent Variables
A variable is any measureable characteristic, whether of a person, a situation, a piece of
software, or anything else. In the context of prediction, a dependent variable is one about which
we make a prediction; an independent variable is one that is used to make the prediction. For
Chapter 5. Automatic Prediction of Vulnerabilities 58
example, the average age of death could be a dependent variable, and age and gender might be
used as independent variables to predict average age of death.
In our case, we are trying to predict whether a file in Mozilla Firefox is vulnerability-prone or
not (dependent variable). Since we identify the location of a vulnerability from the location of its
fix (i.e. which file the fix is in), predicting the occurrences of vulnerability fixes is equivalent to
predicting the likelihood of having post-release vulnerabilities in that file. It is typical for a
vulnerability fix to involve several files, and we therefore count the number of vulnerability fixes
that were required in that file for developing the next release n+1. This aims at capturing the
vulnerability-proneness of a file in the current release n. Furthermore, as reported in Section 3.1,
only a very small portion of files undergo more than one vulnerability fix for a given release, so
finding vulnerability-proneness in release n is treated as a classification problem and is estimated
as the probability that a given file will undergo one or more vulnerability corrections in release
n+1.
The independent variables are the CCC metrics already defined in Table 2.1. The fundamental
hypothesis underlying our work is that the vulnerability-proneness of entities may be affected by
their complexity, coupling, and cohesion-related structural characteristics.
5.2 Prediction Performance Measures
The performance of a predictor can be measured in several ways. Most frequently used
measures are accuracy, recall, precision, false positive rate, and false negative rate. For the two-
class problem (e.g., vulnerability-prone or not vulnerability-prone), these performance measures
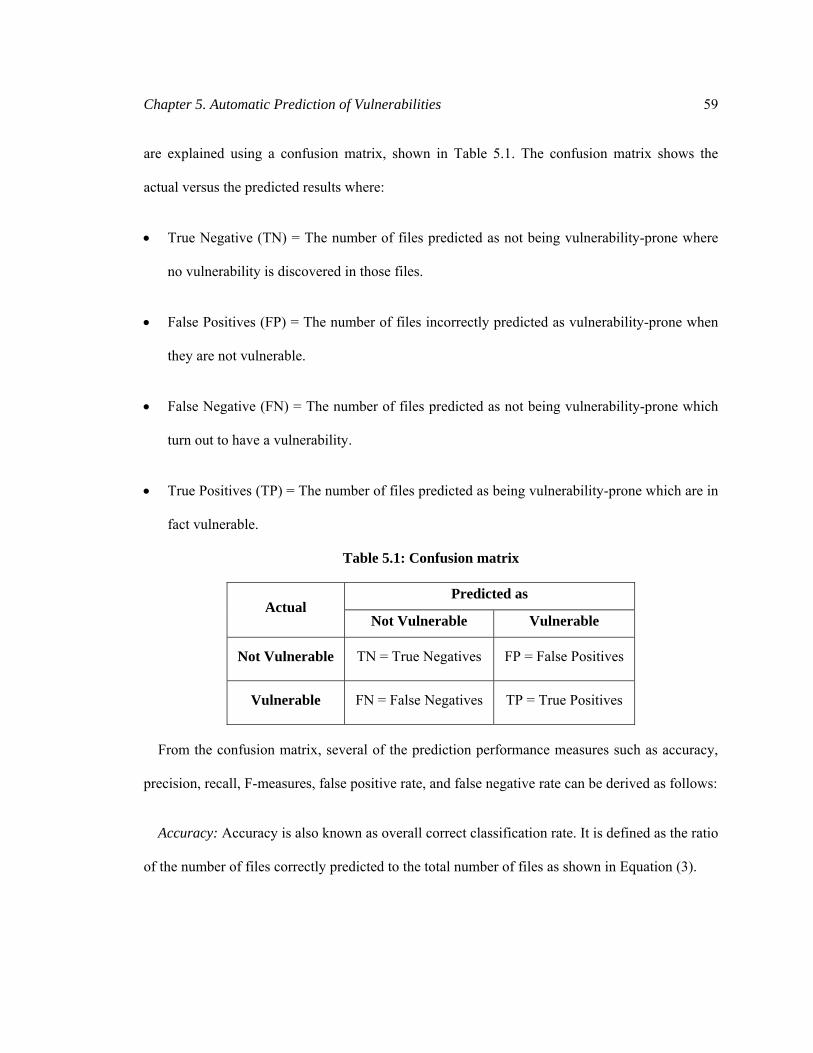
Chapter 5. Automatic Prediction of Vulnerabilities 59
are explained using a confusion matrix, shown in Table 5.1. The confusion matrix shows the
actual versus the predicted results where:
• True Negative (TN) = The number of files predicted as not being vulnerability-prone where
no vulnerability is discovered in those files.
• False Positives (FP) = The number of files incorrectly predicted as vulnerability-prone when
they are not vulnerable.
• False Negative (FN) = The number of files predicted as not being vulnerability-prone which
turn out to have a vulnerability.
• True Positives (TP) = The number of files predicted as being vulnerability-prone which are in
fact vulnerable.
Table 5.1: Confusion matrix
Actual Predicted as
Not Vulnerable Vulnerable
Not Vulnerable TN = True Negatives FP = False Positives
Vulnerable FN = False Negatives TP = True Positives
From the confusion matrix, several of the prediction performance measures such as accuracy,
precision, recall, F-measures, false positive rate, and false negative rate can be derived as follows:
Accuracy: Accuracy is also known as overall correct classification rate. It is defined as the ratio
of the number of files correctly predicted to the total number of files as shown in Equation (3).

Chapter 5. Automatic Prediction of Vulnerabilities 60
Precision: Precision, also known as the correctness, measures the efficiency of prediction. It is
defined as the ratio of the number of files correctly predicted as vulnerability-prone to the total
number of files predicted as vulnerability-prone, as shown in Equation (4).
(4)
Recall: Recall is the vulnerable entity detection rate which quantifies the effectiveness of a
predictor. It is defined as the ratio of the number of files correctly predicted as vulnerability-prone
to the total number of files that are actually vulnerable. The formulae to calculate recall is given
in Equation (5).
(5)
Both precision and recall are important performance measures. The higher the precision, the
less effort wasted in testing and inspection, and the higher the recall, the fewer vulnerable files go
undetected. Unfortunately, there is a trade-off between precision and recall. For example, if a
predictor predicts only one file as vulnerability-prone and this file is actually vulnerable, the
precision will be 100%. However, the predictor’s recall will be low if there are other vulnerable
files. In another example, if a predictor predicts all files as vulnerable, the recall will be 100%,
but its precision will be low. Therefore, a measure is needed which combines recall and precision
in a single efficiency measure.
(3)
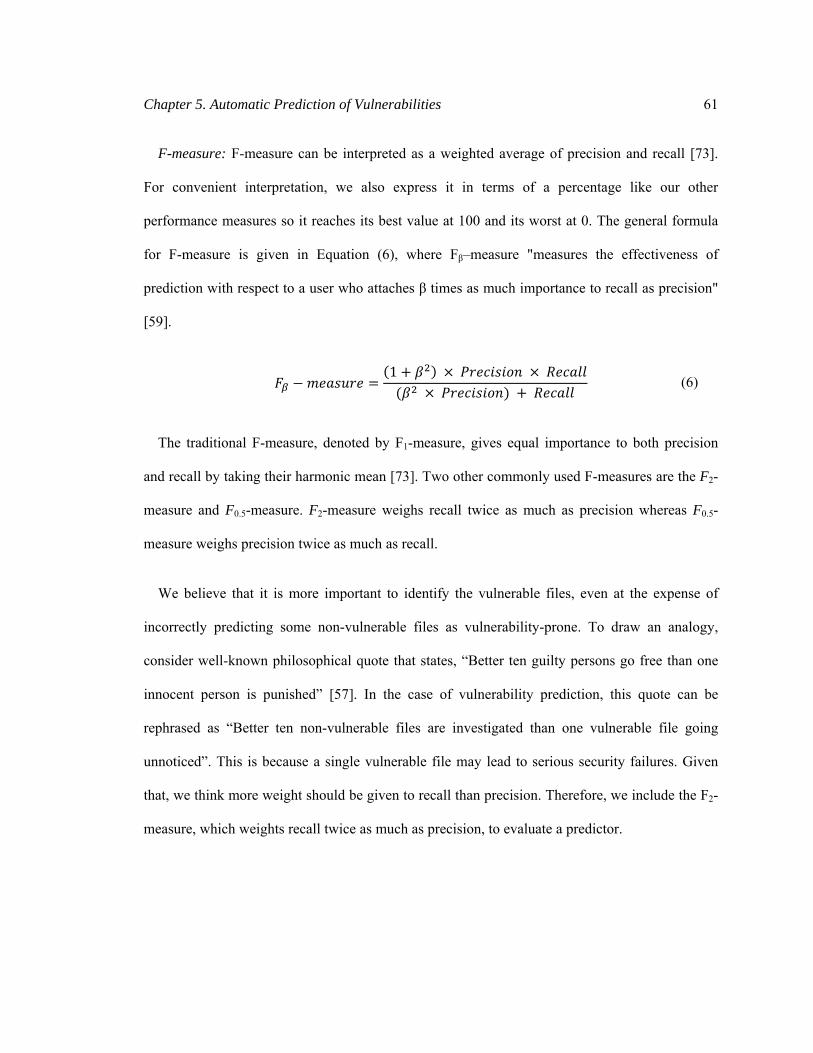
Chapter 5. Automatic Prediction of Vulnerabilities 61
F-measure: F-measure can be interpreted as a weighted average of precision and recall [73].
For convenient interpretation, we also express it in terms of a percentage like our other
performance measures so it reaches its best value at 100 and its worst at 0. The general formula
for F-measure is given in Equation (6), where Fβ–measure "measures the effectiveness of
prediction with respect to a user who attaches β times as much importance to recall as precision"
[59].
1 (6)
The traditional F-measure, denoted by F1-measure, gives equal importance to both precision
and recall by taking their harmonic mean [73]. Two other commonly used F-measures are the F2-
measure and F0.5-measure. F2-measure weighs recall twice as much as precision whereas F0.5-
measure weighs precision twice as much as recall.
We believe that it is more important to identify the vulnerable files, even at the expense of
incorrectly predicting some non-vulnerable files as vulnerability-prone. To draw an analogy,
consider well-known philosophical quote that states, “Better ten guilty persons go free than one
innocent person is punished” [57]. In the case of vulnerability prediction, this quote can be
rephrased as “Better ten non-vulnerable files are investigated than one vulnerable file going
unnoticed”. This is because a single vulnerable file may lead to serious security failures. Given
that, we think more weight should be given to recall than precision. Therefore, we include the F2-
measure, which weights recall twice as much as precision, to evaluate a predictor.

Chapter 5. Automatic Prediction of Vulnerabilities 62
Some researchers choose to use the false positive rate (FP rate) and the false negative rate (FN
rate) instead of precision and recall. Ostrand and Weyuker [58] in particular argue that false
positive rate (Type I misclassifications) and false negative rate (Type II misclassifications) are the
most important measures. We also believe that these measures are effective in evaluating
vulnerability prediction models. They are defined as follows:
TNFP
FPrateFP+
= (7)
FNTPFNrateFN+
=
(8)
A high FN rate indicates that there is a risk of overlooking vulnerabilities, whereas a high FP
rate indicates effort may be wasted in investigating the predicted vulnerable entities. These
notions are highly related to recall and precision; in fact, recall = 1 – FN rate and precision is
inversely proportional to FP rate. Therefore, it is redundant to use all of them to indicate
prediction performance.
In this study, we use accuracy, recall and FN rate as employed in [39]. All these measures are
expressed in percentages. In addition, we use F1-measure and F2-measure to quantitatively
evaluate and compare the predictors.
5.3 Implementation and Parameter Initialization
WEKA (Waikato Environment for Knowledge Analysis) is a popular, open source toolkit
implemented in Java for machine learning and data mining tasks [72] that we chose for
implementing the four statistical and machine learning techniques discussed in Section 2.2 of
Chapter 5. Automatic Prediction of Vulnerabilities 63
Chapter 2. The parameters for each of the investigated techniques are initialized mostly with the
default settings of the WEKA toolkit such as follows:
• C4.5 Decision Tree (DT): We use the well-known J48 WEKA-implementation of the C4.5
algorithm to generate a decision tree. The confidence factor used for pruning is set at 25%
and the minimum number of instances per leaf is set at 10. A higher confidence factor incurs
more pruning of a decision tree, where pruning refers to discarding one or more sub-trees and
replacing them with leaves to simplify a decision tree (while not increasing error rates).
• Random forest (RF): The number of trees to be generated is set at 10; the number of input
variables randomly selected at each node is set at 2; and each tree is allowed to grow to the
largest extent possible, i.e. the maximum depth of the tree is unlimited.
• Logistic Regression (LR): In WEKA, LogitBoost7 with simple regression functions as base
learners is used for fitting the logistic models (see Equation 1 in Section 2.2.3 for an example
of a logistic model). The optimal number of LogitBoost iterations to perform is cross-
validated, which leads to automatic attribute/feature selection (for more information, read
[41]). The heuristicStop is set to 50. If heuristicStop > 0, the heuristic for greedy stopping
while cross-validating the number of LogitBoost iterations is enabled. This means LogitBoost
is stopped if no new error minimum has been reached in the last heuristicStop iterations. It is
recommended to use this heuristic as it gives a large speed-up especially on small datasets.
7 “LogitBoost is a boosting based machine learning algorithm that uses a set of weak predictors to create a single strong learner. A weak learner is defined to be a classifier which is only slightly correlated with the true classification. In contrast, a strong learner is a classifier that is arbitrarily well correlated with the true classification” [41].

Chapter 5. Automatic Prediction of Vulnerabilities 64
The maximum number of iterations for LogitBoost is set at 500. For very small/large datasets
a lower/higher value might be preferable.
• Naïve-Bayes (NB): The useSupervisedDiscretization is set to False so that continuous,
numeric attributes (in our case the CCC metrics) are not converted to discretized or nominal
ones. Discretization refers to the process of converting continuous features or variables to
nominal or categorical features. NB does not require any numeric parameters to be initialized.
In addition to the above parameter initializations, a default threshold (cut-off) of 0.5 is used for
all techniques to classify an entity as vulnerability-prone if the predicted probability is higher than
the threshold.
There is scope to improve the prediction performance by experimenting with these parameters.
However, as we will see in later sections of this chapter, it is possible to predict vulnerability-
prone files with reasonable accuracy even with the aforementioned default parameters. This
proves our point that CCC metrics can be useful additions in vulnerability prediction. The main
objective for considering several learning techniques is to demonstrate the efficacy of
vulnerability prediction using CCC metrics irrespective of what technique is used, and not
necessarily to determine what the best learning technique is. Therefore, in this thesis, we do not
attempt to optimize the parameters for higher accuracy.
5.4 Need for a Balanced Training Set
To build and evaluate the predictors, file-level CCC metrics and vulnerability data from the 52
releases of Mozilla Firefox are used. There are 718 vulnerable files (minority category) as
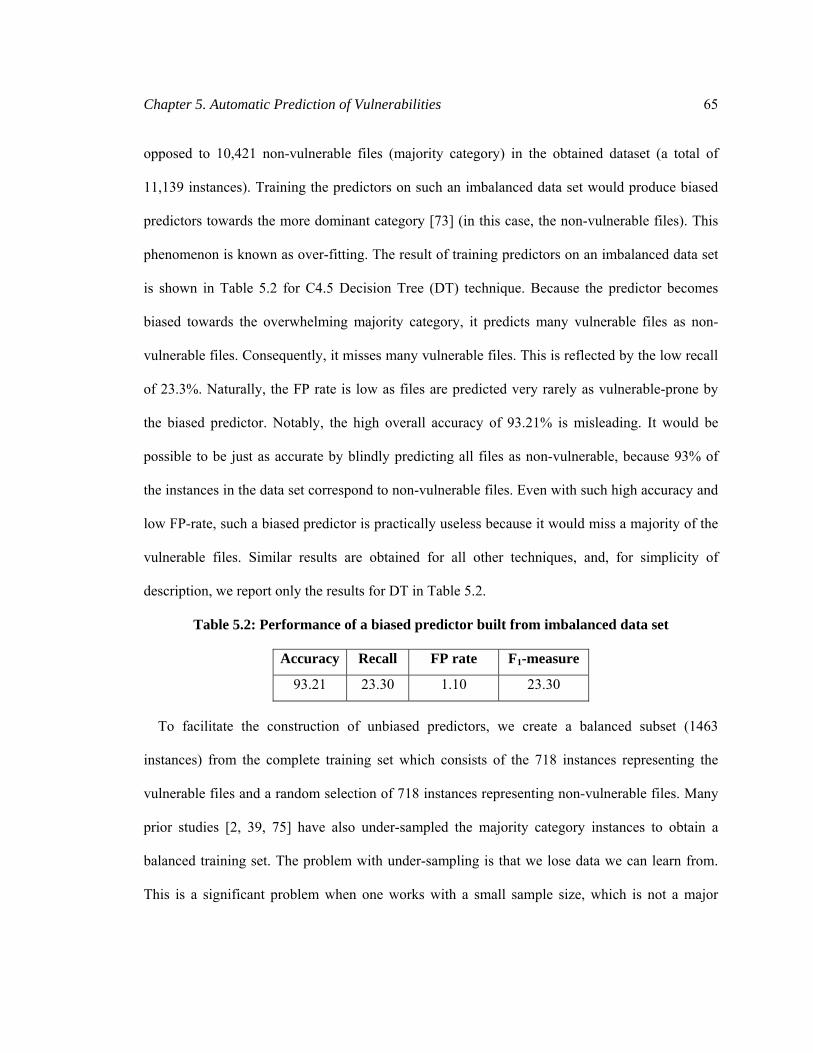
Chapter 5. Automatic Prediction of Vulnerabilities 65
opposed to 10,421 non-vulnerable files (majority category) in the obtained dataset (a total of
11,139 instances). Training the predictors on such an imbalanced data set would produce biased
predictors towards the more dominant category [73] (in this case, the non-vulnerable files). This
phenomenon is known as over-fitting. The result of training predictors on an imbalanced data set
is shown in Table 5.2 for C4.5 Decision Tree (DT) technique. Because the predictor becomes
biased towards the overwhelming majority category, it predicts many vulnerable files as non-
vulnerable files. Consequently, it misses many vulnerable files. This is reflected by the low recall
of 23.3%. Naturally, the FP rate is low as files are predicted very rarely as vulnerable-prone by
the biased predictor. Notably, the high overall accuracy of 93.21% is misleading. It would be
possible to be just as accurate by blindly predicting all files as non-vulnerable, because 93% of
the instances in the data set correspond to non-vulnerable files. Even with such high accuracy and
low FP-rate, such a biased predictor is practically useless because it would miss a majority of the
vulnerable files. Similar results are obtained for all other techniques, and, for simplicity of
description, we report only the results for DT in Table 5.2.
Table 5.2: Performance of a biased predictor built from imbalanced data set
Accuracy Recall FP rate F1-measure
93.21 23.30 1.10 23.30
To facilitate the construction of unbiased predictors, we create a balanced subset (1463
instances) from the complete training set which consists of the 718 instances representing the
vulnerable files and a random selection of 718 instances representing non-vulnerable files. Many
prior studies [2, 39, 75] have also under-sampled the majority category instances to obtain a
balanced training set. The problem with under-sampling is that we lose data we can learn from.
This is a significant problem when one works with a small sample size, which is not a major
Chapter 5. Automatic Prediction of Vulnerabilities 66
problem in our case. The other possible technique would be to perform over-sampling of the
minority category, i.e., duplicating the instances representing vulnerable files. Oversampling the
minority category can raise their weight to decrease their error rate. The same result can be
achieved with an under-sampling technique, which also speeds up the predictor building
significantly by reducing the size of the dataset.
As opposed to these sampling techniques, cost-based prediction can be adopted to deal with the
imbalanced data set. In cost-based prediction, we could set higher weights to instances
representing vulnerable files. Then the error in predicting the minority class would decrease at the
expense of the increase in the overall prediction error. In addition, the interpretation of standard
prediction performance measures would become unintuitive [73].
With a balanced data set, the proportion of vulnerable and non-vulnerable files is exactly 50%.
Therefore, a random prediction is likely to be correct 50% of the time. For the predictors to prove
useful, they should be correct more than 50% of the time when classifying into either vulnerable
or non-vulnerable files. We will be able to evaluate the usefulness of the predictors from the
results presented in the next section.
5.5 Results and Discussions
This section presents the results of predicting vulnerability-prone files in Mozilla Firefox based
on complexity, coupling, and cohesion (CCC) metrics. These results will help us quantitatively
evaluate the usefulness of using CCC metrics for vulnerability prediction.
Chapter 5. Automatic Prediction of Vulnerabilities 67
5.5.1 Prediction Performance of Different Techniques
We have considered four alternative data mining and statistical techniques – C4.5 Decision
Trees (DT), Random Forests (RF), Logistic Regression (LR), and Naïve-Bayes (NB) – and
compared their prediction performances. Using DT as the baseline scheme, we perform a
statistical significance test to determine whether the differences in performance measures by other
techniques are statistically significant. The term statistical significance refers to the result of a
pair-wise comparison of schemes using either a standard t-test or the corrected re-sampled t-test
[16]. We used the latter t-test, because the standard t-test can generate too many significant
differences due to dependencies in the estimates (in particular when anything other than one run
of an x-fold cross-validation is used). As the significance level decreases, the confidence in the
conclusion increases. Traditionally, a significance level of less than or equal to 0.05 (the 95%
confidence level) is considered statistically significant. Therefore, we have performed the
corrected re-sampled t-test at 0.05 significance.
The results are obtained by performing a 10-fold cross-validation to reduce variability in the
prediction. Cross-validation is a technique for assessing how accurately a predictive model will
perform in practice [73]. The dataset is randomly partitioned into 10 bins of equal size. For 10
different runs, 9 bins are picked to train the predictors and the remaining bin is used to test them,
each time leaving out a different bin for testing. We use stratified sampling to make sure that
roughly the same proportion of vulnerable and non-vulnerable files are present in each bin while
making the random partitions. In addition, to reduce the chances for the predictors to be overly
influenced by peculiarities of any given release, we randomly select training sets across the
releases. Finally, we compute the mean and the standard deviation for each performance measure
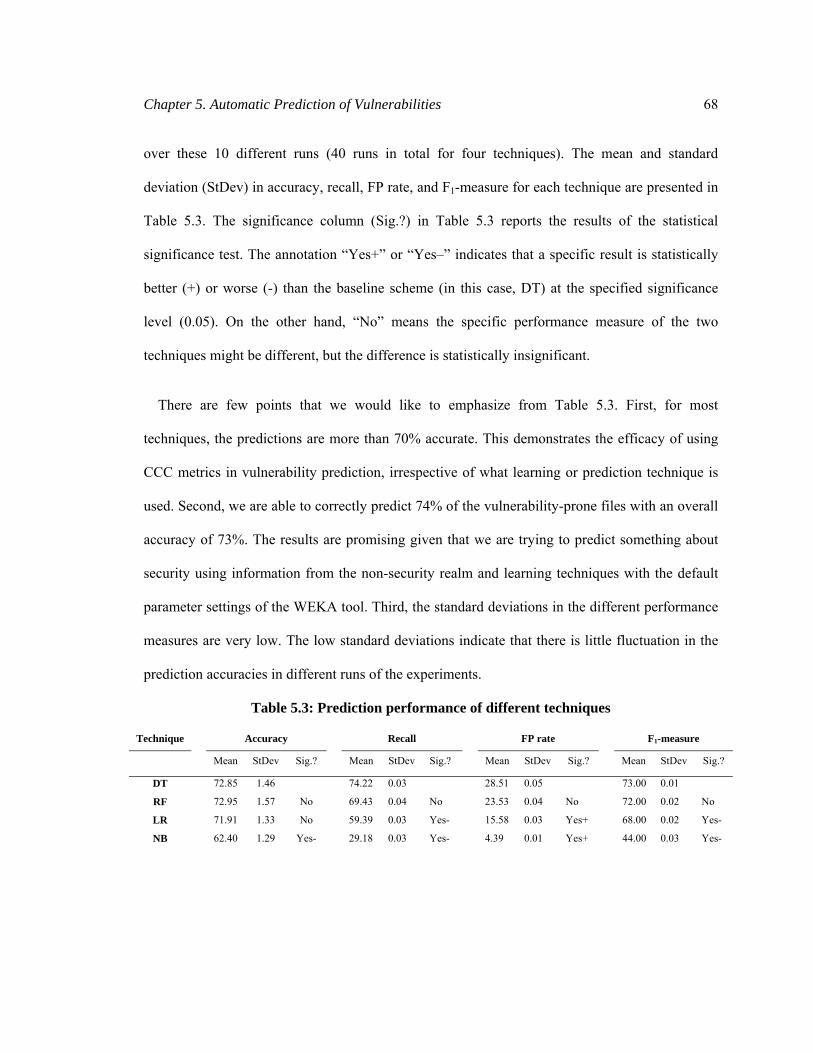
Chapter 5. Automatic Prediction of Vulnerabilities 68
over these 10 different runs (40 runs in total for four techniques). The mean and standard
deviation (StDev) in accuracy, recall, FP rate, and F1-measure for each technique are presented in
Table 5.3. The significance column (Sig.?) in Table 5.3 reports the results of the statistical
significance test. The annotation “Yes+” or “Yes–” indicates that a specific result is statistically
better (+) or worse (-) than the baseline scheme (in this case, DT) at the specified significance
level (0.05). On the other hand, “No” means the specific performance measure of the two
techniques might be different, but the difference is statistically insignificant.
There are few points that we would like to emphasize from Table 5.3. First, for most
techniques, the predictions are more than 70% accurate. This demonstrates the efficacy of using
CCC metrics in vulnerability prediction, irrespective of what learning or prediction technique is
used. Second, we are able to correctly predict 74% of the vulnerability-prone files with an overall
accuracy of 73%. The results are promising given that we are trying to predict something about
security using information from the non-security realm and learning techniques with the default
parameter settings of the WEKA tool. Third, the standard deviations in the different performance
measures are very low. The low standard deviations indicate that there is little fluctuation in the
prediction accuracies in different runs of the experiments.
Table 5.3: Prediction performance of different techniques
Technique Accuracy Recall FP rate F1-measure
Mean StDev Sig.? Mean StDev Sig.? Mean StDev Sig.? Mean StDev Sig.?
DT 72.85 1.46 74.22 0.03 28.51 0.05 73.00 0.01
RF 72.95 1.57 No 69.43 0.04 No 23.53 0.04 No 72.00 0.02 No
LR 71.91 1.33 No 59.39 0.03 Yes- 15.58 0.03 Yes+ 68.00 0.02 Yes-
NB 62.40 1.29 Yes- 29.18 0.03 Yes- 4.39 0.01 Yes+ 44.00 0.03 Yes-
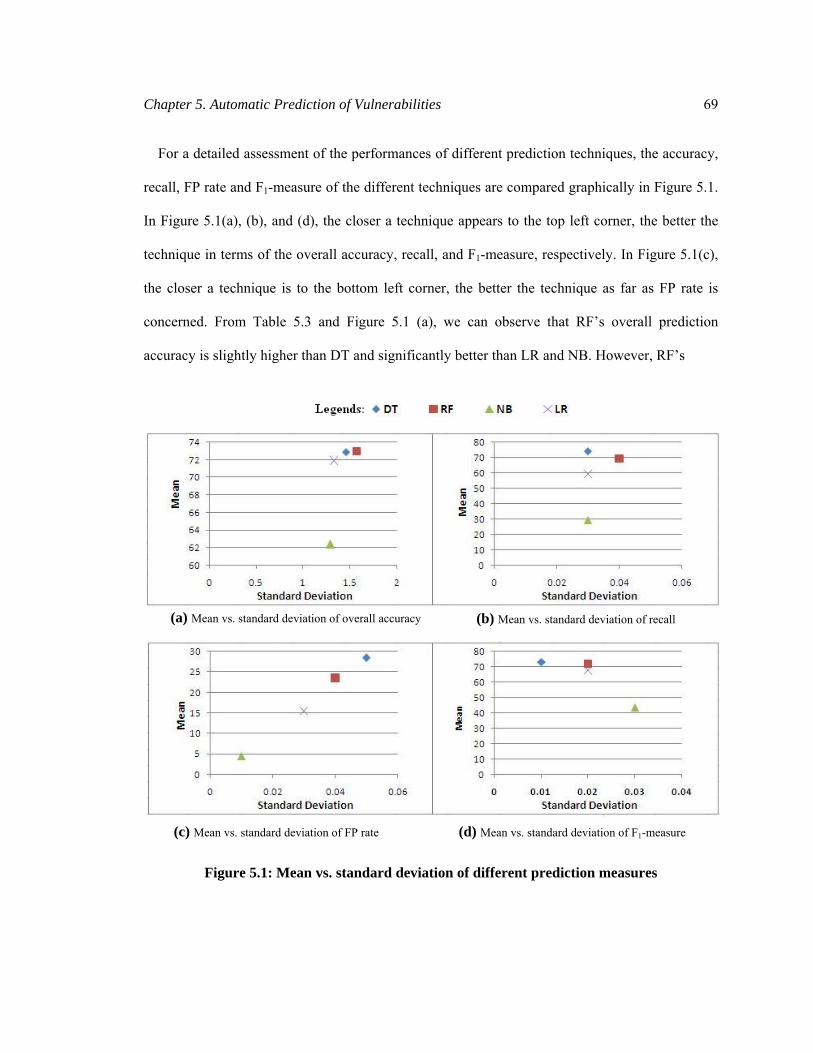
Chapter 5. Automatic Prediction of Vulnerabilities 69
For a detailed assessment of the performances of different prediction techniques, the accuracy,
recall, FP rate and F1-measure of the different techniques are compared graphically in Figure 5.1.
In Figure 5.1(a), (b), and (d), the closer a technique appears to the top left corner, the better the
technique in terms of the overall accuracy, recall, and F1-measure, respectively. In Figure 5.1(c),
the closer a technique is to the bottom left corner, the better the technique as far as FP rate is
concerned. From Table 5.3 and Figure 5.1 (a), we can observe that RF’s overall prediction
accuracy is slightly higher than DT and significantly better than LR and NB. However, RF’s
Figure 5.1: Mean vs. standard deviation of different prediction measures
(b) Mean vs. standard deviation of recall
(c) Mean vs. standard deviation of FP rate (d) Mean vs. standard deviation of F1-measure
(a) Mean vs. standard deviation of overall accuracy

Chapter 5. Automatic Prediction of Vulnerabilities 70
variance in the overall accuracy is higher than that of DT and LR. Nonetheless, the differences in
mean and standard deviation in overall accuracy are not statistically significant. As far as recall is
concerned, DT outperforms all other techniques as shown in Table 5.3 and Figure 5.1(b).
Therefore, DT can be an efficient technique in predicting a maximum number of vulnerability-
prone files in Mozilla Firefox. In contrast, many vulnerable entities may remain unnoticed if a
prediction is made using a posterior probability based technique such as NB. The higher recall in
DT is also statistically significant compared to LR and NB. It is surprising that DT can detect
more vulnerability-prone files with a lower variance in detection rate than its more advanced
counterpart, RF. In the case of false positive rate (Figure 5.1(c)), we see the opposite scenario.
The false positive rate is at a maximum in DT and at a minimum in NB. This means that although
DT can detect more vulnerable files, it is also likely to raise more false alarms. As already
mentioned, there is a trade-off between recall and false positive rate. This issue is further
explored in Section 5.5.2. One may have to tolerate a number of false positives to ensure that a
minimum number of vulnerability-prone files go unpredicted. From Figure 5.1(d), we observe
that DT strikes a higher balance between recall and FP rate, i.e., between efficiency and
effectiveness as its F1-measure is higher than other techniques.
It will be interesting to observe how accurately different techniques predict the vulnerability-
prone entities when we put more emphasis on recall by analyzing the F2-measures of the four
techniques. Recollect that the F2-measure evaluates the accuracy of predicting vulnerability-prone
files while considering recall to be twice as important as precision. Figure 5.2 compares the F2-
measures of DT, RF, LR and NB techniques, where DT’s F2-measure is the highest. Therefore, if
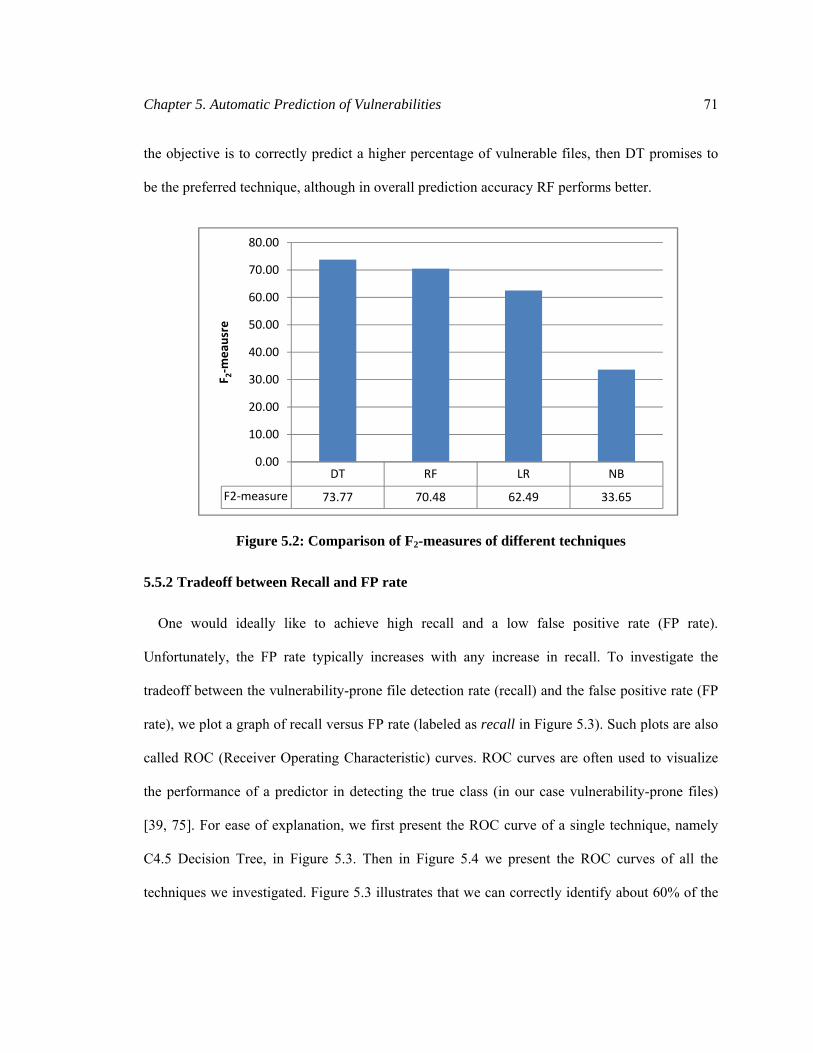
Chapter 5. Automatic Prediction of Vulnerabilities 71
the objective is to correctly predict a higher percentage of vulnerable files, then DT promises to
be the preferred technique, although in overall prediction accuracy RF performs better.
Figure 5.2: Comparison of F2-measures of different techniques
5.5.2 Tradeoff between Recall and FP rate
One would ideally like to achieve high recall and a low false positive rate (FP rate).
Unfortunately, the FP rate typically increases with any increase in recall. To investigate the
tradeoff between the vulnerability-prone file detection rate (recall) and the false positive rate (FP
rate), we plot a graph of recall versus FP rate (labeled as recall in Figure 5.3). Such plots are also
called ROC (Receiver Operating Characteristic) curves. ROC curves are often used to visualize
the performance of a predictor in detecting the true class (in our case vulnerability-prone files)
[39, 75]. For ease of explanation, we first present the ROC curve of a single technique, namely
C4.5 Decision Tree, in Figure 5.3. Then in Figure 5.4 we present the ROC curves of all the
techniques we investigated. Figure 5.3 illustrates that we can correctly identify about 60% of the
DT RF LR NB
F2‐measure 73.77 70.48 62.49 33.65
0.00
10.00
20.00
30.00
40.00
50.00
60.00
70.00
80.00F 2‐m
eausre
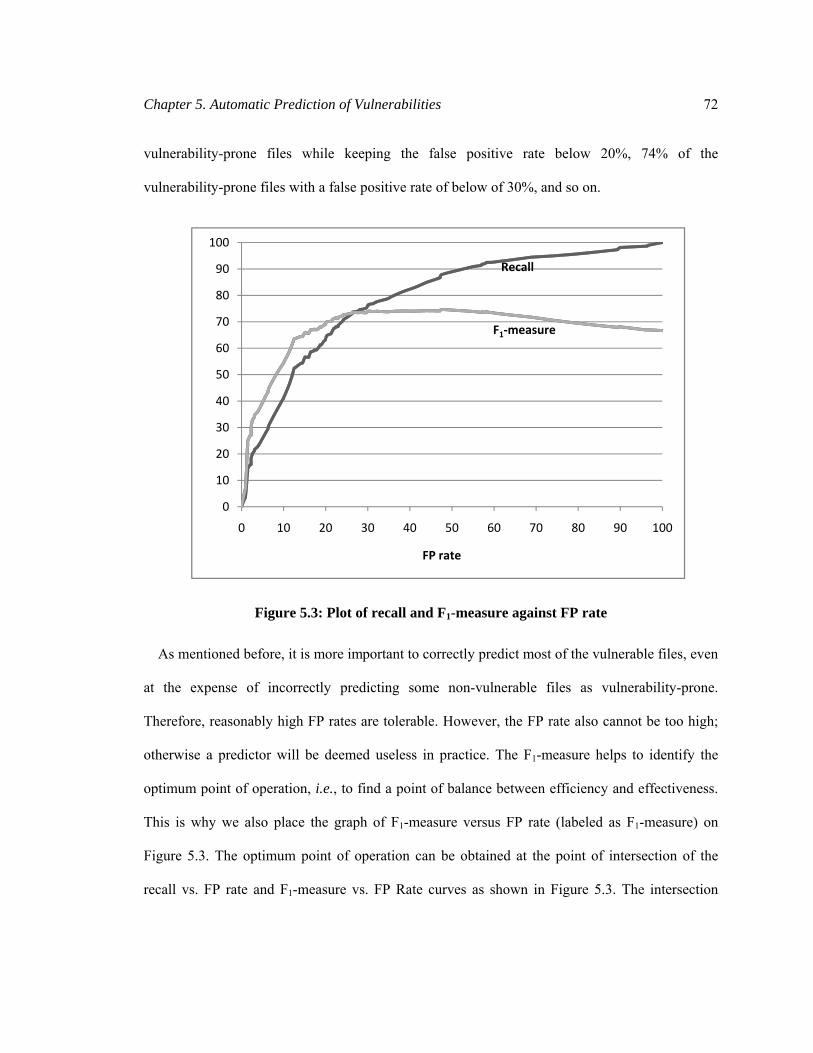
Chapter 5. Automatic Prediction of Vulnerabilities 72
vulnerability-prone files while keeping the false positive rate below 20%, 74% of the
vulnerability-prone files with a false positive rate of below of 30%, and so on.
Figure 5.3: Plot of recall and F1-measure against FP rate
As mentioned before, it is more important to correctly predict most of the vulnerable files, even
at the expense of incorrectly predicting some non-vulnerable files as vulnerability-prone.
Therefore, reasonably high FP rates are tolerable. However, the FP rate also cannot be too high;
otherwise a predictor will be deemed useless in practice. The F1-measure helps to identify the
optimum point of operation, i.e., to find a point of balance between efficiency and effectiveness.
This is why we also place the graph of F1-measure versus FP rate (labeled as F1-measure) on
Figure 5.3. The optimum point of operation can be obtained at the point of intersection of the
recall vs. FP rate and F1-measure vs. FP Rate curves as shown in Figure 5.3. The intersection
Recall
F1‐measure
0
10
20
30
40
50
60
70
80
90
100
0 10 20 30 40 50 60 70 80 90 100
FP rate
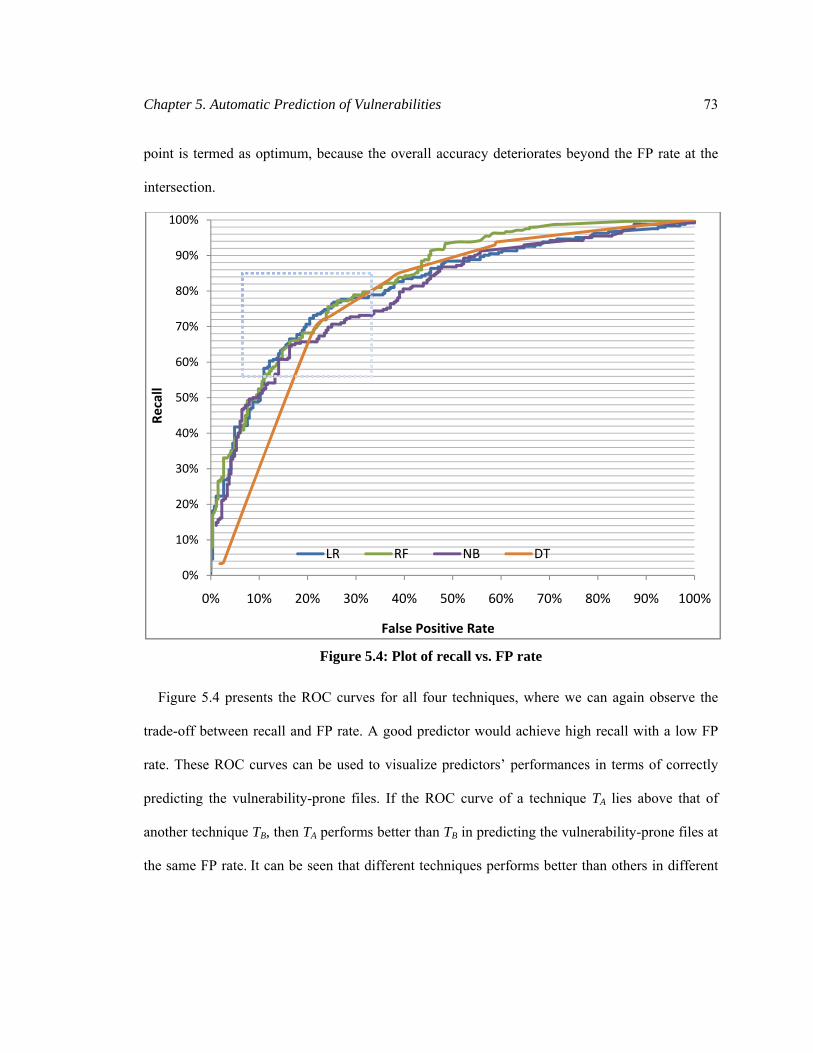
Chapter 5. Automatic Prediction of Vulnerabilities 73
point is termed as optimum, because the overall accuracy deteriorates beyond the FP rate at the
intersection.
Figure 5.4: Plot of recall vs. FP rate
Figure 5.4 presents the ROC curves for all four techniques, where we can again observe the
trade-off between recall and FP rate. A good predictor would achieve high recall with a low FP
rate. These ROC curves can be used to visualize predictors’ performances in terms of correctly
predicting the vulnerability-prone files. If the ROC curve of a technique TA lies above that of
another technique TB, then TA performs better than TB in predicting the vulnerability-prone files at
the same FP rate. It can be seen that different techniques performs better than others in different
0%
10%
20%
30%
40%
50%
60%
70%
80%
90%
100%
0% 10% 20% 30% 40% 50% 60% 70% 80% 90% 100%
Recall
False Positive Rate
LR RF NB DT
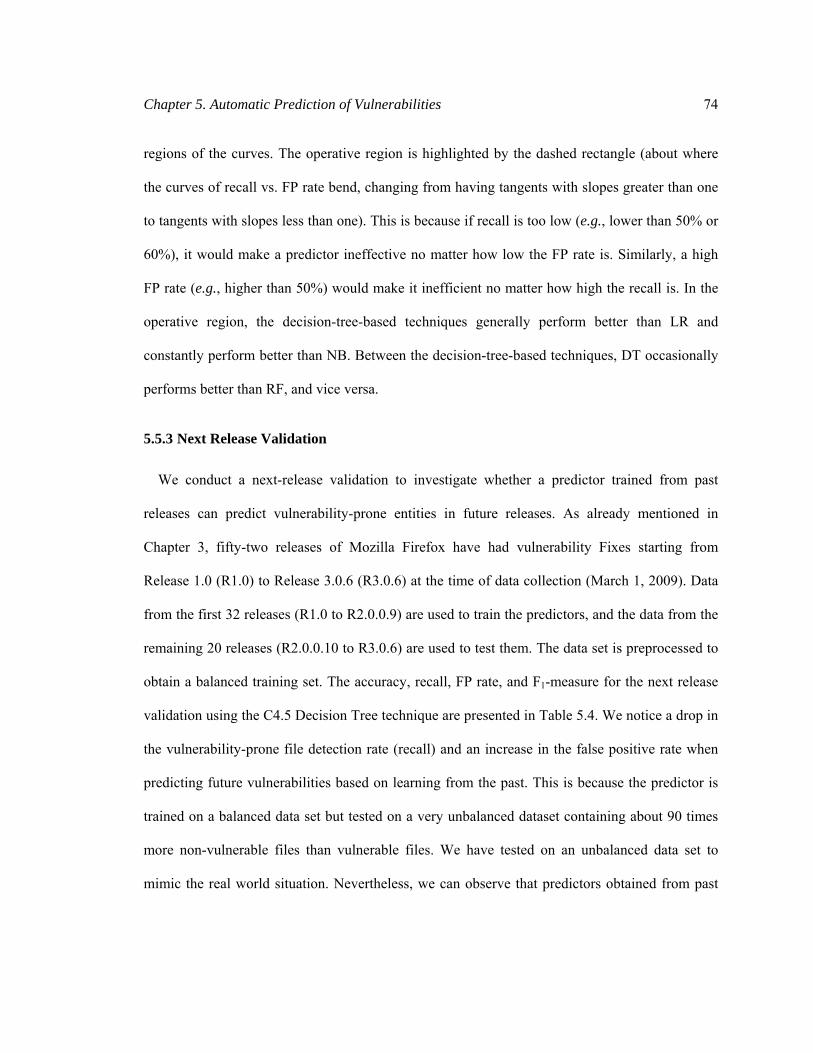
Chapter 5. Automatic Prediction of Vulnerabilities 74
regions of the curves. The operative region is highlighted by the dashed rectangle (about where
the curves of recall vs. FP rate bend, changing from having tangents with slopes greater than one
to tangents with slopes less than one). This is because if recall is too low (e.g., lower than 50% or
60%), it would make a predictor ineffective no matter how low the FP rate is. Similarly, a high
FP rate (e.g., higher than 50%) would make it inefficient no matter how high the recall is. In the
operative region, the decision-tree-based techniques generally perform better than LR and
constantly perform better than NB. Between the decision-tree-based techniques, DT occasionally
performs better than RF, and vice versa.
5.5.3 Next Release Validation
We conduct a next-release validation to investigate whether a predictor trained from past
releases can predict vulnerability-prone entities in future releases. As already mentioned in
Chapter 3, fifty-two releases of Mozilla Firefox have had vulnerability Fixes starting from
Release 1.0 (R1.0) to Release 3.0.6 (R3.0.6) at the time of data collection (March 1, 2009). Data
from the first 32 releases (R1.0 to R2.0.0.9) are used to train the predictors, and the data from the
remaining 20 releases (R2.0.0.10 to R3.0.6) are used to test them. The data set is preprocessed to
obtain a balanced training set. The accuracy, recall, FP rate, and F1-measure for the next release
validation using the C4.5 Decision Tree technique are presented in Table 5.4. We notice a drop in
the vulnerability-prone file detection rate (recall) and an increase in the false positive rate when
predicting future vulnerabilities based on learning from the past. This is because the predictor is
trained on a balanced data set but tested on a very unbalanced dataset containing about 90 times
more non-vulnerable files than vulnerable files. We have tested on an unbalanced data set to
mimic the real world situation. Nevertheless, we can observe that predictors obtained from past

Chapter 5. Automatic Prediction of Vulnerabilities 75
releases can be used to predict vulnerability-prone entities in the follow-up releases without any
significant variance from the results presented in Table 5.3.
Table 5.4: Prediction performance of DT in next release validation
Accuracy Recall FP rate F1-measure
69.61% 69.52% 30.30% 66.00%
5.5.4 Comparison of Results with Other Works
This section compares the results of our vulnerability prediction in Mozilla Firefox with other
studies that used the same case study. Shin and Williams [63, 64] predicted vulnerabilities in
Mozilla Firefox using (only) code complexity metrics as independent variables and Logistic
Regression (LR) as the prediction technique. Table 5.5 reports the accuracy, recall, and FP rate of
their studies on vulnerability prediction. The average FP rate and recall of those studies using LR
are compared with that of our predictions using LR in Figure 5.5. In the figure, we also compare
the FP rate and recall of our next release validation using C4.5 Decision Tree (DT). We compare
their results with our next release validation test because Shin and Williams also have used the
information from the past releases to predict vulnerabilities in future releases. Note that, they
have used vulnerability history up to release 2.0.0.4 (the last release available during their study
conducted in February 29, 2008), while we use vulnerability history up to release 3.0.6 (the last
release available during our study conducted in March 1, 2009). Some variations in the
predictions are inevitable because the two studies (ours and Shin and Williams) use different
datasets. We explain in the following paragraphs that the variations in the predictions are not
mainly because of the use of different datasets but mainly because of the different sampling
techniques used to train the predictors.
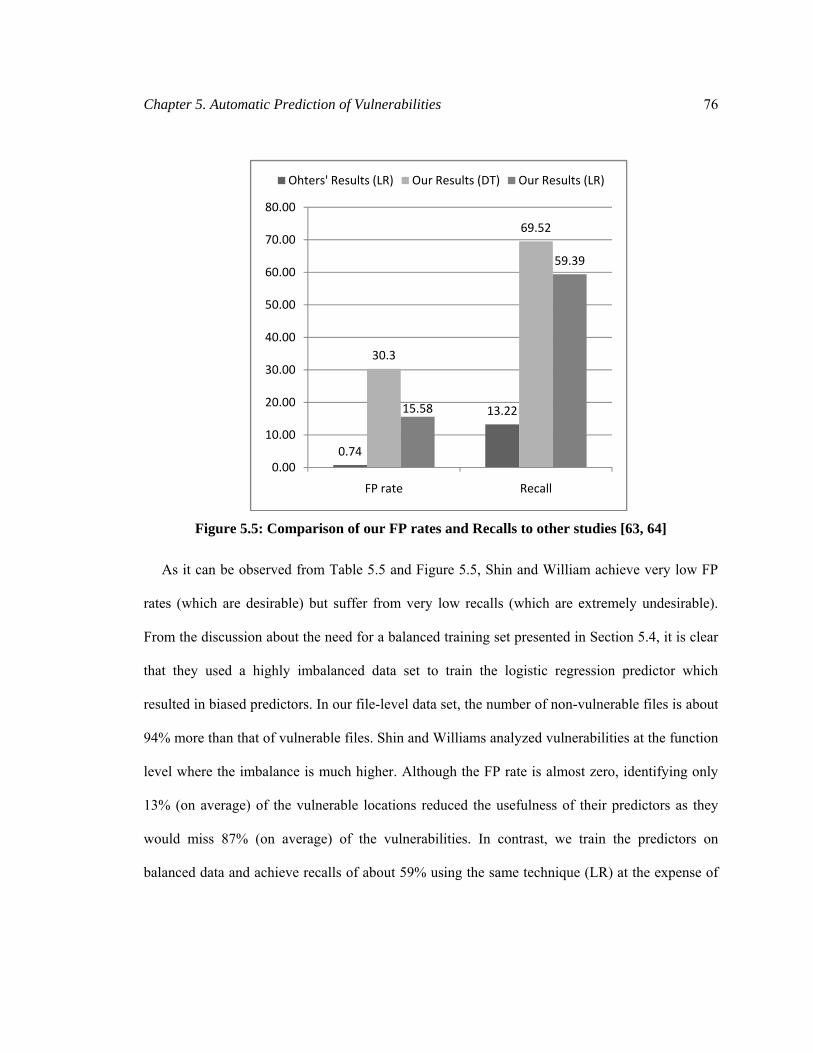
Chapter 5. Automatic Prediction of Vulnerabilities 76
Figure 5.5: Comparison of our FP rates and Recalls to other studies [63, 64]
As it can be observed from Table 5.5 and Figure 5.5, Shin and William achieve very low FP
rates (which are desirable) but suffer from very low recalls (which are extremely undesirable).
From the discussion about the need for a balanced training set presented in Section 5.4, it is clear
that they used a highly imbalanced data set to train the logistic regression predictor which
resulted in biased predictors. In our file-level data set, the number of non-vulnerable files is about
94% more than that of vulnerable files. Shin and Williams analyzed vulnerabilities at the function
level where the imbalance is much higher. Although the FP rate is almost zero, identifying only
13% (on average) of the vulnerable locations reduced the usefulness of their predictors as they
would miss 87% (on average) of the vulnerabilities. In contrast, we train the predictors on
balanced data and achieve recalls of about 59% using the same technique (LR) at the expense of
0.74
13.22
30.3
69.52
15.58
59.39
0.00
10.00
20.00
30.00
40.00
50.00
60.00
70.00
80.00
FP rate Recall
Ohters' Results (LR) Our Results (DT) Our Results (LR)
Chapter 5. Automatic Prediction of Vulnerabilities 77
about 15% FP rate. Recollect that, using decision-tree based technique, our recall is close to 75%
with false positive rate of about 28% (Table 5.3). Even in next release validation using C4.5
Decision Tree, we achieve about 70% recall at an expense of 30% FP rate. We believe such a
trade-off makes a vulnerability predictor more useful as the goal should be to correctly predict
most of the vulnerable locations while keeping the FP rate at a reasonable level. Thus, their
higher accuracy (see Table 5.5) does not necessarily indicate desirable results. That is why we do
not compare the “accuracy” side by side with our results in Figure 5.5. It would have been
possible to be just as accurate by blindly predicting all the functions as non-vulnerable, because
less than 1% of functions are vulnerable ones in the test set used in [63] and [64]. Under these
circumstances, it is more important to identify those vulnerable entities to take effective proactive
actions against potential vulnerabilities. Our predictions with higher recalls are more suitable for
that task. Had we known the “precision” of their predictions, we could compare their results with
ours using F1-measure and F2-measure that combine precision and recall into a single
performance measure.
5.6 Summary
In this chapter, we employ complexity, coupling, and cohesion (CCC) metrics to automatically
predict vulnerability-prone files in Mozilla Firefox. We use four alternative statistical and
machine learning techniques to build vulnerability predictors that learn from the CCC metrics and
vulnerability history of Mozilla Firefox. The techniques are C4.5 Decision Trees, Random
Forests, Logistic Regression, and Naïve-Bayes.

Chapter 5. Automatic Prediction of Vulnerabilities 78
We conduct an extensive case study on Mozilla Firefox to demonstrate the efficacy of
employing CCC metrics in vulnerability prediction. The case study is extensive in the sense that
we have validated our study against vulnerability history of more than four years and fifty-two
releases of Mozilla Firefox. Overall, we are able to correctly predict almost 75% of the
vulnerability-prone files, with a false positive rate of below 30% and an overall prediction
accuracy of about 74%. Notably, this reasonable accuracy in predicting vulnerability-prone files
is obtained with default parameter setting of the learning methods. By experimenting with the
parameters, it would be possible to achieve higher accuracy. We have made a number of
additional observations as described in the following paragraphs.
First, for most of the aforementioned statistical and machine learning techniques (except
Naïve-Bayes), the predictions are more than 70% accurate. This result is obtained using the
default parameter settings of the WEKA tool. This indicates that CCC metrics can be used in
vulnerability prediction, irrespective of what prediction technique is used.
Second, the standard deviations in the performance measure obtained from 10-fold-cross
validation are low. This implies that the prediction would perform consistently when applied to a
different dataset. However, it is necessary to train the predictors on a balanced data set.
Otherwise, it produces biased results towards the more dominant category resulting in poor recall
and misleading overall accuracy.
Third, decision-tree-based techniques, such as C4.5 Decision Tree and Random Forests,
significantly out-perform Logistic Regression and Naïve-Bayes in terms of correctly identifying
vulnerability-prone files and in overall prediction accuracy. These techniques also achieve a
Chapter 5. Automatic Prediction of Vulnerabilities 79
balanced false positive rate and recall, striking a balance between efficiency and effectiveness in
vulnerability prediction.
Fourth, a basic C4.5 Decision Tree technique performs as well as the advanced Random
Forests technique. Although there are differences in the prediction performances achieved by
these two techniques, the differences are not statistically significant. Moreover, the C4.5 Decision
Tree performs better than Random Forests when more emphasis is given on correctly predicting
the vulnerable files at the expense of a slightly elevated FP rate.
Fifth, predictors built from one release can be reliably used to predict vulnerability-prone
entities in future releases.
Finally, we observe an improvement over similar studies (such as [63] and [64]) on
vulnerability prediction in Mozilla Firefox. The improvement is mainly in recall or vulnerability-
prone file detection rate. Moreover, our results are as good as other techniques using different
input features and approaches, e.g., [56] (reported in Section 2.3.3). Therefore, CCC metrics
should be included in the input feature set in vulnerability prediction attempts.
80
Chapter 6
Conclusion
6.1 General Conclusions
In this thesis, we provide empirical evidence that complex, coupled, and non-cohesive software
entities are generally less secure. We find that complexity, coupling, and lack of cohesion (CCC)
metrics positively correlate to the number of vulnerabilities at a statistically significant level over
five major releases of Mozilla Firefox. The correlation is on average 0.5 with a p-value less than
0.001. The code-level CCC metrics are generally more strongly correlated to vulnerabilities than
the design-level CCC metrics. However, design-level metrics such as NOC can be good
indicators of vulnerabilities. We also observe that the CCC metrics are consistently correlated to
vulnerabilities across five releases of Mozilla Firefox. The stable correlation patterns imply that,
once calibrated to a specific project, these metrics can be dependably used to indicate
vulnerabilities for new releases.
Motivated by the aforementioned observations, we investigate the efficacy of applying
complexity, coupling, and cohesion metrics to automatically predict vulnerability-prone entities
in software systems. We use statistical and machine-learning-based approaches to build
vulnerability predictors. In doing so, we compare the prediction performance of the C4.5
Decision Tree, Random Forests, Logistic Regression, and Naïve-Bayes techniques in predicting
vulnerability-prone entities based on their CCC metrics. An extensive empirical study is
conducted on data collected from fifty-two releases of Mozilla Firefox developed over a period of
more than four years. From the result of the study, we conclude that:
Chapter 6. Conclusion 81
• Vulnerability-proneness prediction using CCC metrics is reasonably accurate. It is possible to
correctly predict almost 75% of the vulnerability-prone files (recall) with a false positive rate
of 28%, and an overall accuracy of 74%. The result is promising given that we are using
structural information from the non-security realm to predict vulnerabilities.
• The prediction results are data independent as the predictors perform consistently against
different subsets of the datasets during 10-fold cross validation. The standard deviations in
recall, false positive rate and overall accuracy are 0.03, 0.05, and 1.46, respectively, which is
very low.
• A relatively simple technique, namely C4.5 Decision Trees, happens to perform very well in
correctly predicting the vulnerability-prone files and in overall prediction accuracy. This
suggests that more complex prediction techniques like Random Forests may not be required.
• The predictors built from one release can be reliably used to predict vulnerability-prone
entities in a future release. The result of next-release validation shows statistically
insignificant variance in prediction accuracy.
The conclusions substantiate that CCC metrics can be useful and practical addition to the
framework of automatic vulnerability prediction. Such automatic predictions will allow software
practitioners take preventive actions against potential vulnerabilities early in the software
lifecycle.

Chapter 6. Conclusion 82
6.2 Limitations
We recognize that there are certain limitations to the results and conclusions we have presented
in this thesis, and we discuss several of them in the following paragraphs.
First, our research relies on vulnerabilities which have already been discovered and reported.
Vulnerabilities that have not been discovered or publicly announced yet are not used for our study
even though that information might contribute to a more precise analysis. In particular, it is
impossible to ever know the true error rates, as certain false positives may be true positives if the
files identified contain vulnerabilities that haven’t been noticed yet.
Second, there are some inconsistencies in the traceability of Mozilla Security Advisories, bug
reports, and CVSs. For example, in release R1.0, 32 files of the total of 693 vulnerable files in the
Mozilla Firefox code-base could not be located. However, we believe that such 4%
inconsistencies are insignificant and should not threaten the validity of the study.
Third, we do not differentiate the files changed for the direct reason of vulnerabilities and the
files changed for a secondary reason identified from vulnerabilities such as an addition of a
parameter to several functions in a file with low complexity. Considering applying different
weights to the simple changes propagated from the main changes due to vulnerabilities might lead
to more precise results.
Fourth, there is always an element of randomness and variance in the results produced by
statistical and machine learning techniques. In order to confidently lessen the effects of
algorithmic bias, we have performed 10-fold cross validation, a way of performing repeated
Chapter 6. Conclusion 83
training and testing. There is also the chance that one technique might have performed better than
another technique had we experimented with different parameters. The main purpose of this study
is to investigate the applicability of using CCC metrics to predict vulnerable entities. In doing
that, we tried several techniques so that the results are not overly influenced by any specific
technique. We were not attempting to identify the most effective technique or most effective set
of parameters.
Fifth, we are aware of the fact there are many other factors that can lead to vulnerabilities in
software systems. Therefore, by no means, we imply that CCC metrics should be the sole
consideration when trying to predict potential vulnerabilities early in the software lifecycle.
Instead, our results suggest that complexity, coupling, and cohesion can be some of the major
factors to be kept in mind during security assessment of software artifacts, but there is certainly
no requirement to limit oneself to this data.
Finally, we acknowledge that one case study is not sufficient to draw a completely general and
concrete conclusion. Some conclusions drawn from studying Mozilla Firefox may not apply to
other software in different domains. Nevertheless, we have substantiated our findings over a
wealth of vulnerability data by analyzing fifty-two releases developed over a period of four years.
Researchers gain confidence in a theory as similar results are observed in different settings. In
this regards, our findings provide supportive evidence about the how complexity, coupling and
cohesion metrics relate to vulnerabilities in software.
6.3 Future Work
Our future work will concentrate on the following issues:
Chapter 6. Conclusion 84
More Metrics: Currently, we only use CCC metrics in structured and OO programming
paradigms. It would be interesting to investigate the relationship between vulnerabilities with
other CCC metrics such as service coupling and complexity in service-oriented architecture [42].
There is also the need to investigate the effects of software-development-process complexity and
coupling, i.e., metrics that focus on a code-change process instead of on the code properties. For
example, Hassan et al. conjecture that entities that are part of large, complex modifications or
entities that are being modified frequently and/or recently are likely to have faults [30]. Similar
studies can be conducted in the context of security patches and vulnerabilities.
Granularity of Analysis: Zimmermann et al.’s study [76] reveals that the degree of correlation
between faults and complexity measures is different depending on the granularity of analysis. In
this study, we analyze the effect of CCC metrics on vulnerability-proneness at the file-level.
Analyzing at various granularities (e.g., at module or component level) might reveal some more
interesting information.
More automation: The tool developed to automate the extraction and mapping of
vulnerabilities and version information is basically a collection of Python scripts, which generate
textual outputs. Convenient Graphical User Interfaces (GUI) for the tool are under development.
Furthermore, we want to integrate third-party statistical and machine learning tools with our tool
so that we can automatically obtain predictors from software archives without much human
intervention. The next step would be to integrate these predictors into development environments
supporting the decisions of software engineers and managers.
Chapter 6. Conclusion 85
More projects: Given a fully automated system, we will be able to easily replicate this study on
more projects from different domains. This will add further evidence on the applicability of CCC
metrics in vulnerability prediction. Systemic study of more projects will strengthen the existing
body of empirical knowledge in software security engineering and software engineering in
general.
Despite the limitations and clear avenues for future expansion of the work, our basic goal of
demonstrating that CCC metrics are useful as vulnerability indicators has been met.

86
References
[1] O. H. Alhazmi, Y. K. Malaiya, and I. Ray, "Measuring, Analyzing and Predicting Security
Vulnerabilities in Software Systems," Computers & Security, vol. 26, no. 3, 2007, pp. 219-
228.
[2] E. Arisholm, L. C. Briand, and M. Fuglerud, "Data Mining Techniques for Building Fault-
proneness Models in Telecom Java Software," in Proceedings of the 18th IEEE
International Symposium on Software Reliability Engineering, Trollhättan, Sweden, Nov.
2007, pp. 215-224.
[3] M. Auer, B. Graser, and S. Biffl, "A Survey on the Fitness of Commercial Software Metric
Tools for Service in Heterogeneous Environments: Common Pitfalls," in Proceedings of
the 9th International Software Metrics Symposium, Sydney, Australia, Sep. 2003, pp. 144-
152.
[4] K. Ayari, P. Meshkinfam, , G. Antoniol, and M. Di Penta, “Threats on Building Models
from CVS and Bugzilla Repositories: the Mozilla Case Study,” in Proceedings of the 2007
Conference of the Center for Advanced Studies on Collaborative Research, Richmond Hill,
Ontario, Canada, Oct. 2007, pp. 215-228.
[5] V. Basili, L. Briand and W. Melo, "A Validation of Object-Oriented Design Metrics as
Quality Indicators," IEEE Trans. on Software Eng., vol. 22, 1996, pp. 751-761.
[6] BeautifulSoup, http://www.crummy.com/software/BeautifulSoup/documentation.html
(accessed July 2009).
References 87
[7] S. Bibi, G. Tsoumakas, I. Stamelos, and I. Vlahavas, "Software Defect Prediction Using
Regression Via Classification," in Proceedings of the 4th ACS/IEEE International
Conference on Computer Systems and Applications, Dubai, UAE, Mar. 2006, pp. 330-337.
[8] M. Bishop, Computer Security: Art and Science, Boston, MA: Addison-Wesley, 2003.
[9] L. C. Briand, J. W. Daly, and J. Wüst, “A Unified Framework for Cohesion Measurement
in Object-Oriented Systems,” Empirical Software Engineering, vol. 3, no. 1, 2004, pp. 65-
117.
[10] Browser Statistics, http://ww.w3schools.com/browsers/browsers_stats.asp (accessed July
2009).
[11] Bug 423541 - (CVE-2008-2805), “Arbitrary file upload via originalTarget and DOM
Range,” https://bugzilla.mozilla.org/show_bug.cgi?id=423541 (accessed July 2009).
[12] Bugzilla, http://www.bugzilla.org (accessed July 2009).
[13] M. Cartwright and M. Shepperd, "An Empirical Investigation of an Object-Oriented
Software System," IEEE Trans. on Software Eng., vol. 26, no. 8, 2000, pp. 786-796.
[14] S. R. Chidamber and C. F. Kemerer, “A Metrics Suite for Object Oriented Design,” IEEE
Trans. on Software Eng., vol. 20, no. 6, 1994, pp. 476-493.
[15] I. Chowdhury , B. Chan , and M. Zulkernine, “Security Metrics for Source Code
Structures,” in Proceedings of the 4th International Workshop on Software Engineering for
Secure Systems, Leipzig, Germany, May 2008, pp.57-64.
[16] J. Cohen, Statistical Power Analysis for the Behavioral Sciences (2nd ed.), Academic Press
New York, 1988.
References 88
[17] Computer Emergency Response Team Coordination Center (CERT/CC),
http://www.cert.org/stats/cert_stats.html (accessed July 2009).
[18] Common Vulnerabilities and Exposures, http://cve.mitre.org/ (accessed July 2009).
[19] D. Cubranic, G. C. Murphy, J. Singer, and S. Booth, “Hipikat: A Project Memory for
Software Development,” IEEE Trans. on Software Eng., vol. 31, no. 6, 2005, pp. 446-465.
[20] Documentation of the Implemented Tool, http://research.cs.queensu.ca/~istehad/research/
html/index.html (accessed July 2009).
[21] K. O. Elish and M. O. Elish, "Predicting Defect-prone Software Modules Using Support
Vector Machines," The Journal of Systems & Software, vol. 81, 2008, pp. 649-660.
[22] K. E. Emam, W. Melo, and J. C. Machado, "The Prediction of Faulty Classes Using
Object-Oriented Design metrics," The Journal of Systems & Software, vol. 56, 2001, pp.
63-75.
[23] W. M. Evanco and W. W. Agresti, "A Composite Complexity Approach for Software
Defect Modelling," Software Quality Journal, vol. 3, 1994, pp. 27-44.
[24] N. E. Fenton, P. Krause, and M. Neil, "A Probabilistic Model for Software Defect
Prediction," IEEE Trans. on Software Eng., vol. 2143, 2001, pp. 444-453.
[25] N. E. Fenton and S. L. Pfleeger, Software Metrics: A Rigorous and Practical Approach,
PWS Publishing Co., Boston, MA, USA, 1997.
[26] M. Fischer, M. Pinzger, and H. Gall, “Populating a Release History Database from Version
Control and Bug Tracking Systems,” in Proceedings of the 19th International Conference
on Software Maintenance, Amsterdam, Netherlands, Sep. 2003, pp. 23-32.
References 89
[27] M. Gegick, L. Williams, and M. Vouk, “Predictive Models for Identifying Software
Components Prone to Failure During Security Attacks,” Technical Report, Department of
Computer Science, North Carolina State University, USA, Oct. 28, 2008.
[28] J. Grossman, “Website Vulnerabilities Revealed: What everyone knew, but afraid to
believe,” White Hat Security Inc, http://www.whitehatsec.com/home/assets/presentations/
PPTstats 032608.pdf (accessed July 2009).
[29] M. H. Halstead, Elements of Software Science. New York: Elsevier, 1977.
[30] A. E. Hassan, “Predicting Faults Using the Complexity of Code Changes,” in Proceedings
of the 31st International Conference on Software Engineering, Vancouver, Canada, May
2009, pp. 45-56.
[31] A. E. Hassan, Mining Software Repositories to Assist Developers and Support Managers,
PhD. Thesis, University of Waterloo, 2004.
[32] IEEE, IEEE Std. 982.1-1988 IEEE Standard Dictionary of Measures to Produce Reliable
Software, The Institute of Electrical and Electronics Engineers, Jun. 1988.
[33] Index of Mozilla FTP Server, ftp://ftp.mozilla.org/pub/mozilla.org/ (accessed July 2009).
[34] International Standards Organization, “Information technology – Database languages –
SQL, ISO/IEC 9075:1992 (3rd ed.),” 1992.
[35] A. Janes, M. Scotto, W. Pedrycz, B. Russo, M. Stefanovic, and G. Succi, "Identification of
Defect-prone Classes in Telecommunication Software Systems Using Design Metrics," The
Journal of Systems & Software, vol. 176, 2006, pp. 3711-3734.
References 90
[36] A. Jaquith, Security Metrics: Replacing Fear, Uncertainty, and Doubt. Upper Saddle River,
NJ: Pearson Education Inc., 2007.
[37] J. K. Kearney, R. L. Sedlmeyer, W. B. Thompson, M. A. Gray, and M. A. Adler, "Software
Complexity Measurement," ACM Communications, vol. 29, no. 11, 1986, pp. 1044-1050.
[38] G. Koru and J. Tian, "An Empirical Comparison and Characterization of High Defect and
High Complexity Modules," The Journal of Systems & Software, vol. 67, 2003, pp. 153-
163.
[39] L. Kuang and M. Zulkernine, “An Anomaly Intrusion Detection Method Using the CSI-
KNN Algorithm,” in Proceedings of the 23rd Annual ACM Symposium on Applied
Computing, Fortaleza, Brazil, Mar. 2008, pp. 921-926.
[40] S. Kullback, Information Theory and Statistics (1st ed.), John Wiley and Sons, NY, 1959.
[41] N. Landwehr, M. Hall, and E. Frank, “Logistic Model Trees,” Journal of Machine
Learning, vol. 59, no.1-2, 2005, pp.161-205.
[42] M.Y. Liu and I. Traore, "Empirical Relations Between Attackability and Coupling: A case
Study on DoS," in Proceedings of the 2006 ACM SIGPLAN Workshop on Programming
Languages and Analysis for Security, Ottawa, Canada, Jun. 2006, pp. 57-64.
[43] Y. Ma, L. Guo, and B. Cukic, "A Statistical Framework for the Prediction of Fault-
Proneness," Advances in Machine Learning Application in Software Engineering, Idea
Group Inc, 2006, pp. 237-265.
References 91
[44] H. Malik, I. Chowdhury, H. M. Tsou, Z. Ziang, and A. E. Hassan, "Understanding the
Rationale for Updating a Function's Comment", in Proceeding of the 24th International
Conference on Software Maintenance, Beijing, China, Sep. 2008, pp.167-176.
[45] T. J. McCabe, "A Complexity Measure," IEEE Trans. on Software Eng., vol. 2, no. 4, 1976,
pp. 308-320.
[46] G. McGraw, Software Security: Building Security In, Boston, NY: Addison-Wesley, 2006.
[47] T. Menzies, J. Greenwald, and A. Frank, "Data Mining Static Code Attributes to Learn
Defect Predictors," IEEE Trans. on Software Eng., vol. 33, no. 9, 2007, pp. 2-13.
[48] Mozilla Developer Guide, https://developer.mozilla.org/en/Download_Mozilla_Source_
Code#Releases (accessed July 2009).
[49] Mozilla Firefox, http://www.mozilla.com/en-US/firefox (accessed July 2009).
[50] Mozilla Foundation Security Advisory 2008-27, http://www.mozilla.org/security/announce/
2008/mfsa2008-27.html (accessed July 2009).
[51] Mozilla Vulnerabilities, http://www.mozilla.org/projects/security/knownvulnerabilities
(accessed July 2009).
[52] J. D. Musa, "Software-Reliability-Engineered Testing", Computer Journal, vol. 29, no. 11,
1996, pp. 61-68.
[53] G. J. Myers, Composite/Structured Design, New York: Van Nostrand Reinhold Company,
1978.
References 92
[54] N. Nagappan, T. Ball, and A. Zeller, "Mining Metrics to Predict Component Failures," in
Proceedings of the 28th International Conference on Software Engineering, Shanghai,
China, May 2006, pp. 452-461.
[55] N. Nagappan, L. Williams and M. Vouk, "Towards a Metric Suite for Early Software
Reliability Assessment," in Proceedings of the 2003 International Symposium on Software
Reliability Engineering, Denver, CO, USA, 2003, pp. 238-239.
[56] S. Neuhaus, T. Zimmermann, and A. Zeller, "Predicting Vulnerable Software
Components," in Proceedings of the 14th ACM Conference on Computer and
Communications Security, Alexandria, Virginia, USA, Oct. 2007, pp. 529-540.
[57] M. Philips, “The Inevitability of Punishing the Innocent,” The Journal of Philosophical
Studies, Springer Netherlands, vol. 48, no. 3, 1985, pp. 389-391.
[58] T. J. Ostrand and E. J. Weyuker, "How to Measure Success of Fault Prediction Models," in
Proceedings of the 4th International Workshop on Software Quality Assurance, Dubrovnik,
Croatia, Sep. 2007, pp. 25-30.
[59] C. J. Rijsbergen, Information Retrieval (2nd ed.), Butterworth-Heinemann, 1979.
[60] Security Advisory for Firefox 2.0, http://www.mozilla.org/security/known-vulnerabilities/
firefox20.html (accessed July 2009).
[61] SciTools Inc, http://www.scitools.com (accessed July 2009).
[62] SciTools Inc. Blog, http://scitools.com/blog/2008/10/tip-understand-the-countpath-metric
.html (accessed July 2009).
References 93
[63] Y. Shin, “Exploring Complexity Metrics as Indicators of Software Vulnerability,” in
Proceedings of the 3rd International Doctoral Symposium on Empirical Software
Engineering, Kaiserslautem, Germany, Oct. 2008, available from the author’s website
http://www4.ncsu.edu/~yshin2/ papers /esem2008ds_shin.pdf (accessed July 2009).
[64] Y. Shin and L. Williams, "An Empirical Model to Predict Security Vulnerabilities Using
Code Complexity Metrics," in Proceedings of the 2nd ACM-IEEE International Symposium
on Empirical Software Engineering and Measurement, Kaiserslautern, Germany, Oct.
2008, pp. 315-317.
[65] Y. Shin and L. Williams, "Is Complexity Really the Enemy of Software Security?," in
Proceedings of the 4th ACM Workshop on Quality of Protection, Alexandria, Virginia,
USA, Oct. 2008, pp. 47-50.
[66] J. Sliwerski, T. Zimmermann, and A. Zeller, “When Do Changes Induce Fixes?,” in
Proceedings of the 2nd International Workshop on Mining Software Repositories, Saint
Louis, Missouri, USA, May 2005, pp. 24-28.
[67] Software Metrics Tools, http://www.laatuk.com/tools/metric_tools.html (accessed July
2009).
[68] StatPy: Statistical Computing with Python, http://www.astro.cornell.edu/staff/loredo/statpy/
(accessed July 2009).
[69] G. Succi, W. Pedrycz, M. Stefanovic, and J. Miller, "Practical Assessment of the Models
for Identification of Defect-prone Classes in Object-Oriented Commercial Systems Using
Design Metrics," The Journal of Systems & Software, vol. 65, 2003, pp. 1-12.
[70] The Linux Information Project, http://www.linfo.org/bug.html (accessed July 2009).
References 94
[71] M. M. T. Thwin and T. S. Quah, "Application of Neural Networks for Software Quality
Prediction Using Object-Oriented Metrics," The Journal of Systems & Software, vol. 76,
2005, pp. 147-156.
[72] WEKA Toolkit, http://www.cs.waikato.ac.nz/ml/weka (accessed July 2009).
[73] I. H. Witten and E. Frank, Data Mining: Practical Machine Learning Tools and
Techniques (2nd ed.), Morgan Kaufmann, San Francisco, 2005.
[74] H. Zhang, X. Zhang, and M. Gu, "Predicting Defective Software Components from Code
Complexity Measures," in Proceedings of the 13th Pacific Rim International Symposium on
Dependable Computing, Melbourne, Australia, Dec. 2007, pp. 93-96.
[75] J. Zhang, M. Zulkernine, and A. Haque, “Random Forest-Based Network Intrusion
Detection Systems,” IEEE Trans. on Systems, Man, and Cybernetics, vol. 38, no. 5, 2008,
pp. 648-658.
[76] T. Zimmermann, R. Premraj, and A. Zeller, "Predicting Defects for Eclipse," in
Proceedings of the 3rd International Workshop on Predictor Models in Software
Engineering, Washington, DC, USA, May 2007, pp. 9-15.


