Using COMPASS data to evaluate the impact of the Healthy ...
36
1 Cohort study evaluating how changes in school programs, policies, and resources impact youth health behaviours Using COMPASS data to evaluate the impact of the Healthy Kids Community Challenge (HKCC) on youth in Ontario: baseline student-level measures Compass Technical Report Series, Volume 3 Issue 4 September 2015
Transcript of Using COMPASS data to evaluate the impact of the Healthy ...

1
Cohort study evaluating how changes in school programs, policies, and resources impact youth health behaviours
Using COMPASS data to evaluate the impact of the Healthy Kids Community Challenge (HKCC) on youth in Ontario: baseline student-level measures Compass Technical Report Series, Volume 3 Issue 4
September 2015

i
University of Waterloo
Waterloo, Ontario
October 2015
©COMPASS
https://uwaterloo.ca/compass-system/

ii
Sarah Aleyan, BSc1 Jennifer M. Stefanczyk, BHK1 Scott T. Leatherdale, PhD1 1 - School of Public Health and Health Systems, University of Waterloo, Waterloo, ON Canada.
Report funded by:
The COMPASS study was supported by a bridge grant from the Canadian Institutes of Health Research (CIHR) Institute of Nutrition, Metabolism and Diabetes (INMD) through the “Obesity – Interventions to Prevent or Treat” priority funding awards (OOP-110788; grant awarded to S. Leatherdale) and an operating grant from the Canadian Institutes of Health Research (CIHR) Institute of Population and Public Health (IPPH) (MOP-114875; grant awarded to S. Leatherdale). S. Leatherdale is a Chair in Applied Public Health Research funded by the Public Health Agency of Canada (PHAC) in partnership with Canadian Institutes of Health Research (CIHR). The authors would also like to thank Public Health Ontario (PHO) for assistance with the mapping work to define the HKCC community boundaries used in this report.
Suggested citation:
Aleyan S, Stefanczyk JM, Leatherdale ST. Using COMPASS data to evaluate the impact of the Healthy Kids Community Challenge (HKCC) on youth in Ontario: baseline student-level measures. Technical Report Series. 2015; 3(4). Waterloo, Ontario: University of Waterloo.
Available at: https://uwaterloo.ca/compass-system/publications#technical
Contact: COMPASS Research Team University of Waterloo 200 University Ave West, BMH 1038 Waterloo, ON Canada N2L 3G1 https://uwaterloo.ca/compass-system/
ACKNOWLEDGEMENTS

iii
Table of Contents Acknowledgements ........................................................................................................................................ ii
Introduction .................................................................................................................................................. 1
Design ............................................................................................................................................................ 3
Student-level measures ................................................................................................................................ 4
Self-reported Height & Weight (BMI) ....................................................................................................... 4
Self-Reported Physical Activity (MVPA) .................................................................................................... 4
Active Transportation ............................................................................................................................... 4
Self-Reported Sedentary Behaviour ......................................................................................................... 5
Sleep Patterns ........................................................................................................................................... 5
Canada’s Food Guide Servings .................................................................................................................. 5
Fruits & Vegetable Intake ..................................................................................................................... 5
Meats & Alternatives ............................................................................................................................ 5
Milk/ Alternatives ................................................................................................................................. 5
Grain Products ...................................................................................................................................... 6
Analyses ........................................................................................................................................................ 6
Results ........................................................................................................................................................... 6
Obesity ...................................................................................................................................................... 6
Physical Activity ........................................................................................................................................ 6
Active Transportation ............................................................................................................................... 7
Sedentary Behaviour ................................................................................................................................. 7
Sleep Patterns ........................................................................................................................................... 7
Breakfast Skipping ..................................................................................................................................... 7
Canada Food Guide Servings..................................................................................................................... 7
Discussion...................................................................................................................................................... 8
Limitations ................................................................................................................................................ 9
References .................................................................................................................................................. 10
APPENDIX .................................................................................................................................................... 12
FIGURES ....................................................................................................................................................... 12
Figure 1 ................................................................................................................................................... 13
Percentage of overweight and obese students: Year 1-3 of the COMPASS study in COMPASS schools among HKCC and non-HKCC communities. ........................................................................................ 13
Figure 2 ................................................................................................................................................... 14
Percentage of overweight and obese among female students only: Year 1-3 of the COMPASS study in COMPASS schools among HKCC and non-HKCC communities........................................................ 14

iv
Figure 3 ................................................................................................................................................... 15
Percentage of overweight and obese among male students only: Year 1-3 of the COMPASS study in COMPASS schools among HKCC and non-HKCC communities. .......................................................... 15
Figure 4 ................................................................................................................................................... 16
Percentage of students who achieve the recommended guideline of 60 minutes of daily moderate to vigorous intensity physical activity (MVPA): Year 1-3 of the COMPASS study in COMPASS schools among HKCC and non-HKCC communities. ........................................................................................ 16
Figure 5 ................................................................................................................................................... 17
Percentage of students who usually use active transportation (walk or cycle) to school: Year 1-3 of the COMPASS study in COMPASS schools among HKCC and non-HKCC communities. ..................... 17
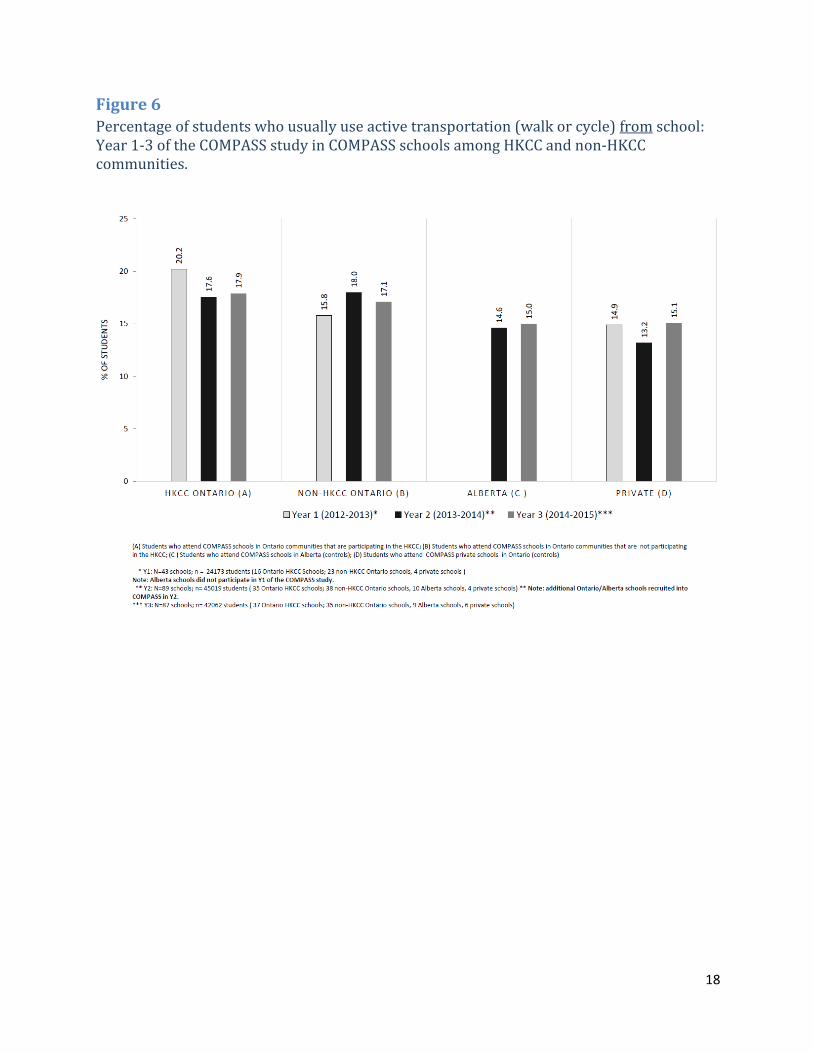
Figure 6 ................................................................................................................................................... 18
Percentage of students who usually use active transportation (walk or cycle) from school: Year 1-3 of the COMPASS study in COMPASS schools among HKCC and non-HKCC communities. ................. 18
Figure 7 ................................................................................................................................................... 19
Percentage of students who exceeded Canadian sedentary guidelines (more than 2 hours daily): Year 1-3 of the COMPASS study in COMPASS schools among HKCC and non-HKCC communities. ... 19
Figure 8 ................................................................................................................................................... 20
Percentage of students who obtain six or less hours of sleep per night: Year 1-3 of the COMPASS study in COMPASS schools among HKCC and non-HKCC communities. ............................................. 20
Figure 9 ................................................................................................................................................... 21
Percentage of students who skip breakfast one or more school days: Year 1-3 of the COMPASS study in COMPASS schools among HKCC and non-HKCC communities. ............................................. 21
Figure 10 ................................................................................................................................................. 22
Percentage of female students who do not meet the recommended daily vegetable & fruit servings according to Canada’s Food Guide: Year 1-3 of the COMPASS study in COMPASS schools among HKCC and non-HKCC communities. .................................................................................................... 22
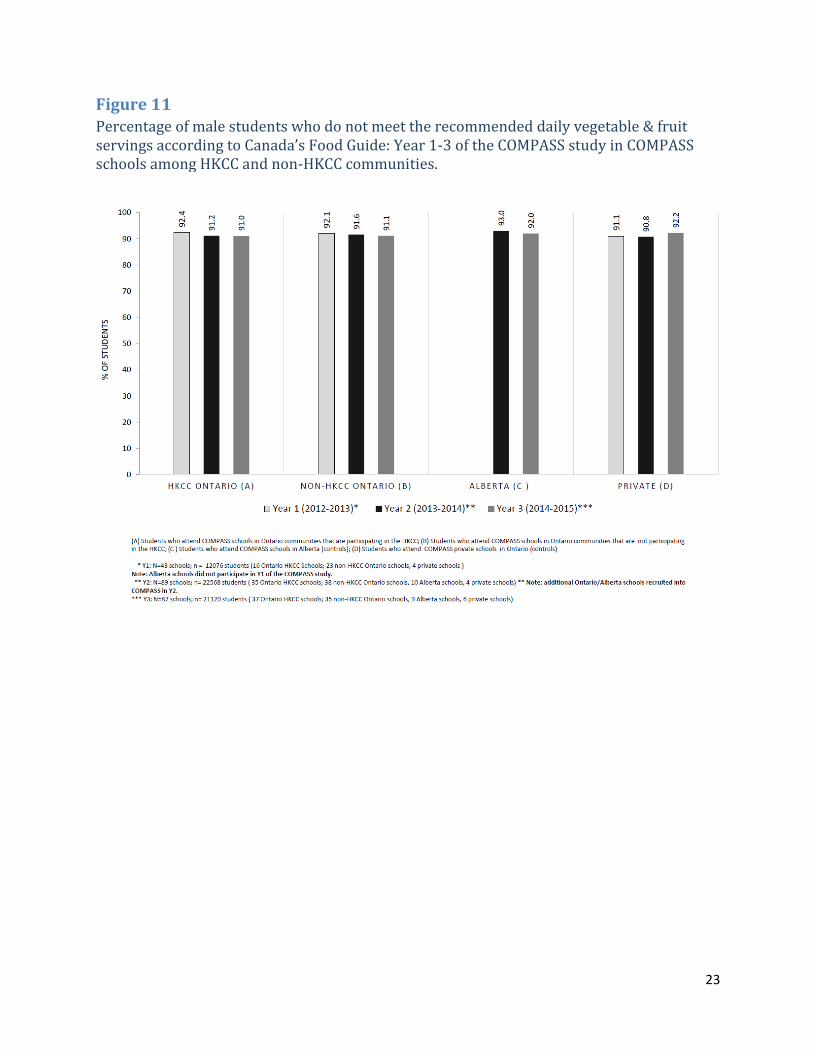
Figure 11 ................................................................................................................................................. 23
Percentage of male students who do not meet the recommended daily vegetable & fruit servings according to Canada’s Food Guide: Year 1-3 of the COMPASS study in COMPASS schools among HKCC and non-HKCC communities. .................................................................................................... 23
Figure 12 ................................................................................................................................................. 24
Percentage of female students who do not meet the recommended daily grain products servings according to Canada’s Food Guide: Year 1-3 of the COMPASS study in COMPASS schools among HKCC and non-HKCC communities. .................................................................................................... 24
Figure 13 ................................................................................................................................................. 25
Percentage of male students who do not meet the recommended daily grain products servings according to Canada’s Food Guide: Year 1-3 of the COMPASS study in COMPASS schools among HKCC and non-HKCC communities. .................................................................................................... 25
Figure 14 ................................................................................................................................................. 26
v
Percentage of female students who do not meet the recommended daily milk & alternatives servings according to Canada’s Food Guide: Year 1-3 of the COMPASS study in COMPASS schools among HKCC and non-HKCC communities. ........................................................................................ 26
Figure 15 ................................................................................................................................................. 27
Percentage of male students who do not meet the recommended daily milk & alternatives servings according to Canada’s Food Guide: Year 1-3 of the COMPASS study in COMPASS schools among HKCC and non-HKCC communities. .................................................................................................... 27
Figure 16 ................................................................................................................................................. 28
Percentage of female students who do not meet the recommended daily meat & alternatives servings according to Canada’s Food Guide: Year 1-3 of the COMPASS study in COMPASS schools among HKCC and non-HKCC communities. ........................................................................................ 28
Figure 17 ................................................................................................................................................. 29
Percentage of male students who do not meet the recommended daily meat & alternatives servings according to Canada’s Food Guide: Year 1-3 of the COMPASS study in COMPASS schools among HKCC and non-HKCC communities. .................................................................................................... 29

1
Introduction
Over the past few decades, the prevalence of childhood overweight and obesity has increased substantially [1-2]. In the 2009-2011 Canadian Measures Health Survey, nearly one-third of Canadian children and youth were classified as either overweight or obese [3]. The rising rate of childhood obesity is of grave concern as trends tend to persist later into adulthood [4] and can contribute to the development of detrimental health outcomes such as elevated blood pressure, cardiovascular disease and Type 2 diabetes [5]. Previous research has shown indicators of poor diet to be associated with an increased risk of obesity [6]. Within children and adolescents, negative health behaviours such as the consumption of sugar-sweetened beverages [7] between meals and breakfast skipping [8] have been associated with an amplified risk of obesity. The inverse dose-response relationship between physical activity and obesity among youth has also been highlighted in recent work [9]. Conversely, excessive sedentary behaviour has been associated with adverse consequences of obesity [10]. Furthermore, there is a considerable amount of evidence linking inadequate sleep to obesity [11]. Given the present-day trends in obesity, initiatives focused on promoting healthier and more active lifestyles among children and youth remain a national public health priority. In efforts to combat the issue of childhood obesity, Ontario’s Healthy Kids Strategy was formulated as a cross-government initiative to promote children’s health through focusing on three aspects: a healthy start, healthy eating and healthy active communities [12]. As a key component of this strategy, the Ministry of Health and Long Term Care (MOHLTC) recently announced the launch of a new provincial program, the Healthy Kids Community Challenge (HKCC) [13]. The HKCC is a community-based, multi-sectoral program where various community partners will work together to develop activities that promote healthy weights for children [14]. The Challenge is based on the EPODE (‘Ensemble Prévenons l'Obésité Des Enfants’, Together Let's Prevent Childhood Obesity) methodology; a model that promotes the involvement of multiple stakeholders at two levels: at the central level (ministries, non-governmental organizations, health groups) and the local level (political leaders, teachers, health professionals) [15]. Across Ontario, 45 communities were selected to take part in the HKCC initiative delivering local programs and activities to support children in becoming more active and healthy. According to the MOHLTC, Public Health Units are expected to play a crucial leadership role in the planning and implementation of initiatives in selected communities [14]. The MOHLTC will be supporting these communities through funding of up to $1.5 million over the span of 4 years to develop and implement local policies and programs aimed at preventing childhood obesity, training and support to develop local action plans and the provision of evidence based advice and tools [14]. In addition, the MOHLTC will aid in the identification of social marketing themes that will focus on addressing the risk and protective factors leading to childhood obesity and the provision of evaluation support in order for key outcomes to be measured and assessed [14].

2
Though the HKCC was formulated to target obesity within infants and children (ages 0 to 12 years), assessing outcomes among adolescents serves as a vital point of consideration when assessing the impact of this provincial program on youth outcomes over time. The goals of community-based initiatives utilizing social marketing approaches are supporting healthy changes within community environments, fostering change in community norms by delivering positive health messages as well as encouraging individual behaviour change [16]. Socio-ecologic models posit that the social and physical environments surrounding individuals act as primary determinants of health and health behaviours [17]. As such, health behaviours within both children and adolescents should be assessed when examining the impact of this community-based provincial initiative. Public health best practices have highlighted the significance of evaluating potentially promising interventions, like the HKCC, as a means to direct future efforts pertinent to obesity prevention within children and youth [18]. Furthermore, establishing appropriate baseline measures has been noted as a crucial component of a successful evaluation plan, when seeking to create an evaluation that may account for a program’s success in achieving any obesity reduction goal [19]. However, the ability to robustly evaluate the impact of the HKCC on obesity or other risk behaviour outcomes among children in the HKCC communities in Ontario over time is limited as no appropriate baseline data are available provincially specific to infants and children ages 0 to 12 years. As such, it will be difficult to garner any robust evidence pertaining to the effect of this large community-based initiative on outcomes in children moving forward. The planned HKCC evaluation strategy is better suited for process implementation evaluation of the HKCC components. However, despite the large opportunity lost with respect to evaluating obesity and behavioural outcomes in the HKCC among infants and children (ages 0 to 12 years) moving forward, there is a provincial data system in place (COMPASS) that can be used to robustly evaluate whether or not the HKCC has any impact on obesity or other risk behaviours among youth (ages 13 to 18 years) living in the communities participating in the HKCC over time. Within Ontario, the COMPASS study [https://uwaterloo.ca/compass-system/compass-system-projects/compass-study] provides a very rigorous data source for evaluating the impact of the HKCC [20]. COMPASS is a longitudinal study (commencing in 2012-13) designed to follow a large cohort of grade 9 to 12 students attending a convenience sample of Ontario and Alberta secondary schools for four years in order to gain an understanding of how changes in school environment characteristics (i.e. policies, programs, built environment characteristics) are associated with changes in youth health behaviours including obesity, healthy eating, physical activity tobacco use, alcohol and marijuana use, sedentary behaviour, school connectedness, bullying, and academic achievement [20]. Existing COMPASS data can be used as a robust baseline data set for evaluating the HKCC among youth since we have longitudinal data collected for 3 years prior to the implementation of the HKCC and because the COMPASS sample includes Ontario schools within HKCC communities, Ontario Schools not within HKCC communities but where there is potential for cross-contamination, and Alberta schools not at all impacted by the HKCC. Given the unique opportunity available to use existing data from the COMPASS study to evaluate the impact of the HKCC provincial initiative on obesity and other health behaviour

3
outcomes among youth, the purpose of this paper is to present the baseline data associated with our evaluation of the HKCC. The evaluation will incorporate key student-level outcome measures, including obesity, among a large sample of youth in grades 9-12 participating in the COMPASS study. All of the outcome measures in this technical report were assessed prior to the implementation of the HKCC challenge (baseline).
Design
COMPASS is a longitudinal study (commencing in 2012) designed to follow a cohort of grade 9 to 12 students attending a convenience sample of Ontario and Alberta secondary schools over the span of four years. Within year 1 (Y1: 2012-2013) of the study, 24,173 students from 43 schools were present within the sample. Within Year 2 (Y2: 2013-2014) of the study, an additional 46 schools were recruited in order to reach a total of 90 schools (79 within Ontario, 10 within Alberta) and 45,019 students. Alberta schools were added to our sample in Y2 in order to allow for the evaluation of provincial policies and/or programs between Ontario and Alberta schools over time. Within year 3 (Y3: 2014-2015), three schools dropped out of our study (2 Ontario, 1 Alberta) and one additional new school was recruited in Ontario, leaving the Y3 sample at a total of 87 schools and 42,062 students. For the purposes the baseline HKCC data presented here, schools were divided into four comparison groups based on their geographic location: Ontario schools in the COMPASS study located in communities participating in the provincial challenge (“HKCC schools”), Ontario schools in the COMPASS study in communities that would not be participating in the challenge (“non-HKCC Ontario schools”), Alberta schools that would serve as a control group (“Alberta controls”) and private schools that would serve as another control group (“Private schools”). Of the 45 communities that were selected to participate in the HKCC (http://www.health.gov.on.ca/en/public/programs/healthykids/hkcc.aspx#communities), six applied through Aboriginal Health Access Centres (AHACs) or Community Health Centres (CHCs). These HKCC communities serve a primarily Aboriginal clientele that cannot be geographically identified. Thus, the HKCC schools in this study are situated in one of the 39 HKCC communities that could be geographically defined. Further, though communities applied through named municipalities, many communities plan to target particular areas within their municipalities to focus their local HKCC activities (e.g., in low income areas). As such, prior to the outset of this study, Public Health Ontario (PHO) engaged with each HKCC community in a community mapping exercise to more accurately and systematically delineate their geographical boundaries (for more information on this process, please contact [email protected]). Secondary schools within and outside these more granular boundaries were used to define the COMPASS schools within HKCC communities (HKCC schools) and COMPASS schools within non-HKCC Ontario communities (non-HKCC Ontario schools) for the purposes of this analysis. Data collected from grade 9 to 12 students within the COMPASS study were used to examine the three waves of baseline prevalence data for overweight/obesity and additional behavioural outcomes potentially associated with the HKCC moving forward for each of these four distinct groups.

4
Student-level measures
All measures that were used within this report are consistent with national health guidelines and/or public health standards.
Self-reported Height & Weight (BMI) Students were asked, “How tall are you without your shoes on? (Please write your height in feet and inches OR in centimetres)” and “How much do you weigh without your shoes on? (Please write your weight in pounds OR in kilograms)”. Body mass index (BMI) was calculated for each student using the measures of weight (kg) and height (m) (BMI =kg/m2). Students with heights less than 4 feet (121.92cm), heights more than 6 foot 11 inches (210.82cm), weighs less than 45 pounds (20.41kg) and weights more than 390 pounds (176.90kg) were excluded. Students with BMI measurements less than 10 and more than 50 were also excluded. BMI scores were categorized into Underweight, Healthy Weight, Overweight or Obese. Weight status was determined using the BMI classification system of the World Health Organization, based on age and sex adjusted BMI cut-offs. These measures were tested previously and found to be both valid and reliable [21].
Self-Reported Physical Activity (MVPA) Students were asked, ““Mark how many minutes of HARD physical activity you did on each of the last 7 days. This includes physical activity during physical education class, lunch, after school, evenings and spare time.” For each respective day of the week, students reported the number of hours (0, 1, 2, 3, 4 hours) and minutes (0, 15, 30, 45 minutes) they spent completing hard physical activity. Students were also asked, “Mark how many minutes of MODERATE physical activity you did on each of the last 7 days. This includes physical activity during physical education class, lunch, after school, evenings and spare time. Do not include time spent doing hard physical activities.” For each respective day of the week, students reported the number of hours (0, 1, 2, 3, 4 hours) and minutes (0, 15, 30, 45 minutes) they spent completing moderate physical activity. Weekly time (min/wk) spent performing moderate to vigorous physical activity (MVPA) was calculated by summing the responses from the two 7-day recall questions about “HARD” and “MODERATE” PA . Testing showed these measures produce reliable and valid MVPA estimates. Consistent with the Canadian physical activity guidelines for youth [22], respondents who performed 60 minutes of moderate-to-hard activity each and every day of the past week were recorded as meeting the guidelines for at least 60 minutes of physical activity total (in minutes) per day.
Active Transportation Students were asked, “How do you usually travel to school? (If you use two or more modes or travel, choose the one that you spend most time doing)” (By car as a passenger, by car as a driver, by school bus, by public bus/subway/streetcar, by walking, by bicycling, other). Students were also asked, “How do you usually travel from school? (If you use two or more modes or travel, choose the one that you spend most time doing)” (By car as a passenger, by car as a driver, by school bus, by public bus/subway/streetcar, by walking, by bicycling, other). Students who reported walking or bicycling were classified as using active transportation to travel to and from school respectively.

5
Self-Reported Sedentary Behaviour Students were asked to report the average time in minutes per day (min/day) that they spent in five sedentary behaviors: “Watching/streaming TV shows or movies” ; “Playing video/computer games”; “Doing homework” ; “Talking on the phone”; “Surfing the internet” ; “Texting, messaging, emailing”; “sleeping”. Total daily sedentary behaviour was calculated by combining the total number of minutes per day that students spent watching/streaming TV shows or movies, playing video/computer games, doing homework, talking on the phone, surfing the internet, texting, messaging, and emailing . Consistent with the Canadian sedentary behavior guidelines for youth [23], respondents were classified as sedentary if they reported an average of more than 2 h of sedentary behavior a day.
Sleep Patterns The Cq asked respondents to report the average time in minutes per day (min/day) that they spent sleeping. Total sleep was calculated by combining the total number of minutes per day students spent sleeping
Canada’s Food Guide Servings
Fruits & Vegetable Intake Students were asked, “Yesterday, from the time you woke up until the time you went to bed, how many servings of vegetables and fruits did you have? One 'Food Guide' serving of vegetables and fruit includes pieces of fresh vegetable or fruit, salad or raw leafy greens, cooked leafy green vegetables, dried or canned or frozen fruit, and 100% fruit or vegetable juice.” (None, 1 serving, 2 servings, 3 servings, 4 servings, 5 servings, 6 servings, 7 servings, 8 servings, 9 or more servings). Participants were classified as meeting Canada’s Food Guide recommendations based on reporting the following minimum number of servings: 7 servings for females and 8 servings for males [24].
Meats & Alternatives Students were asked, “Yesterday, from the time you woke up until the time you went to bed, how many servings of meats and alternatives did you have? One 'Food Guide' serving of meat and alternatives includes cooked fish, chicken, beef, pork, or game meat, eggs, nuts or seeds, peanut butter or nut butters, legumes (beans), and tofu.” (None, 1 serving, 2 servings, 3 servings, 4 servings, 5 or more servings). Participants were classified as meeting Canada’s Food Guide recommendations based on reporting the following minimum number of servings: 2 servings for females and 3 servings for males [24].
Milk/ Alternatives Students were asked, “Yesterday, from the time you woke up until the time you went to bed, how many servings of milk and alternatives did you have? One 'Food Guide' serving of milk or milk alternatives includes milk, fortified soy beverage, reconstituted powdered milk, canned (evaporated) milk, yogurt or kefir (another type of cultured milk product), and cheese.” (None, 1 serving, 2 servings, 3 servings, 4 servings, 5 servings, 6 or more servings).

6
Participants were classified as meeting Canada’s Food Guide Recommendations based on reporting the following minimum number of servings: 3 servings for females and males [24].
Grain Products Students were questioned, “Yesterday, from the time you woke up until the time you went to bed, how many servings of grain products did you have? One 'Food Guide' serving of grain products includes bread, bagels, flatbread such as tortilla, pita, cooked rice or pasta, and cold cereal.” (None, 1 serving, 2 servings, 3 servings, 4 servings, 5 servings, 6 servings, 7 servings, 8 servings, 9 or more servings).Participants were classified as meeting Canada’s Food Guide Recommendations based on reporting the following minimum number of servings: 6 servings for females and 7 servings for males [24].
Analyses Descriptive statistics for each student outcome was computed using SAS 9.4 software. Chi squared tests were completed in order to test whether there were significant differences in the various outcomes being measured across groups (i.e. HKCC schools, non-HKCC Ontario schools, Alberta control schools, private schools). The relevant student outcomes were measured at three distinct time points (Y1, Y2 & Y3 of the COMPASS study) in order to provide relevant trend data when future data points are collected in upcoming evaluations. For the purposes of our baseline evaluation, Year 3 (2014-2015) of the COMPASS study was considered the true baseline year for the HKCC.
Results All Figures are presented in the Appendix at the end of this report.
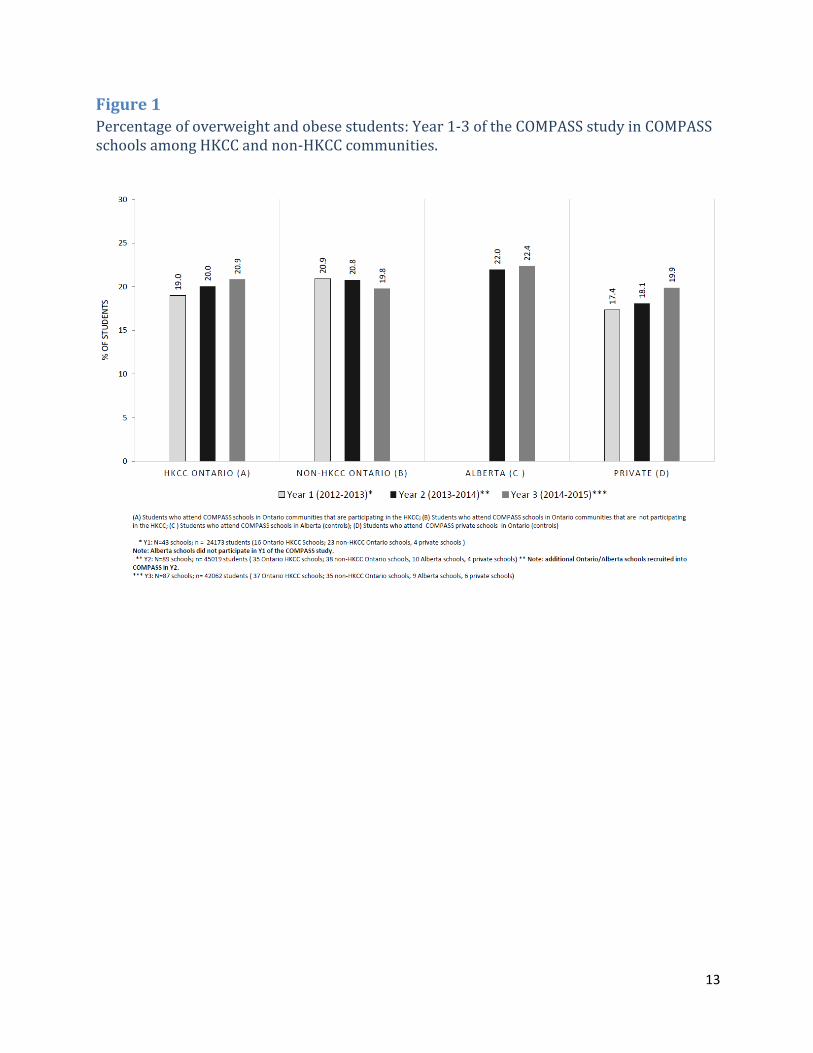
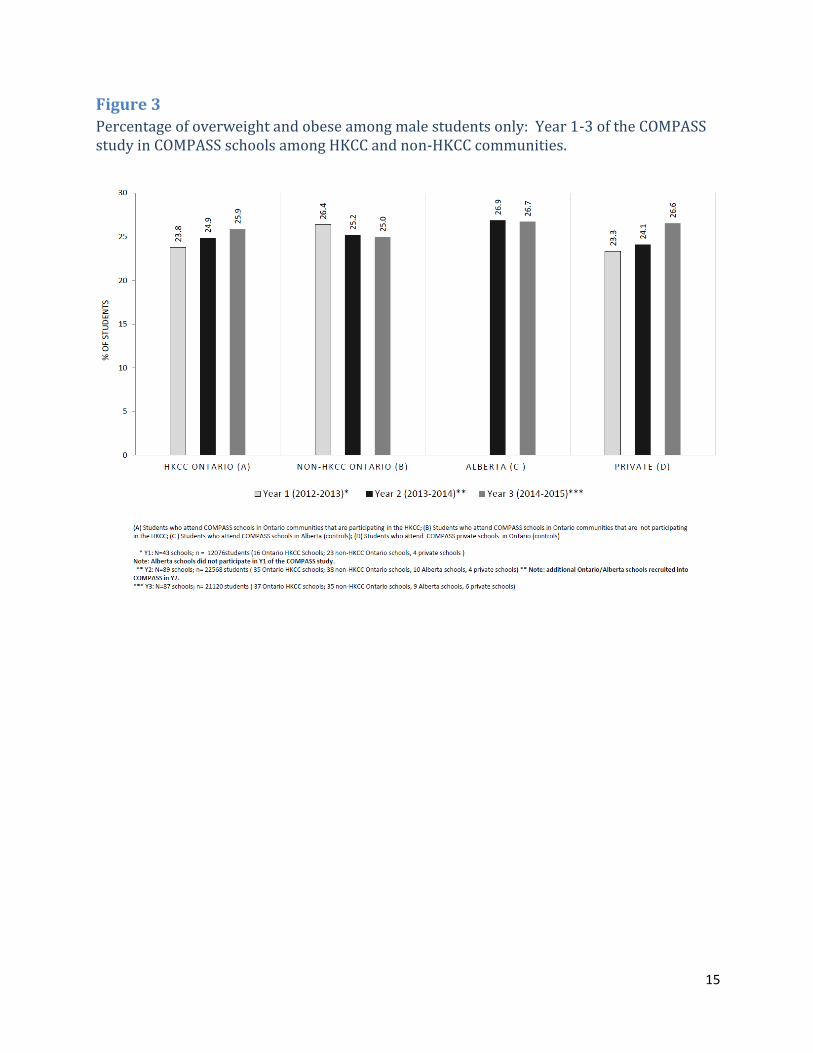
Obesity At baseline (Y3), the percentage of students that were overweight or obese in COMPASS schools within HKCC communities (20.9%) was slightly higher than that of students within non-HKCC communities (19.8%) (Figure 1). When examining baseline results (Y3), significant differences were present across all groups (p<0.0001). Similar trends were seen when examining prevalence rates by gender (Refer to Figure 2 for females and Figure 3 for males). Significant differences were also present across all groups, when examining the results by gender.
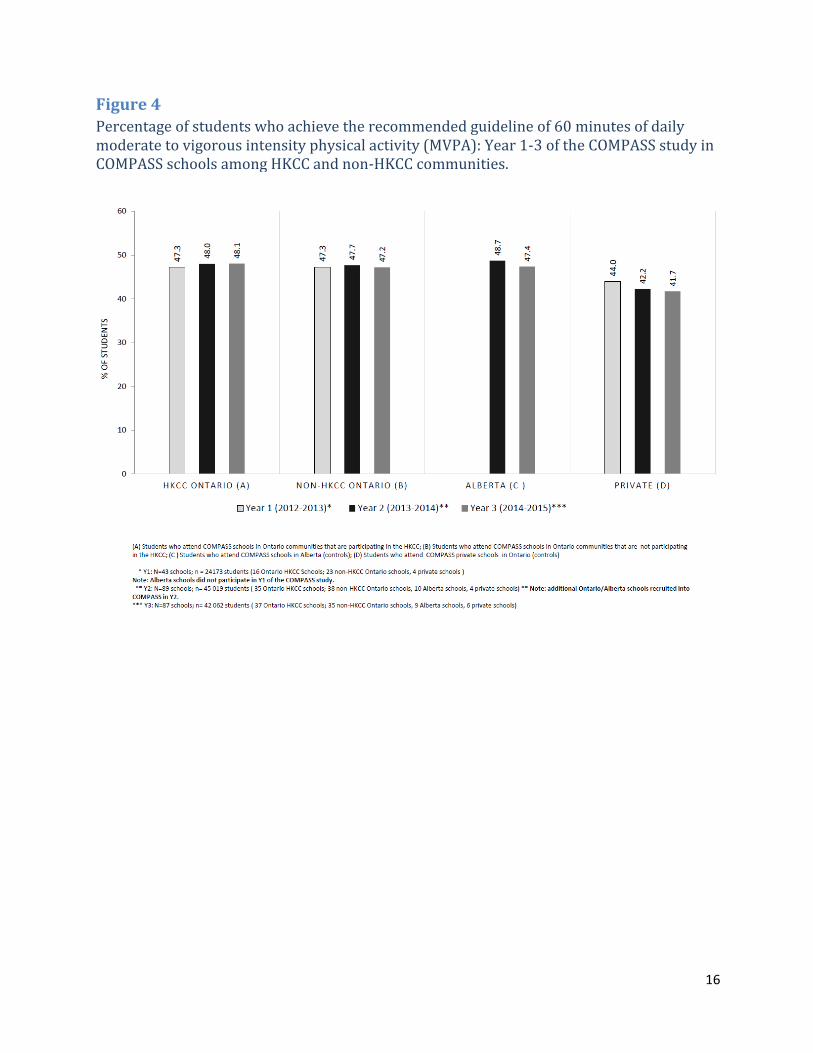
Physical Activity At baseline (Y3), the data showed that the prevalence of students in COMPASS schools within HKCC communities that achieved the recommended guideline of 60 minutes of daily MVPA (48.1%) was slightly higher in comparison to students in schools in non-HKCC communities (47.2%) (Figure 4). When examining baseline results (Y3), significant differences were present across all groups (p<0.0001).

7
Active Transportation At baseline (Y3), the prevalence of students at baseline who used active transportation (walked or cycled) to school (Figure 5) and from school (Figure 6) was slightly higher among COMPASS students in HKCC communities in comparison to non-HKCC Ontario communities. When examining baseline results (Y3), significant differences were present across all groups (p<0.0001).
Sedentary Behaviour At baseline (Y3), the percentage of COMPASS students who were considered highly sedentary (i.e. sedentary for more than 2 hours daily) within HKCC communities were slightly higher than those within non-HKCC Ontario communities (Figure 7). When examining baseline results (Y3), significant differences were present across all groups (p<0.0001).When examining multiple time points (Y1, Y2 & Y3 of COMPASS), trends indicated slight decreases in the percentage of COMPASS students exhibiting sedentary behaviour within both HKCC and non-HKCC Ontario communities. When examining baseline results (Y3), significant differences were present across all groups (p<0.0001).
Sleep Patterns An increasing trend in the percentage of COMPASS students obtaining inadequate sleep (ie. 6 or less hours of sleep per night) was apparent across both HKCC and non-HKCC Ontario communities when examining multiple time points (Y1, Y2 & Y3 of COMPASS) (Figure 8). In addition, slightly higher prevalence rates among COMPASS students were present within HKCC communities at baseline (27.9% vs. 27%). When examining baseline results (Y3), significant differences were present across all groups (p<0.0001).
Breakfast Skipping At baseline (Y3), the percentage of COMPASS students who skipped breakfast on one or more school days per week was seen to be higher (56.4 %) in HKCC communities in comparison to COMPASS students within non-HKCC Ontario communities (55.1 %) (Figure 9). When examining baseline results (Y3), significant differences were present across all groups (p<0.0001).
Canada Food Guide Servings At baseline (Y3), small differences were present between the percentage of female students in COMPASS schools who did not meet the recommended daily vegetables and fruits servings outlined by Canada’s Food Guide within both HKCC and non-HKCC Ontario communities (Figure 10). Similar results were seen when examining the percentage of male students in COMPASS schools who did not meet the recommended daily vegetables and fruits servings within HKCC and non-HKCC Ontario communities (Figure 11). When assessing baseline results (Y3), significant differences were present across all groups, when examining individuals by gender.

8
The percentage of female students in COMPASS schools who did not meet the recommended daily grains products servings outlined by Canada’s Food Guide was similar between HKCC and non-HKCC Ontario communities (Figure 12). Similarly, the percentage of male students in COMPASS schools at baseline who did not meet the recommended daily grains products servings was similar between HKCC and non-HKCC Ontario communities (Figure 13). When assessing baseline results (Y3), significant differences were present across all groups, when examining individuals by gender. Among COMPASS students within HKCC communities, the percentage of females at baseline who did not meet the recommended daily milk and alternatives servings was lower than that of females within non-HKCC communities (Figure 14). In contrast, the percentage of males in COMPASS schools at baseline who did not meet the recommended daily milk and alternatives serving was higher among males within HKCC communities (Figure 15). Significant differences were present across groups, in both males and females. The percentage of females in COMPASS schools who did not meet the recommended daily meat and alternatives servings were slightly lower among HKCC communities (Figure 16), whereas prevalence rates were similar across HKCC and non-HKCC Ontario communities among males (Figure 17). Significant differences were present across all groups, in both males and females.
Discussion
In 2012, Ontario set an ambitious goal of reducing childhood obesity by 20 percent in five years [12]. The evaluation of implemented interventions, continuous surveillance and monitoring of trends in obesity, and associated risk and protective factors will play a vital part in assessing whether these goals are met. The launch of the HKCC provincial initiative provides an ideal opportunity to evaluate if this type of large community-based obesity prevention intervention can effectively stem the increase in youth and childhood obesity. As prior research has shown some success in large school-based initiatives targeting obesity prevention among youth [28], this evaluation may provide a better understanding of key constituents of effective community-based programming. Furthermore, it may allow for the identification of key youth sub-groups at the greatest risk of obesity that may aid in the formulation of tailored prevention and treatment programs provincially. In general, the baseline data presented here indicates small yet significant differences across COMPASS schools located within and outside of HKCC communities. This suggests that overall, the HKCC initiative will be taking place in communities (and schools) that appear similar to many communities (and schools) not participating in the HKCC within Ontario and Alberta. Moving forward, we are interested to use the future waves of COMPASS data to examine if the HKCC has any impact on school-level obesity rates and individual student-level BMI over time change relative to the natural changes observed within the control schools in Ontario and Alberta. While we recognize that the HKCC has been formulated as a community-based initiative aimed at reducing childhood obesity, we believe that consistent
9
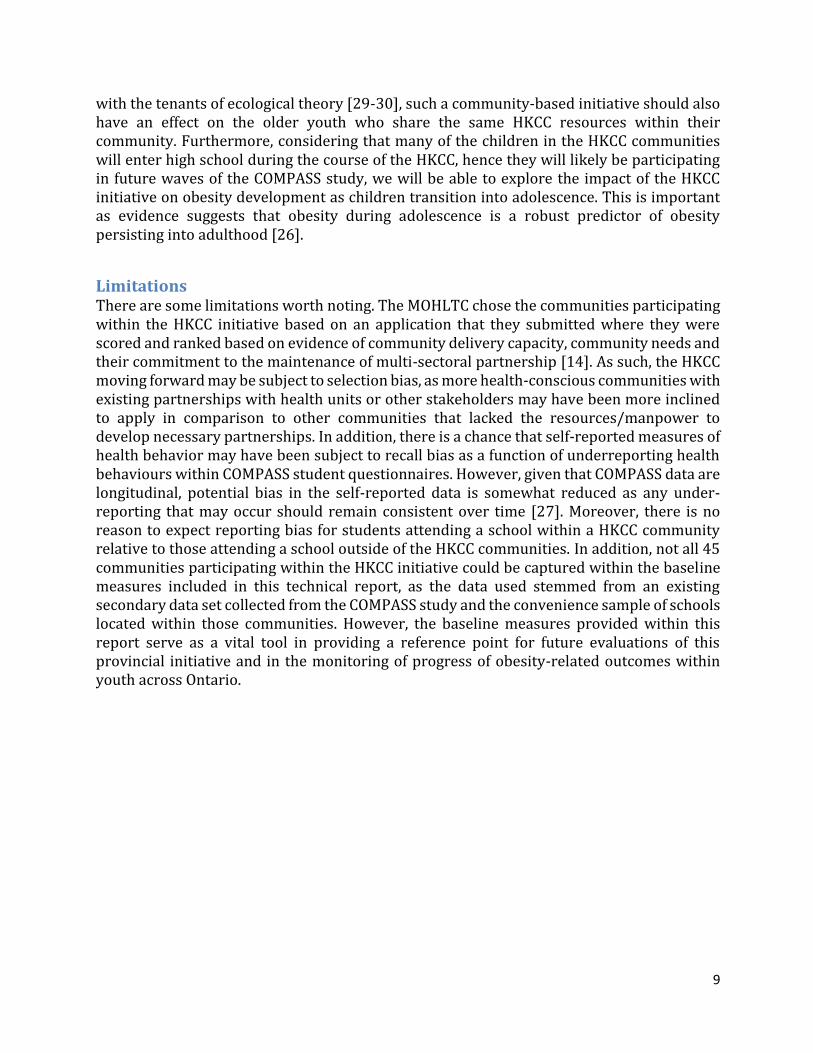
with the tenants of ecological theory [29-30], such a community-based initiative should also have an effect on the older youth who share the same HKCC resources within their community. Furthermore, considering that many of the children in the HKCC communities will enter high school during the course of the HKCC, hence they will likely be participating in future waves of the COMPASS study, we will be able to explore the impact of the HKCC initiative on obesity development as children transition into adolescence. This is important as evidence suggests that obesity during adolescence is a robust predictor of obesity persisting into adulthood [26].
Limitations There are some limitations worth noting. The MOHLTC chose the communities participating within the HKCC initiative based on an application that they submitted where they were scored and ranked based on evidence of community delivery capacity, community needs and their commitment to the maintenance of multi-sectoral partnership [14]. As such, the HKCC moving forward may be subject to selection bias, as more health-conscious communities with existing partnerships with health units or other stakeholders may have been more inclined to apply in comparison to other communities that lacked the resources/manpower to develop necessary partnerships. In addition, there is a chance that self-reported measures of health behavior may have been subject to recall bias as a function of underreporting health behaviours within COMPASS student questionnaires. However, given that COMPASS data are longitudinal, potential bias in the self-reported data is somewhat reduced as any under-reporting that may occur should remain consistent over time [27]. Moreover, there is no reason to expect reporting bias for students attending a school within a HKCC community relative to those attending a school outside of the HKCC communities. In addition, not all 45 communities participating within the HKCC initiative could be captured within the baseline measures included in this technical report, as the data used stemmed from an existing secondary data set collected from the COMPASS study and the convenience sample of schools located within those communities. However, the baseline measures provided within this report serve as a vital tool in providing a reference point for future evaluations of this provincial initiative and in the monitoring of progress of obesity-related outcomes within youth across Ontario.
10
References 1. World Health Organization. Population-based approaches to childhood obesity
prevention.2012;Availableat: http://www.who.int/dietphysicalactivity/childhood/WHO_new_childhoodobesity_PREVENTION_27nov_HR_PRINT_OK.pdf. Accessed July/29, 2015.
2. World Health Organization. Global Status Report on Noncommunicable Diseases 2010. 2012.
3. Roberts KC, Shields M, de Groh M, Aziz A, Gilbert JA. Overweight and obesity in children and adolescents: results from the 2009 to 2011 Canadian Health Measures Survey. Health Rep 2012, 23(3):37-41.
4. Singh AS, Mulder C, Twisk JW, van Mechelen W, Chinapaw MJ. Tracking of childhood overweight into adulthood: a systematic review of the literature. Obes Rev 2008, 9(5):474-488.
5. Morrison KM CJ. Clinical evaluation of obese children and adolescents. CMAJ 2007, 187(8). 6. Public Agency of Canada. Obesity in Canada, 2011. Available at: http://www.phac-
aspc.gc.ca/hp-ps/hl-mvs/oic-oac/determ-eng.php 7. Dubois L, Farmer A, Girard M, Peterson K. Regular sugar-sweetened beverage
consumption between meals increases risk of overweight among preschool-aged children. J Am Diet Assoc 2007, 107(6):924-34.
8. Dubois L, Girard M, Potvin Kent M, Farmer A, Tatone-Tokuda F. Breakfast skipping is associated with differences in meal patterns, macronutrient intakes and overweight among pre-school children. Public Health Nutr 2009, 12(1):19-28.
9. Gray CE, Barnes JD, Cowie Bonne J, Cameron C, Chaput JP, Faulkner G, et al. Results from Canada's 2014 Report Card on Physical Activity for Children and Youth. J Phys Act Health 2014, 11 Suppl 1:S26-32.
10. Tremblay MS, LeBlanc AG, Kho ME, Saunders TJ, Larouche R, Colley RC, et al. Systematic review of sedentary behaviour and health indicators in school-aged children and youth. Int J Behav Nutr Phys Act 2011, 21;8:98-5868-8-98.
11. Chen X, Beydoun MA, Wang Y. Is sleep duration associated with childhood obesity? A systematic review and meta-analysis. Obes 2008, 16(2):265-274.
12. Ontario Ministry of Health and Long Term Care. No Time to Wait: The Healthy Kids Strategy, 2013. Available at: http://www.health.gov.on.ca/en/common/ministry/publications/reports/healthy_kids/healthy_kids.aspx
13. Ministry of Health and Long-Term Care. It takes a Community to Raise a Healthy Child. 2015. Available at: http://www.health.gov.on.ca/en/public/programs/healthykids/.
14. Ministry of Health and Long Term Care. Presentation to the Association of Local Public Health Agencies (alPHa), 2014. Available at: http://c.ymcdn.com/sites/www.alphaweb.org/resource/collection/9221E880-473D-46C9-A428-F4F1A67305F8/KMS_HealthyKidsChallenge_210214.pdf.
15. Borys JM, Le Bodo Y, Jebb SA, Seidell JC, Summerbell C, Richard D, et al. EPODE approach for childhood obesity prevention: methods, progress and international development. Obes Rev 2012, 13(4):299-315.

11
16. Douglas Evans W, Christoffel KK, Necheles JW, Becker AB. Social marketing as a childhood obesity prevention strategy. Obes 2010, 18(1): S23-26.
17. Green LW, Kreuter MW. Health Program Planning: An Educational and Ecological Approach, 4th edn. McGraw-Hill Higher Education: New York, 2005.
18. King L, Gill T, Allender S, Swinburn B. Best practice principles for community-based obesity prevention: development, content and application. Obes Rev 2011, 12(5):329-338.
19. Centers for Disease Control and Prevention. Workplace Health Promotion. Evaluation, 2013. Available at: http://www.cdc.gov/workplacehealthpromotion/evaluation/.
20. Leatherdale ST, Brown KS, Carson V, Childs RA, Dubin JA, Elliott SJ, et al. The COMPASS study: a longitudinal hierarchical research platform for evaluating natural experiments related to changes in school-level programs, policies and built environment resources. BMC Public Health 2014, 14:331-2458-14-331.
21. World Health Organization. Growth Reference 5 to 19 years, 2007. Available at: http://www.who.int/growthref/who2007_bmi_for_age/en/.
22. Canadian Society for Exercise Physiology CSEP. Canadian Physical Activity Guidelines, 2012. Available at: http://www.csep.ca/CMFiles/Guidelines/CSEP_PAGuidelines_youth_en.pdf.
23. Canadian Society for Exercise Physiology CSEP. Canadian Sedentary Behaviour Guidelines. 2012.Available at: http://www.csep.ca/CMFiles/Guidelines/CSEP_SBGuidelines_youth_en.pdf
24. Health Canada. Eating Well with Canada's Food Guide, 2007. Available at: http://nutrition.uwo.ca/pdf/foodguide.pdf.
25. Leatherdale ST, Rynard V. A cross-sectional examination of modifiable risk factors for chronic disease among a nationally representative sample of youth: are Canadian students graduating high school with a failing grade for health? BMC Public Health 2013, 13:569-2458-13-569.
26. Whitaker RC, Wright RA, Pepe MS, Seidel KD, Dietz WH. Predicting obesity in young adulthood from childhood and parental obesity. New Eng J Med 1997, 337: 869-873.
27. Diggle PJ, Liang K-L, Zeger SL. Analysis of longitudinal data. 2nd ed. Oxford Science, Oxford; 2002.
28. Peterson KE, Spadano-Gasbarro JL, Greaney ML, Austin SB, Mezgebu S, Hunt AT, et al. Three-year improvements in weight status and weight-related behaviors in middle school students: The Healthy Choices Study. PLoS One. 2015, 21; 10(8):e0134470.
29. Bronfenbrenner U. The ecology of human development: experiments by nature and design. Cambridge, MA: Harvard University Press, 1979.
30. Lerner RM, Ostrom CW, Freel MA. Preventing health-compromising behaviors among youth and promoting their positive development: A developmental contextual perspective. In J. Schulenberg, J.L. Maggs & K. Hurrelmann (Eds.), Health Risks and Developmental Transitions During Adolescence (Pp. 498-521). New York, NY: Cambridge University Press, 1997.

12
APPENDIX
FIGURES
13
Figure 1
Percentage of overweight and obese students: Year 1-3 of the COMPASS study in COMPASS schools among HKCC and non-HKCC communities.

14
Figure 2
Percentage of overweight and obese among female students only: Year 1-3 of the COMPASS study in COMPASS schools among HKCC and non-HKCC communities.
15
Figure 3
Percentage of overweight and obese among male students only: Year 1-3 of the COMPASS study in COMPASS schools among HKCC and non-HKCC communities.
16
Figure 4
Percentage of students who achieve the recommended guideline of 60 minutes of daily moderate to vigorous intensity physical activity (MVPA): Year 1-3 of the COMPASS study in COMPASS schools among HKCC and non-HKCC communities.

17
Figure 5
Percentage of students who usually use active transportation (walk or cycle) to school: Year 1-3 of the COMPASS study in COMPASS schools among HKCC and non-HKCC communities.
18
Figure 6
Percentage of students who usually use active transportation (walk or cycle) from school: Year 1-3 of the COMPASS study in COMPASS schools among HKCC and non-HKCC communities.

19
Figure 7
Percentage of students who exceeded Canadian sedentary guidelines (more than 2 hours daily): Year 1-3 of the COMPASS study in COMPASS schools among HKCC and non-HKCC communities.

20
Figure 8
Percentage of students who obtain six or less hours of sleep per night: Year 1-3 of the COMPASS study in COMPASS schools among HKCC and non-HKCC communities.

21
Figure 9
Percentage of students who skip breakfast one or more school days: Year 1-3 of the COMPASS study in COMPASS schools among HKCC and non-HKCC communities.

22
Figure 10
Percentage of female students who do not meet the recommended daily vegetable & fruit servings according to Canada’s Food Guide: Year 1-3 of the COMPASS study in COMPASS schools among HKCC and non-HKCC communities.
23
Figure 11
Percentage of male students who do not meet the recommended daily vegetable & fruit servings according to Canada’s Food Guide: Year 1-3 of the COMPASS study in COMPASS schools among HKCC and non-HKCC communities.

24
Figure 12
Percentage of female students who do not meet the recommended daily grain products servings according to Canada’s Food Guide: Year 1-3 of the COMPASS study in COMPASS schools among HKCC and non-HKCC communities.

25
Figure 13
Percentage of male students who do not meet the recommended daily grain products servings according to Canada’s Food Guide: Year 1-3 of the COMPASS study in COMPASS schools among HKCC and non-HKCC communities.

26
Figure 14
Percentage of female students who do not meet the recommended daily milk & alternatives servings according to Canada’s Food Guide: Year 1-3 of the COMPASS study in COMPASS schools among HKCC and non-HKCC communities.

27
Figure 15
Percentage of male students who do not meet the recommended daily milk & alternatives servings according to Canada’s Food Guide: Year 1-3 of the COMPASS study in COMPASS schools among HKCC and non-HKCC communities.

28
Figure 16
Percentage of female students who do not meet the recommended daily meat & alternatives servings according to Canada’s Food Guide: Year 1-3 of the COMPASS study in COMPASS schools among HKCC and non-HKCC communities.

29
Figure 17
Percentage of male students who do not meet the recommended daily meat & alternatives servings according to Canada’s Food Guide: Year 1-3 of the COMPASS study in COMPASS schools among HKCC and non-HKCC communities.

30
University of Waterloo 200 University Ave. W., Waterloo, Ontario, Canada N2L 3G1
Telephone: (519) 888-4567 https://uwaterloo.ca/compass-system/compass-system-
projects/compass-study