Using Catastrophe-Linked Securities to Diversify Insurance Risk: A
22
125 Journal of Insurance Issues, 1999, 22, 2, pp. 125–146. Copyright © 1999 by the Western Risk and Insurance Association. All rights reserved. Using Catastrophe-Linked Securities to Diversify Insurance Risk: A Financial Analysis of Cat Bonds * Henri Loubergé,** Evis Kellezi,*** and Manfred Gilli**** Abstract: Severe natural catastrophes in the early 1990s generated a lack of financial capacity in the catastrophe line of the global reinsurance market. The finance industry reacted to this situation by issuing innovative products designed to spread the excess risk more widely among international investors (risk securitization). The paper reviews these developments and emphasizes their significance with respect to the economic theory of risk exchanges. Special attention is devoted to the case of catastro- phe-linked bonds, issued by ceding insurers to secure ex post conditional capital for the payment of claims. We analyze these new securities as financial portfolios combin- ing a straight bond and catastrophe options. Using option pricing theory and simula- tion analysis in a stochastic interest rate environment, we show that investors attracted by the potential for diversification benefits should not overlook the optional features when including these securities in an asset portfolio. [Keywords : insurance, cat bonds, cat options, investment.] INTRODUCTION ast decades have shown an increasing severity and frequency of losses arising from natural catastrophes: earthquakes, hurricanes, floods, and large-scale fires. It is still controversial whether an increasing fre- * The paper was presented at the University of Bordeaux in December 1997, at the annual meeting of the Western Risk and Insurance Association in January 1998, and at the Univer- sity of Alabama and the annual meeting of the European Group of Risk and Insurance Econ- omists in September 1998. The authors thank participants at these meetings, as well as an associate editor and a referee of this journal for their comments on earlier versions. They remain, however, responsible for any errors. ** Department of economics, University of Geneva. *** FAME doctoral program, University of Geneva. **** Department of econometrics, University of Geneva. P
Transcript of Using Catastrophe-Linked Securities to Diversify Insurance Risk: A

Using Catastrophe-Linked Securities to Diversify Insurance Risk: A Financial Analysis of Cat Bonds*
Henri Loubergé,** Evis Kellezi,*** and Manfred Gilli****
Abstract: Severe natural catastrophes in the early 1990s generated a lack of financialcapacity in the catastrophe line of the global reinsurance market. The finance industryreacted to this situation by issuing innovative products designed to spread the excessrisk more widely among international investors (risk securitization). The paperreviews these developments and emphasizes their significance with respect to theeconomic theory of risk exchanges. Special attention is devoted to the case of catastro-phe-linked bonds, issued by ceding insurers to secure ex post conditional capital forthe payment of claims. We analyze these new securities as financial portfolios combin-ing a straight bond and catastrophe options. Using option pricing theory and simula-tion analysis in a stochastic interest rate environment, we show that investors attractedby the potential for diversification benefits should not overlook the optional featureswhen including these securities in an asset portfolio. [Keywords : insurance, cat bonds,cat options, investment.]
INTRODUCTION
ast decades have shown an increasing severity and frequency of lossesarising from natural catastrophes: earthquakes, hurricanes, floods,
and large-scale fires. It is still controversial whether an increasing fre-
* The paper was presented at the University of Bordeaux in December 1997, at the annualmeeting of the Western Risk and Insurance Association in January 1998, and at the Univer-sity of Alabama and the annual meeting of the European Group of Risk and Insurance Econ-omists in September 1998. The authors thank participants at these meetings, as well as anassociate editor and a referee of this journal for their comments on earlier versions. Theyremain, however, responsible for any errors.** Department of economics, University of Geneva.*** FAME doctoral program, University of Geneva.**** Department of econometrics, University of Geneva.
P
125Journal of Insurance Issues, 1999, 22, 2, pp. 125–146.Copyright © 1999 by the Western Risk and Insurance Association.All rights reserved.

126 LOUBERGÉ ET AL.
quency of hurricanes and floods may be attributed to climate change(global warming), but it is clear that concentration of property in catastro-phe-prone coastal areas has generated an increase in the amount of losses.1
Heavy losses from natural catastrophes have become a source ofconcern for the insurance industry.2 The industry’s financial capacityseems to have been outpaced by potential losses.3 This is due to the factthat the risk of natural catastrophes is not widely diversifiable in aninsurance context, where insurers supply coverage in well-defined busi-ness lines. Natural catastrophes tend to occur in selected areas of the globe:seismic regions and ocean coasts. Moreover, only a subset of these regionsexpresses a demand for insurance coverage. Thus, reinsurers are not ableto disseminate the risk easily across the world. Moreover, cross-subsidiza-tion among different lines of business is not feasible in a competitiveenvironment.
Traditionally, government intervention is called for when the marketmechanism runs into difficulties. In the case of natural catastrophes, somesubsidized programs, such as the National Flood Insurance Program in theUnited States, exist or have been proposed. However, securitization ofnatural catastrophes risk has also been proposed recently as a solution tothe insurance capacity problem. In contrast to government programs,securitization represents an extension of the market mechanism. Specificconditional claims are issued and sold directly to financial investors. Thisoccurred already with the launching of cat spreads at the Chicago Boardof Trade (CBOT) and the issuing of cat bonds (or “Act-of-God” bonds) byinvestment banks on behalf of insurers or insurers’ subsidiaries. Shirreff(1999) reports that some insurers and reinsurers have become very activein this area of business, not only by issuing securities, but also by providingbid-ask quotes of cat bonds on-line.
The purpose of this paper is to shed some light on the prospects forsecuritization by assessing the financial attractiveness of cat bonds. Wedepart from most of the literature on catastrophe insurance primarily bynot considering catastrophe-linked securities from the point of view of theinsurance industry’s needs. We do not assess the potential for these secu-rities to solve the insurance capacity gap—at least not directly. We empha-size the financial investors’ viewpoint by concentrating on the particularrisks to which cat-bondholders are exposed. Indeed, a proper assessmentof these risks is required to prevent future delusions among investors andpave the ground for long-term solutions.
The next section briefly reviews the related literature. The followingtwo sections present cat options and cat bonds in more detail. In the fifthsection, a model for the pricing of cat bonds is presented and used to pointout the main financial characteristics of these securities. The sixth section

A FINANCIAL ANALYSIS OF CAT BONDS 127
presents a numerical model of cat bond valuation and some simulationresults. We analyze the sensitivity of cat bond prices to various changes inthe financial environment. We find that the parameters of the time-seriessample returns on cat bonds are non-stationary. The last section concludes.
RELATED LITERATURE
The difficulties faced by the insurance industry in dealing with catas-trophes has stimulated the publication of many recent articles and specialissues in risk and insurance journals. Some papers try to measure thecapacity of insurance markets to deal with catastrophic losses (Cumminsand Doherty, 1998). But most of the literature has focused on the search foralternatives or complements to traditional reinsurance (see Jaffee andRussell, 1997).
Mandatory public provision of coverage represents one alternative. Itrelies on the financial and fiscal ability of the State to spread losses bothacross many citizens and intertemporally. Such provision occurs in theUnited States with the National Flood Insurance Program. It was alsoimposed in a countries such as France, where all insureds pay an additionaltax on their property-liability insurance contracts to finance a public fundfor natural catastrophes (Magnan, 1995). However, mandatory govern-ment intervention is not free of problems. Prices are not adjusted to the risk,which results in subsidization of settlement in risk-exposed areas. More-over, geographic dispersion of the risk is constrained by national frontiers.
Non-mandatory uses of government intervention also are possible.Lewis and Murdock (1996) proposed to complete a Chicago cat spread withsimilar contracts supplied by a federal authority to cover losses in the rangeof $25 billion to $50 billion (see Cummins et al., 1998, for financial pricingof these contracts). Although the proposal is interesting, it remains to beseen whether government provision of reinsurance capacity could belimited to the upper loss layers, once the system is established. Moreover,the amount of insured losses would not necessarily be independent of theexistence of a federal program. Thus, the long-run ability of such a systemnot to interfere with private diversification of risk is problematic.
Economic theory teaches that losses that cannot be diversified awayin a portfolio of risks or an insurance-reinsurance pool should be sharedby economic agents according to their respective risk-tolerances (Borch,1962). Doherty and Schlesinger (1998) have shown that some kind ofmutualization of catastrophe risk along this line would be possible usinginnovations in contract design. But, as shown by Arrow (1963), financialmarkets provide an efficient mechanism for the sharing of non-diversifi-

128 LOUBERGÉ ET AL.
able social risk. Moreover, given their international development over thepast decades, they provide access to a huge pool of financial capacity.4 Forthese reasons, several authors have noted that financial markets have anatural vocation to complete insurance markets in the dissemination ofcatastrophe risks; see Doherty (1997), Kielholz and Durrer (1997), andSmith et al. (1997).
The contribution of financial markets to the international diversifica-tion of catastrophes risk may occur in two ways. First, additional capitalcould be provided to insurers and reinsurers active in this line of business.This has occurred already to a certain extent with the recent creation ofBermuda-based companies specialized in this line of business. Second, asnoted in the introduction, the securitization of catastrophe risks on behalfof the insurance industry could be organized.
There are reasons to believe that the second route is more promising.First, traditional equity financing means the provision of all-purpose cap-ital. It finances simultaneously general business risk and the risk of fluctu-ations in the amount of insured losses. In the case of multiple-line insurersand reinsurers it means that suppliers of capital are taking shares in aready-made portfolio of risks. They are constrained in the precise adjust-ment of their portfolio to their preferences and expectations. Second, equityfinancing represents ex ante capital. Unlike reinsurance, it does not provideex post conditional capital—capital if needed. For this reason, it should bemore expensive. Third, securitization offers direct access to the huge poolof capacity provided by the financial market.
The potential for risk securitization as a solution to the lack of adequatecapacity in the catastrophe line of insurance business is therefore quitehigh. It is very likely that the risk will be more largely shared by financialinvestors in the future, if rewards are adequate, given the diversificationeffects obtained by mixing catastrophe-linked securities with other assetclasses in a financial portfolio. So far, catastrophe risk securitization hasoccurred mainly using cat futures, cat options, and cat bonds. Cat futuresand cat options have been analyzed in several papers, including D’Arcyand France (1992), Boose and Graham (1994), Canter et al. (1996), Cumminsand Geman (1995), and O’Brien (1997). The more recently issued cat bondswere presented in Ganapati et al. (1997) and analyzed by Briys (1997). Ourpaper extends this literature by providing a simulation analysis of the therisks attached to cat bonds. We price a coupon cat bond and test thesensitivity of its duration, expected return, and variance of return tochanges in the model parameters.

A FINANCIAL ANALYSIS OF CAT BONDS 129
CHICAGO CAT OPTIONS
Catastrophe insurance options (and futures) were launched at theCBOT in December 1992. They were initially based on four indices ofnatural catastrophes compiled by the ISO (Insurance Services Office) fromdata recorded by 30 U.S. insurance companies. The four indices coveredfour geographic areas of the United States: west, middle west, east, andnational. However, they were computed on a quarterly basis only, whichmade the derivative products relatively unattractive.
Since October 1995, the contracts have been based on a new set ofindices produced by Property Claim Services (PCS). Nine indices arecompiled daily: one national, five regional (west, middle west, east, north-east, southeast), and three local (California, Florida, Texas). These indicesare highly representative, since they include about 80% of the U.S. catmarket. Moreover, futures contracts were dropped, and plain vanillaoptions were replaced by European call spreads (purchase of a call com-bined with the simultaneous writing of a call at a higher strike price). Thus,insurers and reinsurers are able to buy coverage as they would with layersof aggregate excess-of-loss reinsurance.
In principle, these contracts provide a powerful tool to hedge catastro-phe risks. Compared with traditional reinsurance treaties, they are mucheasier to negotiate, and they relieve the primary insurer from credit risk.However, they have met with only limited success so far. On the demandside, three reasons are proposed. First, basis risk5 could explain limitedinterest by insurers. Second, lack of financial education by insurers andreinsurers could be the direct cause of limited trading. Third, U.S. regula-tion and accounting procedures are pointed out as the culprit by someauthors, e.g., Smith et al. (1997).6 In our view, the third argument has morerelevance than the first two. But, fundamentally, the limited success of catderivatives should not be looked for on the demand side. We believe thattrading is limited mainly for lack of supply. A derivative market cannotoperate properly without liquidity. But liquidity is not provided by hedg-ers. It is provided by speculators trading on their information-based expec-tations and by arbitragers taking advantage of pricing discrepanciesarising between the cash and derivative markets. In the case of cat deriva-tives, arbitrage trading cannot take place because the underlying indexcannot be replicated, and speculative trading is limited by lack of informa-tion about prospective cat losses among the financial investors. Thus,although cat spreads are a useful hedging tool, it is unlikely that the marketwill be able to expand very much in the future.

130 LOUBERGÉ ET AL.
CAT BONDS
Cat bonds are designed in such a way that their return is contingentupon the occurrence of natural catastrophes or upon insurance claims fromsuch catastrophes. If nothing happens during a specified period (riskperiod), they behave as a standard coupon or zero-coupon bond. However,they provide a higher yield than the yield obtained on normal bonds issuedby similar institutions. If the risk materializes, the bondholder forgoes partof or the whole return. The coupons are not paid—or are paid partially. Inthe case of zero-coupon bonds, the bond is redeemed at below face value.In most cases, however, the capital initially invested is guaranteed.
When the trigger condition is a certain amount of losses, a develop-ment period is added to the risk period (as in the case of cat options), toallow precise calculation of losses. The trigger amount may be either theinsurer ’s own losses or industry-wide losses as reflected, e.g., in the PCSindex. In the former case, basis risk is eliminated, but investors face moralhazard since the insurer might be induced to inflate reported losses.
A much publicized example of cat bonds is the program of “earth-quake risk bonds” conceived by the California Earthquake Authority. Theprogram made provision for a $3.5 billion issue of 10-year bonds, withsemi-annual coupons. The redemption of principal was guaranteed at facevalue, but the coupons were subject to risk. If an earthquake with totallosses exceeding $7 billion occurred in California during a risk period offour years after issuance, interest payment was suspended for the rest ofthe bonds’ life. If earthquake losses did not hit the trigger value during therisk period, coupons were paid normally until redemption of the bonds.Of the total amount of $3.5 billion, $2 billion had to be invested to providefor the capital at maturity and $1.5 billion had to flow into an insurancefund.7
Other examples of cat bonds are provided by the “Natural CatastropheInsurance Notes” issued by AIG and by the United States AutomobileAssociation (USAA) issue. In the AIG case, only 85% of return was prom-ised if one earthquake occurred in the two-year bond life and only 40% iftwo earthquakes occurred. In the case of USAA, the fourth-largest home-owner insurer in the United States, the 1997 cat bond issue to an amountof $477 million was considered a great success. According to Quinn (1998),it oversubscribed 2.5:1, attracting investors worldwide struck by the strongcoupon attached to the bonds—575 basis points over LIBOR. Shirreff (1999)lists 18 cat bond issues launched between December 1996 and December1998, for a total of about $3 billion.
Typically, the funds are raised by a special-purpose company (calledResidential Re in the USAA case), often located offshore for tax and

A FINANCIAL ANALYSIS OF CAT BONDS 131
regulation reasons. This company invests the funds in riskless securities(U.S. Treasury bonds) providing the basis for redemption at maturity.Simultaneously, it enters into a reinsurance contract with the insurer. Thereinsurance premium is used to improve the bonds’ return if the risk doesnot materialize. If it does, it is used in conjunction with the portion of thefunds at risk to pay the reinsurance indemnities.
RISK ANALYSIS OF CAT BONDS
The marketing of cat bonds requires on diversification benefits, whichfinancial investors may reap from investing a modest share of their port-folio in these contingent securities. Canter et al. (1996) stressed that thecorrelation coefficient of annual returns between the S&P 500 and the PCSindex over the period 1949–1995 was slightly negative and insignificantlydifferent from zero. This empirical result is in accordance with the wide-spread view that natural catastrophes are uncorrelated with systematicfinancial market risk.8 Therefore, investment in cat bonds is claimed toimprove the risk-return pattern of an investment portfolio; as argued byKielholz and Durrer (1997), introducing these bonds into an internationallydiversified portfolio of stocks and bonds shifts the efficient frontier to theleft. However, as noted by Briys (1997), the same arguments were putforward some years ago to promote investment in junk bonds. Therefore,some caveats may be appropriate to prevent excess enthusiasm withrespect to these new instruments.(1) Risk-return calculations such as the one displayed by Kielholz and
Durrer (1997) are based on in-sample analysis. They are subject toestimation risk due to non-stationarity in the parameters (expectedreturns, variances, and covariances). As practical applications ofportfolio theory showed, out-of-sample analysis leads to differentresults.
(2) Cat bonds, like junk bonds, have optional features. For this reason, itis not appropriate to analyze their expected performance in a mean-variance framework. As Ambarish and Subrahmanyam (1989)demonstrated in the case of junk bonds, time series variations in theweight of the embedded option is an additional source of non-stationarity.
(3) Although cat bonds are essentially fixed-income securities, andalthough sensitivity of these securities to interest movements isgenerally a matter of concern, the issue of duration measurement hasbeen neglected in publications dealing with cat bonds. However, aspointed out by Briys (1997), cat bonds have unconventional durations.

132 LOUBERGÉ ET AL.
These aspects are illustrated using contingent claims modeling of catbonds and simulation analysis in the rest of the paper.
A Contingent Claim Model for the Pricing of Cat Bonds
For the sake of simplicity, we assume constant interest rates. Cat bondsin our model are zero-coupon bonds, issued at time 0 with face value F andmaturity time T. The bond payoff is contingent upon the value taken at timeT by an index of damages from natural catastrophes occurring during anexposure period (risk period) ending at time T’ < T. The index, with valueI(t) at time t, may be the PCS index—as in the case of the cat bond issuemanaged by Goldman Sachs on behalf of ACE Ltd.—or a specific natural-hazard index such as those published by Sigma. Further, the bond contractis assumed to be designed as follows. Final payoff is contingent upon therelationship between the value of the index at maturity, I(T), and a triggervalue, represented by K:
• If I(T) ≤ K, the payoff is F.
• If I(T) > K, the payoff is F – [I(T) – K]. However, in this case, a minimumpayoff of B is guaranteed.
Indeed, noting V(T), the bond value at time T, there are three states ofnature:
(1) If I(T) ≤ K, implying V(T) = F;
(2) K < I(T) < K + (F – B), implying V(T) = F – [I(T) – K] > B;
(3) I(T) ≥ K + (F – B), implying V(T) = B.
The end-of-period value of the bond is thus:
V(T) = F – Max[0, I(T) – K] + Max[0, I(T) – (K + F – B)].
This has the profile of a reverse call spread. Indeed, the zero-couponcat bond is a portfolio with three components:
(1) a long position in a riskless zero-coupon bond;
(2) a short position in a cat call with strike price K;
(3) a long position in a cat call with strike price K + F – B.
It is straightforward to determine the present value of such a portfolio:
V(0) = Fe–rT – CE(I(0), K, T) + CE(I(0), K + F – B, T) (1)
A FINANCIAL ANALYSIS OF CAT BONDS 133
where r is the constant interest rate, CE represents the fair price of aEuropean call option, and B, F, T, and K are the parameters of the cat bondcontract. For given values of these parameters, equation (1) yields the fairprice of the cat bond—the price that would be observed in the absence ofany arbitrage opportunity in a complete financial market. As F > B, it turnsout that V(0) < Fe–rT.
Assume that the index follows a geometric Brownian motion in con-tinuous time, so that: dI(t) = µI(t)dt + σI(t)dz(t). The assumption is partlyjustified on the ground that although catastrophes occur in discrete timeand may be modeled using a Poisson process, the estimated cost of naturalcatastrophes fluctuates in continuous time. This makes the assumptionstrictly valid for the valuation of cat bonds during the period starting attime T’, as no additional jump in the value of the index can occur after thisdate.9 A more general model is obtained by replacing the above Wienerprocess by a pure Poisson process (see the next section) or a mixed diffusionprocess (see Cummins and Geman, 1995).10 The main advantage of suchan assumption is heuristic: it allows a closed-form solution to be derivedfor the cat bond price (see also Briys, 1997). In our case, the Black-Scholes(1973) pricing model is applicable.11 The closed-form solution may be usedto derive the duration of a cat bond.
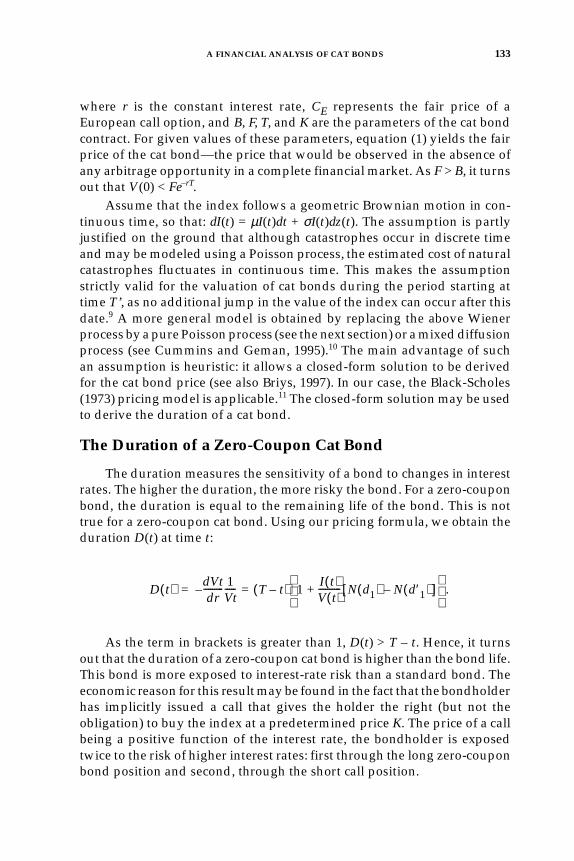
The Duration of a Zero-Coupon Cat Bond
The duration measures the sensitivity of a bond to changes in interestrates. The higher the duration, the more risky the bond. For a zero-couponbond, the duration is equal to the remaining life of the bond. This is nottrue for a zero-coupon cat bond. Using our pricing formula, we obtain theduration D(t) at time t:
.
As the term in brackets is greater than 1, D(t) > T – t. Hence, it turnsout that the duration of a zero-coupon cat bond is higher than the bond life.This bond is more exposed to interest-rate risk than a standard bond. Theeconomic reason for this result may be found in the fact that the bondholderhas implicitly issued a call that gives the holder the right (but not theobligation) to buy the index at a predetermined price K. The price of a callbeing a positive function of the interest rate, the bondholder is exposedtwice to the risk of higher interest rates: first through the long zero-couponbond position and second, through the short call position.
D t( ) dVtdr
--------- 1Vt----- T t–( ) 1
I t( )V t( )---------- N d1( ) N d′1( )–[ ]+
=–=

134 LOUBERGÉ ET AL.
This result has important implications for the attractiveness of catbonds as a diversification vehicle in global asset allocation. Althoughcatastrophe losses are empirically uncorrelated with financial marketreturns, it may be the case that cat bonds display significant positivecorrelation. Bond and stock returns are sensitive to interest-rate changes:higher interest rates depress stock prices as well as prices of already issuedbonds.12 As cat bond prices are more sensitive to interest-rate changes thanare regular bonds, it may be expected that they will display a positivecorrelation with financial market returns,13 despite their link to the catas-trophe index value. Thus, their financial attractiveness is diminished.
SIMULATION RESULTS
The model presented in the preceding section is useful because itmakes clear some specific features of cat bonds. However, the assumptionsmade to obtain a closed-form solution for the price of the bond limit itsapplicability. In this section, we develop a more general model for whichno closed-form solution is available. For this reason, we use simulationanalysis.
Distribution of Cat Bond Prices Under StochasticInterest Rates
In this model, the cat bond payoff is driven by two random factors: theindex level, generated by a Poisson process, and the interest rate, generatedby a binomial process. The cat bond is a coupon bond with a coupon rateof 8%. Its lifetime is four years. Its structure is similar to the earthquake riskbonds program of the California Earthquake Authority: redemption ofcapital at maturity is guaranteed, but the coupons are fully at risk. If theunderlying index of catastrophe losses exceeds a trigger value during thelife of the bond, the remaining coupons are not paid. As in the case of thePCS index, the initial index level is set at zero. However, we drop thedistinction between a risk period and a development period; the amountof losses is assumed to be known as soon as a catastrophe occurs.
The total period of four years is divided into eight half-year periods.The short-term interest rate changes at the end of each period, the changebeing driven by a binomial random walk process, as described in Kalotayet al. (1993). The binomial tree is constructed using the observed structureof yields to maturity on Treasury bonds with different lifetimes and avolatility measure for movements in interest rates. An example is providedin Appendix 1 for the case of four one-year periods: the short-term interest-rate volatility is assumed to be 10%, and given the strongly ascending

A FINANCIAL ANALYSIS OF CAT BONDS 135
structure of yields-to-maturity, we obtain eight distinct paths of risinginterest rates.
To simulate the index of catastrophes, we first draw the number ofcatastrophes occurring in each subperiod from a jump distribution withparameter λ = 2.2.14 Then the amount of losses generated by each catastro-phe is drawn from a lognormal distribution with parameter µ = 16 and σ =2.4. The loss amounts are then added up, periods after periods, to obtainthe index path. Given a trigger level for the index, the expected couponpayments are obtained as the product of the coupon value and the proba-bility that the index does not exceed the trigger at the end of each year.
For each index path and each interest-rate path, the cat bond price iscalculated as the present value of the guaranteed principal at maturity plusthe conditional coupon payments, given a trigger level. For eight periodsthere are 28 = 256 different interest-rate paths. Given the 10,000 simulationsof the index level, we get 2,560,000 bond prices. Assuming that the indexvalue is not correlated to financial market returns, the ex ante cat bond priceis obtained by taking the mean of the 2,560,000 prices. This price may alsobe computed more directly by taking the present value of the expected catbond payoffs along the binomial interest-rate tree. For example, using atrigger level K = 200 million, the unconditional probabilities of receivingthe coupons are given by the following sequence: P(I1 < K) = 0.7769, P(I2 <K) = 0.5682, P(I3 < K) = 0.3851, P(I4 < K) = 0.2474. Applying these probabil-ities and the interest-rate path of Appendix 1 yields an ex ante cat bondprice of 95.84.
Sensitivity Analysis
It is interesting to perform a sensitivity analysis by varying the differ-ent parameters used in the simulations, such as term structure and volatil-ity of interest rates, expected number of catastrophes, expected severity oflosses, coupon payments, and bond maturity. In general, it turns out thatthe bond price reacts quasi-linearly to changes in the parameters. Forexample, analyzing the sensitivity of the bond price to parallel shifts in theinitial structure of yields-to-maturity and to changes in the coupons, itturns out, as expected, that the bond price declines as the yields-to-matu-rity are increased and the coupons are reduced.
The simulation analysis confirms also the theoretical result of thepreceding section: the duration of a cat bond is higher than the duration ofa similar risk-free bond. For both securities, the duration is a decreasingfunction of the interest-rate level; for a given coupon, the duration is lowerwhen interest rates are higher (reinvestment of the coupon brings moreinterest payments). If the coupon is varied simultaneously, an increase
136 LOUBERGÉ ET AL.
(decrease) in interest rates is compensated by a decrease (increase) in thecoupon.
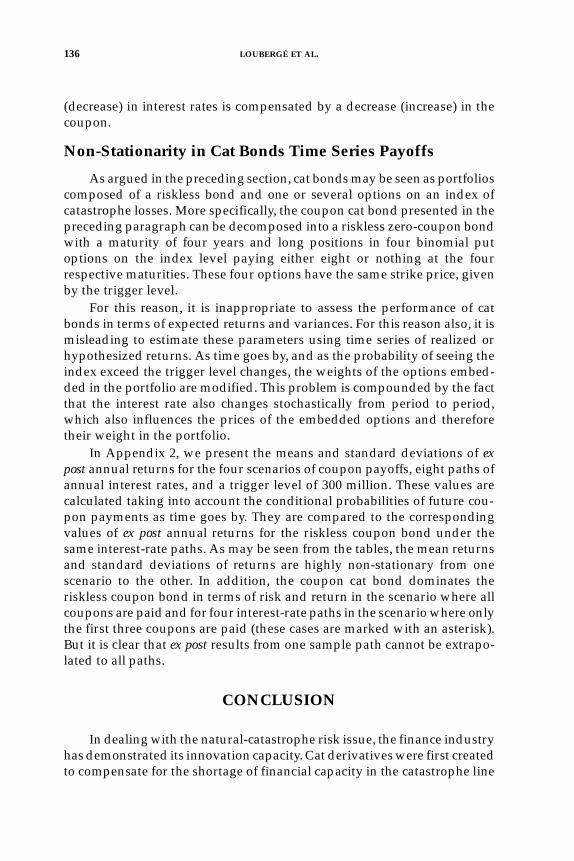
Non-Stationarity in Cat Bonds Time Series Payoffs
As argued in the preceding section, cat bonds may be seen as portfolioscomposed of a riskless bond and one or several options on an index ofcatastrophe losses. More specifically, the coupon cat bond presented in thepreceding paragraph can be decomposed into a riskless zero-coupon bondwith a maturity of four years and long positions in four binomial putoptions on the index level paying either eight or nothing at the fourrespective maturities. These four options have the same strike price, givenby the trigger level.
For this reason, it is inappropriate to assess the performance of catbonds in terms of expected returns and variances. For this reason also, it ismisleading to estimate these parameters using time series of realized orhypothesized returns. As time goes by, and as the probability of seeing theindex exceed the trigger level changes, the weights of the options embed-ded in the portfolio are modified. This problem is compounded by the factthat the interest rate also changes stochastically from period to period,which also influences the prices of the embedded options and thereforetheir weight in the portfolio.
In Appendix 2, we present the means and standard deviations of expost annual returns for the four scenarios of coupon payoffs, eight paths ofannual interest rates, and a trigger level of 300 million. These values arecalculated taking into account the conditional probabilities of future cou-pon payments as time goes by. They are compared to the correspondingvalues of ex post annual returns for the riskless coupon bond under thesame interest-rate paths. As may be seen from the tables, the mean returnsand standard deviations of returns are highly non-stationary from onescenario to the other. In addition, the coupon cat bond dominates theriskless coupon bond in terms of risk and return in the scenario where allcoupons are paid and for four interest-rate paths in the scenario where onlythe first three coupons are paid (these cases are marked with an asterisk).But it is clear that ex post results from one sample path cannot be extrapo-lated to all paths.
CONCLUSION
In dealing with the natural-catastrophe risk issue, the finance industryhas demonstrated its innovation capacity. Cat derivatives were first createdto compensate for the shortage of financial capacity in the catastrophe line

A FINANCIAL ANALYSIS OF CAT BONDS 137
of the global reinsurance market. Cat bonds were launched more recentlyto avoid the liquidity problems faced by the cat derivative market. Thesenew securities concern financial investors more directly by enlarging theuniverse of primary securities (stocks and bonds) accessible for global assetallocation. They make the securities market more complete.
Cat bonds represent a valuable innovation. They are a powerful toolto improve the worldwide diversification of insurance risk. They concernnatural-catastrophe risk now, but the concept is applicable to other kindsof risks in the future.15 However, the theoretical analysis and the simulationresults presented in this paper show that their financial attractivenessshould not be overstated. A cat bond is a combination of a straight bondand options on insured catastrophes. The option component generates anasymmetric payoff at maturity. Even if cat bonds provide a useful diversi-fication vehicle, it is therefore inappropriate to use the standard mean-variance model to assess the risk-return performance of a portfolio includ-ing a share in cat bonds. Stochastic dominance analysis would seem moreappropriate.
For the same reason, investors should not overlook that the durationof cat bonds is larger than the duration of similar straight bonds. Therefore,cat bond prices are more sensitive to movements in interest rates. It ismisleading to use the absence of correlation between financial marketreturns and catastrophe insurance losses to infer that cat bonds are zero-beta securities. Positive correlation results from common sensitivity tointerest-rate changes.
Finally, because a cat bond is a portfolio, the parameters of the time-series sample returns on this portfolio may be highly non-stationary. Astime goes by, the value of the embedded options changes, and this changesthe composition of the portfolio. It is therefore hazardous to assess thefuture performance of cat bonds on the basis of their sample distributionof returns.
Our simulation results are preliminary and will have to be confirmedby additional research. In particular, the model presented assumes nocorrelation between losses from catastrophes and security returns.Although this assumption is supported by past experience, it may not bevalid for the future. In addition, the interest-rate process on which ourresults are based is unsophisticated and should be replaced by a moreflexible process in future research.
Despite these caveats, we think that these results have direct relevancefor prospective investors in cat bonds. They have also indirect relevancefor insurers and reinsurers. The diversification potential of cat bonds is oneargument, but given their specific risks, the success of these securities inproviding additional capacity for coverage of catastrophe risk will depend
138 LOUBERGÉ ET AL.
on their yield spread. Numerical pricing of cat bonds, as used in this paper,provides a powerful tool to estimate the appropriate spread.
APPENDIX 1
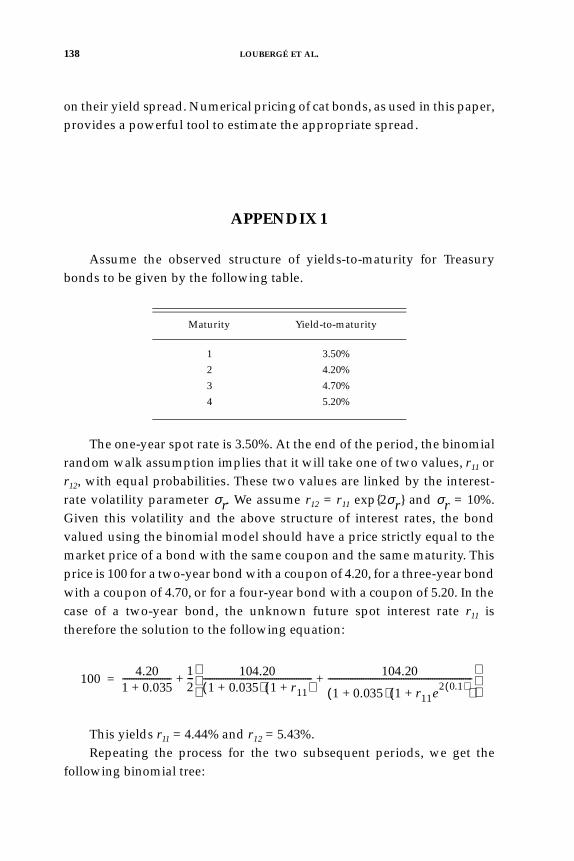
Assume the observed structure of yields-to-maturity for Treasurybonds to be given by the following table.
The one-year spot rate is 3.50%. At the end of the period, the binomialrandom walk assumption implies that it will take one of two values, r11 orr12, with equal probabilities. These two values are linked by the interest-rate volatility parameter σr. We assume r12 = r11 exp{2σr} and σr = 10%.Given this volatility and the above structure of interest rates, the bondvalued using the binomial model should have a price strictly equal to themarket price of a bond with the same coupon and the same maturity. Thisprice is 100 for a two-year bond with a coupon of 4.20, for a three-year bondwith a coupon of 4.70, or for a four-year bond with a coupon of 5.20. In thecase of a two-year bond, the unknown future spot interest rate r11 istherefore the solution to the following equation:
This yields r11 = 4.44% and r12 = 5.43%.Repeating the process for the two subsequent periods, we get the
following binomial tree:
Maturity Yield-to-maturity
1 3.50%
2 4.20%
3 4.70%
4 5.20%
1004.20
1 0.035+---------------------- 1
2--- 104.20
1 0.035+( ) 1 r11+( )------------------------------------------------- 104.20
1 0.035+( ) 1 r11e2 0.1( )
+( )-----------------------------------------------------------------+
+=

A FINANCIAL ANALYSIS OF CAT BONDS 139
APPENDIX 2
The results in this appendix are based on the same assumptions as inthe text concerning the bond contract and the stochastic process for theindex. The four-year bond pays an annual conditional coupon of 8 and itsredemption value is 100 with certainty. The Poisson and lognormal param-eters are: λ = 2.2, µ = 16, and σ = 2.4. However, the trigger level is K = 300million. In addition, the T-bond yield structure recorded on October 7, 1997is used to generate the binomial tree of interest rates.
Using the above yields-to-maturity, we get the following interest-ratetree:
These interest rates are first used to compute the tree structure for thedefault-free bond payoffs:
9.9187%
7.01%
5.43% 7.5312%
3.50% 5.74%
4.44% 6.1660%
4.70%
5.0483%
Maturity Yield-to-maturity
1 5.36%
2 5.65%
3 5.72%
4 6.78%
14.03%
7.11%
6.55% 11.49%
5.36% 5.82%
5.37% 9.41%
4.77%
7.70%

140 LOUBERGÉ ET AL.
The payoffs in the table are given by the sum of the default-free bondprice (computed as the expected present value of the two subsequentpayoffs) and the sure coupon (8). For instance: 102.71 = [108/(1.1403)] + 8;104.90 = [0.5(102.71 + 104.87)/(1.0711)] + 8.
In order to calculate the cat bond payoffs under the different scenariosof coupon payments, we need to know the conditional probabilities thatthe index will exceed the trigger value. The reason is that these probabilitieschange as we proceed through the interest-rate tree, and this affectsthe cat bond prices (and hence the ex post returns). Given that
, for s < t, we get:
.
Using the unconditional probabilities that the index remains below 300million, we are thus able to compute the following table of conditionalprobabilities:
The first row is used to compute the ex ante cat bond price, yielding93.20.
108
102.71
104.90 108
107.89 104.87
104.22 107.97 108
111.72 106.71
110.60 108
108.28
108
t 1 2 3 4
0.8310 0.6637 0.4974 0.3605
– 0.7987 0.5986 0.4338
– – 0.7494 0.5432
– – – 0.7248
P It K Is K><( ) 0=
P It K Is K<<( )P It K<( )P Is K<( )-----------------------=
P It K I0<( ) 0=
P It K I1<( ) K<
P It K I2<( ) K<
P I4 K I 3<( ) K<

A FINANCIAL ANALYSIS OF CAT BONDS 141
The tree stucture for expected cat bond payoffs follows.
We use the same procedure as before, except that the expected couponpayments are substituted for a riskless coupon of 8. Hence, 102.884 =[(8)(0.3605)] + 100; 94.20 = [102.884/1.1403] + [(8)(0.4974)]; 94.22 = [0.5(94.20+ 96.26)/(1.0711)] + [(8)(0.6637)], and so on.
Keeping an initial price of 93.20, the conditional probabilities in theabove table are then used to compute the cat bond prices and payoffs underthe different scenarios of coupon payments. The second row in the tableproduces the cat bond prices at t = 1, contingent upon the payment of thefirst coupon. The third row leads to the cat bond prices at t =2, contingentupon the payment of the second coupon. The fourth row yields the cat bondprices at t = 3, contingent upon the payment of the third coupon. When thepayment of the coupon is cancelled, the cat bond prices are simply givenby the present values of redemption at maturity, along the various interest-rate paths. The ex post mean returns and standard deviations of returns arefinally calculated on the basis of the prices and payoffs along each interest-rate path for each scenario of coupon payment.
With four periods, there are eight distinct interest-rate paths. They areidentified in the tables below, using the following numbering of nodes inthe following interest-rate tree.
The results are as follows.
102.884
94.20
94.22 102.884
96.43 96.26
93.20 97.10 102.884
99.97 98.01
99.57 102.884
99.51
102.884
7
4
2 8
1 5
3 9
6
10

142 LOUBERGÉ ET AL.
Case of default-free bond:
Case where no coupon is paid:
Case where only the first coupon is paid:
Interest-rate path Mean returns Standard deviations
1-2-4-7 6.82 4.31
1-2-4-8 6.78 3.30
1-2-5-8 6.72 3.31
1-2-5-9 6.69 2.38
1-3-5-8 6.65 3.08
1-3-5-9 6.62 2.04
1-3-6-9 6.57 2.08
1-3-6-10 6.54 0.87
Interest-rate path Mean returns Standard deviations
1-2-4-7 1.76 12.75
1-2-4-8 1.76 12.44
1-2-5-8 1.76 12.44
1-2-5-9 1.76 12.23
1-3-5-8 1.76 9.95
1-3-5-9 1.76 9.67
1-3-6-9 1.76 9.67
1-3-6-10 1.76 9.47
Interest-rate path Mean returns Standard deviations
1-2-4-7 3.85 10.10
1-2-4-8 3.85 9.70
1-2-5-8 3.85 7.80
1-2-5-9 3.85 7.44
1-3-5-8 3.77 10.27
1-3-5-9 3.77 10.06
1-3-6-9 3.77 8.55
1-3-6-10 3.77 8.33

A FINANCIAL ANALYSIS OF CAT BONDS 143
Case where the first two coupons are paid:
Case where the first three coupons are paid:
Case where the four coupons are paid:
Interest rate path Mean returns Standard deviations
1-2-4-7 5.95 7.63
1-2-4-8 5.93 5.88
1-2-5-8 5.87 7.96
1-2-5-9 5.87 6.69
1-3-5-8 5.79 7.82
1-3-5-9 5.79 6.53
1-3-6-9 5.74 8.15
1-3-6-10 5.74 7.20
Interest rate path Mean returns Standard deviations
1-2-4-7* 7.99 0.93
1-2-4-8* 7.95 2.51
1-2-5-8* 7.89 2.54
1-2-5-9 7.85 3.48
1-3-5-8* 7.81 2.18
1-3-5-9 7.78 3.22
1-3-6-9 7.73 3.26
1-3-6-10 7.70 4.02
Interest rate path Mean returns Standard deviations
1-2-4-7* 9.92 3.62
1-2-4-8* 9.88 2.68
1-2-5-8* 9.81 2.77
1-2-5-9* 9.78 1.96
1-3-5-8* 9.74 2.52
1-3-5-9* 9.70 1.59
1-3-6-9* 9.65 1.74
1-3-6-10* 9.62 0.81

144 LOUBERGÉ ET AL.
NOTES
1 From 1970 to 1990, population in the Pacific and South Atlantic coastal states of the UnitedStates increased by 51% and 45% respectively, compared to a countrywide increase of 24% overthe same period.2 Insurers had to pay $12.5 billion for the Northridge earthquake (1994) and $16 billion for Hur-ricane Andrew (1992). Hurricane Hugo (1989) cost them $5 billion, Hurricane Opal (1995) $2.1billion, and Hurricane Fran (1996) $1.6 billion. Insured losses in excess of $1 billion has beenthe rule rather than the exception since the end of the 1980s; see exhibit 8 in Canter et al. (1996).3 The total capital of the U.S. property-casualty insurance industry is estimated at $200 billion,of which $20 billion is provided by reinsurers (Kielholz and Durrer, 1997). The coverage ca-pacity in the catastrophe line of business (direct insurance and reinsurance) is estimated at $25billion. This falls short of the reference losses estimated by reinsurers at $50 billion for Cali-fornia earthquakes and $45 billion for East Coast storms, and it is well below the maximumlosses expected from these two kinds of events—$100 billion for California earthquakes and$85 billion for East Coast storms.4 Total capitalization of the U.S. financial market amounts to $19 trillion, with a daily standarddeviation of $133 billion, which means that the typical daily fluctuation in the total value ofU.S. securities is easily able to cover the maximum probable loss from a California earthquake!5 Basis risk occurs because the indices reflect an aggregate amount of national or regionallosses. They are not necessarily strongly correlated with losses recorded by individual insurerson their own portfolios of cat risks.6 Some states do not allow cat derivatives to be considered a hedging tool for the definition ofinsurers’ net liabilities. As net liabilities usually provide the basis for calculation of solvencyratios, insurers using derivatives instead of reinsurance as a hedging device are penalized byregulation.7 Eventually, this program was not marketed because the whole bond issue was purchased bya Bermuda-based reinsurance subsidiary of Berkshire Hathaway, which offered to reinsure thetotal fund of $1.5 billion for a four-year premium of $590 million (Smith et al., 1997). But it re-mains as a benchmark for subsequent issues. 8 There are different opinions. As a referee pointed out, a big natural disaster might affectsecurity returns. The point is that natural disasters are regional phenomena, whereas the fi-nancial market operates worldwide.9 This is not a strong assumption. As experience with the Northridge earthquake showed, theestimated cost of a major catastrophe may fluctuate widely after occurrence of the event (seeCanter et al., 1996).10 Indeed, Cummins and Geman (1995) use a mixed diffusion process for the event period anda pure Brownian motion for the reporting period. The Poisson process represents “major”catastrophes. The Wiener process reflects small catastrophes and randomness in reporting.11 Under this assumption, we obtain, for t > T':
with:
V t( ) Fe r T t–( )–1 N d′2( )–[ ] I t( ) N d1( ) N d′1( )–[ ]–
Ker T t–( )–
N d2( ) N d′2( )–[ ] Ber T t–( )–
N d′2( )+ +
=
d1
ln I t( ) K⁄( ) rσ2
2------+
T t–( )+
σ T t–---------------------------------------------------------------------- d2 d1 σ T t––=,=
d′1ln I t( ) K F B–+⁄( ) r σ2
2------+
T t–( )+
σ T t–------------------------------------------------------------------------------------------ d′2 d′1 σ T t––=,=

A FINANCIAL ANALYSIS OF CAT BONDS 145
12 For an empirical justification, see, e.g., Jensen and Johnson (1995).13 Future research on cat bonds will have to test this conjecture empirically.14 λ represents the expected number of catastrophes per year. We chose the value of 2.2 becausethis is the order of magnitude of the mean number of catastrophes recorded in the UnitedStates during the period 1949–1994.15 However, moral hazard will set bounds on the applicability of the concept. Moral hazard islimited in the case of natural catastrophes. This would not be the same in the case of man-madecatastrophes (e.g., oil spills) or in the case of social risks such as unemployment or health.
REFERENCES
Ambarish, R., and M. Subrahmanyam (1989) “Default Risk and the Valuation ofHigh-Yield Bonds: A Methodological Critique,” in E. Altman, editor, InvestmentPerformance of Fixed Income Securities, New York.
Arrow, J. K.(1963) “The Role of Securities in the Optimal Allocation of Risk-Bearing,” Review of Economic Studies, Vol. 31, pp. 91–96.
Black, F., and M. Scholes (1973) “The Pricing of Options and Corporate Liabilities,”Journal of Political Economy, Vol. 81, May, pp. 637–659.
Boose, M. A., and A.S. Graham (1994) “An Examination of the Futures Market forCatastrophe Insurance,” Journal of Insurance Issues, Vol. 17, October, pp. 23–43.
Borch, K. (1962) “Equilibrium in a Reinsurance Market,” Econometrica, Vol. 30, pp.424–444.
Briys, E. (1997) From Genoa to Kobe: Natural Hazards, Insurance Risks and the Pricingof Insurance-Linked Bonds. London, Lehman Brothers International.
Canter, M. S., J. B. Cole, and R. L. Sandor (1996) “Insurance Derivatives: A NewAsset Class for the Capital Markets and a New Hedging Tool for the InsuranceIndustry,” Journal of Derivatives, Winter, pp. 89–104.
Cummins, D., and N. Doherty (1998) “Can Insurers Pay for the Big One? Measuringthe Capacity of an Insurance Market to Respond to Catastrophic Losses,”working paper, Wharton School, University of Pennsylvania.
Cummins, D., and H. Geman (1995) “Pricing Catastrophe Futures and Call Spreads:An Arbitrage Approach,” Journal of Fixed Income, March, pp. 46–57.
Cummins, D., C. M. Lewis, and R. D. Phillips (1998) “Pricing Excess-of-LossReinsurance Contracts Against Catastrophic Loss,” in K. Froot, editor, Financingthe Risk of Catastrophic Loss. National Bureau of Economic Research.
D’Arcy, S. P., and V. G. France (1992) “Catastrophe Futures: A Better Hedge forInsurers,” Journal of Risk and Insurance, Vol. 59, December, pp. 575–600.
Doherty, N. (1997) “Innovations in Managing Catastrophe Risk,” Journal of Risk andInsurance, Vol. 64, December, pp. 713–718.
Doherty, N., and H. Schlesinger (1998) “Securitization and Insurance Contracts,”working paper, University of Alabama.
Ganapati, S., M. Retik, P. Puleo, and B. Starr (1997) Introduction to Catastrophe-LinkedSecurities. Lehman Brothers, Fixed Income Research.
Jaffee, D., and T. Russell (1997) “Catastrophe Insurance, Capital Markets andUninsurable Risks,” Journal of Risk and Insurance, Vol. 64, June, pp. 205–230.

146 LOUBERGÉ ET AL.
Jensen, J. and R. Johnson (1995) “Discount Rate Changes and Security Returns inthe United States, 1962–1991,” Journal of Banking and Finance, Vol. 19, pp. 79–95.
Kalotay, A. J., G. O. Williams, and F.J. Fabozzi (1993) “A Model for the Valuationof Bonds and Embedded Options,” Financial Analysts Journal, May–June, pp. 35–46.
Kielholz, W., and A. Durrer (1997) “Insurance Derivatives and Securitization: NewHedging Perspectives for the U.S. Cat Insurance Market,” The Geneva Papers onRisk and Insurance—Issues and Practices, No. 82, January, pp. 3–16.
Lewis, C. M., and K. C. Murdock (1996) “The Role of Government Contracts inDiscretionary Reinsurance Markets for Natural Disasters,” Journal of Risk andInsurance, Vol. 63, December, pp. 567–597.
Magnan, S. (1995) “Catastrophe Insurance System in France,” The Geneva Papers onRisk and Insurance—Issues and Practices, No. 77, October, pp. 474–480.
O’Brien, T. (1997) “Hedging Strategies Using Catastrophe Insurance Options,”Insurance: Mathematics and Economics, Vol. 21, pp. 153–162.
Quinn, L. R. (1998) “Reinsurance and Wall Street vs. Mother Nature,” Contingencies,September–October, pp. 20–27.
Shirreff, D. (1999) “Praying for a Catastrophe,” Euromoney, February, pp. 38–42.Sigma, Publication of the Swiss Reinsurance Company, Zürich.Smith, R. E., A. E. Canelo, and A. M. Di Dio (1997) “Reinventing Reinsurance Using
the Capital Market,” The Geneva Papers on Risk and Insurance - Issues and Practices,No. 82, January, pp. 26–37.