USING BIG DATA TO EVALUATE SOCIAL IMPACT IN RIOâ€S FAVELAS
15
USING BIG DATA TO EVALUATE SOCIAL IMPACT IN RIO‘S FAVELAS MG437 Business Model Innovation at the Base of the Pyramid Prof. Harry Barkema LSE Academic research and consulting project in collaboration with IBM Final report December 17th, 2012 Word Count: 2993 Candidate numbers: 80034, 85888, 71184, 79649, 74817
Transcript of USING BIG DATA TO EVALUATE SOCIAL IMPACT IN RIOâ€S FAVELAS

USING BIG DATA TO EVALUATE SOCIAL IMPACT IN RIO‘S FAVELAS MG437 Business Model Innovation at the Base of the Pyramid Prof. Harry Barkema LSE Academic research and consulting project in collaboration with IBM Final report December 17th, 2012 Word Count: 2993 Candidate numbers: 80034, 85888, 71184, 79649, 74817
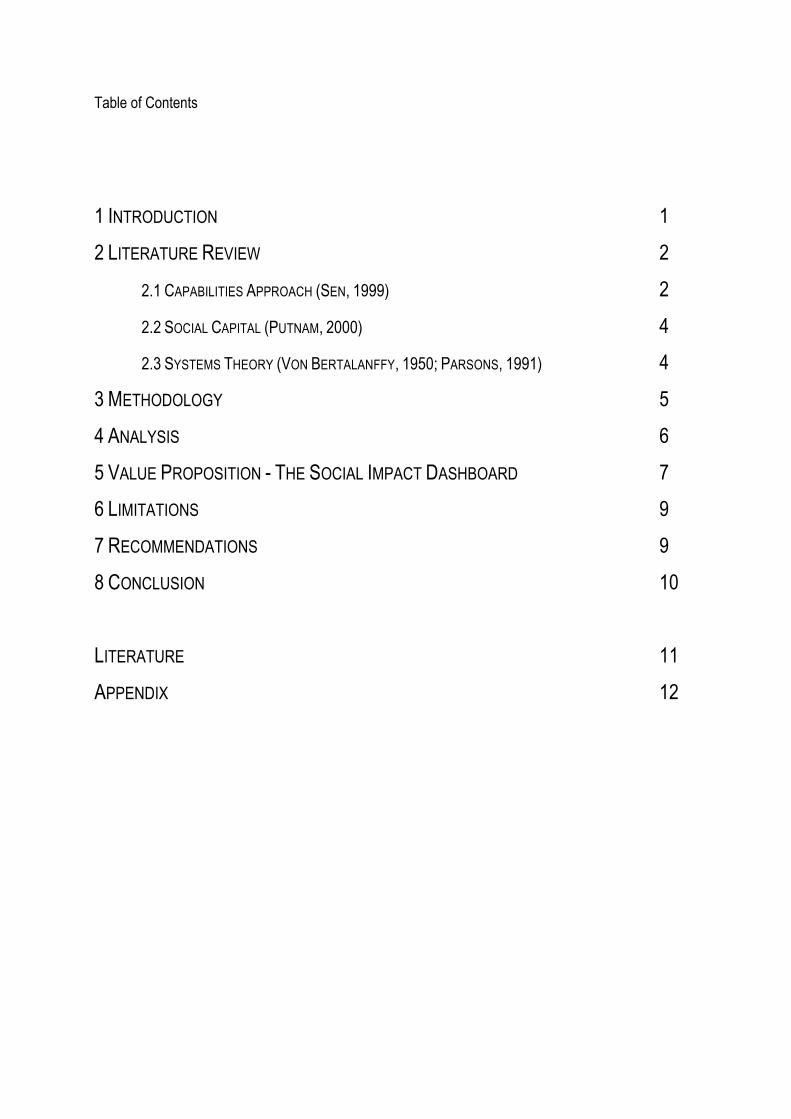
Table of Contents
1 INTRODUCTION 1
2 LITERATURE REVIEW 2
2.1 CAPABILITIES APPROACH (SEN, 1999) 2
2.2 SOCIAL CAPITAL (PUTNAM, 2000) 4
2.3 SYSTEMS THEORY (VON BERTALANFFY, 1950; PARSONS, 1991) 4
3 METHODOLOGY 5
4 ANALYSIS 6
5 VALUE PROPOSITION - THE SOCIAL IMPACT DASHBOARD 7
6 LIMITATIONS 9
7 RECOMMENDATIONS 9
8 CONCLUSION 10
LITERATURE 11
APPENDIX 12
Using big data to evaluate social impact in Rio's favelas
1
1 INTRODUCTION Brazil’s recent economic and political rise brings along fundamental potential to pursue a
structural change aiming at some of the country’s most pressing issues. Notably, for decades, Brazil
has suffered from an abnormally high income discrepancy that is manifest in the country’s rural poverty
situation as much as in its socio-economically deprived urban slums, commonly referred to as ‘favelas’
(Worldbank, 2012). With the country hosting the upcoming FIFA World Cup in 2014 and the Olympic
Games in 2016, the urban favela situation, particularly in Rio de Janeiro, has moved into the centre of
attention of local policy makers and the international press alike.
Thinking about ways to measure social impact in favela settings requires, in the first place, a
more in-depth understanding of what ‘social impact’ includes. Taken from the Comprehensive Guide for
Social Impact Assessment (2006), the Inter-organisational Committee on Guidelines and Principles for
Social Assessment (1994) (cited in Glasson, 2000) defined social impacts as ‘the consequences to
human populations of any public or private actions that alter the ways in which people live, work, play,
relate to one another, organize to meet their needs, and generally cope as members of society’. The
above definition reveals the need to specify a certain input in a certain setting, measured in a certain
way, in order to track down social impact along the impact value chain, encompassing inputs, outputs
as much as outcomes (Goldman Sachs Foundation, 2003).
For the purpose of this report, the unit of investigation is Rio’s Vidigal favela, located at the
city’s south end. It contains 10.372 inhabitants (UPP, 2012) and exemplifies some of the main concerns
of favela inhabitants, namely fear of violence and deprivation of social mobility (Kerstenetzky & Santos,
2009). Since early 2012, Vidigal has been ‘pacified’ by the local police unit UPP (Unidade de Polícia
Pacificadora). This process entails an armed entry, or invasion, within the favela setting to regain
territorial control from drug-lords and therewith enable the municipality to gather intelligence and foster
institutional development within favela settings. José Beltrame, state secretary of security, announced
plans to have pacified a total of 40 communities by 2014 (LAB, 2011).
This process though, is aggravated through the widely negative relationship between favela
inhabitants and the police, rising out of a history of warfare against drug-lords that caused high numbers
of civilians to be discriminated or dead. As a consequence, the presence of the UPP forces is widely
seen as critical or ambivalent (Jovchelovitch & Priego-Hernadez, 2012). The re-establishment of trust in
the police, as the prerequisite base for institutional development, is of high importance for the success
of future institutional presence and socio-economic inclusion. The very impact investigated in the project
at hand therefore focuses on the UPP follow-up unit ‘UPP Social’, which tries to reconcile the
inhabitants trust in the police by promoting dialogue and inclusion in strategic decisions around legal,
infrastructural, and social issues within the favela (UPP, 2012).

Using big data to evaluate social impact in Rio's favelas
2
In collaboration with IBM, the use of ‘big data’ shall help to measure the police-population
relation in a complex and dynamic setting such as the Vidigal favela. IBM, in the scope of its Smarter
Cities program, currently operates an Intelligence Operations Centre (IOC) in Rio de Janeiro. In that
line, the design of a big data based impact measurement tool can be integrated into an existent system
of intelligence gathering. Defining big data as the sum of all digitally sensible information, ranging from
pictures to short-messages, interestingly enough, a large, though not yet representative group of favela
inhabitants, indeed contributes to the police-population discourse in social networks, through
participatory mapping tools or such means as ‘smart-phone journalism’. The previous line of reasoning
leads to the MG437 IBM group’s research proposal on: A big data based approach to measure the
police-population relationship as a consequence of the UPP intervention in Vidigal, that shall be
justified, elaborated on, and set into a broader context in the following. The outcome of the project at
hand materializes as a dashboard, which potentially allows the City of Rio to track the development of
favelas and react to emergencies when necessary.
2 LITERATURE REVIEW Societal indicators, starting from a fairly broad definition, present inclusive concepts that track down an
impact chain of high importance to the public, (Kloby & Callahan, 2009). Therein, three core
approaches, central to the development of social key indicators, shall be identified as relevant and
useful to the design of a respective dashboard:
2.1 CAPABILITIES APPROACH
The decades lasting violence in the favelas has led to a deprivation of basic capabilities of the
residents. Such development can be identified in the concept put forth by Sen (1999) in his ‘Capabilities
Approach’, namely, that poverty can be viewed as deprivation of freedom centring around functioning
and capabilities. Figure 1 illustrates how core concepts of the approach align with the secondary data
from favelas. One of the core problems associated with favelas is ‘violence’, (Jovchelovitch & Priego-
Hernandez, 2012). In addition, respect and self-esteem among residents are low, as residence in a
favela is perceived negatively (Kerstenetzky & Santos, 2009). Figure 2 provides an overview over
residents' most dominant feelings regarding their lives in the favela (Jovchelovitch & Priego-Hernandez,
2012). The results highly relate to Sen's (1999) indication that the poor's quality of life as much as their
freedom of choice have become detrimental to the current dismal condition of the favela residents due
to violence and crime.

Using big data to evaluate social impact in Rio's favelas
3
Figure 1: Alignment of Sen's (1999) approach to the favela context
Figure 2: Favela residents' feelings regarding their living situation

Using big data to evaluate social impact in Rio's favelas
4
2.2 SOCIAL CAPITAL
Violence and fear have significantly eroded social capital within the favelas. According to
Perlman (2010), violence, which leads to fear and distrust, not only prevents people from using common
spaces, but, furthermore reduces community participation, networks and information exchange. This
relates to yet another important concept put forth by Putnam (2000) as he stresses that strong civil
society and social capital are closely linked to political and economic stability. Putman's (2000) study
also demonstrates that traditional social capital such as social networks and community participation is
eroded by violence. Table 1 demonstrates this loss in social capital through evidence from the report. A
perception of safety can encourage residents in a community to interact more freely and participate in
different activities through the development of social institutions (Australian Bureau of Statistics, 2002).
Table 1: Evidence of loss of social capital
2.3 SYSTEMS THEORY
Theory and empirical evidence suggest that public safety is a matter of concern – even more in
such complex systems like favelas. Thus, different elements under the umbrella term of ‘public safety’
cannot be looked at in isolation. According to systems theory society should be analysed as a system
of “elements in standing relationship” (Von Bertalanffy, 1950; Parsons, 1991). Hence a holistic approach
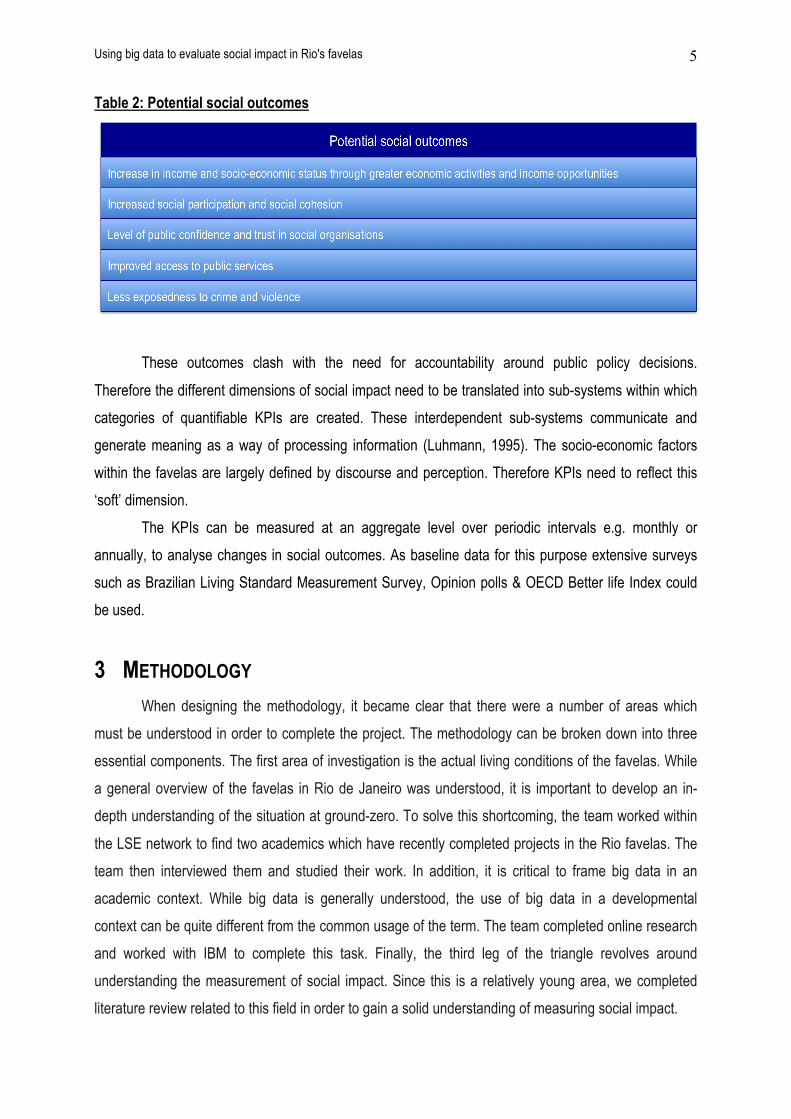
needs to be taken to measure social impact. Table 2 shows social outcomes that can be measured
around the system of public safety in favelas:
Using big data to evaluate social impact in Rio's favelas
5
Table 2: Potential social outcomes
These outcomes clash with the need for accountability around public policy decisions.
Therefore the different dimensions of social impact need to be translated into sub-systems within which
categories of quantifiable KPIs are created. These interdependent sub-systems communicate and
generate meaning as a way of processing information (Luhmann, 1995). The socio-economic factors
within the favelas are largely defined by discourse and perception. Therefore KPIs need to reflect this
‘soft’ dimension.
The KPIs can be measured at an aggregate level over periodic intervals e.g. monthly or
annually, to analyse changes in social outcomes. As baseline data for this purpose extensive surveys
such as Brazilian Living Standard Measurement Survey, Opinion polls & OECD Better life Index could
be used.
3 METHODOLOGY When designing the methodology, it became clear that there were a number of areas which
must be understood in order to complete the project. The methodology can be broken down into three
essential components. The first area of investigation is the actual living conditions of the favelas. While
a general overview of the favelas in Rio de Janeiro was understood, it is important to develop an in-
depth understanding of the situation at ground-zero. To solve this shortcoming, the team worked within
the LSE network to find two academics which have recently completed projects in the Rio favelas. The
team then interviewed them and studied their work. In addition, it is critical to frame big data in an
academic context. While big data is generally understood, the use of big data in a developmental
context can be quite different from the common usage of the term. The team completed online research
and worked with IBM to complete this task. Finally, the third leg of the triangle revolves around
understanding the measurement of social impact. Since this is a relatively young area, we completed
literature review related to this field in order to gain a solid understanding of measuring social impact.
Using big data to evaluate social impact in Rio's favelas
6
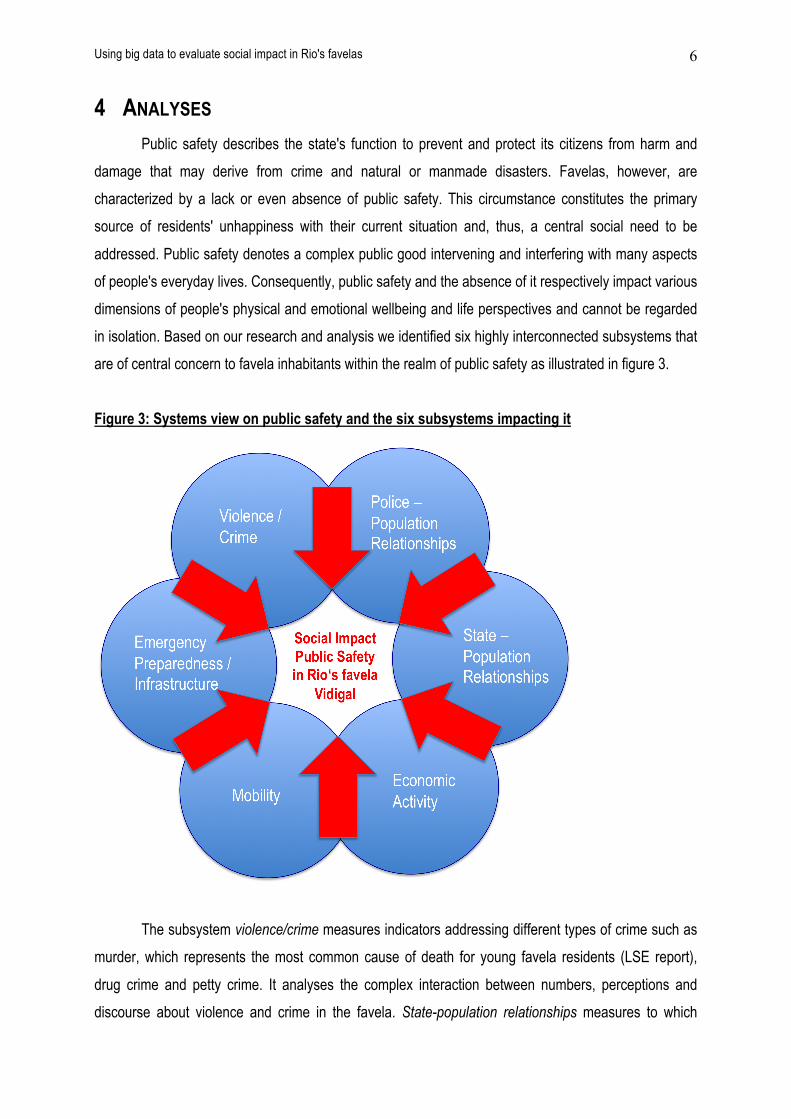
4 ANALYSES Public safety describes the state's function to prevent and protect its citizens from harm and
damage that may derive from crime and natural or manmade disasters. Favelas, however, are
characterized by a lack or even absence of public safety. This circumstance constitutes the primary
source of residents' unhappiness with their current situation and, thus, a central social need to be
addressed. Public safety denotes a complex public good intervening and interfering with many aspects
of people's everyday lives. Consequently, public safety and the absence of it respectively impact various
dimensions of people's physical and emotional wellbeing and life perspectives and cannot be regarded
in isolation. Based on our research and analysis we identified six highly interconnected subsystems that
are of central concern to favela inhabitants within the realm of public safety as illustrated in figure 3.
Figure 3: Systems view on public safety and the six subsystems impacting it
The subsystem violence/crime measures indicators addressing different types of crime such as
murder, which represents the most common cause of death for young favela residents (LSE report),
drug crime and petty crime. It analyses the complex interaction between numbers, perceptions and
discourse about violence and crime in the favela. State-population relationships measures to which

Using big data to evaluate social impact in Rio's favelas
7
extent institutions may or may not gain presence in the favela and tracks potential changes in how state
and favela interact. Economic activity analyses the strong mutual relationship between public safety and
economic activity. Since crime and violence hamper economic activity and thus directly impact favela
residents' income, increases or decreases in economic activity give valuable insights on the state of
public safety. The emergency preparedness/infrastructure subsystem aims at measuring the favela's
preparedness for emergencies such as heavy rainfall that often causes mudslides and severe threats to
the in the hill built favela. Mobility measures the social geography and movement patterns and reveals
potential zones of ambiguity and public safety black holes. Lastly, the police-population relationships
subsystem, which constitutes the focus of this project, merges hard and soft measures to shed some
light onto this complex and shattered relationship between the favela community and the police.
Measures of interest denote the level of trust between the two parties expressed through the
community's willingness to report crime to the police and a sediment analysis of the residents'
perception of the police and their actions.
In combination these subsystems contribute to measuring social impact and social outcomes
like the exposedness and perception of crime, the level of access to institutions and education, income,
and people's voice and relation to the government and its representatives.
5 VALUE PROPOSITION - THE SOCIAL IMPACT DASHBOARD Favelas are complex social systems and measuring social outcome is by nature not only a
multidimensional but also challenging endeavour. The social impact dashboard provides meaningful
analysis of the data that is collected in a systematic way within systems, subsystems, problem sets and
categorised KPIs. It creates a top-layer to the social impact database that tries to capture the realities of
favela inhabitants from different demographic and social backgrounds by tapping into diverse data
sources ranging from institutional and corporate data, social media and mobile data to infrastructural
and NGO data (see Appendix A for a comprehensive overview). The dashboard gives an over-
proportional weight to NGO data, as our research has indicated in the absence of classic state
institutions the social fabric of favelas is mostly made up of associations and grass-roots community
based initiatives. These organisations span the whole favela population and therefore constitute and
extremely valuable source of information.
Using statistical and econometric methods such as Randomized Control Trials RCT combined
with technological solutions including Geo-spatial Information Systems (GIS) the social impact
dashboard identifies lynchpin indicators that allow the user to visualise and to understand the dynamics
and interactions within the favela system. In IBM language it plays the role of a “master integrator”.
Using big data to evaluate social impact in Rio's favelas
8
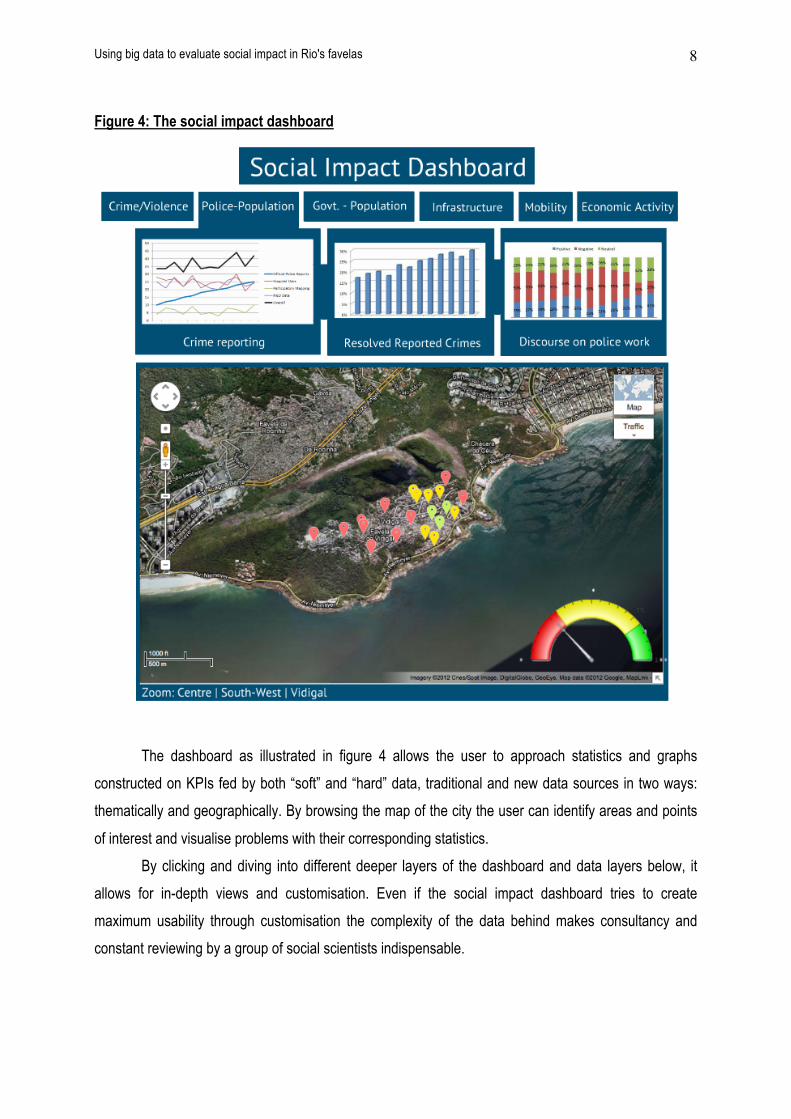
Figure 4: The social impact dashboard
The dashboard as illustrated in figure 4 allows the user to approach statistics and graphs
constructed on KPIs fed by both “soft” and “hard” data, traditional and new data sources in two ways:
thematically and geographically. By browsing the map of the city the user can identify areas and points
of interest and visualise problems with their corresponding statistics.
By clicking and diving into different deeper layers of the dashboard and data layers below, it
allows for in-depth views and customisation. Even if the social impact dashboard tries to create
maximum usability through customisation the complexity of the data behind makes consultancy and
constant reviewing by a group of social scientists indispensable.

Using big data to evaluate social impact in Rio's favelas
9
6 LIMITATIONS The favela context creates a number of challenges to the measurement of social impact, which
limit the applicability of our work. First, favelas lack organization and structure typically associated with a
developed community. This makes collaboration and consolidation difficult between the various parties.
It also creates challenges in evaluating the effectiveness of each of the various data sources. Another
issue constitutes the poor relationship between the government and the people. This lack of trust
between the population and government bodies such as law enforcement, legal system and safety
bureau makes government data unusually unreliable. Furthermore many factors that we wanted to
measure remain very difficult to capture. The use of proxies can go some way here but it must be
emphasised that they can only constitute an approximation to the targeted variable. More broadly, social
measurement tools such as IRIS are in their infancy and the use of big data in a developmental and
social impact context remains contentious today. Many of the measurements used to collect data are
made possible by tools and possessions (such as smartphones and credit cards) only found within
certain segments of the favela population (young professionals or the wealthy) and cannot represent the
entire population within favelas. Big data is likely to be skewed towards technology users or heavy users
of public services. NGOs on whom we would rely to fill the gaps with their data where big data misses
certain demographic groups still lack an incentive to be open and share their data. Therefore, it would
be presumptuous to state that the use of big data could deliver a comprehensive perspective at this
time.
7 RECOMMENDATIONS The user of the dashboard is in a unique and empowered position. With so much information
being delivered in real-time meaningful interpretation and responsible use are essential. The tool is
designed to support institutional intelligence and should not function as a wizard tool, disguising the
deeply political nature of public policy decisions. The dashboard does a great job of raising awareness
but it is designed to supplement public discourse, not to replace it. Once an issue has arisen through
the dashboard, it is imperative to assign additional resources towards a complete understanding of the
issue.
While the KPIs included in the dashboard have been researched extensively, the individual
interpretation of each KPI will vary and is by nature controversial. Consequently, experts should be
brought in from various fields to assist in the analysis of them. In addition, the validity of each KPI
should be measured and vetted over a longer period of time to ensure appropriateness and quality.
Furthermore, it is important to recognize that favelas are dynamic and fluctuating institutions. Since the

Using big data to evaluate social impact in Rio's favelas
10
environmental variables are in constant flux, it is critical to adjust KPIs over time as the stories they tell
will evolve over time. Finally, while the real-time data provided by the dashboard is attractive to policy-
makers, we need to remember that short-term and utilitarian thinking establishes incentives that neglect
individual rights and hinder sustainable social impact. The user must keep long-term goals in mind and
customise his dashboard according to this perspective.
8 CONCLUSION In using big data to measure social impact, we hope that the user of this tool can use this ability
to gain awareness to previously unmeasured activities and conditions. Then, upon this discovery, we
encourage further research and specialists to explore these new areas. Rather than boldly acting on
what big data has unravelled, we hope that more resources can be utilized to explore further. In
addition, we believe that this ability has only given the government awareness of the activities within a
development environment. Now that the state has increased understanding of its people, we hope that
these people can use this acknowledgement as a platform to stand-up and participate in democratic
government.
In our research, we have found that big data can be used to measure certain levels of social
impact. While there are limitations and uncertainty revolving around the use of big data in a
developmental context, there is no denying the potential which exists in this field. Bits and atoms are
merging and the most vulnerable parts of the world population should be given the possibility to
participate. If we used correctly, big data offers new opportunities for economic and political inclusion for
those that have previously been left behind. Therefore, it is critical that all parties involved must
collectively cooperate in order to maximize the potential benefits of using big data to measure social
impact.
Using big data to evaluate social impact in Rio's favelas
11
LITERATURE ALMEDIA, B., 2012. 6 New Social Media Trends in Brazil | Latin Link [WWW Document]. URL
http://latinlink.usmediaconsulting.com/2012/03/6-new-social-media-trends-in-brazil/ (accessed 11.28.12).
DALY, I., 2011. Data cycle: Behind MIT’s SENSEable Cities Lab (Wired UK) [WWW Document]. Wired UK. URL http://www.wired.co.uk/magazine/archive/2011/04/features/data-cycle (accessed 12.3.12).
GLASSON, J., 2009. Methods of Environmental Impact Assessment. Taylor & Francis
JOVCHELOVITCH, S., PRIEGO-HERNÁNDEZ, J., 2012. Mapping methods behind success stories in Rio’s favelas - 09 - 2012 - News archive - News - News and media - Home [WWW Document]. URL http://www2.lse.ac.uk/newsAndMedia/news/archives/2012/09/favelas.aspx (accessed 12.17.12).
KERSTENETZKY, C.L; SANTOS, L. 2009. Poverty as Deprivation of Freedom: The case of Vidigal
KING, G., 2011. Ensuring the data-rich future of the social sciences. science 331, 719–721. LLC, P., n.d. Aligning Government Performance and Community Outcome Measurement [WWW
Document]. Docstoc.com. URL http://www.docstoc.com/docs/45007585/Aligning-Government-Performance-and-Community-Outcome-Measurement (accessed 12.17.12).
LOHR, S., 2012. Big Data’s Impact in the World. The New York Times.
LUHMANN, N., 1995. Social Systems. Stanford University Press.
MICHAELS, J., n.d. Pacification saves lives: the first full-blown impact study [WWW Document]. RioReal. URL http://riorealblog.com/2012/07/29/pacification-saves-lives-the-first-full-blown-impact-study/ (accessed 11.28.12).
PARSONS, T., 1991. The Social System. Routledge.
PENGLASE, B., 2009. States of insecurity: Everyday emergencies, public secrets, and drug trafficker power in a Brazilian favela. PoLAR: Political and Legal Anthropology Review 32, 47–63.
PERKINS, R., 2009. Is the Internet Really New After All? The Determinants of Telecommunications Diffusion in Historical Perspective by Richard Perkins, Eric Neumayer :: SSRN [WWW Document]. URL http://papers.ssrn.com/sol3/papers.cfm?abstract_id=968668 (accessed 11.23.12).
PERLMAN, J., 2011. Favela: Four Decades of Living on the Edge in Rio de Janeiro, Reprint. ed. Oxford University Press, USA.
PITTALUGA, Fabio. "Brazil: Redefining 'resettlement' to Meet Urban Challenges." Brazil: Redefining 'resettlement' to Meet Urban Challenges. World Bank, 25 Apr. 2012. Web. 17 Dec. 2012.
POSNER, A., 2012. The Math of Social Change (SSIR) [WWW Document]. URL http://www.ssireview.org/blog/entry/the_math_of_social_change#When:19:00:00Z (accessed 11.25.12).
PUTNAM, R.D., 2000. Bowling Alone: The Collapse and Revival of American Community. Simon & Schuster.
RAMEY, C., n.d. From Favelas to Townships: Mobile Use in Low-Income Populations | MobileActive.org [WWW Document]. MobileActive.org. URL http://mobileactive.org/favelas-townships-mobile-use-low-income-populations (accessed 11.28.12).
SEN, A. 1999. Development as freedom. Oxford: Oxford University Press
SINGER, N., 2012. I.B.M. Takes “Smarter Cities” Concept to Rio de Janeiro. The New York Times.

Using big data to evaluate social impact in Rio's favelas
12
STAHLBERG, S.G., 2011. The Pacification of Favelas in Rio de Janeiro. Stanford University.
THORP, J., 2012. Big Data Is Not the New Oil [WWW Document]. Harvard Business Review. URL http://blogs.hbr.org/cs/2012/11/data_humans_and_the_new_oil.html (accessed 12.3.12).
TOMASINO, A.P., n.d. Public Safety Networks as a Type of Complex Adaptive System. Von Bertalanffy, L., 1950. An outline of general system theory. British Journal for the Philosophy of
Science 1, 134–165.
WEF, 2012. Big Data, Big Impact: New Possibilities for International Development [WWW Document]. Big Data, Big Impact: New Possibilities for International Development | World Economic Forum. URL http://www.weforum.org/reports/big-data-big-impact-new-possibilities-international-development (accessed 11.25.12).
WEST, M., 2012. The Math of Social Change (SSIR) [WWW Document]. URL http://www.ssireview.org/blog/entry/the_math_of_social_change#When:19:00:00Z (accessed 11.18.12).
VON BERTALANFFY, L., 1950. An outline of general system theory. British Journal for the Philosophy of Science 1, 134–165.
UUP. "UUP:Programa." UPP Social RSS. UUP, 2011. Web. 17 Dec. 2012.
APPENDIX
A: Data sources
The following provides a non-exhaustive and exemplary list of potential data sources taken into
consideration concerning the design of the Social Impact Dashboard and its KPIs
Institutional data World Bank | http://data.worldbank.org/country/brazil
UN-Habitat | http://www.unhabitat.org/list.asp?typeid=15&catid=140
UPP Social | http://www.uppsocial.org/
Corporate data Meat consumption
Coca Cola
Real Estate
Blogs, social media, crowdsourcing and mobile data Rio Real Blog | http://riorealblog.com/2012/07/29/pacification-saves-lives-the-first-full-blown-impact-
study/

Using big data to evaluate social impact in Rio's favelas
13
Rio on Watch | http://rioonwatch.org/?tag=upp-social
Rio Youth Mapping by MIT Mobile Experience Lab (Unicef) | http://rio.unicef-gis.org/
Wikimapa | http://wikimapa.org.br/
Viva Favela 2.0 | http://www.vivafavela.com.br/
Infrastructural data Electricity
Water
Transport | http://www.riobilheteunico.com.br/
Wi-Fi use
NGO data Catcomm.org | http://www.catcomm.org/en/?page_id=5265
Center for Digital Inclusion | http://cdiglobal.org/
Forum Brasileiro de Segurança Pública (Brasilian Forum of Public Safety) | www.forumseguranca.org.br
Mapa da Violencia (Violence maps) | mapadaviolencia.org.br