USING ANHYDRITE CRYSTALS AND WHOLE ROCK ANALYSIS...
94
USING ANHYDRITE CRYSTALS AND WHOLE ROCK ANALYSIS IN A MISSISSIPPIAN SALT DIAPIR AS A PROXY TO DETERMINE THE PRESERVATION EXTENT OF PRIMARY SEAWATER GEOCHEMICAL FEATURES THROUGH DEFORMATION PROCESSES Nathan Glas Submitted in Partial Fulfillment of the Requirements For the Degree of Bachelor of Sciences, Honours Department of Earth Sciences Dalhousie University, Halifax, Nova Scotia April 2016
Transcript of USING ANHYDRITE CRYSTALS AND WHOLE ROCK ANALYSIS...

USING ANHYDRITE CRYSTALS AND WHOLE ROCK ANALYSIS IN A MISSISSIPPIAN SALT DIAPIR AS A PROXY TO DETERMINE THE PRESERVATION EXTENT OF PRIMARY SEAWATER
GEOCHEMICAL FEATURES THROUGH DEFORMATION PROCESSES
Nathan Glas
Submitted in Partial Fulfillment of the Requirements For the Degree of Bachelor of Sciences, Honours
Department of Earth Sciences Dalhousie University, Halifax, Nova Scotia
April 2016

i
Abstract
Evaporites provide direct evidence of seawater geochemistry and seawater crystallization through preserved fluid inclusions. Fluid inclusion analysis can be used to analyze the paleoenvironment that existed during evaporite formation when considering undeformed salt deposits. However, diapirism makes interpretation more difficult, owing to recrystallization processes that occur during deformation. The Wallace No. 1 core was drilled into one such salt dome located in the Cumberland Basin in northern Nova Scotia. The drill hole penetrated through the eastern flank of a large anticline cored with evaporites; mainly halite, anhydrite, gypsum and lesser occurrences of sylvite and carnallite. This deposit is heavily deformed and preserved beds dip between 40°-60° making it difficult to determine seawater chemistry from conventional methods such as fluid inclusion studies. However, preserved mudstone beds do exist, along with clear and dark grey-banded halite layers. In addition, thin sections show primary ‘snow-on-the-roof’ textures, with halite crystals being capped by anhydrite, exhibiting cyclic repetition. These preserved bedforms and textures indicate that not all of the deposit was reworked during deformation. The ability to discern preserved seawater geochemical features in salt diapirs allows for paleoclimate and paleoenvironment reconstructions to be completed. In areas that may be lacking undeformed salt deposits or other easily interpretable rocks, this can be extremely useful. This is also important considering Carboniferous evaporite basins are rare and seawater compositions changed from calcite to aragonite seas during this time period, making the ability to study salt diapirs, especially of this age, important.
Through examination of the whole rock geochemistry, including trace element compositions and anhydrite crystal chemistry, conclusions were made about the environmental conditions during primary precipitation. From these, it can be deduced that the deposit formed in a restricted basin with a large volume of brine. The basin was on the order of ~100 meters deep, with evaporite precipitation outpacing subsidence, eventually leading to a shallow sabkha-like environment persisting until the basin was closed off due to glacial or tectonic changes, with deformation beginning shortly after. The brine had a relatively consistent chemistry and only minor variation occurred throughout the existence of the basin. The basin age cannot be pinpointed exactly due to deformation, but is of Viséan age (347-331 Ma). Keywords: Windsor Group, Cumberland Basin, Viséan age, evaporite basin, salt tectonics, salt dome preservation, snow-on-the-roof texture, paleoenvironment analysis

ii
Acknowledgements
Firstly, I would like to thank my supervisor, Richard Cox, for providing me with an interesting thesis topic to work on and assisting in my research throughout the year. I would also like to thank Mick O’Neill from the DNR Core Warehouse for retrieving and preparing the core. Furthermore, I must thank Gordon Brown from the Dalhousie Thin Section Laboratory for taking the time to produce my thin sections; Dan MacDonald at the Dalhousie University Robert M. MacKay Electron Microprobe Laboratory for teaching me how to use the electron microprobe and assisting in the manipulation and interpretation of my data; Ricardo Silva and Philip Sedore for teaching me how to use the XRF and assisting in the analysis; Darragh O’Connor for teaching me how to use CorelDRAW to create various logs and Lawrence Plug, the honours class coordinator, for his edits and expertise. Finally, Anne-Marie Ryan helped to coordinate meetings, answer questions and critique my work. The assistance of everyone above was invaluable and greatly appreciated.

iii
Table of Contents
Abstract ............................................................................................................................................ i
Acknowledgements ..........................................................................................................................ii
Table of Contents ............................................................................................................................ iii
Table of Figures ................................................................................................................................ v
Table of Tables ............................................................................................................................... vii
1.0 Introduction ............................................................................................................................. 1
1.1 Objective ............................................................................................................................... 1
1.2 Tests Employed ..................................................................................................................... 4
1.3 Previous Research ................................................................................................................. 5
1.3.1 Modern Fluid Inclusion Analysis .................................................................................... 7
1.3.2 Carboniferous Fluid Inclusion Analysis .......................................................................... 8
1.3.3 Tectonic and Stratigraphic Development .................................................................... 10
2.0 Background ............................................................................................................................. 13
2.1 Regional Setting - The Windsor Group of the Cumberland Basin ...................................... 13
2.1.1 Geologic and Paleo-climatic History ............................................................................ 13
2.1.2 Salt Tectonic Evolution ................................................................................................. 17
2.2 Paradox Formation, Utah and Colorado ............................................................................. 18
3.0 Methods .................................................................................................................................. 22
3.1 Core Description ................................................................................................................. 22
3.2 Core Sampling ..................................................................................................................... 23
3.3 Thin Sections/Double-Polished Wafers .............................................................................. 24
3.4 X-ray Fluorescence (XRF) Analysis ...................................................................................... 25
3.5 Electron Microprobe Analysis (EMPA) ................................................................................ 28
4.0 Sample Description ................................................................................................................. 30
4.1 Core Description ................................................................................................................. 30
4.2 Hand Sample Description .................................................................................................... 31
4.3 Petrographic Description .................................................................................................... 35
4.4 Electron Microprobe Analysis (EMPA) Description ............................................................ 38
5.0 Results and Discussion ............................................................................................................ 40
5.1 X-ray Fluorescence (XRF) Analysis ...................................................................................... 40

iv
5.2 XRF Data Relationships ....................................................................................................... 46
5.2.1 Element Relationships ................................................................................................. 46
5.2.2 Depth Relationships ..................................................................................................... 47
5.2.3 Halite Banding Differences .......................................................................................... 48
5.2.4 Element Ratios ............................................................................................................. 51
5.2.5 Bromine Concentration ............................................................................................... 53
5.2.6 Evaporite Precipitation Cycles ..................................................................................... 54
5.3 Electron Microprobe Analysis (EMPA) ................................................................................ 55
5.4 EMPA Data Relationships .................................................................................................... 55
5.4.1 Element Relationships ................................................................................................. 56
5.4.2 Depth Relationships ..................................................................................................... 56
5.4.3 Element Trends ............................................................................................................ 59
5.4.4 Anhydrite Precipitation Cycles ..................................................................................... 60
6.0 Conclusion ............................................................................................................................... 60
7.0 References .............................................................................................................................. 65
8.0 Appendices .............................................................................................................................. 67
Appendix A - Core Description .................................................................................................. 67
Appendix B - Sample Description .............................................................................................. 74
Appendix C - XRF Data .............................................................................................................. 85
Appendix D - Electron Microprobe Data ................................................................................... 86
Appendix E - Photo Library ....................................................................................................... 86

v
Table of Figures
Figure 1.1: Original Wallace-1 Stratigraphic Log…………………………………………………………………….……1
Figure 1.2: Wallace-1 Lithologic Log……………………………………………………………………………………………2
Figure 1.3: Wallace-1 Drillhole Sketch……………………………………………………………………………..…………3
Figure 1.4: Geologic Map of Cumberland Basin…………………………………………………………………………10
Figure 1.5: Geologic Map of Cumberland Basin with Cross-Sectional Time Slices……………..………12
Figure 2.1: Geologic Map of Maritimes Basin……………………………………………………………………………13
Figure 2.2: Mississippian Paleogeoraphic Map of North America……………………………………..………15
Figure 2.3: Pennsylvanian Paleogeographic Map of North America…………………………………..………16
Figure 2.4: Snow-on-the-Roof Texture, Paradox Formation, USA……………………………………..………21
Figure 2.5: Concentration vs. Depth Profile for Br from Paradox Formation, USA…………….………22
Figure 3.1: Core Sample Photograph under UV Light…………………………………………………………..……23
Figure 3.2: Core Sample Photograph under UV Light…………………………………………………………..……23
Figure 3.3: Double-Polished Wafers………………………………………………………………………………….………25
Figure 3.4: X-Ray Fluorescence Samples Powdered………………………………………………………..…..……25
Figure 3.5: XRF Samples in Vessels………………………………………………………………………………..….………25
Figure 3.6: XRF Gun and Desktop Setup………………………………………………………………………….……..…26
Figure 3.7: XRF Analysis Chamber………………………………………………………………………………..……..……27
Figure 3.8: Electron Microprobe Photographs………………………………………………………………….………28
Figure 4.1: Preserved Banding, Preserved Bedding, Brecciation in Core……………………………..……33
Figure 4.2: Hand Sample Photographs……………………………………………………………..………………………34
Figure 4.3: Primary and Secondary Anhydrite Textures in Thin Section…………..……………….………37
Figure 4.4: Fluid Inclusion orientation in Thin Section…………………………………………..………….…..…38
Figure 4.5: Electron Microprobe Back-Scattered Electron Images………………………..……………….…39
Figure 5.1: Lithologic log with superimposed Concentration vs. Depth profiles ……………………….41
Figure 5.2: Concentration vs. Depth Profiles for Al, Si and Fe………………………………..…………..….…43
Figure 5.3: Concentration vs. Depth Profiles for Ca, S and Sr………………………………..………….………44
Figure 5.4: Concentration vs. Depth Profiles for K, Mg, Br, Na, Cl and Ba……………..………….…...…45
Figure 5.5: Base Level Change Cycle Depiction…………………………………………..…………………….….…..48

vi
Figure 5.6: Base Level Change Cycle Depiction…………………………………………..……………………..….….49
Figure 5.7: Element Concentrations in Halite Bands………………………………..……………………………....50
Figure 5.8: Element Ratio Graphs for Sr/Ca, Mg/Ca and Br/Cl………………………………..…………....….52
Figure 5.9: Element Ratio vs. Depth Profiles for Sr/Ca, Mg/Ca and Br/Cl……………………………….….52
Figure 5.10: Concentration vs. Depth profiles for Ca, S, Sr, Ba, P2, Na2, Cl, Br, K2 and Mg……….….58

vii
Table of Tables
Table 5.1: XRF Data Table Summary………………………………..……………………………..………………………...42
Table 5.2: EMP Data Table Summary………………………………..……………………………..…………………….…57

1
1.0 Introduction
1.1 Objective
The Wallace Sub-basin contains Windsor Group deposits
composed of sandstones, siltstones, gypsum, anhydrite and a massive
salt dome of Mississippian subperiod that has been deformed into a
salt diapir (Boehner, 1986). The salt diapir is composed mainly of halite
(NaCl), with interstitial anhydrite (CaSO4), sylvite (KCl) and carnallite
(KMgCl3 ∙ 6H20) along with preserved mudstone beds (Figure 1.1 &
Figure 1.2) (Boehner, 1986). The Wallace-1 core was drilled through
the eastern flank of the above mentioned diapir (Figure 1.3). Despite
the deformation present, halite banding, alternating between clear and
dark halite, and preserved mudstone beds are seen, which may
indicate that complete recrystallization did not occur.
Figure 1.1: Stratigraphic log illustrating the lithologies of the Wallace-1 core (Boehner, 1986).

2
Figure 1.2: Lithologic log created to illustrate localities of preserved halite banding and preserved mudstone bedding within the Wallace-1 core.

3
My thesis analyzes samples collected from the above salt diapir, with the goal of
determining whether any primary seawater geochemical features have been preserved, or
whether deformation has completely recrystallized and reset the deposit. To ascertain this, I
completed analyses using core and hand sample descriptions, petrographic descriptions,
Electron Microprobe Analysis (EMPA) and X-ray Fluorescence (XRF) analysis.
All of these analyses will help constrain the oceanic environment at the time, as well as
the general climate and any major climatic changes that took place over the deposition of this
salt deposit. The depositional environment likely changed with time, moving from deep-water to
shallow-water to a sabkha-like environment. Deep water depositional environments are
comprised of gypsum and/or halite saturated bottom waters with the potential for bottom-
growth crystals forming within the sediment (Warren, 1989). The surface waters have a larger
degree of seawater chemistry fluctuation, allowing crystallization in surface waters, with these
crystals slowly settling out (Warren, 1989). These environments also experience turbidites and
mass flows which can rework sediments (Warren, 1989). Shallow water depositional
environments depend greatly on the stability of the water column, but can precipitate large,
bottom-growth crystals when conditions are stable (Warren, 1989). Precipitation in these basins
is usually rapid and leads to the development of sabkha-like conditions (Warren, 1989). Sabkha
Figure 1.3: Sketch depicting location of the Wallace No. 1 drill hole and formations penetrated during drilling (Boehner, 1986).

4
depositional environments are generally characterized as subaerial mud flats with ephemeral
shallow water cover and commonly exist on the flanks of other systems (Warren, 1989). Sabkha
deposits are commonly capped with an erosional surface (Warren, 1989).
From this, data comparisons will be made to studies completed on deposits of similar age
and locality (Holt et al., 2014 & Petrychenko et al., 2002), with the intent of verifying my
conclusions. The Paradox Formation of Utah and Colorado will also be used as a comparative
tool due to its similar nature (Raup & Hite, 1992; Williams-Stroud, 1994).
1.2 Tests Employed
My approach is to examine bulk rock analysis and mineralogical analysis, with a focus on
anhydrite crystals, to reconstruct the climate that existed during precipitation of this salt deposit.
I collected, described, cut and photographed samples under plain and UV light. From this,
samples were prepared and cut into double-polished wafers mounted on thin section slides.
I examined these thin sections under transmitted and reflected light microscopy to
describe mineralogy, textural features and locate fluid inclusions for further study. The same
sections were then used in the electron microprobe which provided mass percent data for my
anhydrite crystals, giving detailed information on the major and minor elements that were
incorporated into the chemical structure. This data was then used to make concentration against
depth graphs to illustrate how these major and minor elements were distributed throughout the
entirety of the deposit. X-ray fluorescence (XRF) analysis of hand samples aided in providing a
quantitative characterization of the element distribution between these halite bands. In addition
to this, samples were analyzed from the entirety of the sampled core to give an idea of the bulk
geochemical changes recorded with depth. This data is helpful as a comparative tool to my

5
microprobe data and also to compare with the bulk geochemical data produced by Boehner
(1986). Fluid inclusion analysis was originally intended to be completed but, after the
petrographic studies were completed it was determined to be redundant based on the obviously
altered nature of the fluid inclusions. The geochemical and trace element data was reviewed and
helped to provide information about the seawater conditions during this time period and how
changes in chemistry affected precipitation from seawater.
1.3 Previous Research
The rough precipitation sequence for evaporites is well known and starts with carbonates
when ~50% of original seawater remains, followed by gypsum and anhydrite when ~20% of
original water volume remains, then halite when ~10% of original water volume remains. Finally
potassic salts, such as sylvite and carnallite, form when ~5% of the original water volume
remains. Changes in temperature and density can alter the timing of evaporite precipitation, but
the outline above acts as a guideline for what can be expected to precipitate as evaporation
within a restricted basin continues. During sulfate mineral crystallization, gypsum generally
precipitates first, with anhydrite forming as a later dehydration product. Only under specific
circumstances, i.e. where water temperatures exceed ~40°C, or where the concentration of the
brine is such that halite precipitation is almost possible, can primary anhydrite precipitate
(Jaworska, 2012).
Numerous studies have been completed on the rocks from the Windsor Group, but none
have provided adequate data on the tectonic environment, textural features and geochemical
concentrations within minerals and the whole rock in the Wallace-1 core area.

6
Boehner (1986) as a part of the Nova Scotia Department of Mines and Energy, in
conjunction with the Canada Department of Regional Economic Expansion, studied the Wallace-
1 cores that were drilled and documented as a part of the report on Salt and Potash Resources in
Nova Scotia (1986). Boehner (1986) provided qualitative analysis of the core (Figure 1.1) and
collected geochemical data on broad sections of the core while looking for economic potash
deposits, which were not found. For this reason, the study did not elaborate on the findings, or
interpret the data. In addition, Boehner (1986) did not collect fine scale whole rock geochemical
data, carry out detailed mineral studies, examine element concentrations within minerals or
examine fluid inclusions.
A second study by Waldron et al. (2013) examined salt tectonics in the Cumberland Basin.
This study did not consider preserved bedforms, look at the mineralogy of these samples, or the
possible preservation of fluid inclusions despite the salt deformation that had occurred. In
addition, there was little information provided about my samples due to the fact that they were
collected from the edge of Waldron et al.’s (2013) study area.
Holt et al. (2014) examined fluid inclusions in halite beds of similar age to the Windsor
Group in the Shubenacadie Basin, finding primary fluid inclusions and making estimates of the
seawater geochemistry. Conversely, in my study, bulk rock and anhydrite crystal geochemistry
provided the source of the data. The study by Holt et al. (2014) also examined samples which
were diagenetically altered but not extensively deformed. This is in constrast to the deformed
samples in my study, which further necessitate a different analytical strategy.
Studies of the Paradox Formation, summarized by the U.S. Geological Survey Bulletin
2000-B (Raup & Hite, 1992), found similar features to my study area. Halite dominated

7
successions with anhydrite laminations similar to those seen in my study were described and
element concentrations showing trends that mimic those collected in my study were found
(Raup & Hite, 1992). Thus, the Paradox Formation will act as a comparative tool to determine the
level of preservation in my samples.
1.3.1 Modern Fluid Inclusion Analysis
The geochemical variations recorded by halite fluid inclusions are useful in determining
paleo-seawater compositions. Timofeeff et al. (2001) found that halite fluid inclusions in the
solar saltwork of Great Inagua Island (Bahamas) and in the supratidal sabkha of Baja California,
have major ion compositions similar to modern seawater. Halite fluid inclusions from a
nonmarine source in the Qaidam Basin (Western China) were found to have a distinctly
different major ion composition from that of modern seawater (Timofeeff et al, 2001). The
studies by Timofeeff et al. (2001) suggest that fluid inclusion analysis in modern halite samples
can provide information about recent variations in seawater chemistry. By extension, the
element concentrations within evaporites of Viséan age, which I use in this study, may provide
a window into the major ion composition of Viséan seawater.
Timofeeff et al. (2001) also noted several possible sources of error for inferring paleo-
seawater composition from fluid inclusions: i) fluid inclusions in halite may not be the direct
result of seawater evaporation, but instead may be a mixture of seawater and nonmarine water
that infiltrated the marine evaporite basin, incorporating evaporite salts and creating a
contaminated sample, which upon re-precipitation of salt, would provide inaccurate
information about the major ion composition of the seawater; and ii) as evaporation occurs,
seawater composition alters, becoming more concentrated in major ions with respect to
8
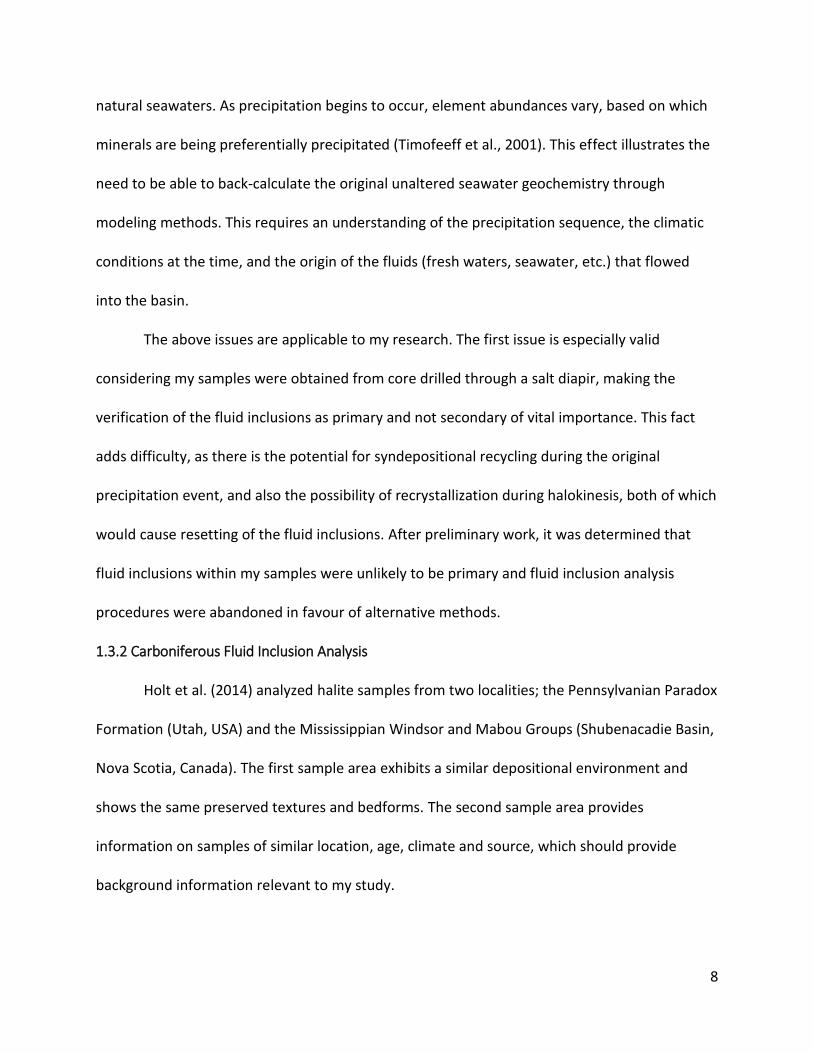
natural seawaters. As precipitation begins to occur, element abundances vary, based on which
minerals are being preferentially precipitated (Timofeeff et al., 2001). This effect illustrates the
need to be able to back-calculate the original unaltered seawater geochemistry through
modeling methods. This requires an understanding of the precipitation sequence, the climatic
conditions at the time, and the origin of the fluids (fresh waters, seawater, etc.) that flowed
into the basin.
The above issues are applicable to my research. The first issue is especially valid
considering my samples were obtained from core drilled through a salt diapir, making the
verification of the fluid inclusions as primary and not secondary of vital importance. This fact
adds difficulty, as there is the potential for syndepositional recycling during the original
precipitation event, and also the possibility of recrystallization during halokinesis, both of which
would cause resetting of the fluid inclusions. After preliminary work, it was determined that
fluid inclusions within my samples were unlikely to be primary and fluid inclusion analysis
procedures were abandoned in favour of alternative methods.
1.3.2 Carboniferous Fluid Inclusion Analysis
Holt et al. (2014) analyzed halite samples from two localities; the Pennsylvanian Paradox
Formation (Utah, USA) and the Mississippian Windsor and Mabou Groups (Shubenacadie Basin,
Nova Scotia, Canada). The first sample area exhibits a similar depositional environment and
shows the same preserved textures and bedforms. The second sample area provides
information on samples of similar location, age, climate and source, which should provide
background information relevant to my study.

9
Holt et al. (2014) found that calcite seas persisted throughout much of the Mississippian
subperiod, transitioning to aragonite seas in the late Mississippian, with sulfur isotope values
and bromide values consistent with a marine source. Major ion compositions vary considerably
from modern seawater evaporation curves, likely due to the different seawater chemistry
during the Carboniferous.
This difference in seawater chemistry is largely due to whether a calcite or aragonite sea
is present. In the Mississippian, calcite seas existed, indicating that there was greater
concentrations of Ca2+ in comparison to SO42- (Holt et al., 2014). Today, aragonite seas persist,
which indicates that the opposite is true. This distinction determines whether Ca2+ or SO42- will
be depleted first, which will control which minerals precipitate, including the mineral sequence
and the amount of precipitation that occurs (Holt et al., 2014). For example, in calcite seas,
SO42- will be depleted before Ca2+, making precipitation of sulfate minerals less favourable.
Petrychenko et al. (2002), studied deposits from the westernmost portion of the
Maritimes Basin and found similar features. The deposit was predominantly composed of
halite, with anhydrite laminations and potash-rich zones. Petrychenko et al. (2002) determined
that the brine depth varied from 10-140 m and had basal halite precipitated from non-marine
waters, low in Br, which transitioned to deposits formed from chloride-rich, sulfate-poor marine
waters, which persisted throughout the Mississippian. Pertychenko et al. (2002) determined
that the basin would have had relatively stable temperatures and seawater chemistry with slow
crystallization. Fluctuations in temperature would have occurred seasonally, reaching heights of
up to 60°C during summers, allowing for potash deposition (Petrychenko et al., 2002). Also
present within the samples were areas of interbedded clear halite, dark halite, claystone and

10
anhydrite (Petrychenko et al., 2002). This study helps to provide a characterization of the
depositional environment of the thick halide sequences which exist within the Maritimes Basin.
This will provide a comparison for my samples, which are located in the southwestern portion
of the same basin.
1.3.3 Tectonic and Stratigraphic Development
The Maritimes Basin formed at tropical latitudes during a dextral strike slip dominated
tectonic environment (Waldron et al., 2013). Sub-basins are present within the Maritimes
Basin, including the Cumberland basin. Waldron et al. (2013) used 16 high-resolution seismic
lines, detailed outcrop descriptions and bedrock geology maps to characterize the tectonic and
stratigraphic development of the basin in relation to salt tectonics (Figure 1.4).
The Cumberland basin shows thick Viséan aged evaporite deposits of the Windsor
Group, along with overlying clastic and coal-bearing deposits (Waldron et al., 2013). Through
the process of salt expulsion, large amounts of accommodation space were created (Figure 1.5),
Figure 1.4: Map illustrating the Cumberland Basin, the general geology of the area, the seismic lines used in Waldron et al.'s (2013) study, along with the smaller scale synclines within the larger Cumberland Basin (Waldron et al., 2013).

11
allowing for the deposition of clastic deposits and the exceptional preservation seen at Joggins
Fossil Cliffs: UNESCO World Natural Heritage Site. Waldron et al. (2013) found that this
expulsion varied both in intensity and timing across the whole basin, with the western portion
of the basin experiencing abundant salt expulsion during the Pennsylvanian age, while the
eastern part of the basin experienced less intense salt expulsion during the earlier Mississippian
subperiod (Figure 1.5).
The tectonic environment in the area facilitated vertical salt expulsion instead of
horizontal expulsion, which is more common along passive continental margins (Waldron et al.,
2013). Waldron et al. (2013) also found that the salt expulsion lead to the creation of broad
open synclines separated by smaller and narrower isoclinal anticlines with salt diapirs at their
cores (Figure 1.5).
Due to the varying forms of salt expulsion, both in time and intensity, a variety of
similar, but distinct sub-basins were formed with their own specific processes and history
recorded (Figure 1.5). Both symmetrical and wedge-shaped mini basins can be found (Waldron
et al., 2013). The Wallace Sub-basin, the focus of my study, is within the eastern portion of the
Wallace Syncline, which is in the eastern portion of the Cumberland Basin, indicating my
samples would have undergone Mississippian expulsion and are likely from an isoclinal anticline
with a core of salt. This suggests that these salt domes have experienced less intense
halokinesis than similar salt deposits in the western portion of the basin. In turn, this indicates
potential for the preservation of mineralogy, possibly including fluid inclusions and/or chemical
concentration profiles within my samples.

12
Figure 1.5: (A) Simplified map showing location of synclines within the Cumberland Basin. Map annotated with a star to indicate where the Wallace-1 core was drilled, in the eastern part of the Wallace Syncline. (B) Cross sections depicting inferred history of mini-basin development, locations shown in (A) (after Waldron et al., 2013).

13
2.0 Background
2.1 Regional Setting - The Windsor Group of the Cumberland Basin
2.1.1 Geologic and Paleo-climatic History
The rocks that I am studying are from the Wallace Sub-basin. The Wallace Sub-basin is
within the Wallace Syncline, a part of the larger Cumberland Basin, which resides within the
greater Maritimes Basin (Figure 1.5 & Figure 2.1) (Waldron et al, 2013). The Windsor Group,
within the Wallace Sub-basin, contains sandstones, siltstones, gypsum, anhydrite and a salt
dome (Figure 1.1) (Boehner, 1986). My study focuses on the salt dome (Figure 1.2), which is
mainly halite, with interstitial anhydrite, sylvite, carnallite and preserved mudstone beds.
This salt deposit precipitated during the Viséan age, within the Mississippian subperiod
of the Carboniferous period (Calder, 1998). During this period, Nova Scotia lay near the equator
and had a semi-arid to arid climate (Figure 2.2) (Calder, 1998). Windsor Group deposits overlay
the older Horton Group, with potential for a hiatus recorded during the Early- to Mid-Viséan
Figure 2.1: Map illustrating the extent of the Maritimes Basin, with the Cumberland Basin boxed in the bottom left (Waldron et al., 2013).

14
(Calder, 1998). This hiatus is not certain due to a lack of dateable material, but is assumed as
nowhere has a continuous record been documented (Calder, 1998).
During the Mid-Viséan, the Windsor Sea infiltrated into the Maritimes rift valley and
transgressed inland towards the New Brunswick Platform (Figure 2.2) (Calder, 1998). The
Windsor Sea was a hypersaline tropical gulf that was restricted within the Maritimes rift valley
(Schenk et al., 1994). The breach of the Maritimes rift valley by the Windsor Sea could have
been due to the convergence of Gondwana and the Old Red Continent, or through regional
distension across the Maritimes-Western-European province (Calder, 1998).
Evaporite deposits of several hundred meters predate rapid and repeated transgressive
and regressive cycles (Boehner, 1986; Schenk et al., 1994). The transgressive cycles are more
rapid and dramatic, in contrast to the lesser regressive cycles (Schenk et al., 1994). These
sequences are characteristic of the upper Windsor Group and illustrate the withdrawal of the
Windsor Sea from the Maritimes Rift Valley during the Late Viséan and potentially into the Early
Namurian (Waldron et al., 2013; Calder, 1998). These sequences are commonly capped by
halite deposits indicating maximum regression (Waldron et al., 2013). The total thickness of
Windsor strata range from 800-900 m, but have been modified in areas of diapirism (Boehner,
1986).
The withdrawal of the Windsor Sea is thought to have been caused by a major phase of
glaciation on Gondwana, during a marked drop in sea level, or by convergence of Euramerica,
which caused thrusting, transpression and inversion during the Mid-Carboniferous (Figure 2.3)
(Calder, 1998). A semi-arid to arid climate remained after the withdrawal of the Windsor Sea
and into the Late Viséan (Calder, 1998).

15
Figure 2.2: Reconstructed map of North America showing the continental and oceanographic makeup during the Early Mississippian when the Cumberland Basin and its associated sub-basins formed and started to precipitate evaporites. Nova Scotia, illustrated by a black box on the map, was roughly 2,000 km south of the equator at this time. The map also illustrates the large Windsor Sea that infiltrated the Maritimes Rift Valley during this time (after Blakey, 2013).

16
Figure 2.3: Reconstructed map of North America showing the convergence of the Meguma and Avalon Terranes during the Mid-Pennsylvanian, which likely played a role both in the withdrawl of the Windsor Sea and also in the deformation of the Windsor Group evaporites. At this point, Nova Scotia, illustrated by a black box on the map, was located at the equator (after Blakey, 2013).

17
2.1.2 Salt Tectonic Evolution
Tectonic activity, in the form of halokinesis, which includes the mobilization and flow of
subsurface salt, and the subsequent emplacement, caused mass deformation of a large portion
of the Windsor Group, along with some of the Permo-Carboniferous basin-fill locally (Calder,
1998). The large kilometer-scale diapirs and salt anticlines that formed adjacent to basement
fault blocks were caused by halokinesis (Calder, 1998) that may have begun as early as the Late
Viséan or Early Namurian, during and after the deposition of the Mabou Group, through
extensional detachment faulting of the Windsor Group on a basin-wide scale (Waldron et al.,
2013; Lynch & Giles, 1995).
Namurian deformation and overthrusting has been interpreted as a consequence of the
convergence of the Meguma and Avalon Terranes along the Cobequid Fault (Figure 2.3)
(Waldron et al., 1989; Pe-Piper et al., 1991). The deformation of the Windsor Group and much
of the Maritimes basin-fill marks a change in the structural evolution of the basin, going from
extensional to transtensional and transpressive (Calder, 1998). This deformation has been
linked to the Variscan and Alleghanian orogenies (Calder, 1998), with accommodation of
Alleghanian thrusting in the central and southern Appalachians being created through dextral
transpression (Quinlan & Beaumont, 1984). The timing of this deformation matches with that of
the Mississippian-Pennsylvanian boundary, which is indicated by a widespread unconformity
seen throughout the Appalachian Basin and globally.
Deformation was interrupted by a hiatus in the Mid- to Late-Namurian, followed by a
change from lacustrine to fluvial depositional environment (Calder, 1998). The process of the
Windsor Group evaporites migrating into diapirs and salt anticlines created massive

18
accommodation space through subsidence, as well as faulting (Calder, 1998). This
accommodation space was then rapidly filled during the Westphalian stage (Calder, 1998). The
effects of evaporite migration are illustrated by the characteristically dipping strata present at
Joggins Fossils Cliffs: UNESCO World Natural Heritage Site (Calder, 1998).
2.2 Paradox Formation, Utah and Colorado
The Paradox Formation of the Hermosa Group of Pennsylvanian age in the Paradox
Basin of Southeastern Utah and southwestern Colorado shows many similarities to the salt
diapir of the Wallace Syncline. The Paradox Formation is composed of precipitates formed from
concentrated marine brines, with little alteration afterwards (Raup & Hite, 1992). The lithology
of the formation contains organic-carbon-rich carbonate shale, dolomite, anhydrite and halite,
with occurences of potash (Raup & Hite, 1992). Two cores were analyzed to provide an in depth
and complete study of the formation, including the lithological and the evaporite cycles that
existed in this basin (Raup & Hite, 1992). The Paradox Formation contains 29 well-defined
cycles composed of halite beds (Raup & Hite, 1992).
The Paradox Basin is both a structural and depositional basin, trending northwest-
southeast (Raup & Hite, 1992). The basin itself is asymmetrical and covers an area of ~28,500
km2 at present (Raup & Hite, 1992). The original thickness of the Paradox Formation was ~1500-
1800 meters at greatest depth, but has been thickened locally to ~4250 meters due in part to
deformation of salt bodies into diapirs (Raup & Hite, 1992). In the northeastern portion of the
Paradox Basin rocks are folded, with evaporites in the cores of many of the anticlines (Raup &
Hite, 1992). In anticlines further from the deformation depocenter there are halite facies that
still conformably overly the underlaying sedimentary rocks (Raup & Hite, 1992). These rocks

19
were cored and were used for the purpose of this study to provide the least altered
representation of the original environment (Raup & Hite, 1992).
The Paradox Basin subsided prior to evaporite deposition, but was quickly filled with
evaporites due to the rapid precipitation of halite and other evaporites (Raup & Hite, 1992).
Subsidence continued during evaporite precipitation, but was overtaken due to the speed at
which precipitation occurred (Raup & Hite, 1992). The thickness of halite beds, on the order of
several hundreds of feet (~100 meters), indicate that the basin must have been deep enough to
allow for this much deposition before evaporite precipitation started (Raup & Hite, 1992). Given
the overall thickness of the halite succession and typical subsidence rates, the first evaporites
to precipitate must have done so in deeper water, which progressively shallowed as rapid
evaporite deposition continued (Raup & Hite, 1992).
The cycles are dominated by halite with interbeds of anhydrite, dolomite and siliciclastic
rocks, mainly organic-carbon-rich carbonate shale (Raup & Hite, 1992). The typical interbed
cycle shows halite gradually transitioning into anhydrite, then silty dolomite, followed by black
shale under a transgressive phase where the water level was rising, before regressing to
dolomite, anhydrite and then returning to halite precipitation again (Raup & Hite, 1992). The
changes in water level that caused these transgressive and regressive cycles is theorized to be a
result of Gondwanaland glaciation causing changes in sea level on a global scale (Raup & Hite,
1992).
In addition to these interbeds, abundant anhydrite laminations exist within the halite
beds (Raup & Hite, 1992). The halite beds are clear to cloudy and also smoky grey to light tan.
The cloudy colouration is a result of brine inclusions and small anhydrite crystals (Raup & Hite,
20
1992). The darker tan to gray colouration can be attributed partially to organic inclusions and
small fluid hydrocarbon inclusions (Raup & Hite, 1992). The halite crystals range in size from 2-5
mm on average and create layers 2-15 cm thick, with anhydrite laminations (~0.5-2 mm)
between them (Raup & Hite, 1992). These anhydrite-halite occurrences often exist as
alterations between clear to translucent halite and dark grey to black halite (Raup & Hite,
1992). The colouration difference is due to dispersed anhydrite crystals which diffuse the light
(Raup & Hite, 1992).
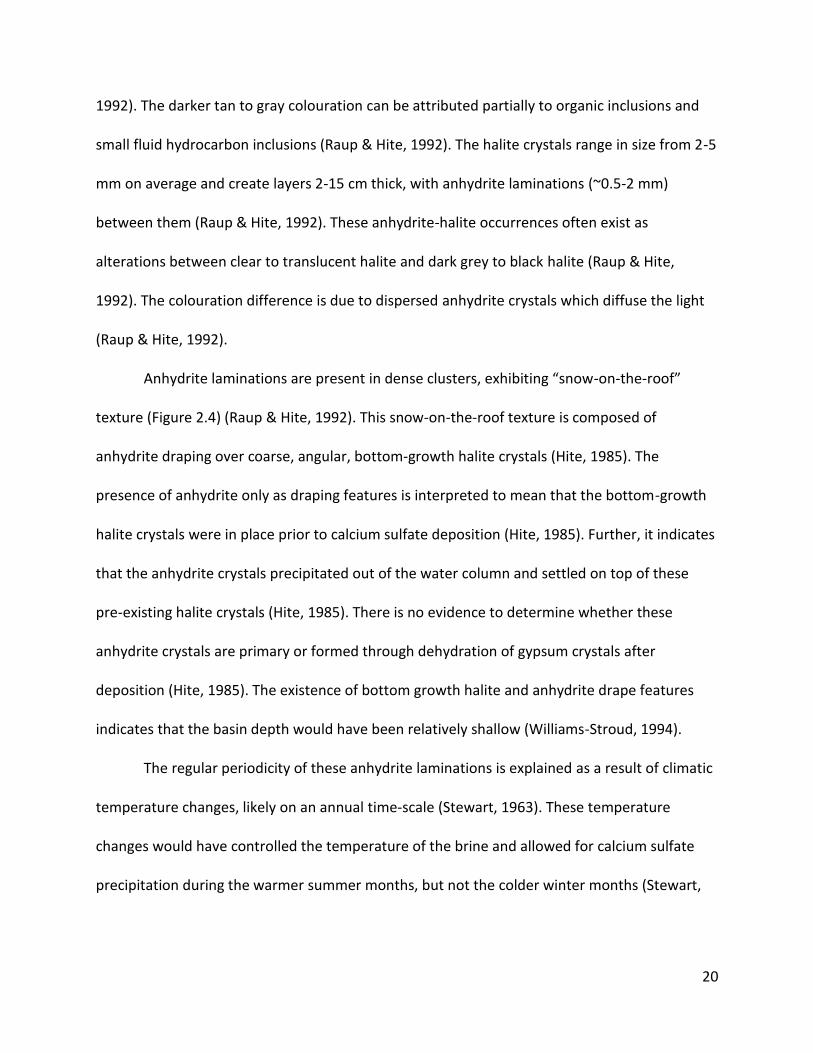
Anhydrite laminations are present in dense clusters, exhibiting “snow-on-the-roof”
texture (Figure 2.4) (Raup & Hite, 1992). This snow-on-the-roof texture is composed of
anhydrite draping over coarse, angular, bottom-growth halite crystals (Hite, 1985). The
presence of anhydrite only as draping features is interpreted to mean that the bottom-growth
halite crystals were in place prior to calcium sulfate deposition (Hite, 1985). Further, it indicates
that the anhydrite crystals precipitated out of the water column and settled on top of these
pre-existing halite crystals (Hite, 1985). There is no evidence to determine whether these
anhydrite crystals are primary or formed through dehydration of gypsum crystals after
deposition (Hite, 1985). The existence of bottom growth halite and anhydrite drape features
indicates that the basin depth would have been relatively shallow (Williams-Stroud, 1994).
The regular periodicity of these anhydrite laminations is explained as a result of climatic
temperature changes, likely on an annual time-scale (Stewart, 1963). These temperature
changes would have controlled the temperature of the brine and allowed for calcium sulfate
precipitation during the warmer summer months, but not the colder winter months (Stewart,

21
1963). Another possibility is that seasonal storms could have
caused an influx of marine or meteoric waters, rich in calcium
bicarbonate that allowed for the precipitation and subsequent
settling of calcium sulfate (Stewart, 1963). Both of these
theories could lead to annual anhydrite laminations within a
larger halite body (Stewart, 1963).
Raup and Hite (1992) found that the bromine
concentration generally increased from the bottom to the top
of the deposit (Figure 2.5). Bromine accumulates in brines and
due to a small, but constant quantity of this bromine
concentration being incorporated in halite through chlorine
substitution, the bromine concentration within halite can be
used as an indicator for the level of brine concentration, or
salinity (Raup & Hite, 1992). Thus, the general increase in bromine concentration within halite
indicates an increasingly concentrated brine, which was interrupted on four occasions by a
significant influx of seawater, which diluted the brine and reduced salinity (Raup & Hite, 1992).
The gradual, rather than rapid, increase in bromine concentration indicates that the basin must
have been relatively large, and was able to accommodate a large volume of brine (Raup & Hite,
1992). However, based on morphological features such as bottom growth halite and anhydrite
caps, the basin depth would not have been deep during their deposition (Williams-Stroud,
1994). The gradual and steady increase of bromine concentration also suggests constant halite
precipitation throughout the life of the basin (Raup & Hite, 1992).
Figure 2.4: Core photograph illustrating snow-on-the-roof texture, where coarse, angular, bottom-growth halite crystals are covered by a thin layer of anhydrite crystals that precipitated out of the water column (Raup & Hite, 1992).
anhydrite
halite

22
Sylvite is found in 19 of the 29 known evaporite
cycles (Williams-Stroud, 1994). The potash mineralization
mainly occurred at the top of halite sequences, in
association with increased salinity and extreme brine
concentration during the final stages of a particular
evaporite cycle (Raup & Hite, 1992). This to low stand water
levels within the basin (Raup & Hite, 1992).
Within the Paradox Basin the lack of mudcracks,
ripple marks and other dessication features makes the
extent of shallow-water or subaerial conditions within the
basin margins unknown (Raup & Hite, 1992; Williams-
Stroud, 1994).
3.0 Methods
3.1 Core Description
The Nova Scotia Department of Natural Resources (DNR) has a core warehouse located in
Stellarton, NS. During the last week of August, I described the Wallace-1 cores stored within the
facility in a lab on site. The description process was completed over 4 days and involved
examining ~340 meters of core, from ~850-1190 meter depth. The core was arranged in order
from shallowest to deepest depth, with 1.5 meter intervals stored in each core box. Each core
box contained two rows with 0.75 meters of core in each row. The core was examined and
lithology, grain shape and size, colour, fractures, alteration features and stratification were
Figure 2.5: Depth profile showing the gradual increase in bromine concentration as you move from the bottom to the top of the deposit (Raup & Hite, 1992).
23
described (see Appendix A). From this, a general stratigraphic log was created to summarize my
findings (Figure 1.2). Also present at the DNR core facility was the original documented
description of the core completed during drilling in 1966, as well as the original description by
Boehner (1986), along with a sample stratigraphic log (Figure 1.1) and geochemical data, which
were used to supplement my findings.
3.2 Core Sampling
After the core had been described, my supervisor, Richard Cox, and I went through the
core and marked sections of interest. These sections often related to areas that showed
preserved bedding or banding, likely indicating that deformation in this region of the diapir had
caused less destruction of the original structure, thus indicating the retention of the original
geochemical signature. Several samples were also taken from brecciated and clearly
recrystallized sections in hopes of using these samples as a comparison tool when identifying the
primary nature of the anhydrite grains. In total, 42 samples were collected along the length of
the core. These samples were tagged and photographed before being brought back to Dalhousie
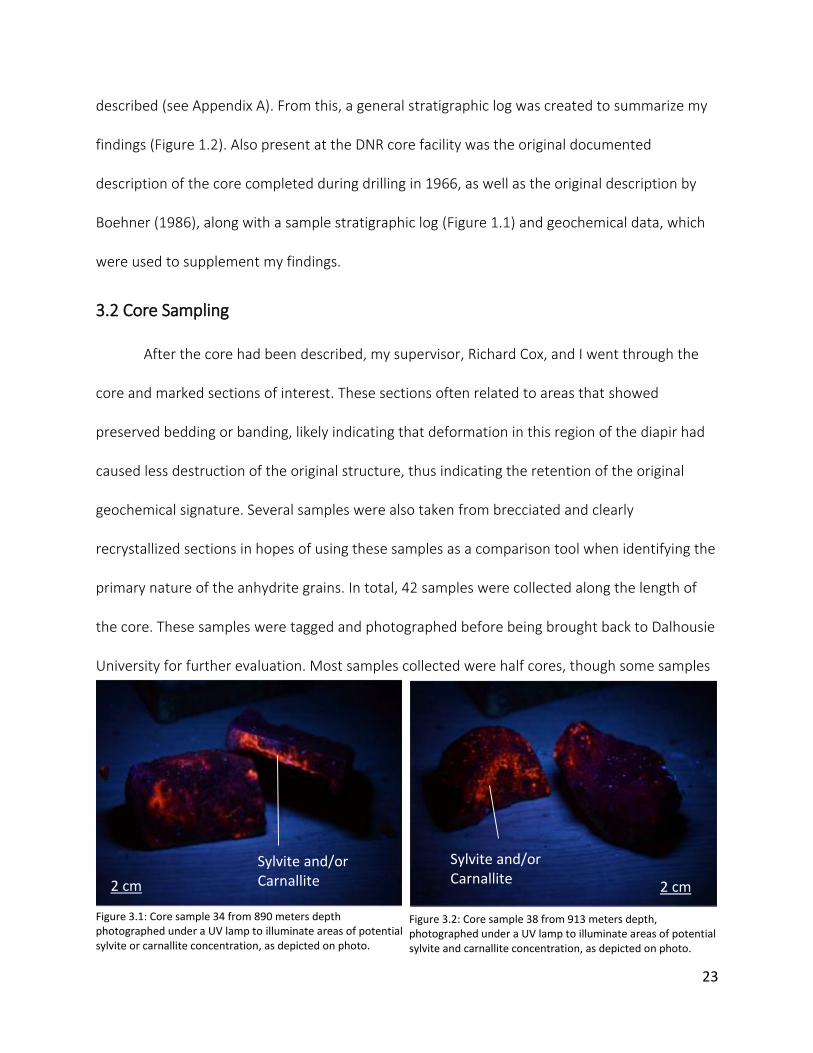
University for further evaluation. Most samples collected were half cores, though some samples
Figure 3.1: Core sample 34 from 890 meters depth photographed under a UV lamp to illuminate areas of potential sylvite or carnallite concentration, as depicted on photo.
Figure 3.2: Core sample 38 from 913 meters depth, photographed under a UV lamp to illuminate areas of potential sylvite and carnallite concentration, as depicted on photo.
Sylvite and/or Carnallite
2 cm
Sylvite and/or Carnallite 2 cm

24
taken were quarter cores. These samples were then cut using a wood saw, without water
lubrication, to provide a fresh surface that could be studied in greater detail.
These fresh surfaces were subsequently described, using the same descriptors as in the
overall core description (see Appendix B). The fresh faces were also photographed under plain
and UV light (Figure 3.1 & Figure 3.2). The plain light photos better illustrated any preserved
bedding or banding features, as well as providing high quality images of the samples for later
referral. The UV light photos helped to show areas where concentrations of specific minerals
were located. Areas of concentrated sylvite and carnallite gave off a red fluorescence under UV
light, areas of carbonate gave off a pale green fluorescence and areas with interstitial anhydrite
or fluid inclusion clusters fluoresced bright blue.
3.3 Thin Sections/Double-Polished Wafers
From the above samples, I chose 20 to be made into double-polished wafers, which were
200 microns thick and mounted on thin section slides using an acetone-based glue (Figure 3.3).
Double-polished wafers were chosen as they could be described using transmitted and reflected
light microscopy, analyzed in the electron microprobe and also used for fluid inclusion analysis.
The thin sections were made by Gordon Brown in the Thin Sections Laboratory at Dalhousie
University. The thin sections were comprised of mainly clean samples that were thought to be
largely unaltered, with 3 sections being made from brecciated material to act as proxies for
altered samples.

25
3.4 X-ray Fluorescence (XRF) Analysis
Due to the coarse crystalline nature of the Wallace-1 halite, all areas needed for
sampling had to be broken off and ground into a fine powder using a pestle and mortar (Figure
3.4). This helped to reduce error related to x-rays being scattered or diffracted off of the sample
surface.
Figure 3.3: Thin section scans illustrating (from left to right) dark halite, clear halite and sylvite dominated samples. Photos annotated to show EMPA analysis points to illustrate anhydrite locations and sampling density.
1.3 cm
Figure 3.4: Photograph of powdered samples showing (from left to right) clear halite, sylvite rich and dark halite samples before being contained in vessels.
Figure 3.5: Suite of samples in examination vessels after being crushed to a powder, showing different coloured powders based on their variable compositions.

26
Before crushing, the pestle, mortar and scoopula were washed with alcohol and dried
using kim wipes. Samples were brushed and cleaned to remove dirt or residue. Afterwards,
pieces were broken off of the samples using a rock hammer or chisel and placed in the clean
mortar and ground into a fine uniform powder with the pestle. The scoopula was then used to
transfer the powder into small 2x3 inch plastic bags to ensure no sample contamination (Figure
3.4). The area and utensils were then cleaned and the next sample was ground.
After all samples had been ground, they were transferred into sample containers (Figure
3.5). These sample containers were made up of a sample tube, with polypropylene plastic film
on either end that was clamped down by plastic rings. Polypropylene plastic film was placed on
one end of the sample tube, and then secured by placing a ring over top and pressing it
downwards. The powdered sample was then transferred into the sample tube, before placing
and securing the top plastic film and ring over top, sealing the sample and protecting it from
any contamination. The sample containers were all labeled and analyzed using a handheld XRF
that had been converted for desktop use (Figure 3.6).
A B
Figure 3.6: (A) XRF gun in desktop configuration with lead lined sample containment chamber. (B) Close up view of the handheld XRF gun used to complete XRF analysis.

27
Samples were placed in a lead lined
chamber and the XRF gun was secured to the
chamber, with the detection window occupying a
small hole in the bottom of the chamber (Figure
3.7). The samples were then bombarded with x-
rays for 180 seconds and analyzed for a suite of
elements, Br, Si, S, Cl, K, Ca, Sr, Al and Fe, similar to
those studied using the microprobe. Na could not
be analyzed due to its low atomic mass, but was
inferred through Cl concentration. Ba and Mg
were not measured, but were calculated and
normalized using Cl and Ca. Every fifth sample was
run twice to provide a constraint on how accurate
the results were and a standard was run at the beginning to calibrate the machine. A total of 27
samples were run to provide an overall bulk chemical analysis of the core, but also to provide
information about the finer scale banding of clear and dark halite, with the intent of discerning
the chemical differences in crystals that caused these bands to form.
The XRF works by bombarding the sample with x-rays to excite electrons within the
sample and cause them to give off energy in the form of x-ray waves. These x-rays pass through
a beryllium detection window located on the XRF gun, where they are sorted based on
wavelength to determine which element produced them. The number of x-rays detected from
each element directly relates to the concentration of that element within the sample. Due to
Figure 3.7: XRF gun in desktop configuration with lead lined sample containment chamber open. Samples were placed in the center of the chamber over the XRF detection window.

28
the different energies given off by electrons falling from different orbitals, there can be peak
overlaps that make it difficult to discern which element is creating the peak. The XRF uses an
algorithm to help constrain which element is more likely based on the other x-rays captured
and the height of the peak in question.
3.5 Electron Microprobe Analysis (EMPA)
The microprobe was used to analyze areas within the thin sections that were of interest.
The microprobe provided information about the element concentrations within anhydrite
crystals that I deemed primary. The formula for anhydrite is CaSO4, with common substitutions
being Ba, Mg and Sr, which were analyzed using the microprobe to indicate paleoenvironmental
changes. The full suite of elements analyzed were Ca, S, Na, Cl, Ba, Mg, Sr, K, P and Br. Several
halite samples were also analyzed for reference.
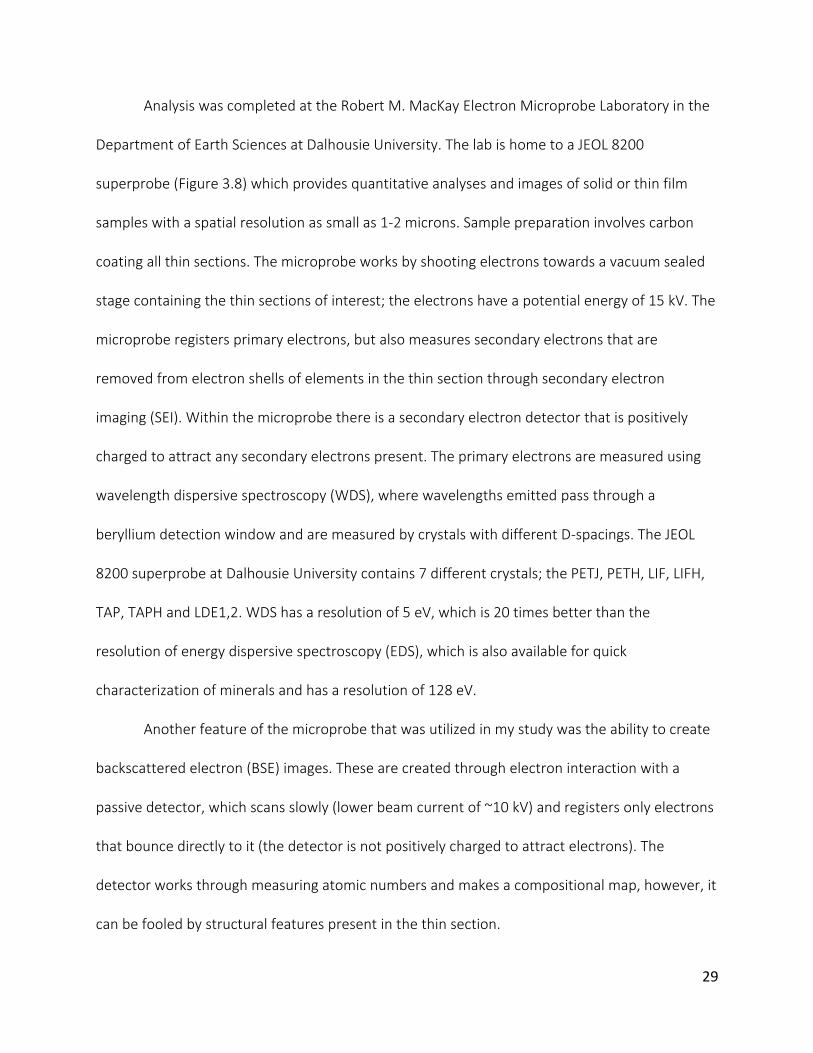
Figure 3.8: (A) Image showing the profile view of the JEOL 8200. (B) Image showing the computer screen array that displayed the camera image and the EMP analyses. (C) Second image showing the different compartments and chambers present on the JEOL 8200.
A
C
B
29
Analysis was completed at the Robert M. MacKay Electron Microprobe Laboratory in the
Department of Earth Sciences at Dalhousie University. The lab is home to a JEOL 8200
superprobe (Figure 3.8) which provides quantitative analyses and images of solid or thin film
samples with a spatial resolution as small as 1-2 microns. Sample preparation involves carbon
coating all thin sections. The microprobe works by shooting electrons towards a vacuum sealed
stage containing the thin sections of interest; the electrons have a potential energy of 15 kV. The
microprobe registers primary electrons, but also measures secondary electrons that are
removed from electron shells of elements in the thin section through secondary electron
imaging (SEI). Within the microprobe there is a secondary electron detector that is positively
charged to attract any secondary electrons present. The primary electrons are measured using
wavelength dispersive spectroscopy (WDS), where wavelengths emitted pass through a
beryllium detection window and are measured by crystals with different D-spacings. The JEOL
8200 superprobe at Dalhousie University contains 7 different crystals; the PETJ, PETH, LIF, LIFH,
TAP, TAPH and LDE1,2. WDS has a resolution of 5 eV, which is 20 times better than the
resolution of energy dispersive spectroscopy (EDS), which is also available for quick
characterization of minerals and has a resolution of 128 eV.
Another feature of the microprobe that was utilized in my study was the ability to create
backscattered electron (BSE) images. These are created through electron interaction with a
passive detector, which scans slowly (lower beam current of ~10 kV) and registers only electrons
that bounce directly to it (the detector is not positively charged to attract electrons). The
detector works through measuring atomic numbers and makes a compositional map, however, it
can be fooled by structural features present in the thin section.
30
Over two separate days, 17 samples were examined, taking roughly 200 analysis points
and creating roughly 50 BSE images. This data set was given in oxide wt. %, calculating for one
oxygen. This was converted to element wt. % by applying a conversion factor to remove the
oxygen component. They were then converted to ppm. The data set was then averaged based
on thin section, which also corresponds to depth within the core. These data were then plotted
on concentration against depth graphs to illustrate the partitioning of elements with depth
within the diapir.
4.0 Sample Description
4.1 Core Description
The section of core that was studied runs from ~850-1190 meter depth. The core is
mainly composed of halite with areas of sylvite and carnallite, along with preserved mudstone
beds and brecciated areas. No anhydrite crystals were seen in hand samples, these were only
revealed using microscopy. Geochemical analysis (XRF) was used in part to help determine
whether sylvite, carnallite or both were present within the core.
The halite alternates between relatively well banded clear and dark halite layers (Figure
4.1), to interlayed clear and dark halite, which makes the halite appear a light gray colour. In
addition, there are areas of pink halite and areas of clear halite and dark halite without
banding. The pink halite is relatively localized and only a small portion of the entire core.
Within the halite there are also areas of preserved mudstone beds (Figure 4.1). The
mudstone beds range from heavily deformed mudstone clasts, too well preserved linear

31
dipping beds. These mudstone beds within the Wallace-1 core are often well preserved in the
center of the core once split, but show obvious pitting and weathering on the external surface.
Areas of brecciation are also abundant throughout the core (Figure 4.1), with sylvite and
carnallite being concentrated in these brecciated zones. This could be due to varying
rheological strengths that cause brittle deformation in sylvite and carnallite layers, instead of
ductile deformation as in halite. Conversely, these brecciated zones could have provided a
pathway for sylvite and carnallite to be dissolved, mobilized and re-precipitated.
The preserved cycles repeat with halite gradually changing into brecciated areas
dominated by sylvite and carnallite, before returning to halite dominated sequences. Towards
the deeper parts of the core, the core becomes more silt and mud dominated, turning to piles
of silt below 1190 meters.
Petrychenko et al. (2002) found similar features preserved in the western portion of the
Maritimes Basin, including clear and dark banded halite, preserved claystone beds and sylvite-
rich areas.
4.2 Hand Sample Description
The hand samples were taken as half cores and showed similar structures to that of the
core. The majority were chosen due to their relationship to preserved bedding or banding and
potential primary nature (Figure 4.2). Several deformed samples were also chosen as
comparison tools (Figure 4.2).
The less deformed samples generally showed clear halite, with some instances of dark
halite and three samples showing potentially unaltered sylvite or carnallite in the matrix. The
crystals within these samples were generally coarse grained (~3-6 mm across) and well formed.

32
The crystals were interlocking and many had a dog-tooth shape, indicating upward growth
direction and matching the snow-on-the-roof texture seen in thin section. Similar chevron style
halite crystals were observed by Petrychenko et al. (2002). Conversely, some samples showed
elongated crystals, likely indicating recrystallization under a preferred orientation due to stress
or fluid flow.
The beds preserved were on the order of 1 cm thick and linear. The beds had varying
dips, but averaged between 40-60 degrees. In some samples the mudstone did not affect the
halite on either side, however, some of the mudstone beds had darker halite on either side that
gradually returned to clear halite over a 1-2 cm interval, potentially indicating mud staining or
that the change from halite to mud- and clay-rich deposition was gradual.
Where present, the banding seemed to show a gradual transition from clear to dark,
with a ~ 1-2 cm window over which light grey halite that was composed of clear and dark halite
crystals existed. Compositional changes that occurred to cause these differences in colour
would have been gradual, not sudden, potentially indicating either element concentrations
changed, mud content in the system increased or sea level changed.
The deformed samples collected ranged from sylvite and/or carnallite dominated to
mud dominated. Some of the samples showed mud clasts within a matrix composed of sylvite
and/or carnallite. Other samples showed massive mudstone with small nodules of sylvite
and/or carnallite within the matrix.

33
Figure 4.1: Core photographs illustrating; (A) preserved halite banding, alternating between clear and dark halite. The bands dip between 30 and 50 degrees; (B) preserved mudstone beds in a halite dominated succession. Mudstone beds dip between 40 and 60 degrees; (C) brecciated areas within a mudstone dominated succession. Sylvite and carnallite are the dominant precipitate within these brecciated areas as seen by the red-pink coloured mineral that fills the fractures. Four rows, each 0.75 meters long, are shown for each photo.
A
C
B

34
Figure 4
.2: H
and
Samp
les cu
t with
a wo
od
saw p
ho
tograp
hed
un
der p
lain ligh
t. (A) Sam
ple N
G-4
2 fro
m 8
60
m d
epth
. (B) Sam
ple N
G-4
0 fro
m 8
75
m d
epth
. (C) Sam
ple N
G-3
9
from
88
0 m
dep
th. (D
) Samp
le NG
-37
from
88
6 m
dep
th. (E) Sam
ple N
G-3
8 fro
m 8
90
m d
ep
th. (F) Sam
ple N
G-3
4 fro
m 9
12
m d
epth
. (G) Sam
ple N
G-3
2 fro
m 9
35
m d
ep
th. (H
) Sam
ple N
G-2
9 fro
m 9
50
m d
epth
. (I) Samp
le NG
-27
from
96
1 m
de
pth
. (J) Samp
le NG
-25
from
96
4 m
dep
th. (K
) Samp
le NG
-22
from
99
3 m
dep
th. (L) Sam
ple N
G-3
0 fro
m 1
01
3 m
d
epth
. (M) Sam
ple N
G-0
3 fro
m 1
02
6 m
dep
th. (N
) Samp
le NG
-01
from
10
38
m d
epth
. (O) Sam
ple N
G-1
8 fro
m 1
04
9 m
dep
th. (P
) Samp
le NG
-11
from
10
59
m d
epth
. (Q) Sam
ple
NG
-13
from
10
71
m d
epth
. (R) Sam
ple N
G-1
4 fro
m 1
10
2 m
dep
th. (S) Sam
ple N
G-0
8 fro
m 1
14
7 m
dep
th. (T) Sam
ple N
G-1
0 fro
m 1
15
8 m
dep
th.

35
4.3 Petrographic Description
These thin sections were then described under transmitted light, looking at anhydrite
crystal clusters, aiming to discern primary textures. A draping texture, known as snow-on-the-
roof texture, was observed (Figure 4.3). This texture is indicative of halite crystals that were
growing in a restricted marine environment, before an incursion occurred or temperature
changed, changing the seawater chemistry or brine conditions slightly, causing precipitation of
anhydrite briefly before the waters returned to their prior seawater chemistry and precipitated a
new sequence of halite (Raup & Hite, 1992; Stewart, 1963). As anhydrite grains precipitated out
of the water column, they settled out and blanketed the halite present on the basin floor. This
texture is represented in stacked sequences within several of the thin sections.
At first, I thought this texture may have been secondary, with anhydrite grains
precipitating along halite grain boundaries in association with deformation. However, upon
examining the deformed thin sections, anhydrite grains were seen spread throughout the thin
section, showing no preferred orientation (Figure 4.3). In addition to this reworking of anhydrite
crystals, there were also instances of an overprinted alteration texture in some thin sections,
both in obviously deformed sections and seemingly undeformed ones.
This gave the indication that the snow-on-the-roof texture was primary, indicating that
primary seawater geochemistry and element concentrations might be retained within these
anhydrite crystals. These same snow-on-the-roof textures were also seen by Holt et al. (2014) in
their undeformed halite samples from the Pennsylvanian Paradox Formation (Utah, USA).
The snow-on-the-roof texture seen from samples in the Paradox Formation are visible in
hand samples, whereas the texture is only obvious in thin section within my samples. This could

36
indicate that the same processes that caused the snow-on-the-roof texture in the Paradox Basin
were occurring within the Cumberland Basin, but on a smaller scale. This indicates that there
was some factor that limited crystal growth within the basin, inhibiting the development of large
scale snow-on-the-roof textures.
Fluid inclusions were also observed under transmitted light microscopy in halite and
anhydrite crystals. Within the halite crystals the fluid inclusions were concentrated along grain
boundaries and were generally a part of elongated inclusion trails, illustrating their migration
pathways and altered nature (Figure 4.4). The inclusions within the anhydrite crystals are both
mineral and fluid (Figure 4.4). The inclusions within anhydrite do not exhibit any obvious
alteration and look relatively undisturbed, which helped me to infer that they had a higher
potential of retaining primary information in regards to the seawater chemistry and
crystallization process.
Reflected light microscopy aided in the identification of any sulfides present. However,
there were very few areas of interest located. Nonetheless, this helped to narrow down areas of
interest for sampling to obtain information about trace metals in the anhydrite crystals.
Combining the data received from hand sample and petrographic descriptions, I chose
specific thin sections that I was interested in studying and determined specific localities within
these thin sections that showed the best promise to provide primary element concentrations.
These localities were then analyzed using the Electron Microprobe (EMP) (Figure 3.3).

37
Figure 4.3: (A & B) Thin section photograph in XPL illustrating primary snow-on-the-roof texture, where coarse, angular, bottom-growth halite crystals are draped by anhydrite crystals that precipitated out of the water column and settled on top of pre-existing halite crystals (1 cm fov). (C) Thin section photograph in XPL illustrating secondary recrystallized anhydrite crystals in a halite matrix. The anhydrite crystals after recrystallization are spread throughout the thin section, showing no preferred orientation and not concentrating along grain boundaries. This is a secondary texture (1 cm fov).
hal
anh
hal
anh
hal
anh
A
C
B

38
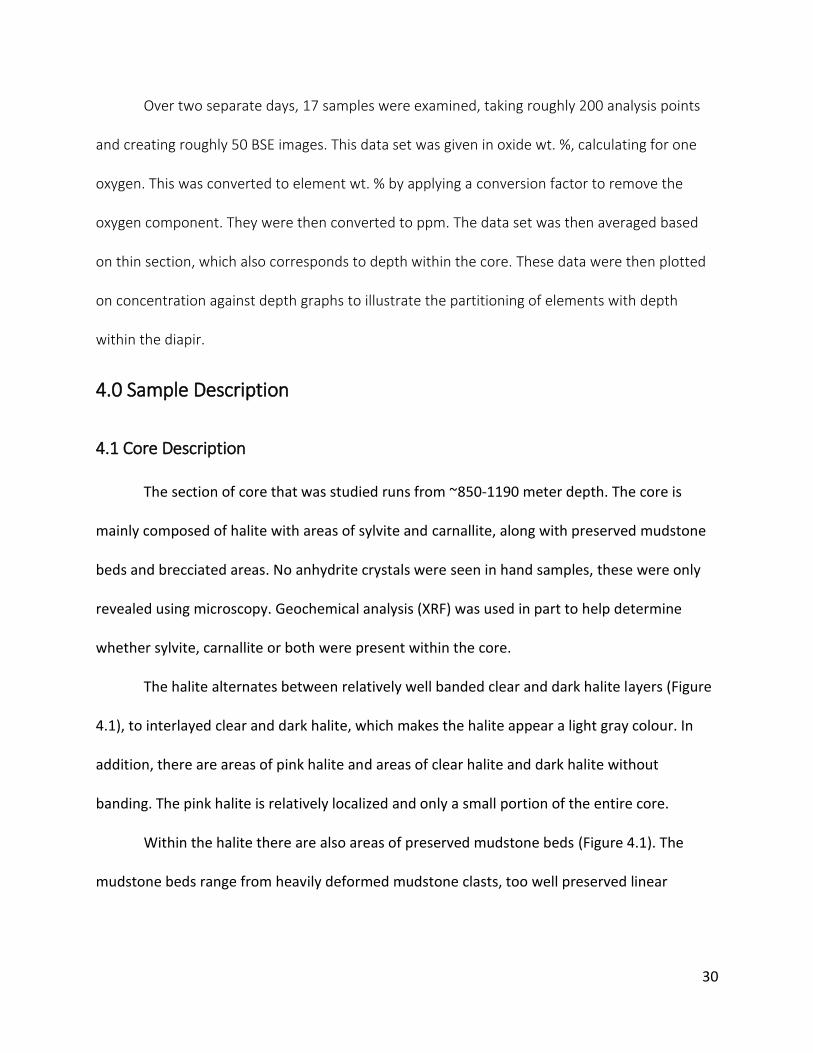
4.4 Electron Microprobe Analysis (EMPA) Description
The BSE images taken using the EMP helped to reaffirm many of the textures observed in
thin section. Snow-on-the-roof textures were seen in many of the less altered samples (Figure
4.5), whereas the obviously deformed samples exhibited anhydrite crystals that were spread
throughout the thin section. Additionally, fluid inclusions within halite burst when sealed in the
vacuum chamber, creating a condensate and showing their inclusion trail orientation. Likewise,
the fluid inclusions within anhydrite also burst, creating a condensate on the mineral surface
(Figure 4.5).
With the help of the BSE images, dissolution features were also found (Figure 4.5). These
features depict a situation where a snow-on-the-roof texture would have existed, but halite was
later dissolved and reprecipitated, moving around the anhydrite crystals. The fact that the halite
dissolved, but the anhydrite grain cap was not altered indicates that the deformation conditions
did not dissolve anhydrite, possibly illustrating their primary nature.
Figure 4.4: (A) Thin section photograph under PPL illustrating altered fluid inclusions that are concentrated in fluid inclusion trails along halite grain boundaries (4 mm fov). (B) Thin section photograph under PPL illustrating mineral and fluid inclusions within anhydrite crystals located within areas of snow-on-the-roof texture (0.5 mm fov).
anh
A B
39
Figure 4.5: (A) BSE image taken using EMP illustrating primary snow-on-the-roof texture preserved. (B) BSE image taken using EMP illustrating anhydrite crystals within a snow-on-the-roof texture, with burst fluid inclusions having formed a condensate on the mineral surface. (C) BSE image taken using EMP illustrating dissolution of halite, reprecipitating around unmoved anhydrite crystals in a preserved snow-on-the-roof texture.
anh
hal
anh
hal
anh
hal
Way up A
C
B

40
5.0 Results and Discussion
5.1 X-ray Fluorescence (XRF) Analysis
Data was collected from 27 samples that were created through crushing areas of
interest into a fine powder using a pestle and mortar. A standard was run prior to my samples
to ensure the XRF was working properly. Furthermore, every fifth sample was run twice to
ensure that the data collected had acceptable precision. In addition to running samples
throughout the core, some areas with clear and dark halite bands were sampled selectively,
sampling the clear and dark halite bands separately, with the intent of deciphering the element
partitioning that caused this banding. The samples were run twice, once under a custom mode
created to analyze elements of specific interest to my study and to give qualitative data about
the relationships between my elements and once using a standard method that was already
calibrated to give more accurate quantitative values. Magnesium and Br were not part of the
suite of elements detected through the standard method, so there values were calculated from
Ca and Cl respectively. This was done using correction factors calculated between the first and
second run of Ca and Cl values. Na was unable to be measured using the XRF, but the data
collected was not normalized to 100% and Na was therefore able to be inferred as the missing
data. The collected data (see Appendix C) encompassed many elements that were not studied,
or below the detection limit, so a simplified table was created to represent the data used (Table
5.1).

41
Figure 5.1: Lithologic log with Si, Ca and Br concentration with depth plots to illustrate the location of data points on the core. Si is used as a representation of mud, clay or silt input, Ca is used as a representation of sulfate content and Br is used as a representation of seawater concentration within the restricted basin.

42
Table 5
.1: D
ata table illu
strating d
ata collected
from
the X
RF. Sam
ple n
um
be
rs den
oted
with
(-C) o
r (-D) in
dicate clear o
r dark h
alite ban
ds m
easured
and
Bal in
dicate
s the to
tal o
f all measu
red elem
ents. A
ll data are in
pp
m.

43
Figure 5.2: Combination of graphs illustrating element concentration in ppm plotted against depth in meters within the core. These graphs show data collected using the XRF and have correlated areas of elevated concentrations.

44
Figure 5.3: Combination of graphs that illustrate element concentration in ppm plotted against depth in meters within the core. These graphs were created from data attained using the XRF and showing a clear correlation in locations with elevated concentrations.
Figure 5.12: Combination of graphs illustrating the elemental concentration in ppm against the depth in meters within the core. The above graphs represent data collected using the XRF.Figure 5.13: Combination of graphs that illustration elemental concentration in ppm plotted against depth in meters within the core. These graphs were created from data attained using the XRF and showing a clear correlation in locations with elevated concentrations.

45
Figure 5.4: Combination of graphs illustrating the element concentration in ppm against the depth in meters within the core. The above graphs represent data collected using the XRF.

46
5.2 XRF Data Relationships
The XRF data provides a coarse representation of the relationships between certain
element concentrations and the mineralogy and deformation seen within the samples (Figure
5.1). Certain elements behave similarly, while certain samples show changes in concentration
across all elements, indicating a specific event or shift that occurred.
5.2.1 Element Relationships
Aluminum, silica and iron have the same depth profile trends (Figure 5.2). The
concentrations are several orders of magnitude different, but the peaks are located at the same
depths. Looking further, the depths that show peaks in Al, Si and Fe are all samples that are
brecciated, or have preserved mudstone beds. It is these brecciated or mud rich zones that are
where Al, Si and Fe are highly concentrated. Therefore, any area with increased Al, Si and Fe
concentrations can be assumed to have undergone deformation or have a substantial mud or
clay component. Similarly, calcium and sulfur behave identically (Figure 5.3). These are the
elements that make up gypsum and anhydrite, which indicates that the peaks seen in Ca and S
are areas that have increased levels of sulfate precipitation. Strontium, although at very low
concentrations, also mimics the trend of Ca and S, with all peaks matching, due to being
commonly substituted for Ca (Figure 5.3). The peaks seen in these three elements are similar to
those seen in Al, Si and Fe; specifically at 875 meters and 1071 meters depth. This could
indicate that they are products of deformation. Conversely, it could indicate that sulfate
precipitation was occurring, and another event such as a rapid input of surface waters caused
an influx of sediment that blanketed or disturbed the sulfates. Moreover, the sulfates could

47
have been precipitating in the late stages of evaporation, persisting in a sabkha-like
environment where sediment input was more frequent, creating these mudstone layers.
5.2.2 Depth Relationships
Many elements show peaks at the same depths, indicating that they were being
preferentially uptaken or incorporated into the chemical structure of the precipitating minerals
at that point. The most obvious example of this is at 1071 meters depth where there are peaks
in Al, Si, Fe, K, Ba, Sr, Ca, S and troughs in Mg, Br and Cl (Figure 5.2, Figure 5.3 and Figure 5.4).
These peaks and troughs are of varying intensities, with a large drop in chlorine and a drop in
bromine concentration potentially indicating brine dilution through seawater input. Mg also
shows a drop, potentially indicating that carnallite existed at this locality but was recrystallized
as sylvite, leading to a peak in K, after the magnesium was mobilized and removed. The sample
from this depth is a mudstone with nodules of sylvite, along with small proportions of halite
and anhydrite within the matrix.
Another example exists at 1160 meters, where there are peaks in Ba and Cl, but troughs
in S, Ca, Sr, Mg and Fe (Figure 5.2, Figure 5.3 and Figure 5.4). The sample illustrates preserved
bedding with a mixture of both clear and dark halite and does not look obviously altered, still
having dogtooth halite crystals preserved. This could mean that there was increased halite
precipitation at this depth, with a decrease in anhydrite precipitation. The increase in Ba could
indicate that there was an influx of surface ocean water, where Ba exists in high concentrations,
into the restricted basin. The concentration of barium varies constantly over the length of the
core, indicating that it is not a sensitive indicator of rhythmic inputs or climatic trends.

48
5.2.3 Halite Banding Differences
Five different samples were analyzed specifically looking at clear and dark halite bands
(Figure 5.5, Figure 5.6, and Figure 5.7). From this data, it was seen that the darker halite bands
generally had higher concentrations of Fe, Al, Si, K, Ca and S. Similar levels of Mg, Ba and Br
exist despite the banding seen. The increased amounts of Fe, Al and Si could indicate that
deformation is more localized along these dark bands. However, considering the small scale of
the bands, this is unlikely. Instead, it is more likely that the dark halite may be attributed to
increased amounts of mud, clay or silt, staining the
halite a dark grey to black colour. This corresponds
to the interbedded black shale seen in the Paradox
Formation, which was associated with water level
changes within the restricted basin (Raup & Hite,
1992). The increases in calcium and sulfur are also
meaningful considering anhydrite crystals can
diffuse light, causing the rock to appear a darker
colour (Raup & Hite, 1992). The combination of
increased siliciclastic sedimentation and increased
anhydrite precipitation likely caused the dark
banding seen throughout the core.
Figure 5.5: Section of core illustrating banded halite annotated to show potential base level change cycles that caused these light and dark halite bands.

49
The existence of more organic rich siliciclastic
rocks and concentrated anhydrite layers indicates the
likely preservation of similar cyclic changes in base
level described within the Paradox Formation (Figure
5.5 & Figure 5.6) (Raup & Hite, 1992) and within the
Cumberland Basin by Boehner (1986) and Schenk et
al. (1994). These cycles, which vary in thickness and
abundance throughout the core can act as an
indicator for the magnitude and periodicity of inflow
into this restricted basin. The scale on which these
halite bands were analyzed cannot confirm this
hypothesis, as changes in the concentration of Ca, S,
Fe, Al and Si cannot be measured across the width of
the halite bands, instead only showing an increase
across the entirety of the dark bands.
More fine scale measurement of several points across these dark bands could better
constrain the nature of these cyclic base level changes and confirm if in fact this is what caused
the banding. Furthermore, the increase in Fe, Al and Si is not consistent across all samples and
is quite small in some samples, making further study of these bands important in confirming
this hypothesis. Additionally, samples taken from dark bands were predominantly crystalline,
avoiding mud rich zones in an attempt to isolate changes within the crystals themselves. This
Figure 5.6: Section of core illustrating banded halite annotated to show potential base level change cycles that caused these light and dark halite bands.

50
sampling method would produce an understated Fe, Al and Si concentration when considering
the entirety of the dark halite band.
The increase in K within these areas indicates increased sylvite precipitation, which is
confirmed through hand sample identification. At 913 meters depth, where there is a large
spike in the potassium concentration, it should be noted that this band contained dark halite,
but also sylvite crystals that were clearly visible in hand sample and under UV fluorescence.
Other samples showed spikes in K concentration, but not to a degree that was determined
significant for further analysis.
When looking at chlorine levels in the clear and dark bands, an inverse trend is seen,
with the clear halite generally having higher chlorine levels than the dark halite (Figure 5.7).
This drop in chlorine concentration within the dark bands matches what Raup and Hite (1992)
proposed regarding these dark bands being physical representations of cyclic base level change
Figure 5.7: A. Illustrates the clear and dark halite band element concentrations at 860 meter depth. B. Illustrates the clear and dark halite band element concentrations at 913 meter depth. C. Illustrates the clear and dark halite band element concentrations at 961 meters depth. D. Illustrates the clear and dark halite band element concentrations at 964 meters depth. E. Illustrates the clear and dark halite band element concentrations at 993 meters depth. F. Illustrates the chlorine concentrations within the clear and dark halite bands at varying depths.
A
D E F
C B

51
within the restricted basin. Changes in sea level, which affected the Pennsylvanian Paradox
Basin (Raup & Hite, 1992), could have occurred within the Mississippian Cumberland Basin as
well, or these cyclic base level changes could be representative of basin recharge due to storm
events or seasonal input.
The presence of brecciated material within these banded areas and elsewhere in the
core could also be indicative of these storm or input events, where there would have been the
potential for reworking of recently deposited evaporites and sediments, creating primary clastic
material that is hard to decipher from brecciation that occurred during halokinesis. This
matches what can be expected in relatively deep evaporite basins where turbidites and mass
flows can occur (Warren, 1989).
5.2.4 Element Ratios
Specific elements have characteristic ratios that can help determine climatic and
temperature changes (Figure 5.8). If these ratios are relatively consistent, it generally means
that the environment that the elements existed within was maintained, with little change in
temperature, water inputs and seawater chemistry. The ratios I looked at were Mg/Ca, Sr/Ca
and Br/Cl. The Mg/Ca ratio depicts the amount of surface seawater water input present and
also the source and temperature of the seawater. The Sr/Ca ratio is relatively well constrained
and constant throughout the ocean, therefore allowing the determination of how recently the
restricted basin had an inflow of seawater to be quantified, based on the variation from this
well-known ratio. The Br/Cl ratio indicates whether seawater concentrations have been
maintained or whether they have been altered through hydrothermal processes. The Br/Cl ratio

52
specifically takes into account the frequency with which bromine substitutes for chlorine within
the halite structure. This occurs at a constant and defined rate, which is why it can be used.
The ratios calculated through my study are relatively consistent, which support the
conclusion that the basin was relatively stable, with occasional influxes of seawater into the
system. Outliers could indicate localized changes that occurred, or areas where deformation
has changed the ratios. Given a lack of distribution coefficients helping to detail how frequently
substitutions of certain elements occur, a quantitative assessment of these ratios cannot be
Figure 5.9: Element ratio vs. depth graphs for Mg/Ca, Sr/Ca and Br/Cl.
Figure 5.8: Graphs illustrating ratios for the whole rock analysis acquired from the XRF.

53
completed. These ratios can also be plotted against depth to provide information about their
change throughout the extent of precipitation (Figure 5.9).
5.2.5 Bromine Concentration
The bromine concentrations generally increase as you move from the bottom to the top
of the deposit, with two distinct dips that likely indicate a significant marine incursion which
diluted the brine and caused a reduction in salinity and also a reduction in the concentration of
bromine (Figure 5.4). This trend matches that seen within the Paradox Formation, where the
bromine is used as an index for the concentration and salinity of the brine (Raup & Hite, 1992).
The increasing trend indicates that the brine within the restricted basin was becoming more
concentrated as more evaporation and subsequent evaporite precipitation occurred. The
regular nature of this trend indicates that the Wallace Sub-basin had to be relatively large to
accommodate a large volume of brine that would not be largely effected by small marine
inputs. This regular profile contrasts with what would be expected from a small basin with
frequent episodes of marine input and recrystallization, which would cause a jagged irregular
trend (Raup & Hite, 1992).
Additionally, the steady trend seen in bromine concentration indicates nearly
continuous precipitation throughout the life of the basin (Raup & Hite, 1992). This factor
indicates that the basin would have had to be at least as deep as the thickness of an entire
halite bed (Raup & Hite, 1992), which cannot be quantified confidently due to the diapiric
nature of the Wallace-1 core, but likely varied from 10’s of meters up to 100 meters. These
cycles are illustrated through the created lithologic log (Figure 1.2).

54
5.2.6 Evaporite Precipitation Cycles
The XRF data supports the idea that these evaporites precipitated in a restricted basin
with occasional seawater input. The bromine data (Figure 5.4) produces a clear image as to the
likely precipitation sequence, with steady evaporation and seawater recharging the basin
periodically. The bromine data shows two cycles of increasing concentration, where the
evaporation would have been taking place, allowing for brine concentration and thus bromine
concentration, before seawater recharged the basin and diluted the brine briefly before
evaporation continued and the brine began to concentrate again.
Looking at the finer scale interbeds of clear and dark halite, there were many smaller
seawater incursions that caused cyclic base level changes, which are recorded in these dark
halite bands.
The peaks in calcium sulfate element concentrations depict a similar cyclic evaporite
sequence, with concentrations of Ca increasing as the brine concentrated, then dropping as the
basin was recharged. The chlorine concentration is relatively constant, roughly matching the
trend of bromine, indicating that halite precipitated throughout the life of the basin, helping to
constrain the brine concentration and evaporation extent.
The peaks in potassium concentration seen in several areas of the core, mainly being
focused near to mudstone dominated areas could indicate that their precipitation occurred
during late stage evaporation under extreme brine concentration. The precipitation of sylvite
followed by mudstone beds could indicate the basin was experiencing increased sediment input
due to reduction in brine volume, potentially in a sabkha environment (Warren, 1989). As
suggested by Raup and Hite (1992), this indicates an arid climate persisted at the time.
55
5.3 Electron Microprobe Analysis (EMPA)
Data was collected from 17 thin sections that were created from samples collected from
the DNR Core Warehouse in New Glasgow, NS. The original samples that were made into thin
sections were chosen based on quality, but also based on their depth, aiming to illustrate the
entirety of the core as best as possible. The 17 thin sections that were chosen for microprobe
analysis range in depths from ~850-1190 meters and were analyzed for Na, Cl, Ca, S, Sr, Br, Mg,
Ba, P and K. Once this data was collected, I averaged all of the element data for each thin
section after removing any data points that were below the detection limit, so as not to skew
the data. After this, I plotted the data to show concentration changes with depth to help
illustrate any trends or similarities between my data.
All data collected was in oxide weight percentages (see Appendix D), but was converted
to ppm, which is how it is presented, to make comparisons with data collected from the XRF
easier (Table 5.2).
5.4 EMPA Data Relationships
The EMP data was collected mainly on anhydrite crystals with the intent of using their
more robust nature, being less soluble with increased temperature, to determine primary
seawater geochemical features. This data provided in depth and accurate information about
the trace elements incorporated into anhydrite crystals (Figure 5.10). Anhydrite crystals within
areas exhibiting primary snow-on-the-roof textures were focused on, with the understanding
that these preserved textures gave a better likelihood of obtaining preserved primary
geochemical data.

56
The EMPA was also completed to supplement data obtained through XRF, giving a more
well-rounded understanding of the whole rock and the finer-scale mineralogical changes that
took place within the restricted basin.
5.4.1 Element Relationships
In contrast to the data collected with the XRF, similar trends are not as obvious between
specific elements from the EMP data. There are still similarities between calcium and sulfur in
terms of peak and trough locations, but between these peaks and troughs the elements behave
differently, likely due to element substitution, which is not registered as obviously when
analyzing the whole rock composition. Sodium and chlorine also show similar trends in their
concentration with depth, with peaks and troughs occurring at similar localities.
5.4.2 Depth Relationships
When looking at concentration changes with depth, there are several instances where
correlations between specific elements can be made (Figure 5.10). Starting at the shallowest
depth, both Na and Ba show peaks at 860 meters. At 875 meters depth, K and Mg have large
peaks, which is interesting considering the rest of the EMP data and XRF data show Mg being
low throughout the section. The sample taken at this depth is highly brecciated, but unlike
other samples concentrated magnesium levels, potentially indicating the presence of carnallite.
At a depth of 890 meters, Na and Cl have peaks, while S, Sr, K, Mg and Ba all experience large
troughs. At a depth of 913 meters, S has a peak and Na and Cl have troughs. Furthermore, Ca
and S experience peaks at 1039 meters; K shows a peak and Sr shows a trough at 1039 meters;
Na shows a peak at 1049 meters and Cl shows a trough at the same depth; Ca and S both have
peaks at a depth of 1102 meters, whereas Na has a trough at this depth; Na, Ba and K both

57
Table 5
.2: D
ata table illu
strating d
ata collected
from
the e
lectron
micro
pro
be. A
ll data w
ithin
this tab
le has b
een
averaged b
ased o
n sa
mp
le nu
mb
er an
d listed
against th
eir co
rrespo
nd
ing d
epth
.

58
Figure 5
.10
: Co
mb
inatio
n o
f graph
s created
that p
lot elem
ental co
ncen
tration
in p
pm
against th
e dep
th in
mete
rs with
in th
e core. Th
e Grap
hs sh
ow
data co
llected u
sing th
e Electro
n M
icrop
rob
e.

59
have peaks at 1147 meters and finally, Sr has a large increasing trend towards 1158 meters,
while Ca exhibits a decreasing trend over this same interval. In general, the trends recorded by
the anhydrite crystals are not as variable as those exhibited in the corresponding whole rock
analysis. This suggests that the anhydrite composition represents similar conditions throughout
the measured sequence.
5.4.3 Element Trends
The individual element trends act as a helpful characterization tool to determine finer
scale processes within the basin. Calcium and sulfur exhibit cyclic jumps in concentration, owed
to their concentration changes within halite banding (Figure 5.10). They would have also been
affected by substitutions of other elements into the chemical structure of anhydrite. Changes in
Na and Cl help to indicate the dominant mineral precipitating at the time. When Na and Cl
values are high in anhydrite, it indicates that less was being used to precipitate halite (Figure
5.10). Chlorine could also be affected by periods of seawater input, diluting the overall
concentration. Potassium and Mg slowly increase in concentration from the bottom to the top
of the core, but drop sharply near the top of the core when sylvite and carnallite precipitation
would have begun, taking up all available K and Mg (Figure 5.10). Strontium is also cyclic and in
relatively constant proportions, being quickly substituted into the anhydrite structure. The
peaks exhibit areas of seawater input where strontium levels would have risen and the troughs
show where the anhydrite has depleted the waters of Sr through substitution with Ca (Figure
5.10). Bromine starts high in anhydrite when the brine would have been saturated with Cl. As
the brine became more concentrated and halite precipitation started to take up more Br, there
would have been less available to be used in anhydrite (Figure 5.10), creating an inverse

60
relationship to the XRF (Figure 5.4), which showed an increasing trend. Phosphorous is at very
low levels within anhydrite and is highly variable, likely due to cyclic inputs or basin changes, as
is similar to many other minerals (Figure 5.10).
5.4.4 Anhydrite Precipitation Cycles
Over the entire extent of the deposit, there is little variation seen within the majority of
the elements, especially calcium and sulfur, which make up anhydrite. This indicates that the
seawater chemistry must have been relatively consistent for such little variation to be present.
This indicates that anhydrite precipitated under restricted conditions within a narrow chemical
window. In addition, the cyclic nature seen within the plots is evident of periodic inflows of
marine waters, replenishing the system.
This supports the idea that the restricted basin had relatively consistent conditions, with
little variations and occasional inputs. The trace elements that were substituted into the
anhydrite crystals are also able to be qualified in relation to the nature of the basin and its
periodic recharge.
In addition, this supports the idea that despite halokinesis, the original geochemical
features have been retained within these anhydrite grains, as well as within the whole rock,
allowing for paleoenvironmental conditions to be inferred.
6.0 Conclusion
Based on the collected data, it can be concluded that the Wallace-1 core retains many of
its primary seawater geochemical features. Despite the fluid inclusions likely being reset and
not providing primary seawater information, the element concentrations and their
relationships provide clear information about the paleoenvironment in question.

61
The preservation of halite banding, indicative of small scale base level changes within
the basin, along with the preservation of mudstone bedding, indicative of late stage, shallow
marine environments with terrestrial inputs, both show that despite halokinesis primary
geochemical features still exist. It also sheds light on the basin dynamics, starting as a relatively
deep basin, shallowing into a sabkha-like environment before being recharged, although not to
the original depth, due to precipitation outpacing subsidence, with this cycle repeating
throughout the life of the basin.
The preservation and abundance of snow-on-the-roof textures that are seen within the
thin sections prove that seasonal changes in temperature and/or seawater chemistry were
recorded and have persisted despite deformation, aiding in the conclusion that the anhydrite
crystals are unaltered in portions of the deposit, showing that the element concentrations are
consistent with what they would have been during original deposition. The fact that these
textures are apparent on a different scale than in the Paradox Basin could indicate: i) the
conditions within the basin did not allow for larger crystal growth; ii) the precipitation was
slower, not allowing for larger scale crystals to nucleate and grow; or iii) the cycles could have
been more rapid, not giving the crystals enough time to grow to the same size.
The XRF data and the associated trends between related elements indicate that
alteration has not largely disturbed the geochemical record maintained within the samples
studied despite deformation. Thus, the idea that the Wallace Sub-basin was a restricted, deep
to shallow marine basin with occasional marine input, which replenished the basin and diluted
the brine, holds true.

62
The EMP data proves that the anhydrite crystals precipitated under a narrow set of
conditions that persisted throughout the entirety of the core, indicating that these strict
conditions must have also persisted through the life of the basin. The anhydrite crystals also
define cyclic conditions where recharge waters must have flowed into the basin. The anhydrite
crystals also give information about the nature of these waters, with the peaks in Ba indicating
marine surface water input, increased Sr showing marine inflow, Na and Cl showing halite co-
precipitation levels and Mg and K indicating brine concentration and evaporite cycle stage.
The Wallace Sub-basin was located at equatorial latitudes and existed through semi-arid
to arid climates, with occasional marine inputs and the potential for meteoric water inputs
through runoff or storm events. The basin experienced rapid subsidence, prior to and
throughout the course of evaporite precipitation. The precipitation of halite, anhydrite, sylvite
and likely carnallite, with additions of mud, clay and silty material, both in low stand and high
stand periods, led to the lithologic assemblage seen in the core. The precipitation was rapid and
consistent throughout the life of the basin. The basin was cut off either through glacial related
sea level drop or tectonic activity. Halokinesis occurred shortly after, during the deposition of
the Mabou Group and deformed the salt deposit, causing it to migrate vertically into the cores
of salt domes during the late Carboniferous.
Evaporites provide a direct measure of paleoseawater geochemistry. The fluid inclusions
within evaporites provide data about the seawater at the time of precipitation. Many other
rock types can be used to make inferences or judgements about climatic and oceanographic
changes at the time of deposition, but few, if any, can provide the same precise information
that evaporite deposits can. Thus, salt domes, which are large bodies of evaporites, are

63
important tools to study when attempting to reconstruct the climate and seawater chemistry of
a specific time period. The determination that primary seawater geochemical signatures can be
retained within anhydrite crystals and the whole rock despite deformation processes can be
helpful in reconstructing paleoenvironmental conditions. The ability to do this can provide
information about temperatures, fresh versus marine water inputs and the frequency of these
inputs, as well as helping to identify climatic changes. In areas lacking undeformed salt deposits
or other rock types commonly used for making inferences about climate, salt diapirs, which are
common throughout Nova Scotia and many areas, can be utilized. These findings are especially
important considering evaporite basins of Carboniferous age are rare, making the study of
those that do exist of great importance. This is especially true considering the Carboniferous
period marked a transition from calcite to aragonite seas. By further studying these deposits,
this shift in seawater chemistry, which has occurred several times throughout geologic time,
can be better quantified and understood.
If I were to continue this research there are several avenues that could be explored.
Firstly, ICP-MS analysis could be completed to determine more quantitatively the variations in
the bulk rock geochemistry. This analysis could also be done at a finer scale on the dark halite
bands to discern element partitioning within them, helping to determine concretely if they are
in fact preserved base level changes. Further microprobe work could also be undertaken to look
into the potassic salt concentrations within these samples. Distribution coefficients could be
created to help model the evaporation process which precipitated the sequence seen in the
Wallace-1 core and give the ability to analyze element ratios in more detail. Sulfur and oxygen
isotope data could also be collected to better constrain inputs and environmental conditions.

64
Finally, fluid inclusion analysis could be completed with the intent of determining the degree to
which the fluid inclusions have diverged from original seawater compositions. From this, a
study of the deformation and hydrothermal fluids could aid in the understanding of the specific
halokinetic processes that occurred in the early Namurian and if any subsequent deformation
occurred at a later date. The findings of my study, showing that salt diapirs can retain primary
seawater geochemical features, makes exploration of the above future work valuable.

65
7.0 References
Blakey, R. (2013), North American Key Time-slice paleogeographic Maps. Colorado Plateau Geosystems, Inc.
Boehner, R. C. (1986), Salt and potash resources in Nova Scotia, Department of Mines and Energy.
Calder, J. H. (1998), The Carboniferous evolution of Nova Scotia, Geol. Soc. London, Spec. Publ., 143, 261–302.
Hite, R.J., (1960), Stratigraphy of the saline fades of the Paradox Member of the Hermosa Formation of southeastern Utah and southwestern Colorado. Geology of the Paradox basin fold and fault belt: Four Corners Geological Society Field Conference, 3rd, p. 86-89.
Hite, R.J., (1985), The sulfate problem in marine evaporites. Sixth Symposiumon Salt: The Salt Institute, v. 1, p. 217-230.
Raup, O. B., & Hite, R. J. (1992), Lithology of evaporite cycles and cycle boundaries in the upper part of the Paradox Formation of the Hermosa Group of Pennsylvanian age in the Paradox Basin, Utah and Colorado. US Geological Survey Bulletin 2000-B.
Holt, N. M., J. Garcia-Veigas, T. K. Lowenstein, P. S. Giles, and S. Williams-Stroud (2014), The major-ion composition of Carboniferous seawater, Geochim. Cosmochim. Acta, 134, 317–334.
Jaworska, J. (2012), Crystallization, Alternation and Recrystallization of Sulphates. Advances in Crystallization Process, 465-490.
Lynch, G., and P. S. Giles (1995), The Ainslie Detachment: a regional flat-lying extensional fault in the Carboniferous evaporitic Maritimes Basin of Nova Scotia., Can. J. Earth Sci., 33, 169–181.
Pe-Piper, G., D. J. W. Piper, and S. B. Clerk (1991), Persistent mafic igneous activity in an A-type granite pluton, Cobequid Highlands, Nova Scotia, Can. J. Earth Sci. = Rev. Can. des Sci. la Terre, 28(7), 1058–1072.
Petrychenko O., Peryt T. M. and Roulston B. (2002), Seawater composition during deposition of Visean evaporites in the Moncton Subbasin of New Brunswick as inferred from the fluid inclusion study of halite. Can. J. Earth Sci. 39, 157–167.
Quinlan, G. M., and C. Beaumont (1984), Appalachian thrusting, lithospheric flexure, and the Paleozoic stratigraphy of the Eastern Interior of North America, Can. J. Earth Sci., 21(9), 973–996.
Schenk, P. E., R. Matsumoto, and P. H. Bitter (1994), Loch Macumber (early Carboniferous) of Atlantic Canada, J. Paleolimnol., 11(2), 151–172.
Stewart, F.H., (1963), Marine evaporites. Fleischer, M., ed., Data of geochemistry (6th ed.): U.S. Geological Survey Professional Paper 440-Y, 52 p.
Timofeeff, M. N., T. K. Lowenstein, S. T. Brennan, R. V. Demicco, H. Zimmermann, J. Horita, and L. E. Von Borstel (2001), Evaluating seawater chemistry from fluid inclusions in halite: Examples from modern marine and nonmarine environments, Geochim. Cosmochim. Acta, 65(14), 2293–2300.

66
Waldron, J. W. F., D. J. W. Piper, and G. Pe-Piper (1989), Deformation of the Cape Chignecto Pluton, Cobequid Highlands, Nova Scotia: thrusting at the Meguma-Avalon boundary, Atl. Geol., 25, 51–62.
Waldron, J. W. F., M. C. Rygel, M. R. Gibling, and J. H. Calder (2013), Evaporite tectonics and the late Paleozoic stratigraphic development of the Cumberland basin, Appalachians of Atlantic Canada, Geol. Soc. Am. Bull., 125(5-6), 945–960.
Warren, J. K. (1989), Evaporite Sedimentology: Importance in Hydrocarbon Accumulation. Prentice-Hall, Inc., 38-163.
Williams-Stroud S. (1994), The evolution of an inland sea of marine origin to a non-marine saline lake: the Pennsylvanian Paradox Salt. SEPM Spec. Publ. 50, 293–306.

67
8.0 Appendices
Appendix A - Core Description
Depth (ft) Core #, Box # Lithology Structures Notes
2811.2-2815.8 2, 9 Halite, clear and dark Dipping bands, some folding and deformation
Transition from dark to clear and back, broken up
2815.8-2820.5 2,10 No Change Slightly more deformation
Clear and dark beds intertwined/waving, broken up
2820.5-2825.4 2, 11 No Change Some vertical bands No Change
2825.4-2827 2, 12 No Change No Change No Change
2830-2835 3, 1 Halite, clear and dark, some silty intervals, Clear dominates
Distinct halite banding, dipping ~60°
Solid, not broken up, banding random
2835-2840 3, 2 No Change No Change No Change
2840-2845 3, 3 Dark halite dominates, pink halite or sylvite potential
No Change No Change
2845-2850 3, 4 No Change No Change No Change
2850-2855 3, 5 Dominantly dark halite, some clear halite and mudstone beds
Relatively massive, few preserved mudstone beds
Mix of halite in places creating grey halite
2855-2860.8 3, 6 No Change No Change, but more preserved beds
No Change
2860.8-2866.2 3, 7 Dark Halite, Mudstone beds, Sylvite
Grades from preserved mudstone beds to brecciated
Brecciation dominant in second half, broken into pieces
2866.2-2871.6 3, 8 Mudstone, Sylvite Brecciated material No Change
2871.6-2877.5 3, 9 No Change No Change Some sylvite dominated portions
2877.5-2883.6 3, 10 Brecciated back to creamy halite
Seems to show preserved beds in brecciated section
Brecciated area is solid, not broken up, halite broken up
2883.6-2890 3, 11 Clear and Dark halite, preserved mudstone
Banding and bedding both preserved, folding
Mudstone beds pitted, banding is distinct and also gradual
2890-2894.5 4, 1 No Change Banding dominates and is more regular
Bands are dominant feature
2894.5-2907.7 4, 2-4 No Change No Change No Change
2907.7-2916.8 4, 5-6 Dark halite with some pink halite and sylvite grading to brecciated sections
Few preserved mudstone beds going to brecciated material
Brecciated material held together but goes to brittle material
2916.8-2925.7 4, 7-8 Mudstone and Sylvite Mudstone with sylvite filling gaps
Sylvite showing flow around mudstone clasts
2925.7-2935.5 4, 9-10 No Change No Change More broken up
2935.5-2944.9 5, 1-2 No Change No Change No Change
2944.9-2949.4 5, 3 More sylvite rich No Change No Change

68
2949.4-2958.3 5, 4-5 Mudstone, Sylvite, Halite
Few preserved mudstone beds
Small halite interval with mudstone beds in middle
2958.3-2963.3 5, 6 Mudstone, Sylvite Brecciated heavily Broken up
2963.3-2982 5, 7-10 No Change No Change Some portions more held together
2982-2987 5, 11 Mudstone, Sylvite, Halite
Brecciated heavily with small proportion of halite
Broken up
2987-2992 5, 12 Mudstone, Sylvite Brecciated heavily Sylvite-rich, held together
2992-2998 5, 13-14 No Change No Change More broken up
2998-3014.4 6, 1-4 No Change No Change Mix of broken and solid
3014.5-3018.9 6, 5 No Change No Change Solid
3018.9-3023.5 6, 6 Mudstone, Sylvite, Halite
No Change Small halite chunks in broken up core
3023.5-3028.3 6, 7 Grading back to clear and dark halite, some sylvite
Sylvite intermixed with halite, looks to be randomly distributed
Broken up
3028.3-3032.9 6, 8 Less sylvite Still lacking obvious structures
Becomes solid again
3032.9-3037.5 6, 9 Mudstone, Sylvite, Halite
Brecciated material, some preserved mudstone beds
First half brecciated, second half creamy halite with mudstone beds
3037.5-3042.2 6, 10 No Change No Change Brecciated appearance but halite dominated with preserved mudstone beds
3042.2-3046.7 6, 11 Halite, Mudstone Thin banding, preserved mudstone beds
Portion of core broken and bagged
3046.7-3051.2 6, 12 No Change No Change Core more solid
3051.2-3056 6, 13 Halite, Mudstone, Sylvite
Goes from thinly banded halite to brecciated
3056-3064.5 7, 1-2 Mudstone, Sylvite Heavily brecciated Held together
3064.5-3070.4 7, 3 No Change No Change No Change
3070.4-3075 7, 4 Halite, Mudstone Clear to creamy halite with thin preserved mudstone beds dipping ~60°
Hard to determine true halite colour due to external staining
3075-3079.7 7, 5 Same with some pink halite and sylvite
Same with beds ~40° and brecciation at end
Pink halite with bedding, sylvite with brecciation
3079.7-3084 7, 6 Clear, Dark and Pink Halite, Mudstone
Mix of halite banding with preserved bedding
Preserved beds often break up the halite banding
3084-3088.7 7, 7 No Change Less preserved banding and bedding, becomes brecciated
3088.7-3092.2 7, 8 Mudstone, sylvite Heavily brecciated Solid
3092.2-3098 7, 9 No Change No Change No Change

69
3098-3102.3 7, 10 Some Halite present Massive halite near end of box
No Change
3102.3-3107 7, 11 Mudstone, Sylvite Brecciated to heavily brecciated
No Change
3107-3111.6 7, 12 No Change More mudstone dominated than before, more brittle
Broken up
3111.6-3116.5 7, 13 Clear and Dark halite Some possible banding
Broken up so structures not evident
3116.5-3121.2 8, 1 Halite, mudstone Massive dark halite with few preserved mudstone beds
3121.2-3144.3 8, 2-6 Mudstone, Sylvite, Halite
Brecciated with occasional chunks of broken up halite
Mix of solid and brittle material
3144.3-3149 8, 7 Mudstone, Sylvite, Clear and Dark halite
Have bands of sylvite and mudstone changing into clear and dark halite bands with mudstone beds
Gradual change from brecciated to non-brecciated, well preserved banding
3149-3153.3 8, 8 Halite, Mudstone Clear and dark halite banding, preserved mudstone beds
Dipping ~30-50°
3153.3-3176 8, 9-13 Some pink halite Much of the same until box 13 which is mudstone dominated with some sylvite cross cutting beds
Well preserved, dipping but little deformation
3176-3189.7 9, 1-3 Mudstone, Sylvite Heavily brecciated Solid
3189.7-3194.3 9, 4 No Change No Change No Change
3194.3-3199 9, 5 Slight halite component
Brecciated with massive halite sections
No Change
3199-3203.5 9, 6 No Change Some deformed, but intact mudstone beds
Some obviously recrystallized halite
3203.5-3212.7 9, 7-8 Halite, Mudstone Very well defined and preserved mudstone beds
Some halite looks to be recrystallized, others not
3212.7-3236 9, 9-14 No Change Mudstone beds preserved, dominantly clear halite, little banding
Some pitting and some red staining on exterior
3236-3240.9 10, 1 No Change Darker halite dominates with same preserved mudstone beds, but are less continuous
Seems to be larger mudstone component in halite
3240.9-3245 10, 2 No Change Mix of clear and dark halite becoming brecciated
Same red staining seen around mudstone beds
3245-3249 10, 3 Mudstone, Sylvite Heavily brecciated Broken up
3249-3252.6 10, 4 No Change No Change bagged as broken into fine grained piles
3252.6-3257.3 10, 5 Halite, Mudstone Drastic switch to well preserved linear mudstone beds in dominantly clear halite matrix with
Pitting of mudstone bids and bed dip ~40-60°

70
some dark halite bands present
3257.3-3261.8 10, 6 No Change No Change No Change
3261.8-3265.8 10, 7 No Change Halite bands dominate over preserved beds
No Change, bands mirror dip
3265.8-3270.5 10, 8 No Change No Change No Change
3270.5-3275.1 10, 9 No Change Less obvious structures, looks more massive
Exterior stained, obscuring any obvious banding
3175.1-3280 10, 10 No Change Some mudstone beds preserved but hard to determine
No Change
3280-3284.6 10, 11 No Change No Change but more dark halite
No Change, some red staining on exterior
3284.6-3289.2 10, 12 No Change No Change No Change
3289.2-3294 10, 13 Mudstone, Sylvite Heavily brecciated Silty, bagged material
3294-3298.6 11, 1 Mudstone, Sylvite, Halite
Heavily brecciated moving to blocky halite chunks
Bagged moving to small chunks of halite
3298.6-3302.3 11, 2 Mudstone, Halite Mix of clear and dark halite, few preserved beds
Mudstone pitting, red staining
3302.3-3307.7 11, 3 No Change Well preserved beds, some thin bands but mainly clear halite dominated
No Change, beds dip ~20-50°
3307.7-3312.3 11, 4 No Change No Change No Change
3312.3-3316.6 11, 5 No Change Larger mudstone component, with some areas breaking into piles of silt
No Change
3316.6-3321.3 11, 6 No Change Preserved mudstone beds and thin bands
No Change, becomes brecciated at end
3321.3-3326.1 11, 7 Mudstone, Sylvite Brecciated
3326.1-3330 11, 8 Halite, Mudstone, Sylvite
Mainly massive halite with few mudstone beds and small proportion of brecciated material
3330-3347 11, 9-12 Mudstone, Sylvite, Halite
Dominantly brecciated, some mudstone portions with sylvite and other areas show preserved halite with mudstone beds that is more broken up
Some sections bagged, some still fully intact, mudstone beds show pitting
3347-3355 11, 13-14 No Change Generally massive mudstone/sylvite mixture
Solid
3355-3363.5 12, 1-2 Mudstone, Sylvite Brecciated, sylvite filling fractures in mudstone
Some bagged, some in tact
3363.5-3368 12, 3 Mudstone, Sylvite, Halite
Dominantly massive grey halite with a component of

71
mudstone and some brecciation
3368-3397.4 12, 4-10 Mudstone, Sylvite Heavily brecciated Bagged to small blocks of mudstone with sylvite
3397.4-3402 12, 11 Halite, Mudstone Massive clear halite with some indications of preserved mudstone beds
Some red staining, some pitting on mudstone
3402-3406.5 12, 12 No Change Slightly more dark halite, higher mudstone component
No Change
3406.5-3415 12, 13-14 No Change Preserved mudstone beds evident, clear and dark halite bands
Mudstone beds break/define bands often
3415-3424.9 13, 1-2 Mudstone, Sylvite Dominantly mudstone with sylvite filling fractures in matrix
Some portions breaking down to silt piles
3424.9-3428.9 13, 3 Halite, Mudstone Dominantly creamy halite with some mudstone component, not beds though
3428.9-3433.4 13, 4 Mudstone, Sylvite, halite
Brecciated material with small areas of halite
Broken up
3433.4-3438.2 13, 5 No Change Brecciated material that shows some mudstone and sylvite banding, clasts seem to have an orientation which follows banding
Solid
3438.2-3442.8 13, 6 No Change Some preserved mudstone beds, some areas of pure sylvite, less deformation
No Change
3442.8-3451.5 13, 7-8 Mudstone, Sylvite Heavily brecciated, sylvite fills cracks
Mostly piles of mud and silt with sylvite chips present in gaps
3451.5-3456.1 13, 9 Halite, Mudstone, Sylvite
First half is massive dark halite with preserved mudstone bed, but goes back to brecciated material
3456.1-3460.7 13, 10 No Change Brecciated material Small proportion of halite
3460.7-3465.1 13, 11 Halite, Mudstone, Sylvite
Dominant mixed colour halite with few preserved bed and small proportion of sylvite at beginning
Brecciation still present for first ~20 cm of box
3465.1-1-3475 13, 12-13 Halite, Mudstone Dominantly clear massive halite with preserved linear mudstone beds, some halite banding
Mudstone beds dip ~60-70°
3475-3483.9 14, 1-2 Halite, Mudstone Mix of clear and dark halite bands on a fine
No Change

72
scale to dominantly dark halite, with mudstone beds throughout
3483.9-3520.8 14, 3-10 Mudstone, Sylvite Heavily brecciated, sylvite filling fractures
Solid generally
3520.8-3535 14, 11-13 Halite, Mudstone Clear and dark banded halite, preserved mudstone beds
Some obvious recrystallization and staining near mudstone beds (staining looks an orangey red colour)
3535-3544.2 15, 1-2 Halite, Mudstone Seem to have some brecciated halite at start that moves into clear and dark halite (some banding) with some pink halite and mudstone beds
Some halite recrystallized, most of mudstone beds breaking down
3544.2-3553.8 15, 3-4 Halite, Mudstone Dominantly massive dark halite, some clear recrystallized clear halite portions
Mudstone present within halite, but not as discrete beds
3553.8-3558.4 15, 5 No Change Dominantly massive dark halite with some preserved mudstone beds
Beds dip ~40°
3558.4-3562.5 15, 6 Mudstone, Halite, Sylvite
Recrystallized halite becomes brecciated material
Recrystallized halite is mainly dark with few clear circular inclusions
3562.5-3566.8 15, 7 Mudstone, Sylvite Heavily brecciated Large proportion of sylvite – red staining of box
3566.8-3575.9 15, 8-9 Halite, Mudstone Abundant preserved mudstone beds, some clear and dark halite banding and mixing
Beds dip at ~50°
3575.9-3580.5 15, 10 No Change Similar but slightly higher mudstone component
Mudstone component making halite more brittle
3580.5-3585.3 15, 11 No Change Dark halite dominated, high mudstone component, some mudstone beds
Mudstone beds dip shallowly at ~20° and second half of box is broken up
3585.3-3594.6 15, 12-13 No Change Clear and dark halite, mudstone beds preserved, also have large mudstone component
Mudstone causes halite to be more broken up, more brittle/crumbly
3594.6-3609 16, 1-3 Halite, Mudstone, Sylvite
Starts as dark mudstone rich halite, grades into bagged brecciated material and back to dark mudstone rich halite,
Abundant change over small interval

73
ending in a clearer halite section
3609-3613.5 16, 4 Mudstone, halite Clear halite dominated with preserved mudstone beds
Some red staining and pitting on mudstone, beds dip from ~20-45°
3613.5-3618.6 16, 5 No Change Dark halite dominated with small clear halite bands and mudstone beds
No Change
3618.5-3654.2 16, 6-13 Halite, Mudstone, Sylvite
Slow gradual change from banded halite with mudstone beds to red-stained, brittle brecciated material dominated by mudstone
Goes from halite, to brecciated material, back to halite and then becomes fully brecciated, doesn’t occur immediately
3654.2-3714.2 17, 1-13 Mudstone, Sylvite Heavily brecciated, mudstone dominated, sylvite present in fractures, flowing around mudstone clasts
Generally quite solid, some silt piles where is almost all mudstone
3714.2-3757.1 18, 1-9 No Change No Change More broken up and degraded
3757.1-3766.8 18, 10-11 Mudstone, Sylvite, Halite
Less deformed, some banding and bedding preserved, still signs of recrystallization
Lower mud content, less broken up
3766.8-3771.6 18, 12 No Change All bagged, heavily brecciated with some small pieces of halite
Basically piles of silt
3771.6-3798.9 19, 1-6 No Change Almost all bagged, some halite chunks present and not bagged
Halite is stained and looks obviously altered
3798.9-3803.6 19, 7 Halite, Mudstone External surface heavily stained but seems to be some banding and few preserved beds
Still in rough shape but not brecciated, some red and orange staining
3803.6-3817.2 19, 8-10 No Change Less banding, less bedding, obvious recrystallization
Red and orange staining more prevalent
3817.2-3830 19, 11-13 No Change Increasing mud content reducing much of sample to silt piles
Same staining seen where samples intact
3830-3833 20, 1 No Change Features (likely preserved mudstone) that look almost stylolitic, generally cream coloured halite
Staining still prevalent and some crumbling from high mud content
3833-3865.7 20, 2-8 No Change High mud content causing some crumbling, variable clear and dark halite bands and preserved
Exterior stained but core generally in good shape, some mixing of clear and dark halite from recrystallization,

74
beds despite some obvious recrystallization
banding boundaries blurred
3865.7-3875.1 20, 9-10 Mudstone, very small portion of sylvite
Bagged piles of mud and silt
Very little sample, only few bags present
3875.1-3889 20, 11-14 No Change No Change No Change
3889-4009.8 21-23, all No Change No Change No Change
Appendix B - Sample Description
From top of hole down Starting at closest to surface and going to greatest depth * indicate further study considered Sample: 42 * Area in core: Core 2, Box 11, ~2822 ft depth Size: 13.5cm x 8.7cm Texture: relatively coarse-grained, well defined and formed crystals that are interlocking with clean fresh faces (grains average from 3-5mm), light and dark blend together over 2cm window Structures: some form of bedding/banding between creamy-white/clear halite and darker grey halite (bed dips at ~60 degrees). The banding is deformed and wavers, likely due to the salt expulsion Composition: creamy-white/clear halite and darker grey halite Other: geochemical data already present from this area Sample: 41 * Area in core: Core 3, Box 2, ~2841 ft depth Size: 6.4cm x 8.8cm Texture: relatively coarse grained (clear/milky halite grains 3-6mm and dark grey halite grains 1-4mm), well defined and formed crystals that are interlocking with clean fresh faces. Dark halite and clear halite blend together at a gradual boundary, not abrupt (over 1cm window) Structures: bedding/banding seen between the clear/cream halite and dark halite with bed dipping between 20-70 degrees (bed doesn’t waver but is curved) with average dip of 40 degrees Composition: creamy/clear halite and dark grey halite Other: seems that some grains are completely clear and some are more creamy coloured in sample. Geochemical data not already present for this area Sample: 40 * Area in core: Core 3, Box 8, ~2872 ft depth Size: 11cm x 7.6cm Texture: brecciated samples with pinky/red matrix (carnallite or sylvite) with finer grains that are very interlocked, hard to see defined grains even with hand lens (~1mm to less) but some clean crystal surfaces can be seen. The rest of the sample is composed of blocky fragments, ranging from 0.2cm-5cm that show a varying composition – some being a darker grey green

75
colour, which are fine grained, smooth, and have a silky sheen to them (almost look platy), whereas others are a lighter brown green colour and are coarser grain, feel sandy or silty to the touch and lack a sheen. These blocky chunks have grains of carnallite or sylvite caught up in them (mainly in the grittier sandier blocks) Structures: no obvious structures, doesn’t show a preferred orientation or any banding Composition: carnallite or sylvite matrix with blocks of mudstone to poorly consolidated sandy/siltstone Other: no previous geochemical data present Sample: 39 * Area in core: Core 3, Box 11, ~2889 ft depth Size: 10.9cm x 8.8cm Texture: relatively coarse-grained creamy/clear halite (3-6mm) and dark halite (2-5mm) banded/bedded with a mudstone lamination on either side of the darker halite bed. The darker halite blends into the clear halite despite the mudstone bed on ~2cm spread. Mudstone bed is thin (0.2-1cm), but only a remnant. All that is left is small pits with some muddy material remaining. Pits range from 0.2-1cm across and are 0.2cm-1.6cm long. In other words they are not completely connected and are just a spotted band on either side of the dark grey halite bed Structures: bedding in sample is relatively consistent, with little wavering, possibly good for sampling as still have the mudstone bed preserved to a degree. Bed dips at ~50-60 degrees Composition: creamy/clear halite, dark grey halite, mudstone pockets Other: geochemical data present for this sample Sample: 36 Area in core: Core 4, Box 3, ~2900 ft depth Size: 10.4cm x 8.9cm Texture: relatively coarse-grained creamy/clear halite (2-7mm) and dark grey halite (1-6mm). On fresh surface can clearly see abundant interlocking grains that are easily distinguishable in clear halite, but less distinguishable in dark grey halite. Not a well-defined bed/band, more of a dark grey halite line with gradual fading towards creamy halite outwards in either direction over a ~2-3cm scale Structures: band/bed not defined but as mentioned above seems to be a darker grey halite zone that has leached outward or been altered outward from dark grey halite line – rough dip of ~40-60 degrees on bed Composition: creamy/clear halite and dark grey halite Other: no geochemical data currently present Sample: 37 * Area in core: Core 4, Box 4, ~2906 ft depth Size: 12cm x 8.9cm Texture: relatively coarse-grained with almost all dark grey halite with patches of clear/creamy halite present within. Potential banding, but looks deformed and on smaller scale, cm thick bands that pinch and swell and blend into a medium grey colour, not continuous. Similar to previous have more defined grains in clear halite and more interlocked grains in grey halite

76
Structures: rough banding of dark, clear, dark, clear, dark, clear across sample, but not visible throughout entirety of section – from what can be discerned, bands waver between a dip of 50 and 70 degrees Composition: mix of clear halite and dark halite (mostly dark grey) which also creates a lighter grey halite appearance (maybe light grey grains or maybe just the mixture creates the appearance Other: no geochemical data Sample: 38 * Area in core: Core 4, Box 7, 2920 ft. depth Size: 6.3cm x 8.8cm Texture: relatively coarse-grained carnallite or sylvite (1-5mm) with grains that are distinguished and well defined. Some areas where grains are packed very closely together and others where they stand out more. Potential preferred orientation of the grains, look slightly elongated looking down the sample (downhole), aka elongated across hole. Also have a mudstone component defined by relatively large blocks with sharp contacts and have abundant carnallite/sylvite within block. Mudstone portions are a pinky/red/brown colour and are gritty, well held together – basically muddy matrix with carnallite or sylvite grains supported within Structures: no structure other than potentially elongated grains across hole Composition: carnallite or sylvite with mudstone Other: no geochemical data Sample: 35 * Area in core: Core 5, Box 10, ~2980 ft depth Size: 8.4cm x 5.2cm Texture: coarse-grained dark grey dominated halite sample with some patches of clear halite (2-8mm size grains), can see defined faces on both clear and grey halite, seems as though there are distinct patches, clear halite doesn’t blend into dark grey halite, instead is butted up against, but looks separate, little mudstone portion running through sample Structures: no obvious structures, relatively massive Composition: clear halite, grey halite, very small mudstone component Other: geochemical data for rough window present Sample: 34 * Area in core: Core 5, Box 13, ~2994 ft depth Size: 9.6cm x 6.4cm Texture: relatively coarse-grained sample that has grains ranging from 1-6mm. very interesting as have overall dark grey halite but has slight mudstone component, with little bit of clear halite at edges of sample and abundance of pinky/orange grains throughout centre. Looks to have both carnallite and sylvite present, which are intermingling with the dark grey halite. On outside of sample (slightly polished outside of core) there are abundant pits from where crystals of carnallite or sylvite have weathered out or been dissolved. Seem to be in a line, potential bedform?

77
Structures: possible bedform of intermixed carnallite, sylvite with dark grey halite in between dark grey halite on either side. Defined by pits from weathering, only real way to distinguish bedform clearly, which dips at ~45 degrees Composition: dark grey halite, clear halite, portions of mudstone in matrix and carnallite and sylvite Other: geochemical data not present, seems as though carnallite and sylvite may have intruded later through fracture zone or something as seems they fill spaces Sample: 32 * Area in core: Core 7, Box 4, ~3070 ft depth Size: 6.3cm x 8.8cm Texture: coarse-grained mainly clear halite dominated sample, with small sections of very dark grey halite, also some pinky/orange in one corner, potentially some alteration or differing composition present within that is emitting colour. Grains roughly 0.2-0.8cm in size and can see many clean fresh faces, as per usual, clear looks more separated grains, while grey looks like more interlocked grains, less distinguished Structures: very interesting structures, in bottom corner dark grey halite band, then have clear halite band, then very thin (0.3cm) band of dark grey halite again followed by a pinky/orange halite above band. Also have a thin (0.3cm) dark grey band cutting through the clear halite section and connecting the two dark grey halite beds, beds dip at just under 50 degrees (~48) Composition: dark grey halite, clear halite, pink/orange halite Other: no geochemical data present Sample: 33 Area in core: Core 7, Box 10, ~3104 ft depth Size: 4.3cm x 8.9cm Texture: range of grain size – from too fine to tell up to 6 or 7mm. mainly a pink/orange halite with colour ranging from pink to orange across sample. Also have blocks of mudstone that is a green/brown/dull grey colour that has carnallite or sylvite grains present within. The mudstone is gritty and poorly held together, can scratch and pull apart with fingernail, is crumbly. Carnallite/sylvite grains within are circular and nicely formed, some pitting from grains weathering out. Unsure whether matrix is carnallite/sylvite or just a pink/orange halite Structures: no obvious structures present Composition: mudstone with carnallite/sylvite and either carnallite/sylvite or pink/orange halite Other: geochem data at 3110 but not at 3104 Sample: 29 * Area in core: Core 8, Box 1, ~3120 ft depth Size: 5.4cm x 8.8cm Texture: relatively coarse-grained (1-4mm) dark grey dominated halite. Most uniform sample to date, almost all dark halite, some small patches of clear halite but <5% likely Structures: no obvious structures, looks relatively massive Composition: dark grey halite, small portion of clear halite Other: geochemical data present

78
Sample: 28 Area in core: Core 8, Box 5, ~3139 ft depth Size: 7.2cm x 8.8cm Texture: interesting texture, generally coarse-grained (2-5mm) pink/orange halite or carnallite/sylvite matrix that has a mudstone component in blocks similar to before, except these are finer grained blocks, darker and better consolidated, less crumbly. Still have carnallite/sylvite grains trapped within. Blocks are a dark grey green colour Structures: no obvious structures other than potential for elongated grains across drill hole as seen before in similarly altered sample Composition: orange/pink halite or carnallite/sylvite and mudstone with carnallite/sylvite grains within Other: no geochemical data Sample: 27 * Area in core: Core 8, Box 8, ~3153 ft depth Size: 13.0cm x 8.2cm Texture: fresh face obscures bedding but on outer surface can see very thin fine scale cyclic bedding – beds of clear and grey halite, little then lenses of mud between many of the bed planes Structures: beds at 50 degrees Composition: clear, grey halite and mudstone Other: no geochem data Sample: 26 * Area in core: Core 8, Box 9, ~3158 ft depth Size: 11.0cm x 7.7 cm Texture: very nicely bedded clear, grey halite section with some cream interspersed at bedding planes. Coarse grained (3-7mm) with nice fresh face Structures: beds dip at 45-60 degrees and range from cm to several cm thick Composition: clear, grey halite and cream halite Other: no geochem data Sample: 25 * Area in core: Core 8, Box 11, ~3164 ft depth Size: 8.4cm x 7.9cm Texture: pretty coarse (2-7mm), half grey halite and half clear halite, contact is blurred so can’t tell bedding plane but only slightly altered, some mudstone component in grey halite Structures: bedding but can’t measure dip as is gradual contact Composition: clear and grey halite, little mud Other: no geochem data Sample: 24 * Area in core: Core 8, Box 12, ~3167 ft depth

79
Size: 8.6cm x 8.1cm Texture: another beautifully bedded sample with clear, cream and grey halite (2-6mm), once again a thin lens of mudstone Structures: beds at 65-75 degrees roughly, waver a bit, looks intact though, possibly unaltered Composition: clear, cream, grey halite and mudstone Other: no geochem data Sample: 23 * Area in core: Core 9, Box 9, ~3214 ft depth Size: 8.7cm x 8.4cm Texture: coarse grained almost exclusively clear/cream halite (massive)(3-7mm) with one thing laminae of mudstone indicating a preserved bedding plane Structures: bedding roughly at 50 degrees based off mudstone bed Composition: clear/cream halite, mudstone Other: no geochem data Sample: 22 * Area in core: Core 10, Box 6, ~3258 ft depth Size: 13.2cm x 8.7cm Texture: gorgeous sample of interbedded clear, cream, grey halite with some preserved mudstone beds seen through pitting on the outside of the sample. Grains from 1-6mm Structures: beds at 50-60 degrees and ranging from 0.5cm to couple cm thick beds Composition: clear, cream and grey halite with some mudstone Other: no geochem data Sample: 21 Area in core: Core 10, Box 10, ~3276 ft depth Size: 2 chunks – 1st 9.8cm x 4.6cm, 2nd 9.0cm x 3.7cm Texture: mix of clear and grey halite with no obvious bedding or orientation. Possible contact between the two where it becomes distinguished and separated but unsure due to broken sample. Grains from mm-5mm Structures: none, possible vertical bed though Composition: clear and grey halite Other: no geochem data Sample: 31 Area in core: Core 11, Box 2, ~3299 ft depth Size: 7.5cm x 5.7cm Texture: coarse grained sample with clear halite in centre and orange/pink altered halite on outside. Definite deformation occurred in area and have grains from 2-5mm with average in middle Structures: no structures, just decreasing deformation into centre, or decreased fluid interaction/staining Composition: orange/pink halite and clear halite

80
Other: no geochem data Sample: 30 * Area in core: Core 11, Box 7, ~3325 ft depth Size: 13.5cm x 8.0cm Texture: mostly dark grey halite with some lighter cream halite and clear halite as well. Grains on the sub mm scale (mud component) up to the 5-6mm scale in some of the coarser grey and cream and clear halite Structures: no obvious indicators of bedding but looks like a relatively massive homogeneous dark grey halite sample Composition: grey halite, cream and clear halite, some mud component Other: no geochem data Sample: 03 * Area in core: Core 12, Box 3, ~3367 ft depth Size: 4 chunks – 1st is 6.4cm x 8.0cm, 2nd is 7.6cm x 8cm, 3rd is 4.5cm x 2.5cm and 4th is 5.0cm x 2.0cm Texture: definitely altered, see some grain elongation at 35 degrees to hole, have lots of pink halite present along with grey and clear halite. Grains from 1mm-9mm and no obvious bedding. Unsure of alteration Structures: only thing is the elongation of crystals at ~35 degree angle to hole Composition: Pink halite and clear and grey halite Other: no geochem data Sample: 02 Area in core: Core 12, Box 11, ~3399 ft depth Size: 7.6cm x 8.8cm Texture: quite clean, mostly a light grey/brown halite with some darker and clear portions present, lacking bedding, see some pitting on the back of the sample with pink/red/orange staining around. Grains are coarse and from 1-5mm Structures: lacking any obvious bedding or other structures Composition: grey and clear halite, possible remnant mudstone with some maybe carnallite and sylvite that would have weathered out Other: no geochem data Sample: 01 * Area in core: Core 12, Box 13, ~3408 ft depth Size: 8.9cm x 8.7cm Texture: beautiful sample that have very nice preserved bedding can see clear halite bed curve around the core sample and on fresh surface have almost complete grey halite with some variations of clear and creamy halite present as well. Grains similar to others 1-5mm with very small mud component Structures: bedding at 50-60 degrees roughly Composition: grey halite, clear and cream halite, mudstone

81
Other: no geochem data Sample: 20 Area in core: Core 13, Box 2, ~3420 ft depth Size: 8.5cm x 8.9cm Texture: heavy brecciated, very fine grained mudstone that is a dark grey/green colour and quite soft, scratchable with nail. Takes up majority of the rock but have some small areas/crystals of carnallite/sylvite in the matrix and have some larger more pervasive carnallite/sylvite veins cross cutting the mudstone Structures: some veins but they don’t appear to have a specific orientation. Possible relict bedding that mudstone has taken on at a dip of 40 degrees roughly Composition: mudstone, carnallite and sylvite Other: no geochem data Sample: 19 Area in core: Core 13, Box 3, ~3425 ft depth Size: 8cm x 8.6cm Texture: relatively coarse grained halite with almost vertical banding of clear halite and grey halite with a mudstone component (clear is 1-5mm and grey is sub mm – 3mm) Structures: banding is vertical but wavers, looks like the addition of mud weakened grey halite and it is deforming and bending, whereas the clear halite is more rigid and holding its shape better Composition: clear, grey halite and mudstone Other: no geochem data Sample: 18 * Area in core: Core 13, Box 6, ~3441 ft depth Size: 6.4cm x 6.0cm Texture: Coarse grained halite with interlocking crystals, some dark grey halite present but most of it is a deep red halite/sylvite. Grain sizes from sub mm to 5mm Structures: no obvious structures, look like sample has likely been altered Composition: pink halite, grey halite, sylvite Other: no geochem data Sample: 17 Area in core: Core 13, Box 12, ~3468 ft depth Size: 6.5cm x 8.8cm Texture: coarse grained grey and orange halite with some obvious alteration and evidence of some brecciation on outer surface, though inner surface looks clean and also shows some clear unaltered halite – grains from 2-6mm Structures: brecciated portions are seen through grey halite with mud component that looks to have intruded in and also through the presence of the orange/pink halite that seems to have filled cracks/voids Composition: clear halite, grey halite, orange/pink halite and mudstone

82
Other: no geochem data Sample: 11 * Area in core: Core 14, Box 1, ~3477 ft depth Size: 5.5cm x 8.4cm Texture: coarse grained clear and grey halite with some potential staining to pinky halite. Fresh faces on fresh surface Structures: no obvious bedding structures but mainly composed of clear halite grains that are distinguishable with some darker halite present as well, but in conjunction with clear halite Composition: clear and grey halite Other: no geochem data Sample: 13 * Area in core: Core 14, Box 9, ~3514 ft depth Size: 3.7cm x 8.7cm Texture: almost exclusively dark brown fine grained mudstone with abundant carnallite/sylvite crystals present within the matrix – carnallite/sylvite grains 1-4mm. also see very small clear and grey halite grains at sub mm scale Structures: none that are apparent Composition: mudstone with some carnallite/sylvite and minute amounts of clear and grey halite Other: no geochem data Sample: 12 Area in core: Core 14, Box 12, ~3529 ft depth Size: 5.9cm x 8.5cm Texture: coarse grained clear halite (2-6mm) with finer grained grey halite (1-3 mm with one or two 5mm crystals), is mainly grey halite with smaller portions of clear halite present Structures: no obvious bedding or other distinguishing structures Composition: clear and grey halite Other: no geochem data Sample: 16 * Area in core: Core 15, Box 1, ~3536 ft depth Size: 8.4cm x 8cm Texture: beautiful sample, with mix of clear and grey halite of coarse grained nature – 1-5mm grain size overall with coarser grains being clear Structures: very nice bedding present with some thin interbeds on the mm to cm scale. Generally grey in grey and clear in clear but have some distinct clear small grains in grey and vice versa Composition: clear and grey halite Other: no geochem data Sample: 15

83
Area in core: Core 15, Box 11, ~3582 ft depth Size: 2 chunks – 1st is 4.5cm x 8.8cm and 2nd is 4.8cm x 8.6cm Texture: mix of coarse grained clear halite and some finer grained grey halite with mud component, also have some pinkish looking halite that creeps in from edge and looks like some sort of fluid staining Structures: potential bedding marks but hard to really distinguish or measure, similar orientation to other samples Composition: clear halite, grey halite with mud and possible altered/stained halite due to fluids Other: no geochem data Sample: 14 * Area in core: Core 16, Box 5, ~3616 ft depth Size: 7.2cm x 8.9cm but is on angle, goes with rough bedding Texture: relatively coarse grained, with clear halite (1-5mm) coarser than grey halite (2-3mm), see clear bedding and many fresh faces. Clear halite grains are more distinct then grey halite Structures: bedding between clear and grey dipping at 45-60 degrees, bed thickness changes Composition: grey halite, clear halite Other: no geochem data Sample: 09 * Area in core: Core 18, Box 7, ~3746 ft depth Size: 14.0cm x 8.8cm Texture: almost all mudstone with some mixed in carnallite/sylvite. On outer portions of sample have break where it becomes pure sylvite? But in centre is almost all mudstone with some small veins of sylvite and little crystals of carnallite in mudstone matrix (grain size of mudstone is too fine to tell and carnallite/sylvite from 3-5mm roughly Structures: veins cross mudstone at rough dip of 15-30 degrees as they cut across sample Composition: carnallite, sylvite and mudstone, likely some other halite in small portions that cant be seen easily Other: no geochem data Sample: 08 * Area in core: Core 18, Box 11, ~3763 ft depth Size: 7.8cm x 8.8cm Texture: finer grained sample than most of the others, some forms of bedding present. Clear halite has grains from sub mm-4mm and grey halite has grains from sub mm-2mm. have a couple of pits with similar pinkish staining on outside of core Structures: pits and bedding oriented in the same direction. Dips at ~55-65 degrees Composition: clear halite, dark grey halite with some possible mudstone and possible carnallite/sylvite that weathered out? Other: no geochem data Sample: 07 Area in core: Core 17, Box 10, ~3701 ft depth

84
Size: 12.6cm x 8.9cm Texture: heavily brecciated sample with area of fine grained soft mud and area of grey halite mixed with mud component. Mud has dark brown colour, looks like high clay content? And mixed is a lighter green brown colour. Also have carnallite or sylvite patches within the sample filling in fractures or cracks in apparent sheets Structures: no obvious bedding or other recognizable structure Composition: grey halite, mudstone, carnallite/sylvite Other: no geochemical data Sample: 06 Area in core: Core 17, Box 11, ~3703 ft depth Size: 11.5cm x 8.8cm Texture: coarse-grained, see dark halite with potential mudstone component, also see some clear halite and some that is an orangey pink colour. Grains are less than a mm to 7mm Structures: hard to discern any defined beds, potentially one between dark grey halite with mud and orangey halite at 45-55 degrees, bed pinches and swell. Possible orientation of grains across hole Composition: clear halite, orange/pink halite, grey halite, mudstone? Other: no geochem data Sample: 10 * Area in core: Core 19, Box 7, ~3800 ft depth Size: 15.7cm x 8.9cm Texture: coarse grained (1mm-7mm), mix of clear halite, grey halite with some mudstone present in a small portion, on back side see some pitting from the mudstone with some red/pink staining around the pit, orientation of grains at roughly 45 degrees to the hole Structures: no obvious bedding but possible thin laminae of grey halite in overall clear halite , with pitting on back following same bedding orientation, dipping at 55-60 degrees, is rough though Composition: clear halite, grey halite, mudstone, possibly some accessory mineral causing staining? (maybe carnallite or sylvite after being weathered out?) Other: no geochem data Sample: 05 Area in core: Core 20, Box 1, ~3830 ft depth Size: 4 chunks – 1st is 10.4cm x 8.8cm, 2nd is 6.8cm x 8.8cm, 3rd is 6.5cm x 2.7cm and 4th is 4.4cm x 3.2cm Texture: coarse-grained, possibly banded between clear and grey halite, looks like grains have a preferred orientation roughly across drill hole, grains 1-8mm, clean faces on fresh surface Structures: possible bedding at 35-40 degrees but is wavy and curved. Also see a contact between a much more mudstone rich section with some interspersed clear and grey halite with occurrences of carnallite or sylvite Composition: clear halite, grey halite, mudstone, carnallite/sylvite Other: geochem data present but over a 100ft window – not accurate

85
Sample: 04 Area in core: Core 20, Box 4, ~3846 ft depth Size: broken into 4 chunks – 1st is 11.1cm x 8.7cm, 2nd is 12.6cm x 5.3cm, 3rd is 9.4cm x 3.7cm and 4th is 7.0cm x 3.0cm Texture: coarse grained, mix of clear halite ad darker grey halite. Some clear halite present but looks like it is potentially present as an alteration features. Some good clean crystal faces on fresh surfaces. See some pitting on outer surfaces that should indicate a more fissile mudstone layer but looks to be all halite on the fresh inner surface. Grains generally 2-5 mm. upon closer inspection may be dark halite with some mudstone component Structures: none able to be seen in this sample Composition: clear halite, dark grey halite, altered cream halite?, mudstone? Other: geochemical data from 3806-3908 ft… very broad
Appendix C - XRF Data
XRF data is attached in a separate excel file. Both Run 1 and Run 2 data are represented, though Run 2 was the dominant data set used. Run 1 simply acted to help calculate certain values. Certain data manipulations were undertaken and are described below. Firstly, elements not used in this study were discarded from Run 2. Run 1 calculated relative proportions of elements accurately but did not calculate quantitatively correct values. Run 2 measured more quantitatively accurate values, but found some elements, mainly Br and Mg, under the detection limit. The relative proportions of Cl (for calculating Br) and Ca (for calculating Mg) were calculated between Run 1 and Run 2, giving a conversion factor. This factor was then applied to the Br and Mg values from Run 1 to convert them to more quantitatively accurate values. The element Na was unable to be measured due to its light molecular weight. However, Run 2 totals all elements measured and provides it as a balance. This balance did not add up to one million, indicating a portion of the sample was not measured. Given that the majority of the samples are halite rich, it is likely that a large proportion of the missing data would have come from Na. Therefore, the balance was subtracted from one million to provide a crude estimate of the Na amount in the samples. It should be noted that this was used strictly as a tool to gather a rough understanding of Na distribution and to ensure it did not vary drastically from Cl. It was not used for any interpretations or analysis. It should be noted that the XRF does not provide quantitative values that are extremely accurate, but instead provide a helpful first step. Further work using ICP-MS would ideally have been undertaken to receive more quantitatively accurate values if time and money allowed.

86
Appendix D - Electron Microprobe Data
Electron Microprobe data is attached in a separate excel file. Certain data manipulations were undertaken and are described below. Firstly, the oxygen present had to be removed to allow for oxide wt. % to be converted to element wt. %. This was done by dividing the molar mass of the individual element in the formula by the molar mass of the total formula. This calculation created a conversion factor that was then applied to the data. Ca/CaO = 40/56 = 0.7143 % of CaO microprobe * Concentration factor = Ca % Next, the data was arranged based on depth and standards were removed, leaving only anhydrite values. Points that were far outside the expected range of data were considered inaccurate or outliers and were removed so as not to greatly skew the average. This data was then averaged based on the thin section, which also corresponds to a specific depth in the core. This data was then converted from element wt. % to ppm by multiplying the values by 10,000.
Appendix E - Photo Library
All photos have been compiled into an online photo library which can be viewed via the link: https://drive.google.com/folderview?id=0B5m8XVFOfpT2ZEFkTVZEWnFjZ28&usp=sharing