Using and Abusing Government Intervention and abusing government...A Revised Version of this paper...
20
A Revised Version of this paper appears as: “Using and Abusing Government Intervention and Trade Policy,” In East Asia Foundation, Shaping New Regional Governance in East Asia: A Common Vision for Mutual Benefit and Common Prosperity(Seoul: ORUEM Publishing House), 2010. Using and Abusing Government Intervention and Trade Policy in the 2009-2010 Financial Crisis Vinod K. Aggarwal Professor and Director Berkeley APEC Study Center 802 Barrows Hall, #1970 University of California Berkeley, California 94720-1970 Tel.: 510-642-2817 Fax: 510-643-1746 Email: [email protected]
Transcript of Using and Abusing Government Intervention and abusing government...A Revised Version of this paper...
A Revised Version of this paper appears as: “Using and Abusing Government Intervention and Trade Policy,” In East Asia Foundation, Shaping New Regional Governance in East Asia: A Common Vision for Mutual Benefit and Common Prosperity(Seoul: ORUEM Publishing House), 2010.
Using and Abusing Government Intervention and
Trade Policy in the 2009-2010 Financial Crisis
Vinod K. Aggarwal
Professor and Director Berkeley APEC Study Center
802 Barrows Hall, #1970 University of California
Berkeley, California 94720-1970
Tel.: 510-642-2817 Fax: 510-643-1746
Email: [email protected]
1
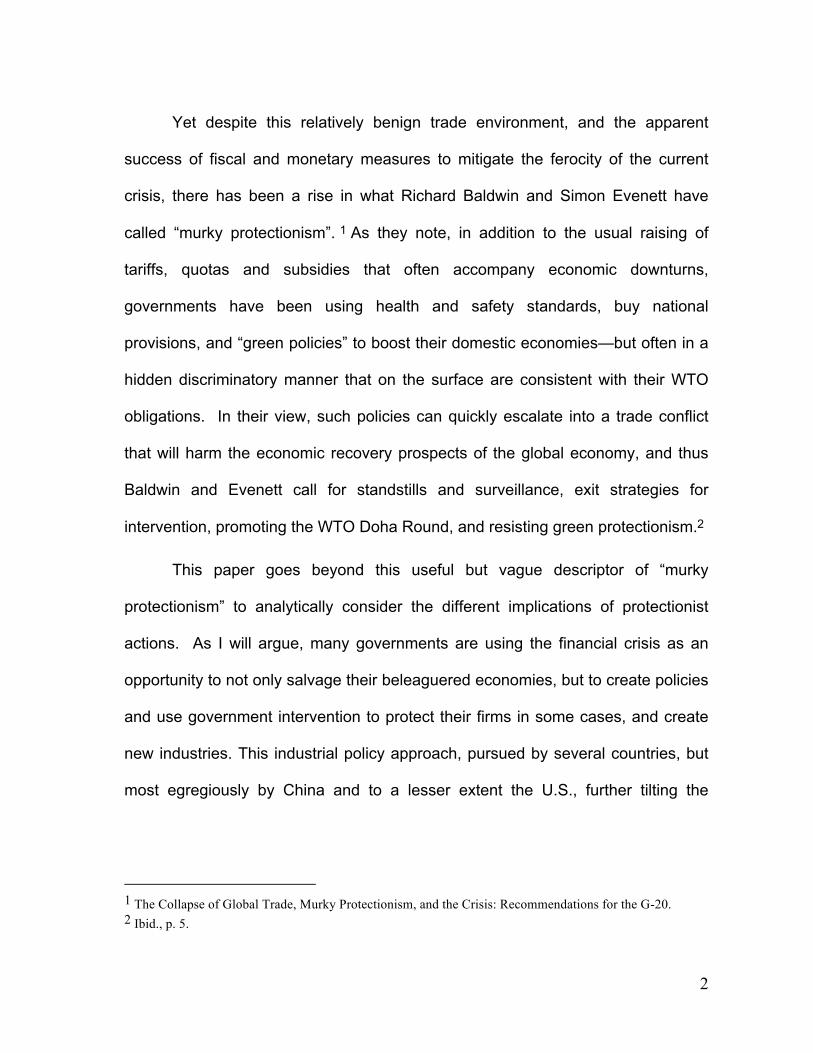
Paper prepared for The 5th Jeju Peace Forum, “Shaping New Regional Governance in East Asia: A Common Vision for Mutual Benefits and Common Prosperity,” August 11-13, 2009. For research assistance, I am grateful to Cindy Cheng and Cindy Hwang.
I. Introduction
The financial crisis of 2009-2010 has been unprecedented in its global impact,
harkening comparisons to the 1930s Great Depression. Indeed, the fastest growth
industry in the wake of the subprime mortgage crisis in the U.S. is comparisons to
the 1930s. As many analysts have pointed out, governments mishandled the
1930s depression. The Federal Reserve failed to support commercial banks,
leading to the failure of 4000 banks, lack of deposit insurance led to consumer
losses, an inadequate fiscal stimulus package delayed recovery until the onset of
the second World War, and most importantly for this paper, massive protectionism
with the passage of the Smoot-Hawley bill led to tariffs over 65%, causing a
collapse of world trade that sharply exacerbated the depression.
By contrast the response to current financial crisis has been very different.
In the United States, the Federal Reserve has supported commercial banks and
bond insurance companies, with very few failures in this sector. Deposit insurance
has been increased, and depositors have not lost money. Similar programs to
help economies in trouble have been developed elsewhere, as I review below.
Most importantly, there has not been a massive turn toward higher tariffs, quotas,
or arrangements such as the U.K. Imperial Preference scheme or the German
Schacht Plan that linked East European economies through preferential accords to
the German economy.
2
Yet despite this relatively benign trade environment, and the apparent
success of fiscal and monetary measures to mitigate the ferocity of the current
crisis, there has been a rise in what Richard Baldwin and Simon Evenett have
called “murky protectionism”. 1 As they note, in addition to the usual raising of
tariffs, quotas and subsidies that often accompany economic downturns,
governments have been using health and safety standards, buy national
provisions, and “green policies” to boost their domestic economies—but often in a
hidden discriminatory manner that on the surface are consistent with their WTO
obligations. In their view, such policies can quickly escalate into a trade conflict
that will harm the economic recovery prospects of the global economy, and thus
Baldwin and Evenett call for standstills and surveillance, exit strategies for
intervention, promoting the WTO Doha Round, and resisting green protectionism.2
This paper goes beyond this useful but vague descriptor of “murky
protectionism” to analytically consider the different implications of protectionist
actions. As I will argue, many governments are using the financial crisis as an
opportunity to not only salvage their beleaguered economies, but to create policies
and use government intervention to protect their firms in some cases, and create
new industries. This industrial policy approach, pursued by several countries, but
most egregiously by China and to a lesser extent the U.S., further tilting the
1 The Collapse of Global Trade, Murky Protectionism, and the Crisis: Recommendations for the G-20. 2 Ibid., p. 5.
3
uneven global playing field, making it even more challenging for firms around the
world to boost their fortunes in a difficult economic environment.
II. An Overview of National Responses to the Crisis3 Most countries have been involved in an aggressive response to the financial
crisis, although one could not really argue that the response has been particularly
well coordinated. Instead, governments have pursued policies to help stimulate
their domestic economies. In the U.S., for example, the Troubled Asset Relief
Program (TARP) program has helped banks through asset purchases backed by
$700 billion. In addition, the auto sector has received approximately $40 billion,
and the most significant domestic package, as well as increasingly controversial
one, has been the one promoted by President Obama to the tune of $ 787 billion,
which include tax cuts, help to encourage employment, and spending in for energy,
infrastructure, healthcare, education, and science. Of this package, only about
$250 billion will be spent in 2009, leading critics to complain about the slow pace
of expenditures. Still, the overall package puts the U.S. in second place among
the G-20, accounting for 5.9% of its 2008 GDP (Saudi Arabia is first with a $49.6
billion package which is 9.4% of GDP).
The exact figures on spending and expenditures are subject to change.
Eswar Prasad and Isaac Sorkin in Assessing the G-20 Economic Stimulus Plans:
3 This overview draws partly on work by the Economics and Research Analysis group at Frost & Sullivan
Inc., with whom the author serves as Chief Economist.
4
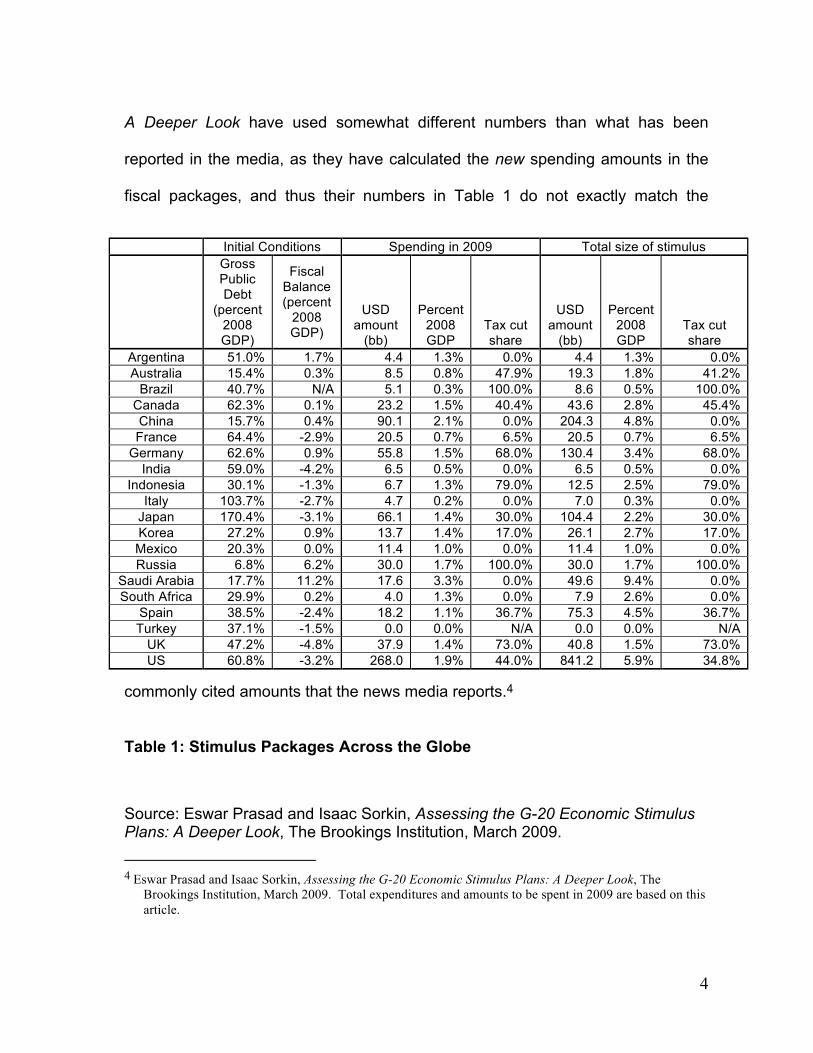
A Deeper Look have used somewhat different numbers than what has been
reported in the media, as they have calculated the new spending amounts in the
fiscal packages, and thus their numbers in Table 1 do not exactly match the
commonly cited amounts that the news media reports.4
Table 1: Stimulus Packages Across the Globe
Source: Eswar Prasad and Isaac Sorkin, Assessing the G-20 Economic Stimulus Plans: A Deeper Look, The Brookings Institution, March 2009.
4 Eswar Prasad and Isaac Sorkin, Assessing the G-20 Economic Stimulus Plans: A Deeper Look, The
Brookings Institution, March 2009. Total expenditures and amounts to be spent in 2009 are based on this article.
Initial Conditions Spending in 2009 Total size of stimulus Gross
Public Debt
(percent 2008 GDP)
Fiscal Balance (percent
2008 GDP)
USD amount
(bb)
Percent 2008 GDP
Tax cut share
USD amount
(bb)
Percent 2008 GDP
Tax cut share
Argentina 51.0% 1.7% 4.4 1.3% 0.0% 4.4 1.3% 0.0% Australia 15.4% 0.3% 8.5 0.8% 47.9% 19.3 1.8% 41.2%
Brazil 40.7% N/A 5.1 0.3% 100.0% 8.6 0.5% 100.0% Canada 62.3% 0.1% 23.2 1.5% 40.4% 43.6 2.8% 45.4% China 15.7% 0.4% 90.1 2.1% 0.0% 204.3 4.8% 0.0% France 64.4% -2.9% 20.5 0.7% 6.5% 20.5 0.7% 6.5%
Germany 62.6% 0.9% 55.8 1.5% 68.0% 130.4 3.4% 68.0% India 59.0% -4.2% 6.5 0.5% 0.0% 6.5 0.5% 0.0%
Indonesia 30.1% -1.3% 6.7 1.3% 79.0% 12.5 2.5% 79.0% Italy 103.7% -2.7% 4.7 0.2% 0.0% 7.0 0.3% 0.0%
Japan 170.4% -3.1% 66.1 1.4% 30.0% 104.4 2.2% 30.0% Korea 27.2% 0.9% 13.7 1.4% 17.0% 26.1 2.7% 17.0% Mexico 20.3% 0.0% 11.4 1.0% 0.0% 11.4 1.0% 0.0% Russia 6.8% 6.2% 30.0 1.7% 100.0% 30.0 1.7% 100.0%
Saudi Arabia 17.7% 11.2% 17.6 3.3% 0.0% 49.6 9.4% 0.0% South Africa 29.9% 0.2% 4.0 1.3% 0.0% 7.9 2.6% 0.0%
Spain 38.5% -2.4% 18.2 1.1% 36.7% 75.3 4.5% 36.7% Turkey 37.1% -1.5% 0.0 0.0% N/A 0.0 0.0% N/A
UK 47.2% -4.8% 37.9 1.4% 73.0% 40.8 1.5% 73.0% US 60.8% -3.2% 268.0 1.9% 44.0% 841.2 5.9% 34.8%
5
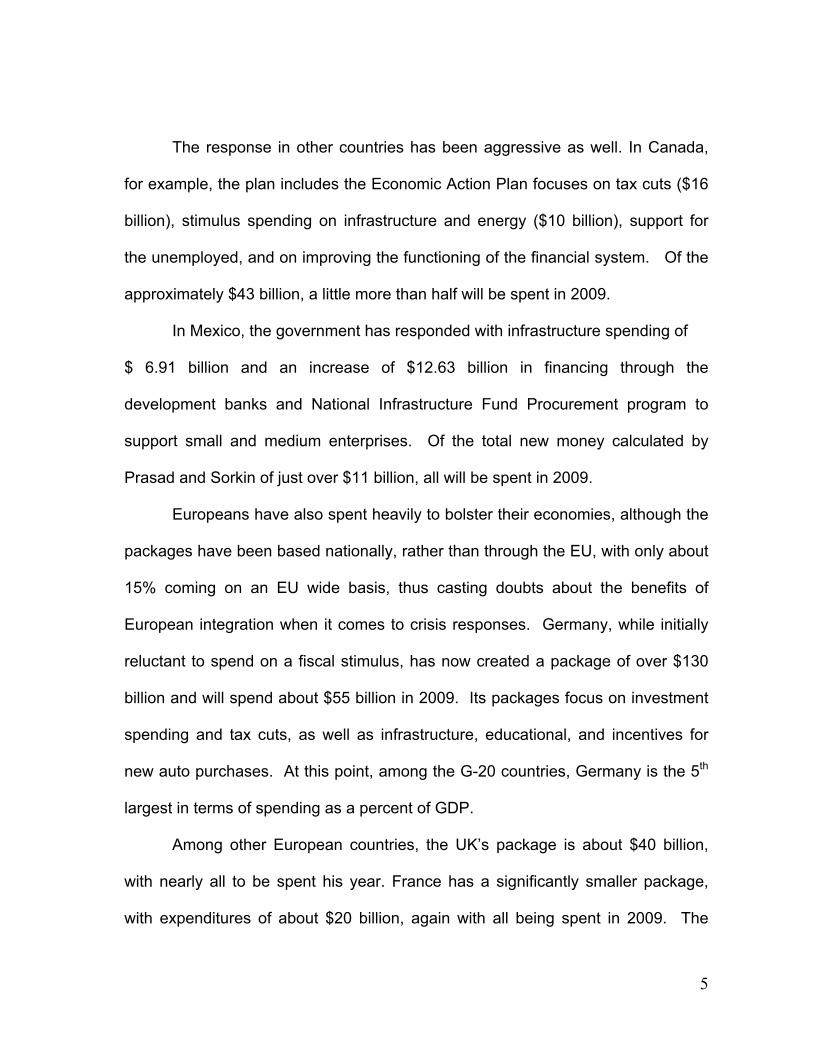
The response in other countries has been aggressive as well. In Canada,
for example, the plan includes the Economic Action Plan focuses on tax cuts ($16
billion), stimulus spending on infrastructure and energy ($10 billion), support for
the unemployed, and on improving the functioning of the financial system. Of the
approximately $43 billion, a little more than half will be spent in 2009.
In Mexico, the government has responded with infrastructure spending of
$ 6.91 billion and an increase of $12.63 billion in financing through the
development banks and National Infrastructure Fund Procurement program to
support small and medium enterprises. Of the total new money calculated by
Prasad and Sorkin of just over $11 billion, all will be spent in 2009.
Europeans have also spent heavily to bolster their economies, although the
packages have been based nationally, rather than through the EU, with only about
15% coming on an EU wide basis, thus casting doubts about the benefits of
European integration when it comes to crisis responses. Germany, while initially
reluctant to spend on a fiscal stimulus, has now created a package of over $130
billion and will spend about $55 billion in 2009. Its packages focus on investment
spending and tax cuts, as well as infrastructure, educational, and incentives for
new auto purchases. At this point, among the G-20 countries, Germany is the 5th
largest in terms of spending as a percent of GDP.
Among other European countries, the UK’s package is about $40 billion,
with nearly all to be spent his year. France has a significantly smaller package,
with expenditures of about $20 billion, again with all being spent in 2009. The
6
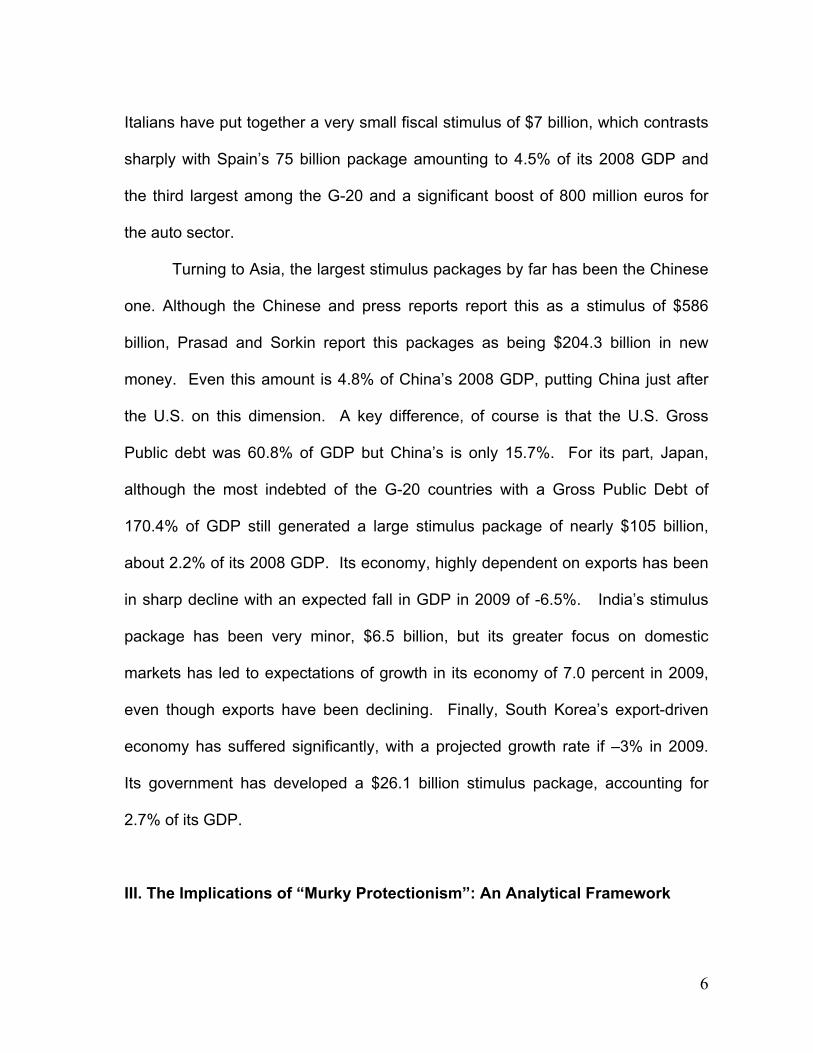
Italians have put together a very small fiscal stimulus of $7 billion, which contrasts
sharply with Spain’s 75 billion package amounting to 4.5% of its 2008 GDP and
the third largest among the G-20 and a significant boost of 800 million euros for
the auto sector.
Turning to Asia, the largest stimulus packages by far has been the Chinese
one. Although the Chinese and press reports report this as a stimulus of $586
billion, Prasad and Sorkin report this packages as being $204.3 billion in new
money. Even this amount is 4.8% of China’s 2008 GDP, putting China just after
the U.S. on this dimension. A key difference, of course is that the U.S. Gross
Public debt was 60.8% of GDP but China’s is only 15.7%. For its part, Japan,
although the most indebted of the G-20 countries with a Gross Public Debt of
170.4% of GDP still generated a large stimulus package of nearly $105 billion,
about 2.2% of its 2008 GDP. Its economy, highly dependent on exports has been
in sharp decline with an expected fall in GDP in 2009 of -6.5%. India’s stimulus
package has been very minor, $6.5 billion, but its greater focus on domestic
markets has led to expectations of growth in its economy of 7.0 percent in 2009,
even though exports have been declining. Finally, South Korea’s export-driven
economy has suffered significantly, with a projected growth rate if –3% in 2009.
Its government has developed a $26.1 billion stimulus package, accounting for
2.7% of its GDP.
III. The Implications of “Murky Protectionism”: An Analytical Framework
7
To this point, my focus has been on fiscal stimulus packages. But an important
and potentially hazardous development is the move toward various forms of
protectionism in the context of fiscal stimulus. As monetary policy has reached its
limits with interest cuts to nearly 0%, and fiscal stimulus programs are increased
feared to be inflationary, there has been growing interest in various forms of trade
policy as an instrument of government policy, often in the context of fiscal
packages.
The newly developed website, Global Trade Alert, coordinated by the
Centre for Economic Policy Research and funded by foundations, governments,
and the World Bank, provides a listing of measures that have been implemented
or are being contemplated by governments. This effort to shed light on the actions
of states may deter some of the most egregious forms of discriminatory
intervention. Examples of theirs still incomplete reports (the website only began
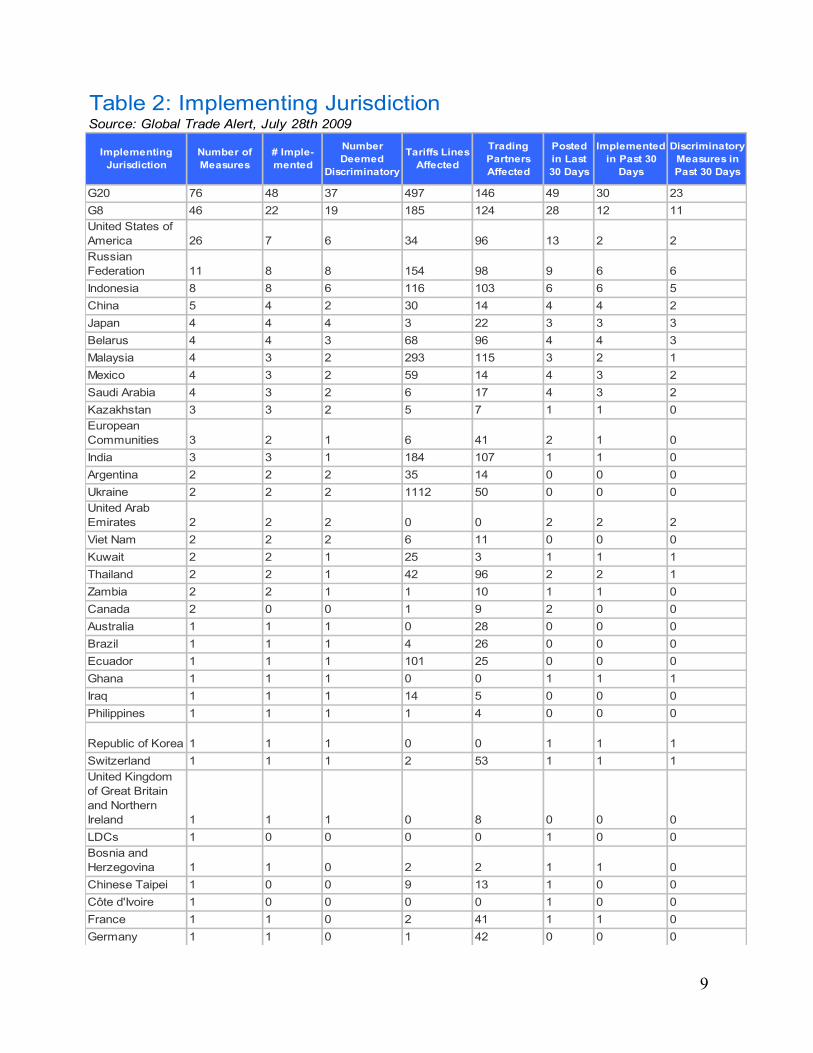
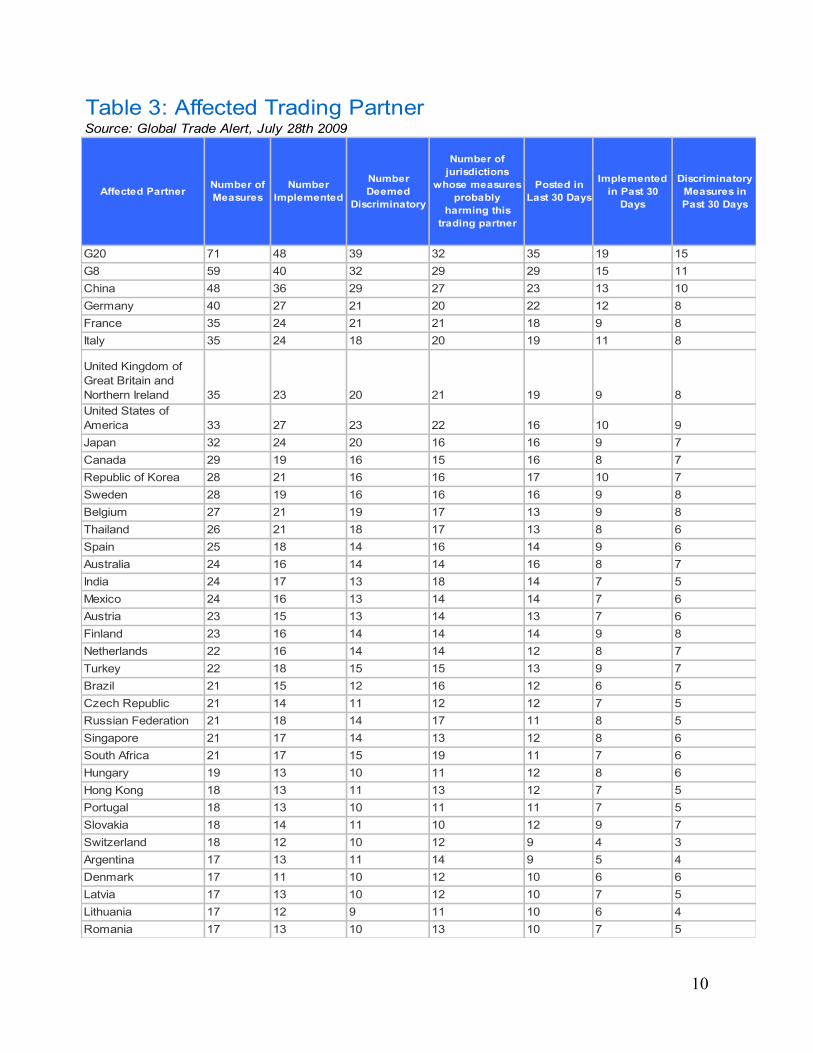
operating in early June 2009) can be found in Tables 2, 3, and 4.
Tables 2, 3, and 4 here
These tables provides examples of the type of data that has been gathered
through an “open source” effort, with individuals and governments being able to
report measures taken by others anonymously, although vetted by the Global
Trade Alert staff for accuracy. Table 2 illustrates the countries (jurisdictions)
implementing trade measures, Table 3 the countries being affected by the actions
of the countries in Table 2 that are undertaking these measures, and Table 4 the
types of measures that are being taken.
8
At first glance, in Table 2 the country taking the most trade affecting
measures (though not the most discriminatory ones) is the United States. But if
9
Table 2: Implementing JurisdictionSource: Global Trade Alert, July 28th 2009
Implementing Jurisdiction
Number of Measures
# Imple-mented
Number Deemed
Discriminatory
Tariffs Lines Affected
Trading Partners Affected
Posted in Last 30 Days
Implemented in Past 30
Days
Discriminatory Measures in Past 30 Days
G20 76 48 37 497 146 49 30 23G8 46 22 19 185 124 28 12 11United States of America 26 7 6 34 96 13 2 2Russian Federation 11 8 8 154 98 9 6 6Indonesia 8 8 6 116 103 6 6 5China 5 4 2 30 14 4 4 2Japan 4 4 4 3 22 3 3 3Belarus 4 4 3 68 96 4 4 3Malaysia 4 3 2 293 115 3 2 1Mexico 4 3 2 59 14 4 3 2Saudi Arabia 4 3 2 6 17 4 3 2Kazakhstan 3 3 2 5 7 1 1 0European Communities 3 2 1 6 41 2 1 0India 3 3 1 184 107 1 1 0Argentina 2 2 2 35 14 0 0 0Ukraine 2 2 2 1112 50 0 0 0United Arab Emirates 2 2 2 0 0 2 2 2Viet Nam 2 2 2 6 11 0 0 0Kuwait 2 2 1 25 3 1 1 1Thailand 2 2 1 42 96 2 2 1Zambia 2 2 1 1 10 1 1 0Canada 2 0 0 1 9 2 0 0Australia 1 1 1 0 28 0 0 0Brazil 1 1 1 4 26 0 0 0Ecuador 1 1 1 101 25 0 0 0Ghana 1 1 1 0 0 1 1 1Iraq 1 1 1 14 5 0 0 0Philippines 1 1 1 1 4 0 0 0
Republic of Korea 1 1 1 0 0 1 1 1Switzerland 1 1 1 2 53 1 1 1United Kingdom of Great Britain and Northern Ireland 1 1 1 0 8 0 0 0LDCs 1 0 0 0 0 1 0 0Bosnia and Herzegovina 1 1 0 2 2 1 1 0Chinese Taipei 1 0 0 9 13 1 0 0Côte d'Ivoire 1 0 0 0 0 1 0 0France 1 1 0 2 41 1 1 0Germany 1 1 0 1 42 0 0 0
10
Table 3: Affected Trading PartnerSource: Global Trade Alert, July 28th 2009
Affected Partner Number of Measures
Number Implemented
Number Deemed
Discriminatory
Number of jurisdictions
whose measures probably
harming this trading partner
Posted in Last 30 Days
Implemented in Past 30
Days
Discriminatory Measures in Past 30 Days
G20 71 48 39 32 35 19 15G8 59 40 32 29 29 15 11China 48 36 29 27 23 13 10Germany 40 27 21 20 22 12 8France 35 24 21 21 18 9 8Italy 35 24 18 20 19 11 8
United Kingdom of Great Britain and Northern Ireland 35 23 20 21 19 9 8United States of America 33 27 23 22 16 10 9Japan 32 24 20 16 16 9 7Canada 29 19 16 15 16 8 7Republic of Korea 28 21 16 16 17 10 7Sweden 28 19 16 16 16 9 8Belgium 27 21 19 17 13 9 8Thailand 26 21 18 17 13 8 6Spain 25 18 14 16 14 9 6Australia 24 16 14 14 16 8 7India 24 17 13 18 14 7 5Mexico 24 16 13 14 14 7 6Austria 23 15 13 14 13 7 6Finland 23 16 14 14 14 9 8Netherlands 22 16 14 14 12 8 7Turkey 22 18 15 15 13 9 7Brazil 21 15 12 16 12 6 5Czech Republic 21 14 11 12 12 7 5Russian Federation 21 18 14 17 11 8 5Singapore 21 17 14 13 12 8 6South Africa 21 17 15 19 11 7 6Hungary 19 13 10 11 12 8 6Hong Kong 18 13 11 13 12 7 5Portugal 18 13 10 11 11 7 5Slovakia 18 14 11 10 12 9 7Switzerland 18 12 10 12 9 4 3Argentina 17 13 11 14 9 5 4Denmark 17 11 10 12 10 6 6Latvia 17 13 10 12 10 7 5Lithuania 17 12 9 11 10 6 4Romania 17 13 10 13 10 7 5
11
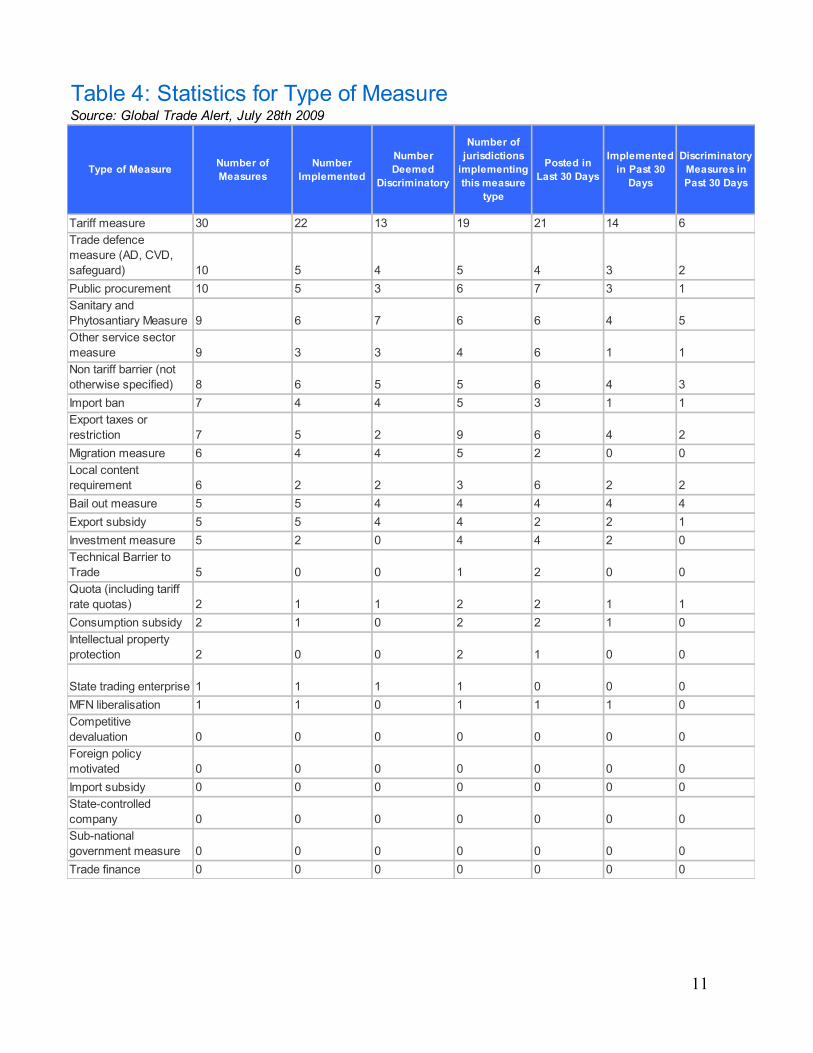
Table 4: Statistics for Type of MeasureSource: Global Trade Alert, July 28th 2009
Type of Measure Number of Measures
Number Implemented
Number Deemed
Discriminatory
Number of jurisdictions
implementing this measure
type
Posted in Last 30 Days
Implemented in Past 30
Days
Discriminatory Measures in Past 30 Days
Tariff measure 30 22 13 19 21 14 6Trade defence measure (AD, CVD, safeguard) 10 5 4 5 4 3 2Public procurement 10 5 3 6 7 3 1Sanitary and Phytosantiary Measure 9 6 7 6 6 4 5Other service sector measure 9 3 3 4 6 1 1Non tariff barrier (not otherwise specified) 8 6 5 5 6 4 3Import ban 7 4 4 5 3 1 1Export taxes or restriction 7 5 2 9 6 4 2Migration measure 6 4 4 5 2 0 0Local content requirement 6 2 2 3 6 2 2Bail out measure 5 5 4 4 4 4 4Export subsidy 5 5 4 4 2 2 1Investment measure 5 2 0 4 4 2 0Technical Barrier to Trade 5 0 0 1 2 0 0Quota (including tariff rate quotas) 2 1 1 2 2 1 1Consumption subsidy 2 1 0 2 2 1 0Intellectual property protection 2 0 0 2 1 0 0
State trading enterprise 1 1 1 1 0 0 0MFN liberalisation 1 1 0 1 1 1 0Competitive devaluation 0 0 0 0 0 0 0Foreign policy motivated 0 0 0 0 0 0 0Import subsidy 0 0 0 0 0 0 0State-controlled company 0 0 0 0 0 0 0Sub-national government measure 0 0 0 0 0 0 0Trade finance 0 0 0 0 0 0 0
12
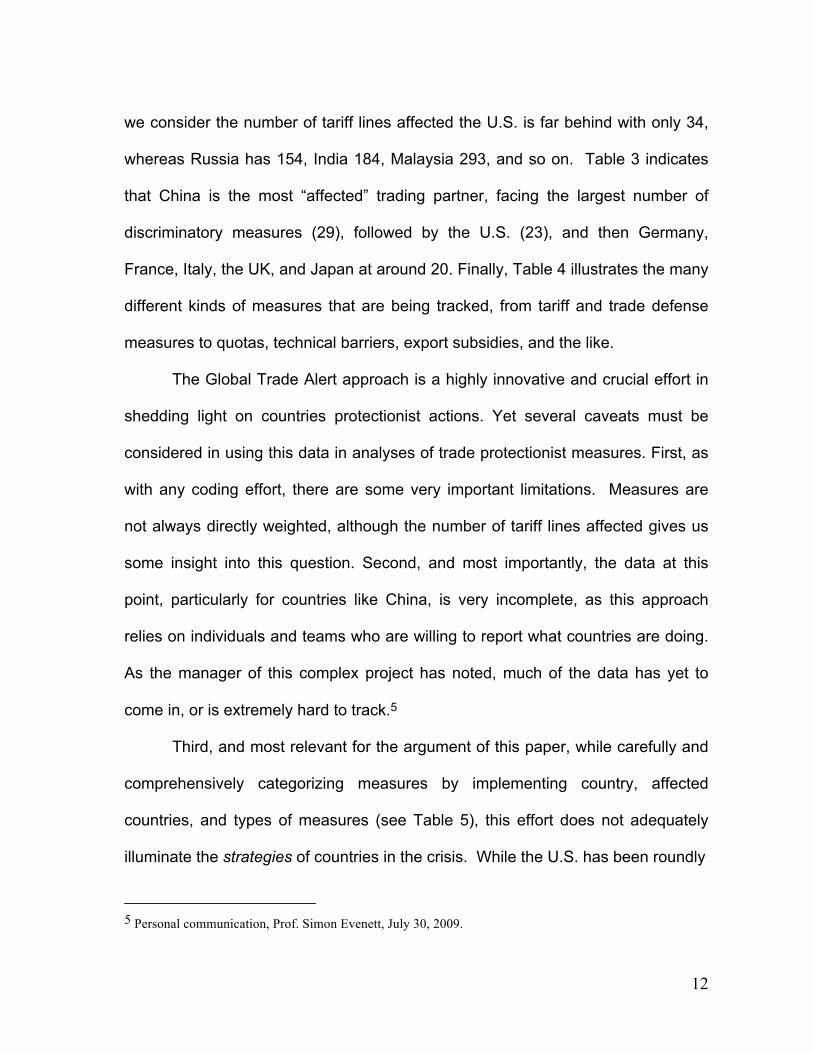
we consider the number of tariff lines affected the U.S. is far behind with only 34,
whereas Russia has 154, India 184, Malaysia 293, and so on. Table 3 indicates
that China is the most “affected” trading partner, facing the largest number of
discriminatory measures (29), followed by the U.S. (23), and then Germany,
France, Italy, the UK, and Japan at around 20. Finally, Table 4 illustrates the many
different kinds of measures that are being tracked, from tariff and trade defense
measures to quotas, technical barriers, export subsidies, and the like.
The Global Trade Alert approach is a highly innovative and crucial effort in
shedding light on countries protectionist actions. Yet several caveats must be
considered in using this data in analyses of trade protectionist measures. First, as
with any coding effort, there are some very important limitations. Measures are
not always directly weighted, although the number of tariff lines affected gives us
some insight into this question. Second, and most importantly, the data at this
point, particularly for countries like China, is very incomplete, as this approach
relies on individuals and teams who are willing to report what countries are doing.
As the manager of this complex project has noted, much of the data has yet to
come in, or is extremely hard to track.5
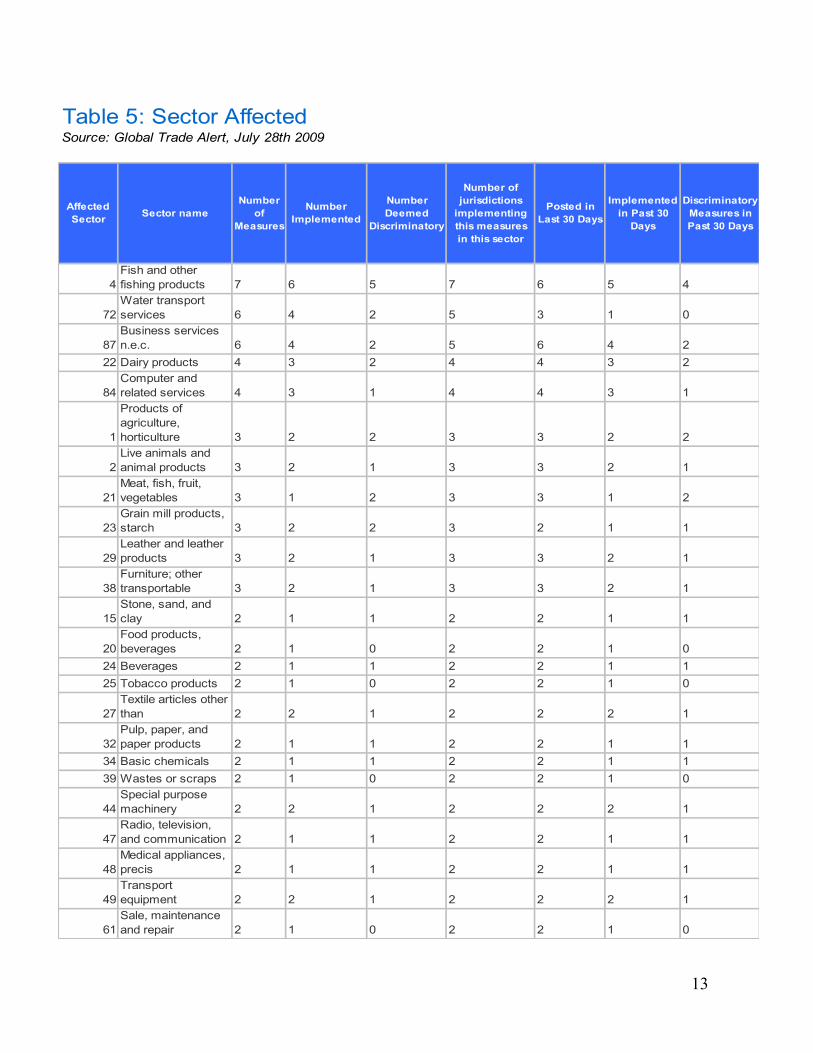
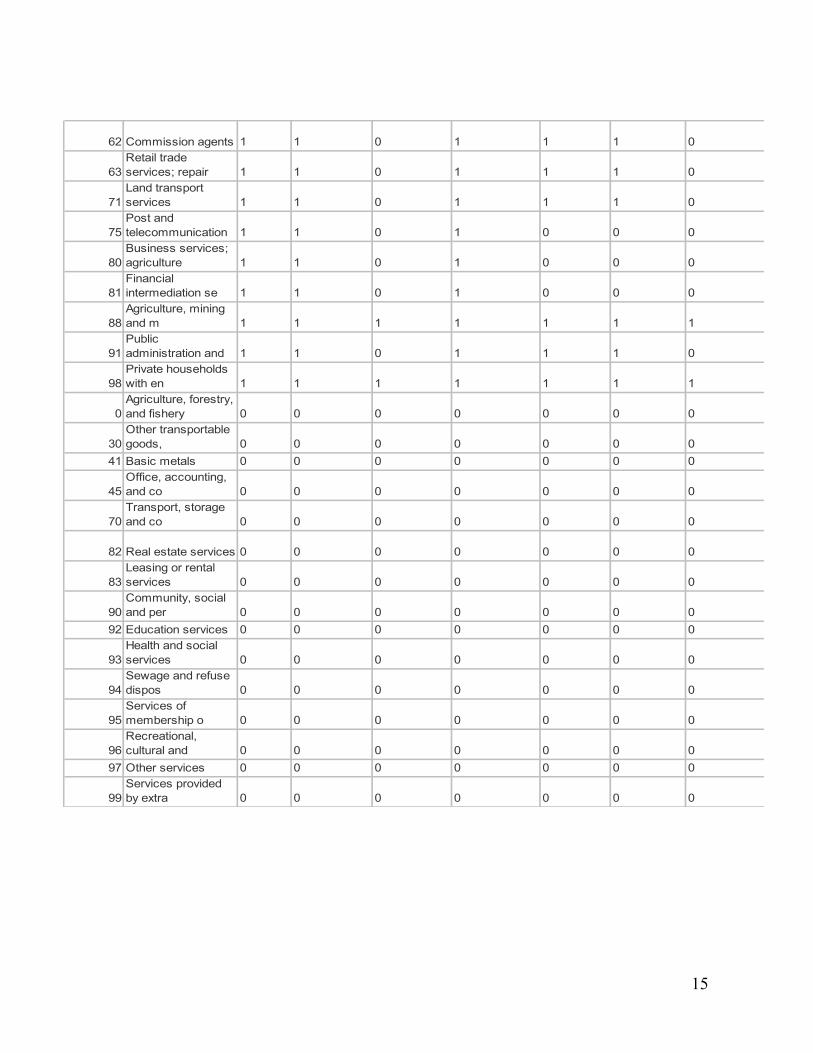
Third, and most relevant for the argument of this paper, while carefully and
comprehensively categorizing measures by implementing country, affected
countries, and types of measures (see Table 5), this effort does not adequately
illuminate the strategies of countries in the crisis. While the U.S. has been roundly
5 Personal communication, Prof. Simon Evenett, July 30, 2009.
13
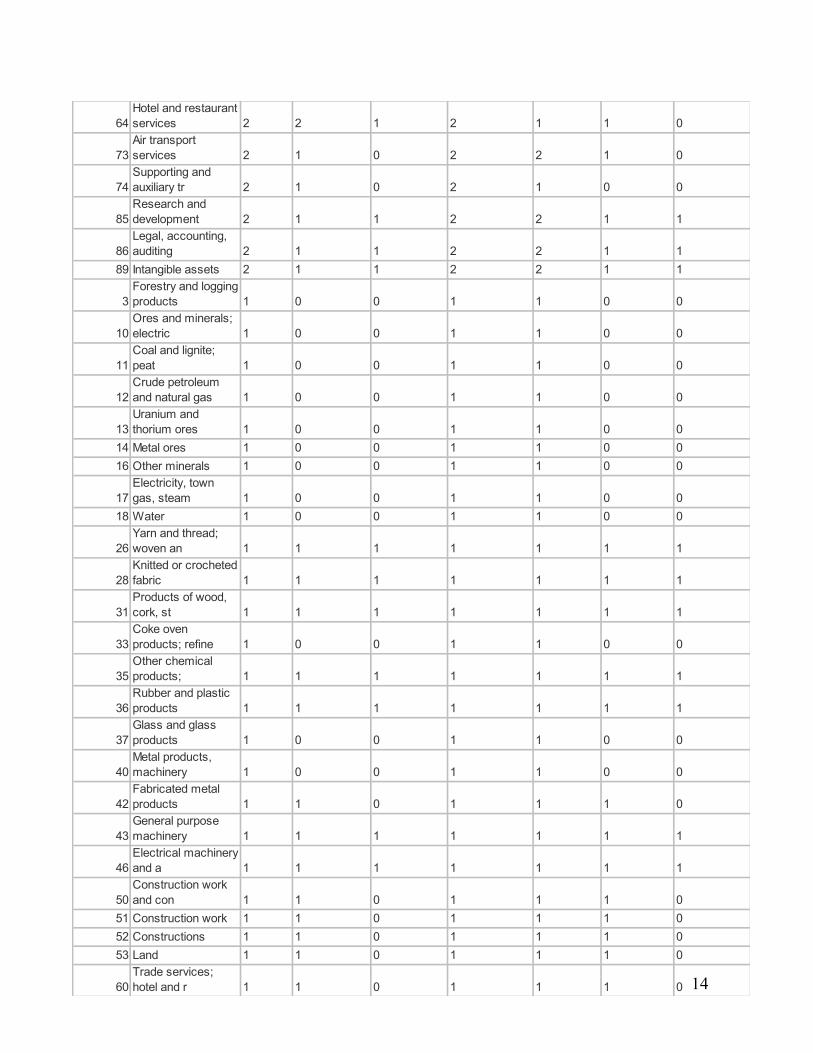
Table 5: Sector AffectedSource: Global Trade Alert, July 28th 2009
Affected Sector Sector name
Number of
Measures
Number Implemented
Number Deemed
Discriminatory
Number of jurisdictions
implementing this measures in this sector
Posted in Last 30 Days
Implemented in Past 30
Days
Discriminatory Measures in Past 30 Days
4Fish and other fishing products 7 6 5 7 6 5 4
72Water transport services 6 4 2 5 3 1 0
87Business services n.e.c. 6 4 2 5 6 4 2
22 Dairy products 4 3 2 4 4 3 2
84Computer and related services 4 3 1 4 4 3 1
1
Products of agriculture, horticulture 3 2 2 3 3 2 2
2Live animals and animal products 3 2 1 3 3 2 1
21Meat, fish, fruit, vegetables 3 1 2 3 3 1 2
23Grain mill products, starch 3 2 2 3 2 1 1
29Leather and leather products 3 2 1 3 3 2 1
38Furniture; other transportable 3 2 1 3 3 2 1
15Stone, sand, and clay 2 1 1 2 2 1 1
20Food products, beverages 2 1 0 2 2 1 0
24 Beverages 2 1 1 2 2 1 125 Tobacco products 2 1 0 2 2 1 0
27Textile articles other than 2 2 1 2 2 2 1
32Pulp, paper, and paper products 2 1 1 2 2 1 1
34 Basic chemicals 2 1 1 2 2 1 139 Wastes or scraps 2 1 0 2 2 1 0
44Special purpose machinery 2 2 1 2 2 2 1
47Radio, television, and communication 2 1 1 2 2 1 1
48Medical appliances, precis 2 1 1 2 2 1 1
49Transport equipment 2 2 1 2 2 2 1
61Sale, maintenance and repair 2 1 0 2 2 1 0
14
64Hotel and restaurant services 2 2 1 2 1 1 0
73Air transport services 2 1 0 2 2 1 0
74Supporting and auxiliary tr 2 1 0 2 1 0 0
85Research and development 2 1 1 2 2 1 1
86Legal, accounting, auditing 2 1 1 2 2 1 1
89 Intangible assets 2 1 1 2 2 1 1
3Forestry and logging products 1 0 0 1 1 0 0
10Ores and minerals; electric 1 0 0 1 1 0 0
11Coal and lignite; peat 1 0 0 1 1 0 0
12Crude petroleum and natural gas 1 0 0 1 1 0 0
13Uranium and thorium ores 1 0 0 1 1 0 0
14 Metal ores 1 0 0 1 1 0 016 Other minerals 1 0 0 1 1 0 0
17Electricity, town gas, steam 1 0 0 1 1 0 0
18 Water 1 0 0 1 1 0 0
26Yarn and thread; woven an 1 1 1 1 1 1 1
28Knitted or crocheted fabric 1 1 1 1 1 1 1
31Products of wood, cork, st 1 1 1 1 1 1 1
33Coke oven products; refine 1 0 0 1 1 0 0
35Other chemical products; 1 1 1 1 1 1 1
36Rubber and plastic products 1 1 1 1 1 1 1
37Glass and glass products 1 0 0 1 1 0 0
40Metal products, machinery 1 0 0 1 1 0 0
42Fabricated metal products 1 1 0 1 1 1 0
43General purpose machinery 1 1 1 1 1 1 1
46Electrical machinery and a 1 1 1 1 1 1 1
50Construction work and con 1 1 0 1 1 1 0
51 Construction work 1 1 0 1 1 1 052 Constructions 1 1 0 1 1 1 053 Land 1 1 0 1 1 1 0
60Trade services; hotel and r 1 1 0 1 1 1 0
15
62 Commission agents 1 1 0 1 1 1 0
63Retail trade services; repair 1 1 0 1 1 1 0
71Land transport services 1 1 0 1 1 1 0
75Post and telecommunication 1 1 0 1 0 0 0
80Business services; agriculture 1 1 0 1 0 0 0
81Financial intermediation se 1 1 0 1 0 0 0
88Agriculture, mining and m 1 1 1 1 1 1 1
91Public administration and 1 1 0 1 1 1 0
98Private households with en 1 1 1 1 1 1 1
0Agriculture, forestry, and fishery 0 0 0 0 0 0 0
30Other transportable goods, 0 0 0 0 0 0 0
41 Basic metals 0 0 0 0 0 0 0
45Office, accounting, and co 0 0 0 0 0 0 0
70Transport, storage and co 0 0 0 0 0 0 0
82 Real estate services 0 0 0 0 0 0 0
83Leasing or rental services 0 0 0 0 0 0 0
90Community, social and per 0 0 0 0 0 0 0
92 Education services 0 0 0 0 0 0 0
93Health and social services 0 0 0 0 0 0 0
94Sewage and refuse dispos 0 0 0 0 0 0 0
95Services of membership o 0 0 0 0 0 0 0
96Recreational, cultural and 0 0 0 0 0 0 0
97 Other services 0 0 0 0 0 0 0
99Services provided by extra 0 0 0 0 0 0 0
16
criticized for “Buy American” provisions in its stimulus packages, generally with
good reason, some countries are using the financial crisis and widespread
government efforts to manage it as an opportunity to bolster not only failing
industries, but also to systematically pursue an industrial policy that is state-led
and harmful to fair competition.
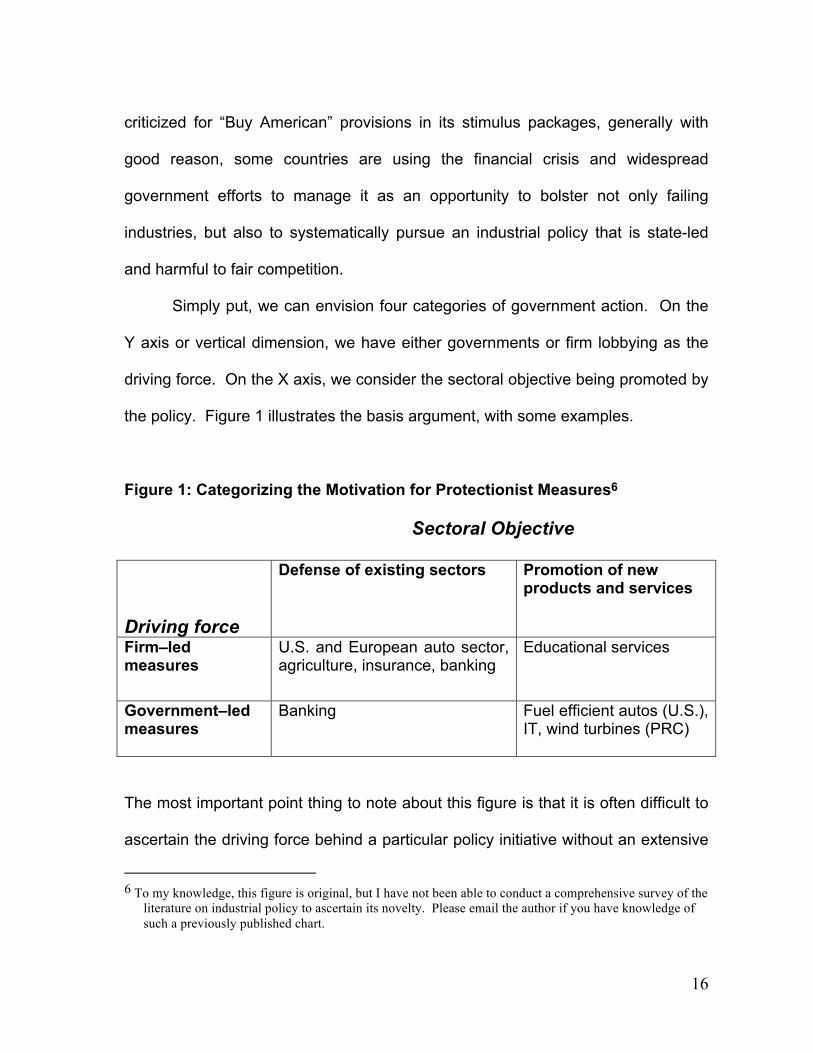
Simply put, we can envision four categories of government action. On the
Y axis or vertical dimension, we have either governments or firm lobbying as the
driving force. On the X axis, we consider the sectoral objective being promoted by
the policy. Figure 1 illustrates the basis argument, with some examples.
Figure 1: Categorizing the Motivation for Protectionist Measures6
Sectoral Objective
Driving force
Defense of existing sectors Promotion of new products and services
Firm–led measures
U.S. and European auto sector, agriculture, insurance, banking
Educational services
Government–led measures
Banking Fuel efficient autos (U.S.), IT, wind turbines (PRC)
The most important point thing to note about this figure is that it is often difficult to
ascertain the driving force behind a particular policy initiative without an extensive
6 To my knowledge, this figure is original, but I have not been able to conduct a comprehensive survey of the
literature on industrial policy to ascertain its novelty. Please email the author if you have knowledge of such a previously published chart.
17
case analysis of the action in question. Be that as it may, in at least some cases
the origins of a policy initiative is well known.
In some countries, relatively inefficient firms have been actively lobbying for
government action, with good examples being the General Motors and Chrysler in
the United States. These measures have protectionist elements, as helping failing
industries through financial aid obviously distorts competition. Such lobbying has
also been taking place among European firms as well.7 Also, in typical U.S.
fashion of defending old industries, firms receiving protection in the U.S. include
restraints against Chinese chicken imports and switchblades.
A second type of pressure is for firms that are innovating new products to
restrict competition as they attempt to develop their goods and services. One
significant example of this is the heavy lobbying by American and European firms
to institute unilateral tariffs on countries that have not agreed to cap-and-trade
controls in connection with the effort to limit greenhouse gases. Although their
concerns are understandable, without linking such measures to an international
agreement and efforts to help developing countries limit their emissions, this
approach is likely to stimulate widespread retaliation and conflict.
Governments have also taken their own initiatives, as in the widespread aid
U.S. and European aid to the financial sector. Although clearly lobbied by banks
and other financial enterprises, many of the measures undertaken by governments
have been developed and promoted by government officials themselves with an
7 See, for example, http://www.climatechangecorp.com/content.asp?ContentID=5967.
18
eye to mitigating the effects of banks failures on the real economy. The Chinese
have not given up on heavy export promotion, maintaining their traditional strategy.
As of July 2008, renminbi appreciation has been blocked through intervention,
exports are being heavily promoted with subsidies, raw materials prices have been
lowered through export tariffs,8 and a strong “Buy Chinese” effort has restricted
foreign purchases (despite promises to do so, China has yet to sign the WTO
government procurement accord, eight years after joining the WTO).
Finally, we have efforts to promote or help newly developing industries
through restrictive measures. Here, the measures being pursued by the Chinese
government have little to do with coping with the financial crisis and much to do
with state-led capitalism. Although most economists speak disparagingly of
industrial policy efforts, companies that actually have to deal with state-supported
competition as opposed to theoretical models are deeply concerned with unfair
competition. The Chinese have been shielding their clean energy sector from
competition to develop their own domestic firms, calling for 80% of equipment
used in solar panel manufacturing to be Chinese sourced, and banning wind
turbines with a capacity less than 1,000 kilowatts as a means to undermine the
competitive position of European exporters of the most popular 850 kilowatt
design.9 Chinese complaints about carbon tariffs in view of their own industrial
policy efforts ring hollow on this score.
8 New York Times, June 24, 2009. 9 See FT.com, in depth, May 28, 009.
19
IV. Conclusion The efforts by governments to resolve the financial crisis that has affected the
global economy is a welcome change from the feeble efforts of the 1930s that
failed to reverse the collapse of the world economy and should be commended.
We have seen signs of a growing recovery, as the many stimulus packages across
the world and loose monetary policy have encouraged greater consumption and
production. As many analysts have noted, “murky protectionism” that has been
clearly identified by analysts in the globaltradealert.org project can be very
hazardous for global recovery.
This paper has focused not only on a general overview of protectionist
measures, but also on attempting to analyze theoretically the motivating forces
behind the protectionist intervention we have seen. As I have argued, efforts to
give firms unfair competitive advantages that further undermine what was not a
very level playing field to begin with through the use of murky protectionist
measures should be roundly condemned.