USING AHP IN QFD THE IMPACT OF THE NEW ISO 16355 S · Using AHP in QFD – The Impact of the New...
14
ISAHP Article: Using AHP in QFD – To Be Submitted to the International Symposium of the Ana- lytic Hierarchy Process 2016, London, U.K. International Symposium on the Analytic Hierarchy Process 1 London, U.K. August 4 – August 7, 2016 USING AHP IN QFD – THE IMPACT OF THE NEW ISO 16355 STANDARD Thomas Fehlmann, QFD Architekt, Euro Project Office Glenn Mazur, QFD Red Belt ® and QFD Architekt, QFD Institute ABSTRACT Traditional Quality Function Deployment (QFD) uses weights – percentages of a total – to describe priorities for customer’s needs and technical solution approaches. Since AHP works with profiles – vectors of unit length one – it is possible to add, subtract and compare profiles, while weights yield wrong results when added, subtracted or compared. When using AHP for profiling customer’s needs for use with QFD, this is an incompatibility that might lead to failures. The new ISO standard 16335 introduces ratio scales and profiles in QFD. Moreover, the method proposed by Saaty to calculate priority profiles in AHP is also ap- plicable to modern QFD. The new ISO 16355 suggests ratio scales in QFD matrices instead of the traditional ordinal correlation strength indicators. AHP is used in many steps in QFD, but this paper will focus primarily on the House of Quality matrix. Keywords: AHP, QFD, Comprehensive QFD, Six Sigma, Eigenvectors, Linear Algebra, ISO 16355. 1. Introduction Quality function deployment (QFD) originated in Japan in the 1960s as an extension of statistical process control (SPC) and total quality management (TQM) applied to new prod- uct development to improve quality and thus customer satisfaction. At that time, Japan was quickly improving its manufacturing capabilities after the devastation of World War II, saw their next step as improving the basic designs prior to the manufacturing phase. This became more urgent with the onset of the oil crisis in the early 1970s when Japan’s smaller, more fuel efficient automobiles became globally popular but were equally panned for their poor quality and performance. QFD was conceived to create a network of quality assurance activities that spanned the total organization – from marketing to engineering to manufac- turing and production to suppliers. The purpose of this network was to create a common focus based on what was most important to customers, and then align these organizational functions by translating customer importance into engineering, manufacturing, production, and supplier importance. These translations were initially done using cause-and-effect diagrams (aka fishbone dia- grams due to their skeletal appearance) with the effect representing the customer need and the causal factors representing design and build quality requirements strongly related to achieving those needs to be met. While cause-and-effect diagrams were a powerful TQM tool for problem solving to identify the causes of undesirable effects (negative quality), Bridgestone Tire's Kiyotaka Oshiumi (Oshiumi, 1966) was first to repurpose them for iden- tifying the causes of desirable effects (positive quality demanded by customers). For ex- ample, a problem solving diagram could identify the causes of undesirable vibration, while
-
Upload
phungduong -
Category
Documents
-
view
219 -
download
0
Transcript of USING AHP IN QFD THE IMPACT OF THE NEW ISO 16355 S · Using AHP in QFD – The Impact of the New...

ISAHP Article: Using AHP in QFD – To Be Submitted to the International Symposium of the Ana-
lytic Hierarchy Process 2016, London, U.K.
International Symposium on the
Analytic Hierarchy Process
1 London, U.K.
August 4 – August 7, 2016
USING AHP IN QFD – THE IMPACT OF THE NEW ISO 16355 STANDARD
Thomas Fehlmann, QFD Architekt, Euro Project Office
Glenn Mazur, QFD Red Belt® and QFD Architekt, QFD Institute
ABSTRACT
Traditional Quality Function Deployment (QFD) uses weights – percentages of a total – to
describe priorities for customer’s needs and technical solution approaches. Since AHP
works with profiles – vectors of unit length one – it is possible to add, subtract and compare
profiles, while weights yield wrong results when added, subtracted or compared. When
using AHP for profiling customer’s needs for use with QFD, this is an incompatibility that
might lead to failures. The new ISO standard 16335 introduces ratio scales and profiles in
QFD.
Moreover, the method proposed by Saaty to calculate priority profiles in AHP is also ap-
plicable to modern QFD. The new ISO 16355 suggests ratio scales in QFD matrices instead
of the traditional ordinal correlation strength indicators. AHP is used in many steps in QFD,
but this paper will focus primarily on the House of Quality matrix.
Keywords: AHP, QFD, Comprehensive QFD, Six Sigma, Eigenvectors, Linear Algebra,
ISO 16355.
1. Introduction
Quality function deployment (QFD) originated in Japan in the 1960s as an extension of
statistical process control (SPC) and total quality management (TQM) applied to new prod-
uct development to improve quality and thus customer satisfaction. At that time, Japan was
quickly improving its manufacturing capabilities after the devastation of World War II,
saw their next step as improving the basic designs prior to the manufacturing phase. This
became more urgent with the onset of the oil crisis in the early 1970s when Japan’s smaller,
more fuel efficient automobiles became globally popular but were equally panned for their
poor quality and performance. QFD was conceived to create a network of quality assurance
activities that spanned the total organization – from marketing to engineering to manufac-
turing and production to suppliers. The purpose of this network was to create a common
focus based on what was most important to customers, and then align these organizational
functions by translating customer importance into engineering, manufacturing, production,
and supplier importance.
These translations were initially done using cause-and-effect diagrams (aka fishbone dia-
grams due to their skeletal appearance) with the effect representing the customer need and
the causal factors representing design and build quality requirements strongly related to
achieving those needs to be met. While cause-and-effect diagrams were a powerful TQM
tool for problem solving to identify the causes of undesirable effects (negative quality),
Bridgestone Tire's Kiyotaka Oshiumi (Oshiumi, 1966) was first to repurpose them for iden-
tifying the causes of desirable effects (positive quality demanded by customers). For ex-
ample, a problem solving diagram could identify the causes of undesirable vibration, while

Using AHP in QFD – The Impact of the New ISO 16355 Standard
International Symposium on the
Analytic Hierarchy Process
2 London, U.K.
August 4 – August 7, 2016
a QFD diagram could identify the causes of a smooth feeling ride as shown in Figure 1.
Since each diagram was composed of a single effect and multiple causal factors, each cus-
tomer need required its own diagram. Causal factors commonly related to more than one
need.
Figure 1. Cause-and-effect diagram for tire design (Mizuno & Akao, 1994)
By 1972, QFD was being applied to more complex products such as oil tankers, which had
hundreds of customer needs and quality requirements. Hundreds of cause-and-effect dia-
grams with shared causal factors became unmanageable and were soon organized into a
two-dimensional matrix, not necessarily square, with the effects on one axis and the causal
factors on the other. The intersections of the rows and columns were used to indicate if a
relationship existed and later to quantify the strength of the relationship (Suzuki, 1972).
The most well-known matrix was later dubbed the House of Quality due to the various
"rooms" added to benchmark competitive alternatives and specifications.
Figure 2. First example of QFD matrix (Suzuki, 1972)
Within each matrix, the relationship strength was used to transform both the information
and the priorities from the input axis to the output axis. The relationship strengths were
weighted by the row priorities and then summed for column to create column priorities.
Since the abacus was common used to calculate sums in 1960s Japan, relationship strengths
were often expressed as ordinal scale integers, since absolute scales with ratio values would
be difficult to calculated. Further, since some columns had positive relationships (ex. noise
and insulation) and other columns had negative relationships (ex. weight and fuel con-

Using AHP in QFD – The Impact of the New ISO 16355 Standard
International Symposium on the
Analytic Hierarchy Process
3 London, U.K.
August 4 – August 7, 2016
sumption), the sum of columns with many positive and negative numbers risked them can-
celing each other out, rather than signifying areas demanding further research. The use of
absolute values was used subsequently.
The matrices were then linked together such that the output of one matrix became the input
of the next level of design detail, from system level design to components to production
and assembly. By the mid-1980s, additional matrices related to technology and innovation,
target costing, and reliability helped QFD evolve into a more comprehensive approach
strengthening other phases of product development as shown in Figure 3. These matrices
were called "deployments" indicating the importance of advanced planning and accurate
information.
Figure 3. Comprehensive QFD including quality, technology, cost, and reliability
deployments (Akao, 1990)
2. Background of AHP within QFD
As stated above, transformation of relationships within QFD matrices was problematic.
The analytic hierarchy process (AHP) was considered for a solution by Nakui (Nakui,
1987). Subsequently, AHP is now more fully integrated into QFD as a preferred method
for solving the subjective decision problems involving prioritizing the voice of the cus-
tomer and transferring it into the voice of engineering, manufacturing (or more generally,
building), production (or more generally, implementation), and supplier quality.
Saaty (Saaty, 2003) discovered the advantages of using Eigenvectors for solving decision
problems using the AHP. Fehlmann (Fehlmann, 2003) noticed that QFD matrices should
also use ratio scale, thus enabling the power of linear algebra to find optimum technical
solutions. Together with Kranich (Fehlmann & Kranich, 2016 - to appear), a mathematical
method was developed to compute technical solution profiles with Eigenvectors similar to

Using AHP in QFD – The Impact of the New ISO 16355 Standard
International Symposium on the
Analytic Hierarchy Process
4 London, U.K.
August 4 – August 7, 2016
Saaty. AHP is the method of choice for prioritizing customer’s needs’ as the goal profile,
where customers are not at hand for more direct methods such as the Gemba (Johnson &
Mazur, 2008). This is important for instance in product design and improvement.
3. Objectives
This paper compares traditional approaches with the new standards set by ISO 16335 (ISO
16355-1:2015, 2015) and investigates typical combinations of AHP with QFD. It demon-
strates how the traditional methods can become misleading and explains the insights gained
by the Eigenvector theory. These insights become more critical in today’s product devel-
opment environment where limited resources constrain the efforts of organizations to ad-
dress only the most critical customer needs. A sound mathematical approach to separating
the critical few from the trivial many is desired.
Further, when transferring priority from customer needs to functional requirements, it is
useful to have values that are on an absolute scale where numbers are in ratio to each other,
as these fully support the mathematical functions of addition, subtraction, multiplication,
and division.
4. Methodology
First, the difference between weights and profiles must be clarified. Weights are percent-
ages of 100%; they sum up to 100%. Profiles are vectors whose Euclidian length is one.
Let 𝒚 = ⟨𝑦1, … , 𝑦𝑚⟩ be a vector of dimension 𝑚. The Euclidian norm for vectors is:
‖𝒚‖ = √∑ 𝑦𝑗2
𝑚
𝑗=1
(1)
A vector becomes a profile by dividing components through its length:
𝒚′ =𝒚
‖𝒚‖= ⟨
𝑦1
‖𝒚‖, … ,
𝑦𝑚
‖𝒚‖⟩ (2)
Normalized profiles can be added, subtracted and compared as any other vector. Result
vectors become profiles again be normalization. Profiles allow for statistical methods.
QFD problems of the form 𝒚 = 𝑨𝒙, where 𝒚 is the goal profile and 𝒙 the product require-
ments can be solved by looking at the matrix product 𝑨𝑨⊺ where 𝑨⊺ is the transpose of 𝑨.
Thus, if 𝑨𝑨⊺ has a principal eigenvector 𝝉𝒚, a consistent solution 𝒙 is found by
𝑨𝑨⊺𝝉𝒚 = 𝝉𝒚 ⟹ 𝒙 = 𝑨⊺𝝉𝒚 (3)
under condition that the Convergence Gap ‖𝒚 − 𝝉𝒚‖ becomes small enough. This statisti-
cal test prevents against bad mathematics (Mazur, 2014) as observed in certain traditional
QFD practices, especially in priority comparisons and combinations.

Using AHP in QFD – The Impact of the New ISO 16355 Standard
International Symposium on the
Analytic Hierarchy Process
5 London, U.K.
August 4 – August 7, 2016
5. Applications of AHP in the House of Quality
5.1 House of Quality
Although no longer essential in the modern QFD process, the House of Quality is a pow-
erful approach to transferring priorities and information from customer needs into func-
tional requirements (Akao, 1990). As shown in the upper left corner of Figure 3, it is the
gateway to product information flow-down from specifications to innovation to cost, reli-
ability, and finally to build and commercialization activities. In other words, priorities cal-
culated in the House of Quality are transferred into priorities in all the later phases of design
and development. Thus, the accuracy of these later priorities rely on the accuracy of the
initial inputs – customer needs priorities. Strong mathematical models developed with AHP
produce priorities that are in ratio scale and are more accurate than the ordinal scale prior-
ities used in early QFD studies.
The multicriteria decision making model (MCDM) of AHP can be adapted for the House
of Quality. The MCDM is used to synthesize a set of prioritized criteria into a set of prior-
itized alternatives to achieve those criteria. In the House of Quality, the criteria are cus-
tomer needs and the alternatives are the functional requirements. Other matrices in Figure
1 follow a pattern of using the alternatives of one matrix as criteria for the next in sequence,
while introducing other information sets as new alternatives.
5.2 Using AHP to prioritize customer needs
Customer needs represent the judgment criteria that customers use to determine if a new
product will be more satisfying than their current product or a product from an alternative
provider.
Key to a successful product development process is the focus and alignment of scarce pro-
ject resources (time, people, money) on what matters most to customers, since satisfying
those needs is what drives customer value, and hence sales turnover and profit. Using the
scarce resources to solve the most important cus-
tomer needs is often preferred to solving a basket
of less important needs. Thus, determination of
importance with some accuracy is key.
Early QFD studies in the 1970s recognized the
mathematical limitations of ordinal scales and de-
faulted to assigning alphabetical rankings of a, b,
and c to convey importance, as shown in . How-
ever, as QFD was applied to larger, more complex
products, the number of needs grew to as many as
900-1,000, thus rendering the alphabetical rank-
ings unwieldly and a numerical model more desir-
able. When using AHP was proposed by Nakui,
the solution to meaningful mathematical modeling
in QFD was realized.
Figure 4. Using a, b, c for prioritization

Using AHP in QFD – The Impact of the New ISO 16355 Standard
International Symposium on the
Analytic Hierarchy Process
6 London, U.K.
August 4 – August 7, 2016
5.2.1 Acquiring customer needs to be used for MCDM criteria
One important consideration in MCDM is that the decision makers have knowledge of the
subject. For customer needs, this mean customers, not the organization making the product.
In many instances, there may be a value chain of customers that includes buyers, installers,
users, maintenance, and others. ISO 16355 (ISO 16355-2:2016, 2016) recommends that
these customers be the source of both the needs and the priorities. Thus, installers only
prioritize installer needs, etc. These customers can also be prioritized using AHP as de-
scribed in the standard, but this is beyond the scope of this paper.
Another consideration in MCDM is that the sets of criterial and alternatives be independent
of each other. In the House of Quality, this means that a customer need is independent of
functional requirements. For example, a café customer might say "I want a hot cup of cof-
fee" but this is not a customer need since it describes an attribute of the coffee – hot. In
QFD, these must be translated into product independent needs, such as "I want to feel warm
inside because it is cold outside." This is essential for several reasons. First, it is possible
to offer coffee that is too hot to drink, and thus the customer cannot get warm. Second,
there may be other attributes besides "hot" needed to create warmth. Third, there may be
other solutions besides temperature to make the customer feel warm inside, such as alcohol
or spice. Thus, product-independence of customer needs is essential for proper specifica-
tions and innovative solutions in the new product.
5.2.2 Structuring customer needs
In AHP, problems are structured as a hierarchy and in MCDM the hierarchy is used to
organize "perceptions, feelings, judgments, and memories" that influence the decision.
(Saaty & Peniwati, 2008) A well-structured hierarchy exhibits MECE or mutually exclu-
sive, collectively exhaustive elements that protects against double counting and missing
choices. An example of mutually exclusive in the same hierarchical level would be apple
vs. pear, while a violation would be apple vs. fruit. An example of missing elements would
be in the class of drupe fruits (have a center stone), the sub-categories list peaches and
apricots, but missing are plums and cherries, which can be logically added once the cate-
gory is named.
In QFD, the customer needs are perceptions, feelings, judgments, and memories that rep-
resent benefits the customer seeks to address their life or work problems, opportunities,
and image concerns. Once acquired, each customer type along the value chain makes a
hierarchy of their needs only, and is asked to check if the hierarchy exhibits MECE, and
make appropriate adjustments. Part 4 of the standard provides detailed guidance and ex-
amples of this step. (ISO 16355-4:2016, 2016)
5.2.3 Prioritizing customer needs
Once the customer needs hierarchy is constructed and adjusted, the customer is asked to
use pairwise comparison to prioritize their needs. Making comparisons are a skill intrinsic
to humans, and do not require much analytic or mathematical skill. Imagine a shopper
holding a melon in each hand to determine which is heavier. What AHP facilitates is taking
these comparisons of qualitative customer needs and deriving a quantitative representation
in relative numbers.

Using AHP in QFD – The Impact of the New ISO 16355 Standard
International Symposium on the
Analytic Hierarchy Process
7 London, U.K.
August 4 – August 7, 2016
In QFD, where there may be hundreds of customer needs at the tertiary level of the hierar-
chy, the number of comparisons can easily overwhelm. Unlike decision makers in an or-
ganization whose job it is to reach consensus and work together, customers have no such
obligation. Thus, presenting a full set of comparisons risks the customer becoming unco-
operative or tiring and just filling in numbers to get it over with.
Part 4 of the standard offers guidance on this. First, customers are asked to prioritize the
customer needs hierarchy beginning with the most abstract level (usually 5-7 elements).
Five elements present only ten comparisons (n2-n)/2 which a person can easily complete in
just a few minutes. Then, customers are asked to prioritize the next level branches of only
those nodes with high priority. This is repeated to the next level "children" whose local
priorities can be multiplied by the priorities of their parents to calculate a global priority.
Since most products seek multiple customers, it may not be possible to have 100% of them
vote their preferences with pairwise comparisons. Part 4 of the standard includes statistical
methods for calculating sample size according to size of the population, the likelihood that
the participant represents the target segment, the tolerable margin of error, and desired
confidence level. With multiple respondents, numbers may represent different levels of
importance; pessimists may score to the bottom of the scale, optimists to the top, and fence-
sitters around the middle. Using a verbal scale ranging from the two elements in the pair
having equal priority to one being extremely more important than the other (to improve) is
recommended. The number of levels has been recommended at nine levels, which Saaty
describes as nine being the upper limit because one can divide distinctions into the three
categories of high, medium, low and each of these into three categories of high, medium
and low thus yielding nine grades of distinction. (Saaty, 2007)
Figure 5 is an example of a pairwise comparison matrix for tertiary customer needs in a
customer relations management software app. (Stansfield, et al., 2010) The right most col-
umn indicates the priorities from the AHP calculation. These are then applied to the hier-
archy where local and global weights are displayed, as shown in Figure 2.
Figure 5. Pairwise comparison of customer needs for a customer relations
management app
1.1 Customer Understanding
1.1
.1 C
usto
mer
taken
qu
ickly
to
ap
pro
pri
ate
new
serv
ices a
reas
1.1
.2 C
usto
mer
can
fin
d e
asil
y
are
a w
here
th
ey c
an
exp
ress
co
mp
lain
ts
1.1
.3 C
usto
mer
Co
nta
cte
d w
ith
Serv
ice I
nfo
rmati
on
Rele
van
t to
them
1.1.1 Customer taken quickly to appropriate new services
areas1 1/2 1/3 0,164
1.1.2 Customer can find easily area where they can express
complaints2 1 1/2 0,297
1.1.3 Customer Contacted with Service Information Relevant to
them3 2 1 0,539
Using AHP in QFD – The Impact of the New ISO 16355 Standard
International Symposium on the
Analytic Hierarchy Process
8 London, U.K.
August 4 – August 7, 2016
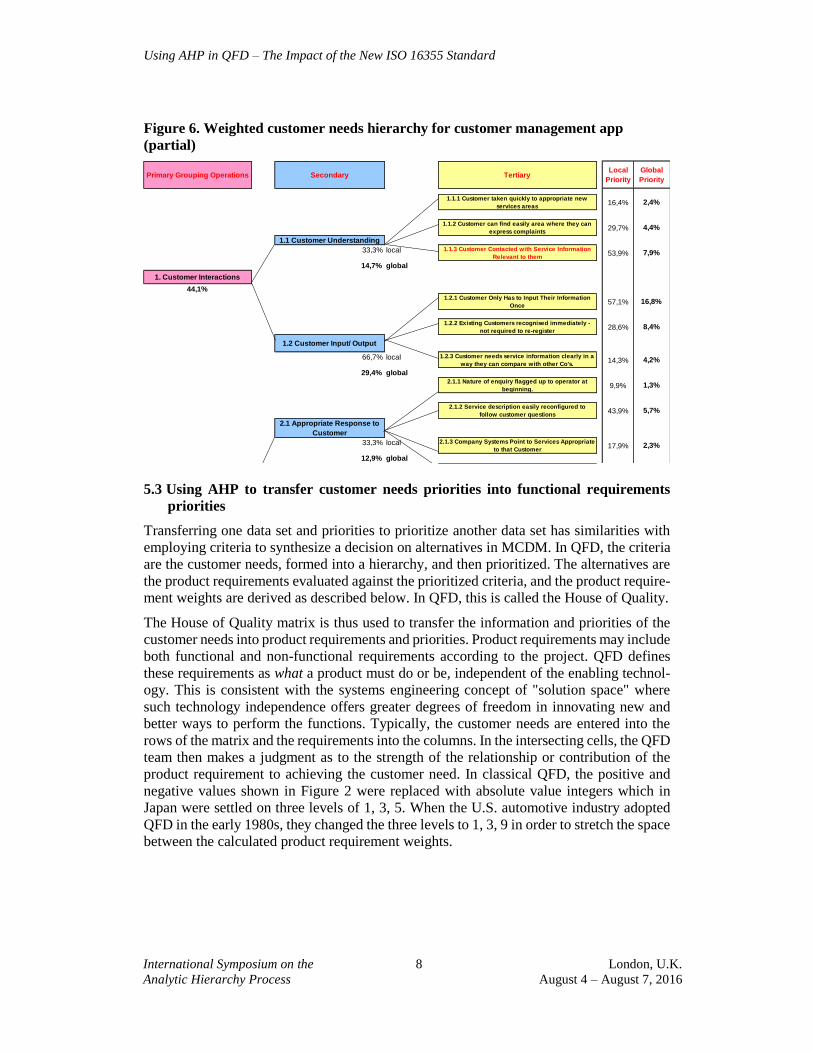
Figure 6. Weighted customer needs hierarchy for customer management app
(partial)
5.3 Using AHP to transfer customer needs priorities into functional requirements
priorities
Transferring one data set and priorities to prioritize another data set has similarities with
employing criteria to synthesize a decision on alternatives in MCDM. In QFD, the criteria
are the customer needs, formed into a hierarchy, and then prioritized. The alternatives are
the product requirements evaluated against the prioritized criteria, and the product require-
ment weights are derived as described below. In QFD, this is called the House of Quality.
The House of Quality matrix is thus used to transfer the information and priorities of the
customer needs into product requirements and priorities. Product requirements may include
both functional and non-functional requirements according to the project. QFD defines
these requirements as what a product must do or be, independent of the enabling technol-
ogy. This is consistent with the systems engineering concept of "solution space" where
such technology independence offers greater degrees of freedom in innovating new and
better ways to perform the functions. Typically, the customer needs are entered into the
rows of the matrix and the requirements into the columns. In the intersecting cells, the QFD
team then makes a judgment as to the strength of the relationship or contribution of the
product requirement to achieving the customer need. In classical QFD, the positive and
negative values shown in Figure 2 were replaced with absolute value integers which in
Japan were settled on three levels of 1, 3, 5. When the U.S. automotive industry adopted
QFD in the early 1980s, they changed the three levels to 1, 3, 9 in order to stretch the space
between the calculated product requirement weights.
Primary Grouping Operations Secondary TertiaryLocal
Priority
Global
Priority
1.1.1 Customer taken quickly to appropriate new
services areas16,4% 2,4%
1.1.2 Customer can find easily area where they can
express complaints29,7% 4,4%
1.1 Customer Understanding
33,3% local 1.1.3 Customer Contacted with Service Information
Relevant to them53,9% 7,9%
14,7% global
1. Customer Interactions
44,1%1.2.1 Customer Only Has to Input Their Information
Once57,1% 16,8%
1.2.2 Existing Customers recognised immediately -
not required to re-register28,6% 8,4%
1.2 Customer Input/ Output
66,7% local 1.2.3 Customer needs service information clearly in a
way they can compare with other Co's.14,3% 4,2%
29,4% global2.1.1 Nature of enquiry flagged up to operator at
beginning.9,9% 1,3%
2.1.2 Service description easily reconfigured to
follow customer questions43,9% 5,7%
2.1 Appropriate Response to
Customer
33,3% local 2.1.3 Company Systems Point to Services Appropriate
to that Customer17,9% 2,3%
12,9% global
Using AHP in QFD – The Impact of the New ISO 16355 Standard
International Symposium on the
Analytic Hierarchy Process
9 London, U.K.
August 4 – August 7, 2016
The product requirement weights are calculated as
𝑊𝑗 = ∑ 𝑋𝑖𝑎𝑖𝑗
𝒏
𝒊=𝟏
(4)
where:
𝑋𝑖= the priority of the row item (e.g., customer need priority in the house of quality)
𝑎𝑖𝑗= the strength of the relationship
Since the QFD team is asked to take qualitative customer needs and priorities and judge
how their relationship with more quantitative product requirements using the above calcu-
lation, AHP offers an absolute scale with numbers in ratio to each other that improves the
accuracy better than ordinal scale numbers. On an abacus, such calculations would be on-
erous, especially in a complex product with 1,000 customer needs and 1,000 product re-
quirements yielding 1,000,000 relations to judge and calculate. With a PC and spreadsheet
software, the effort takes only a moment to calculate once and then cut-and-paste across
the entire matrix. Nakui's integration of AHP into QFD was heralded as a breakthrough in
Japan in 1987, providing not only ease of calculation but the added accuracy of ratio scale
math.
The large number of relationships to judge in a QFD matrix make it easiest to use an abso-
lute or expert scale, rather than direct or pairwise judgments. Direct judgments would re-
quire some type of correlation test between each customer need and product requirement
with enough samples to satisfy concerns for error. Given that the customer needs are typi-
cally subjective and the product requirements are not technology-specific, the task would
be overwhelming for all but the riskiest projects (such as a manned flight to Mars). Like-
wise, pairwise comparisons of all product requirements against each criterion would be an
exhausting exercise, by the end of which, participants would be agreeing to any value just
to go home. An absolute expert judgment scale has been used in Japan since the 1970s with
success sufficient to recommend it in the ISO standard, with the modifications described
below.
5.3.1 Displaying QFD relationship weights with AHP judgments
Part 5 of the standard provides detailed guidance on building a House of Quality and the
related matrices in Comprehensive QFD shown in Figure 3. Comprehensive QFD includ-
ing quality, technology, cost, and reliability deployments Figure 3. (ISO 16355-5:2016,
2016) The number of levels was expanded from three to nine, to take advantage of the
human cognitive skills discussed above. The visual display of the matrix also lends itself
to relationship patterns that are useful in diagnosing the quality of the analysis, such as
MECE violations that escaped earlier scrutiny. The three Japanese favorite symbols did not
lend themselves to expansion to nine levels so the standard adopted the widely recognized
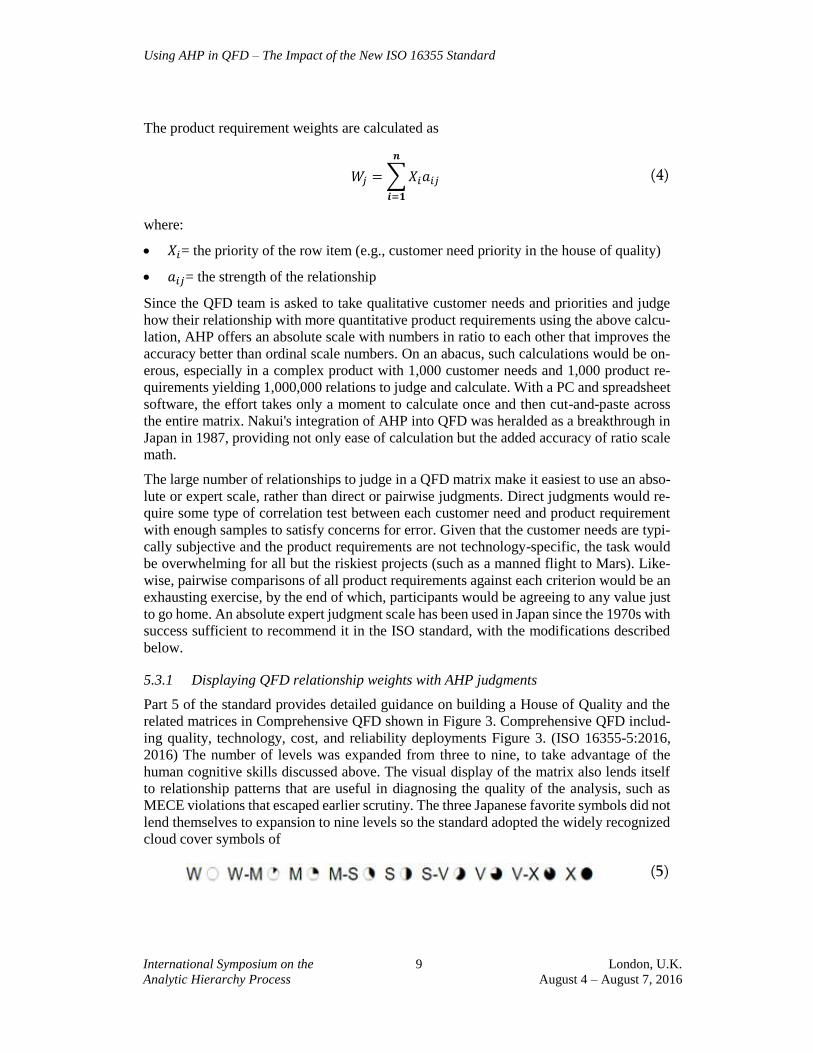
cloud cover symbols of
(5)

Using AHP in QFD – The Impact of the New ISO 16355 Standard
International Symposium on the
Analytic Hierarchy Process
10 London, U.K.
August 4 – August 7, 2016
and applied a verbal scale with similar wording to AHP's pairwise comparisons, mainly
weak (W), moderate (M), strong (S), very strong (V), or extremely strong (X), as well as
intervals such as weak-to-moderate (W-M), and so forth.
5.3.2 Quantifying QFD relationship weights with AHP
Part 5 of the standard also provides ratio scale values for each of the nine relationship levels
to replace the ordinal integers of 1, 3, 5 and 1, 3, 9. These values were calculated from the
AHP pairwise comparison of the nine verbal levels to themselves shown in Figure 7. The
results were recalculated so that the maximum level of extremely strong relationship was
1,000 (shown with decimal commas) and with all other levels in ratio, as W (0,059), W-M
(0,079), M (0,112), M-S (0,162), S (0,237), S-V (0,344), V (0,498), V-X (0,712), X
(1,000).
Figure 7 Pairwise comparison of nine QFD relationship levels
5.3.3 Ideal and proportional distribution
As in MCDM, QFD matrices use different distribution methods to synthesize the product
requirement weights including independent, ideal, and proportional distributions. The for-
mula above in 5.3 is the independent distribution and is preferred when trying to transfer
customer needs priorities into product requirement priorities. There are other cases where
a limiting constraint such as target price, weight (mass), or power must be allocated to
subsystems or components, and proportional distribution is preferred. Guidelines for dif-
ferent distribution methods are detailed in Part 5 of the standard. (ISO 16355-5:2016, 2016)
5.3.4 Building the modern House of Quality
As explained above, the classical House of Quality suffered from ordinal scale mathemat-
ical calculations hampered by the limited availability of PCs and spreadsheets to product
development engineers in the 1970s and early 1980s when QFD was exported from Japan.
These limitations were easily remedied in the mid-1980s when PCs, spreadsheets, and DOS
based AHP programs became available. Figure 8 continues the case study of the customer
relationships management app with the House of Quality showing tertiary customer needs
and their priorities transferred into product functional requirement priorities. (Stansfield,
et al., 2010) A summary of the steps to building this House of Quality are as follows:
1. The QFD teams meets with customers to acquire their "voice." These voices are
translated into product independent benefits, called customer needs.
2. The customers are asked to prioritize their needs by first constructing a hierarchy
and then using pairwise comparisons and AHP. These are entered into the rows of
the House of Quality.

Using AHP in QFD – The Impact of the New ISO 16355 Standard
International Symposium on the
Analytic Hierarchy Process
11 London, U.K.
August 4 – August 7, 2016
3. Functional requirements are derived by the QFD team and entered into the columns
of the House of Quality.
4. The QFD teams judges the relationship strength or degree of contribution of each
functional requirement to each need, using a verbal scale. Symbols are used to
represent this strength. The symbols are also assigned absolute values in ratio scale
by way of AHP.
5. The spreadsheet multiplies the absolute value of the symbol by the priority of the
customer need, and sums these products column-by-column for each functional
requirement (called an absolute weight at the bottom of the matrix), using inde-
pendent distribution. These are then normalized to 100% (called a functional re-
quirement weight at the bottom of the matrix).
Figure 8 House of Quality for customer relationship management app
Functional Requirem
ents
Custom
er Needs
89
68
35
10
0,0
18
0,0
24
0,0
09
0,0
18
0,0
03
0,0
06
0,0
02
0,0
00
90
91
43
02
0,0
43
0,0
00
0,0
43
0,0
03
0,0
09
0,0
06
0,0
00
0,0
04
19
50
20
20
0,0
05
0,0
78
0,0
21
0,0
00
0,0
08
0,0
00
0,0
08
0,0
00
20
44
39
00
0,0
17
0,0
00
0,0
33
0,0
33
0,0
22
0,1
64
0,0
00
0,0
00
00
00
19
00
0,0
00
0,0
00
0,0
00
0,0
00
0,0
11
0,1
64
0,0
00
0,0
00
02
00
20
97
0,0
00
0,0
17
0,0
00
0,0
00
0,0
17
0,0
00
0,1
64
0,0
85
06
00
20
49
0,0
00
0,0
65
0,0
00
0,0
00
0,0
17
0,0
00
0,0
33
0,1
64
09
07
60
45
0,0
00
0,1
64
0,0
00
0,0
85
0,0
65
0,0
00
0,0
33
0,0
44
09
05
70
67
0,0
00
0,1
64
0,0
00
0,0
44
0,0
85
0,0
00
0,0
65
0,0
85
Absolute W
eight0,083
0,5110,106
0,1830,236
0,3410,305
0,3832,148
Functional Requirem
ent weight
3,9%23,8%
4,9%8,5%
11,0%15,9%
14,2%17,8%
100,0%
FR 6: Single sign-on for
customer - all Lines of
Business
FR7: Service Descriptions
formated to industry
standard
FR8: Service Descriptions -
reconfi gured very quickly -
key word prompts
3,56%
FR 5: Customer History - all
services, retrieved on sign-
on
FR 1: Reason for Enquiry at
top level of menu
FR 3: Customer Complaint
Process access in 1st screen
FR 4: Nature of customer
contact flagged to
Operations staff.
Adjusted Weight (Customer
priority)
1.2.2 Existing C
ustomers recognised
imm
ediately - not required to re-register8,22%
1.2.3 Custom
er needs service information
clearly in a way they can com
pare with other
Co's.
4,11%
2.1.2 Service description easily reconfigured to
follow custom
er questions5,54%
2.1.3 Com
pany System
s Point to S
ervices
Appropriate to that C
ustomer
2,26%
2.1.4 New
Service C
ampaigns E
asily Targetted
to the right customers.
16,45%
4,28%1.1.2 C
ustomer can find easily area w
here they
can express complaints
7,76%
1.2.1 Custom
er Only H
as to Input Their
Information O
nce
1.1.3 Custom
er Contacted w
ith Service
Information R
elevant to them
1.1.1 Custom
er taken quickly to appropriate
new services areas
2,36%
FR 2: Customer Segment
Profile Matched to Service
Offerings & to individuals
Using AHP in QFD – The Impact of the New ISO 16355 Standard
International Symposium on the
Analytic Hierarchy Process
12 London, U.K.
August 4 – August 7, 2016
5.3.5 Quality planning and design planning tables
Additional information useful to product developers is often attached to the House of Qual-
ity to add application nuances to the analysis. The quality planning table adds customer
perception competitive benchmarking and sales strategy for each customer need. The de-
sign planning table adds technical benchmarking and target specifications for each product
requirement. Classical QFD attempts to quantify this information but shares the same or-
dinal scale math limitations, which can be fixed with AHP. Both tables can be simplified
to qualitative information, as well. These tables are beyond the scope of this paper, but
detailed guidance is provided in Parts 4 (ISO 16355-4:2016, 2016) and 5 (ISO 16355-
5:2016, 2016) of the standard.
6. Comprehensive QFD using Vector Profiles for Connecting Matrices
In modern product development, especially in software, design decisions often transform
into different underlying topics. For instance, the customer’s need of ease-of-use trans-
forms into the need for intelligent suggestions in an input mask, and these suggestions need
collecting information about the user’s preferences. The German QFD institute has pub-
lished QFD best practices fitting particularly well to software product development
(Herzwurm & Schockert, 2006).
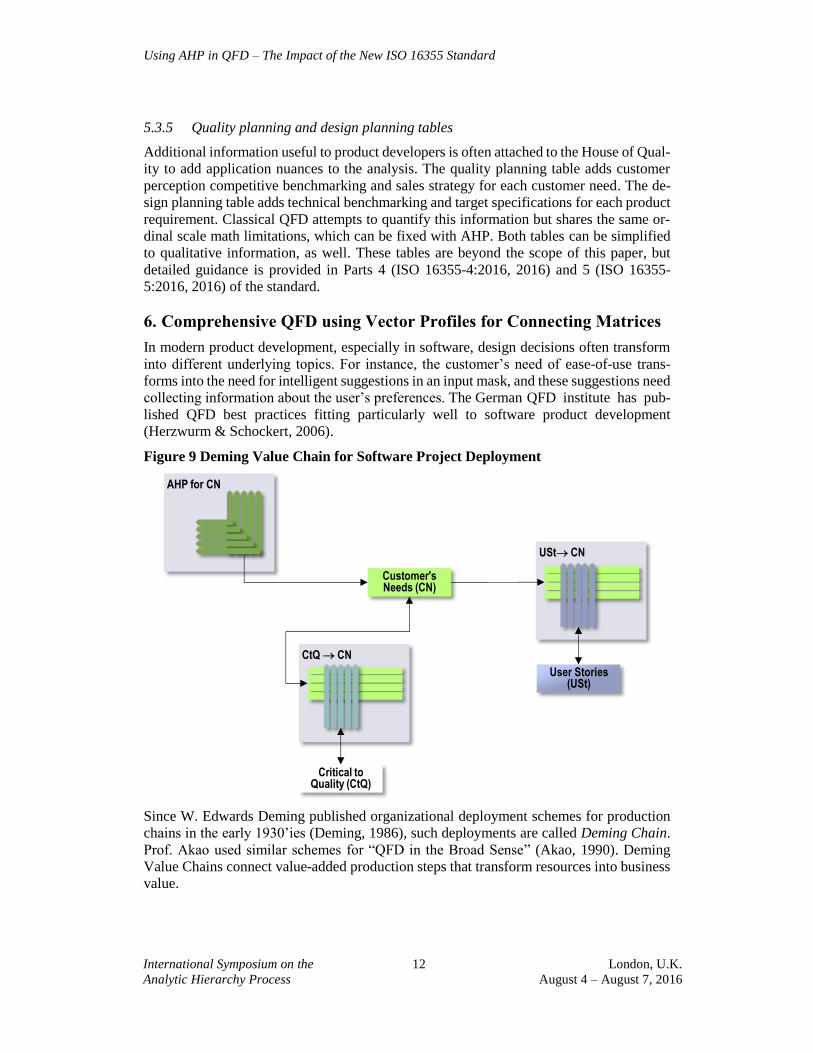
Figure 9 Deming Value Chain for Software Project Deployment
USt CN
AHP for CN
User Stories(USt)
Customer's Needs (CN)
Critical to Quality (CtQ)
CtQ CN
Since W. Edwards Deming published organizational deployment schemes for production
chains in the early 1930’ies (Deming, 1986), such deployments are called Deming Chain.
Prof. Akao used similar schemes for “QFD in the Broad Sense” (Akao, 1990). Deming
Value Chains connect value-added production steps that transform resources into business
value.

Using AHP in QFD – The Impact of the New ISO 16355 Standard
International Symposium on the
Analytic Hierarchy Process
13 London, U.K.
August 4 – August 7, 2016
In Figure 9, the Deming chain goes down some of the production steps typically used in
software development. The starting point is an AHP analyzing priorities for customer
needs. The needs are represented by a priority vector.
The customer’s needs profile can be used in two ways. The left branch analyses the soft-
ware process characteristics controlled by Critical-to-Quality (𝐶𝑡𝑄) characteristics. It uses
a QFD matrix mapping 𝐶𝑡𝑄 → 𝐶𝑁, where the response of the software development pro-
cess shall be the Customer’s Needs (CN). The right branch analyzes the functionality
needed to fulfill the same customer’s needs with User Stories (𝑈𝑆𝑡) as controls whose
response are again Customer’s Needs (𝑈𝑆𝑡 → 𝐶𝑁). Both quality and functionality control
software project success. Using the control profile of one QFD as the goal profile for the
next QFD ultimately is based on the observation of Saaty, who understood that using ratio
scale and vector profile makes the AHP hierarchy in decision making.
The Deming chain can be extended to include more ways of analyzing CN, for instance,
Voice of the Customer (Fehlmann & Kranich, 2014) or New Lanchester Theory (Taoka,
1997). Since the priorities these methods produce are all profiles, they compare and can be
combined. Moreover, additional steps such as testing can be added and controlled again by
using profiles. Thus, the AHP way of using ratio scale and profiles to represent priorities
allows for a sound way to implement Akao’s vision of Comprehensive QFD (Figure 3).
For a modern treatment of Deming chains, see (Fehlmann & Kranich, 2016 - to appear).
7. Conclusions
Traditional QFD often happened to uncover the
Eigenvector, if it was successful. This is not sur-
prising as good QFD moderators developed a
sixth sense for consistent QFD matrices. Every
QFD Master Black Belt® student learns to distin-
guish suspicious matrices from sound ones.
Now, it is clear how this worked. The key is us-
ing ratio scale, profiles instead of weights and
sound mathematics when evaluating QFD matri-
ces, as AHP always did.
The contribution of AHP to strengthening QFD
is substantial, and now documented in all parts
of ISO 16355. In 2007, Saaty was awarded the
Akao Prize® for excellence in QFD by the co-
founder of QFD, Yoji Akao.
8. Key References
Akao, Y., ed., 1990. Quality Function Deployment - Integrating Customer Requirements
into Product Design. Portland, OR: Productivity Press. Akao, Y., 1990. Quality Function Deployment: Integrating Customer Requirements into
Product Design. Portland: Productivity Press.
Deming, W., 1986. Out of the Crisis. Center for Advanced Engineering Study ed. Boston,
MA: Massachusetts Institut of Technology.

Using AHP in QFD – The Impact of the New ISO 16355 Standard
International Symposium on the
Analytic Hierarchy Process
14 London, U.K.
August 4 – August 7, 2016
Fehlmann, T. M., 2003. Linear Algebra for QFD Combinators. Orlando, FL, International
Council for QFD (ICQFD).
Fehlmann, T. M. & Kranich, E., 2014. Uncovering Customer Needs from Net Promoter
Scores. Istanbul, Turkey, 20th International Symposium on Quality Function
Deployment.
Fehlmann, T. M. & Kranich, E., 2016 - to appear. Managing Complexity - Uncover the
Mysteries with Six Sigma Transfer Functions. Berlin: Logos Verlag.
Herzwurm, G. & Schockert, S., 2006. What are the Best Practices of QFD?. Tokyo, Japan,
Transactions from the 12th Int. Symposium on Quality Function Deployment.
ISO 16355-1:2015, 2015. Applications of statistical and related methods to new technology
and product development process - Part 1: General principles and perspectives of
Quality Function Deployment (QFD), Geneva, Switzerland: International Standards
Organization.
ISO 16355-2:2016, 2016. Applications of statistical and related methods to new technology
and product development process - Part 2: Acquisition of Non-quantitative Voice of
Customer and Voice of Stakeholder, Geneva, Switzerland: International Standards
Organization.
ISO 16355-4:2016, 2016. Applications of statistical and related methods to new technology
and product development process - Part 4: Analysis of Non-Quantitative and
Quantitative VOC/VOS, Geneva Switzerland: International Standards Organization.
ISO 16355-5:2016, 2016. Applications of statistical and related methods to new technology
and product development process - Part 5: Solution Strategy, Geneva Switzerland:
International Standards Organization.
Johnson, C. & Mazur, G., 2008. Value Based Product Development – Using QFD and AHP
to Identify, Prioritize, and Align Key Customer Needs and Business Goals. Santa Fe, NM,
Transactions from the 20th Symposium on Quality Function Deployment.
Mazur, G., 2014. QFD and the New Voice of Customer (VOC). Istanbul, Turkey,
International Council for QFD (ICQFD), pp. 13-26.
Mizuno, S. & Akao, Y., 1994. QFD: The Customer-Driven Approach to Quality Planning
and Deployment. Tokyo: Asian Productivity Organization.
Nakui, S., 1987. Applying AHP to Weighting and Functional Classification in Function
Deployment, Tokyo: Japan Society for Quality Control.
Oshiumi, K., 1966. Perfecting Quality Assurance System in Plants. Quality Control, May
(supp.), pp. 62-67.
Saaty, T. L., 2003. Decision-making with the AHP: Why is the principal eigenvector
necessary?. European Journal of Operational Research, Volume 145, pp. 85-91.
Saaty, T. L., 2007. The Analytic Hierarchy Process: How to Measure Intangibles in a
Meaningful Way Side by Side. Ann Arbor, QFD Institute.
Saaty, T. L. & Peniwati, K., 2008. Group Decision Making: Drawing Out and Reconciling
Differences. Pittsburgh: RWS Publications.
Stansfield, K., Cole, J. & Mazur, G. H., 2010. Complex IT Design using both Traditional
QFD and Blitz QFD®. Ann Arbor, QFD Institute.
Suzuki, Y., 1972. Endeavor of Design Improvement for Large Diesel Engine for Ships.
Quality Control, May special edition, pp. 16-20.
Taoka, N., 1997. Lanchester Strategy – An Introduction. Sunnyvale, CA: Lanchester Press
Inc..