Using ADX to Trade Breakouts, - WealthV.comwealthv.com/articles/PDFs/ADX.pdf · Using ADX to Trade...
85
Transcript of Using ADX to Trade Breakouts, - WealthV.comwealthv.com/articles/PDFs/ADX.pdf · Using ADX to Trade...

Using ADX to Trade Breakouts, Using ADX to Trade Breakouts, Pullbacks, and Reversal Patterns in Pullbacks, and Reversal Patterns in
the Minithe Mini--sized Dowsized DowCBOT CBOT WebinarWebinar
October 12, 2006October 12, 2006Dr. Charles B. SchaapDr. Charles B. Schaap

About MeAbout Me
Retired from medical practice in 1999Retired from medical practice in 1999----began fullbegan full--time trading in stocks, futures, and optionstime trading in stocks, futures, and optionsAuthor: Author: ADXcellenceADXcellence——Power Trend Strategies (2006)Power Trend Strategies (2006)Articles in Articles in Technical Analysis of Stocks & Commodities, Technical Analysis of Stocks & Commodities, SFOSFO, , WorkingWorking--MoneyMoney, , Medical EconomicsMedical Economics, various , various newslettersnewslettersSpeaker for the International Traders Expo and Speaker for the International Traders Expo and other investment organizationsother investment organizationsDirector: The Hedge Fund Association Director: The Hedge Fund Association

ADX and the LongADX and the Long--term Dowterm Dow
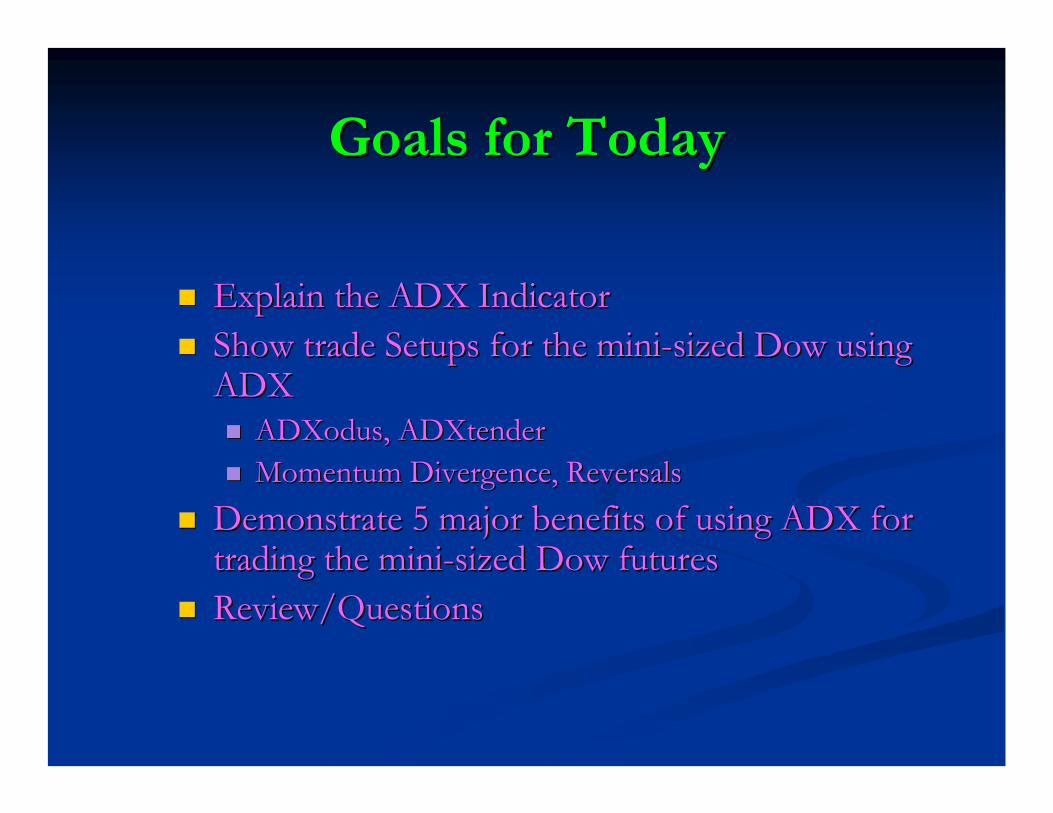
Goals for TodayGoals for Today
Explain the ADX IndicatorExplain the ADX IndicatorShow trade Setups for the miniShow trade Setups for the mini--sized Dow using sized Dow using ADXADX
ADXodus, ADXtenderADXodus, ADXtenderMomentum Divergence, ReversalsMomentum Divergence, Reversals
Demonstrate 5 major benefits of using ADX for Demonstrate 5 major benefits of using ADX for trading the minitrading the mini--sized Dow futuressized Dow futuresReview/QuestionsReview/Questions
What is ADX?What is ADX?(with DMI)(with DMI)
ADX is an indicator that measures ADX is an indicator that measures trend strength shows trend trend strength shows trend
direction.direction.
ADX tells us whether the ADX tells us whether the bullsbulls or or the the bearsbears are in control. are in control.

Benefits of Using ADXBenefits of Using ADX
Free indicator, no system to buyFree indicator, no system to buyQuantifies trend strengthQuantifies trend strengthAllows us to see the strength of bulls and bears Allows us to see the strength of bulls and bears at the same timeat the same timeTells when the trend is strong enough to tradeTells when the trend is strong enough to tradeTells us when the trend is weak (stand aside)Tells us when the trend is weak (stand aside)Works on all timeframes and productsWorks on all timeframes and productsCan be combined with other indicatorsCan be combined with other indicators

Trading is a Race for
Profits
Myth:Myth: To make money in the stock marketTo make money in the stock market, you must know you must know what the market is going to do.what the market is going to do.
Truth:Truth: You must know whatYou must know what youyou’’rere going to do before the going to do before the market does what it does.market does what it does.
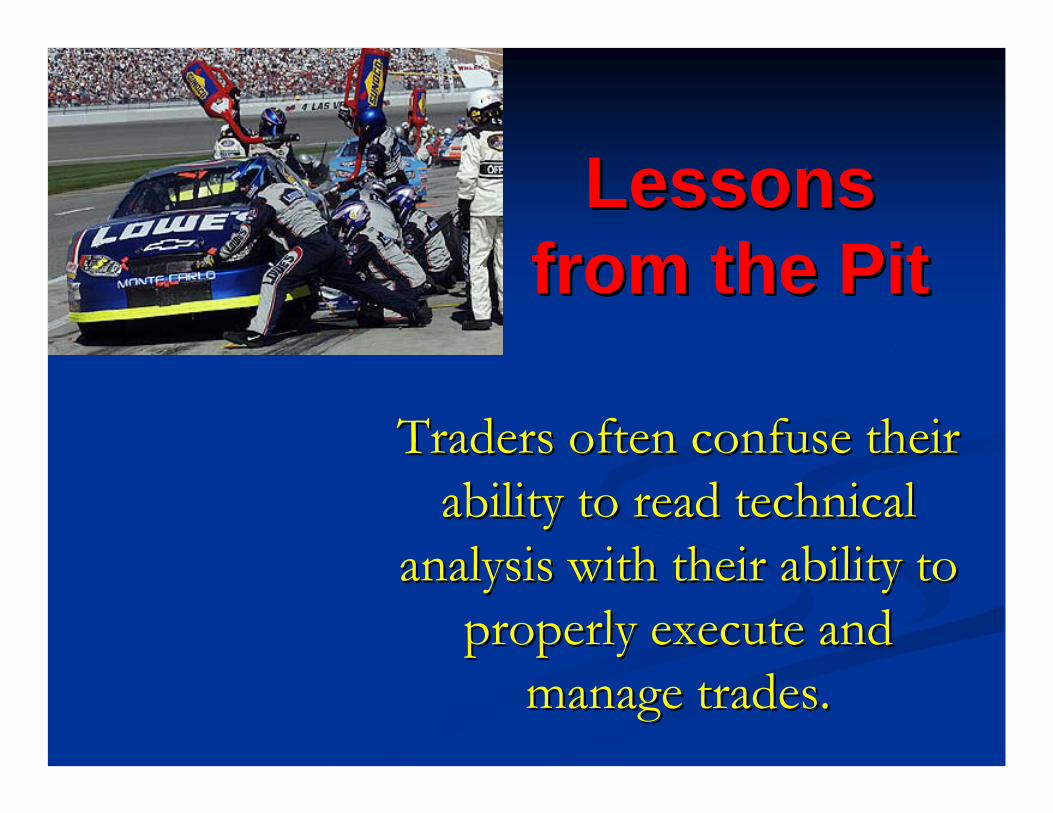
Lessons Lessons from the Pitfrom the Pit
Traders often confuse their Traders often confuse their ability to read technical ability to read technical
analysis with their ability to analysis with their ability to properly execute and properly execute and
manage trades.manage trades.
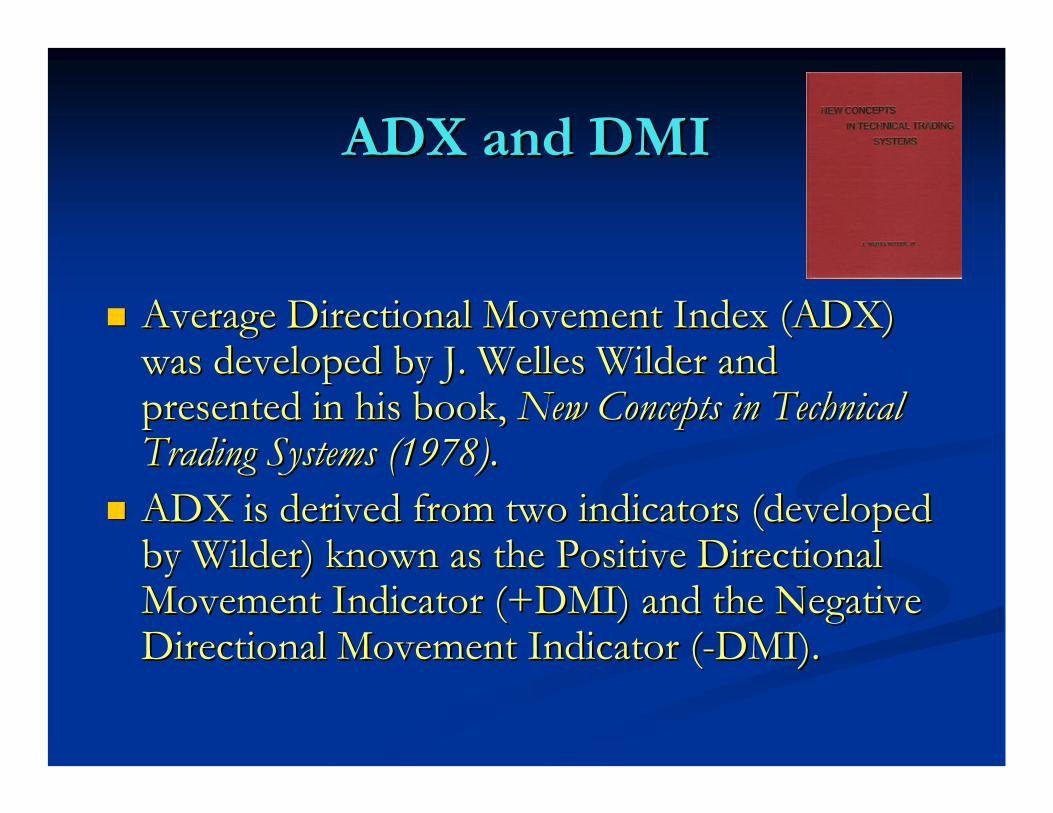
ADX and DMIADX and DMI
Average Directional Movement Index (ADX) Average Directional Movement Index (ADX) was developed by J. Welles Wilder and was developed by J. Welles Wilder and presented in his book, presented in his book, New Concepts in Technical New Concepts in Technical Trading Systems (1978)Trading Systems (1978). . ADX is derived from two indicators (developed ADX is derived from two indicators (developed by Wilder) known as the Positive Directional by Wilder) known as the Positive Directional Movement Indicator (+DMI) and the Negative Movement Indicator (+DMI) and the Negative Directional Movement Indicator (Directional Movement Indicator (--DMI). DMI).
Material For This Lecture is based onADXcellence—Power Trend Strategies
Available: www.stockmarketstore.com

Settings: DMI 13, ADX 8Settings: DMI 13, ADX 8
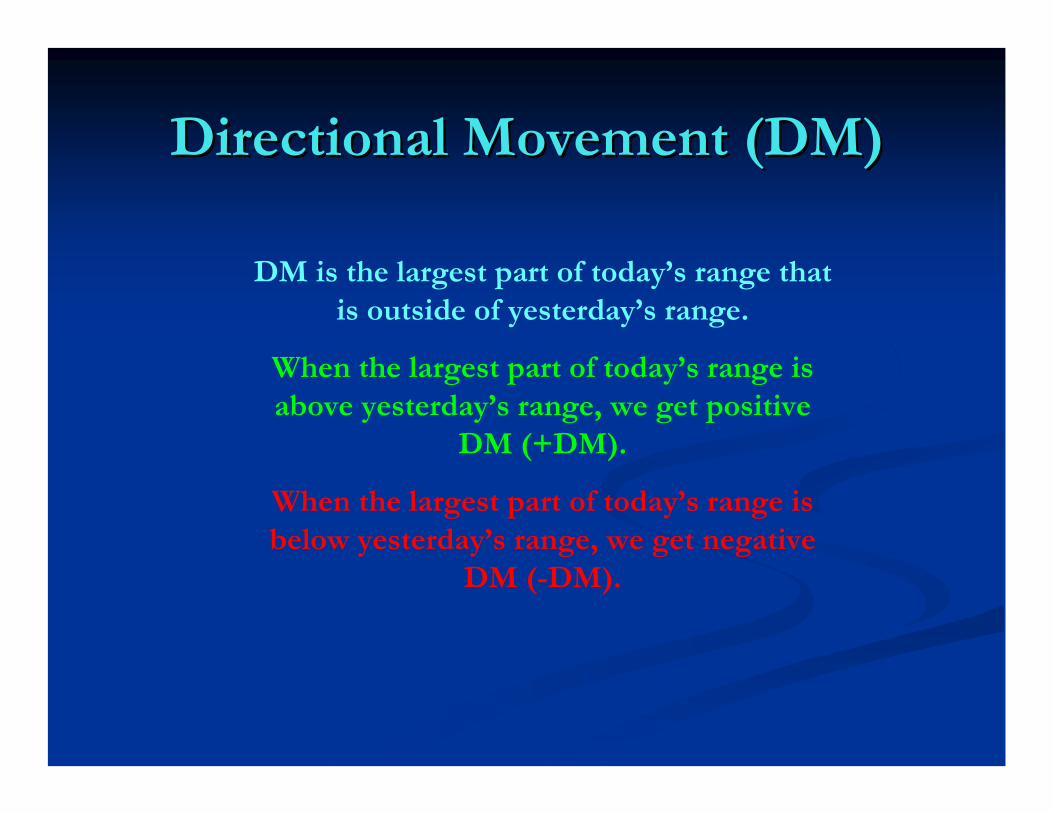
Directional Movement (DM)Directional Movement (DM)
DM is the largest part of today’s range that is outside of yesterday’s range.
When the largest part of today’s range is above yesterday’s range, we get positive
DM (+DM).
When the largest part of today’s range is below yesterday’s range, we get negative
DM (-DM).
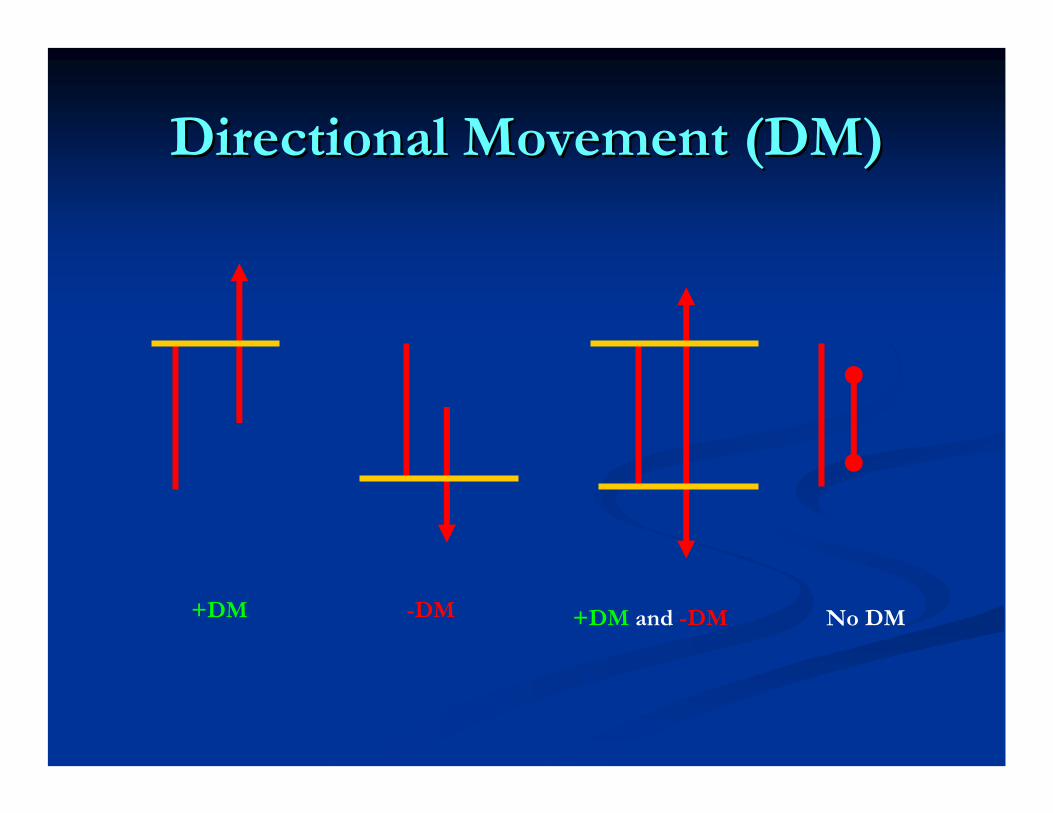
Directional Movement (DM)Directional Movement (DM)
+DM -DM +DM and -DM No DM
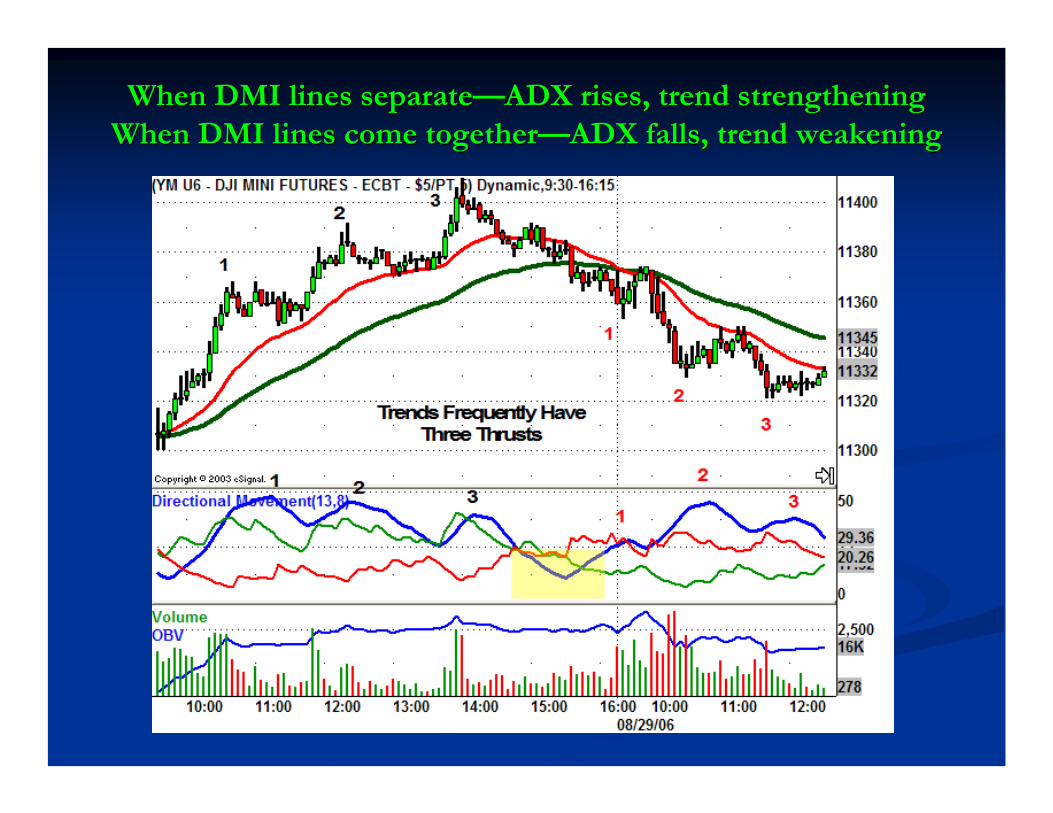
When DMI lines separateWhen DMI lines separate——ADX rises, trend strengtheningADX rises, trend strengtheningWhen DMI lines come togetherWhen DMI lines come together——ADX falls, trend weakeningADX falls, trend weakening

ADXplainedADXplained
The primary use of ADX is to measure trend strength. The primary use of ADX is to measure trend strength. DMIDMI CONFIRMSCONFIRMS trend direction andtrend direction and CONFIRMSCONFIRMSpriceprice entry/exit signals.entry/exit signals.When When ADX > 25ADX > 25
If If +DMI+DMI is above is above ––DMIDMI, prices are trending up. , prices are trending up. If If ––DMIDMI is above is above +DMI+DMI, prices are trending down. , prices are trending down.
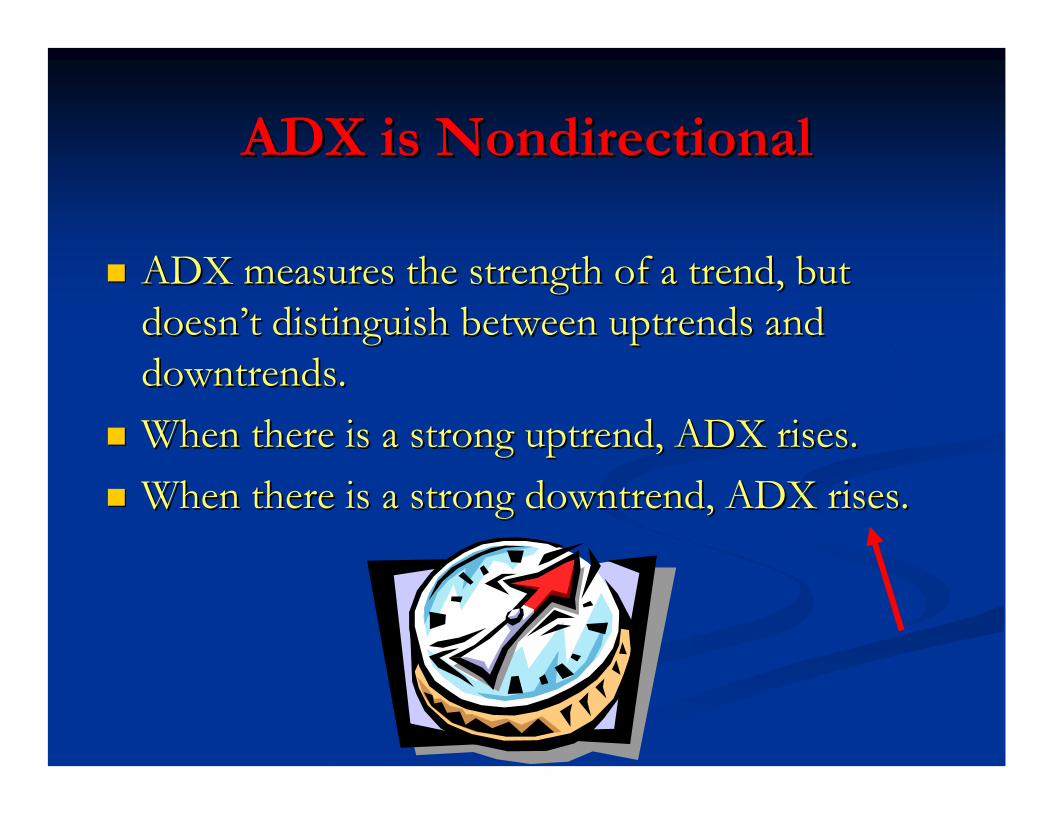
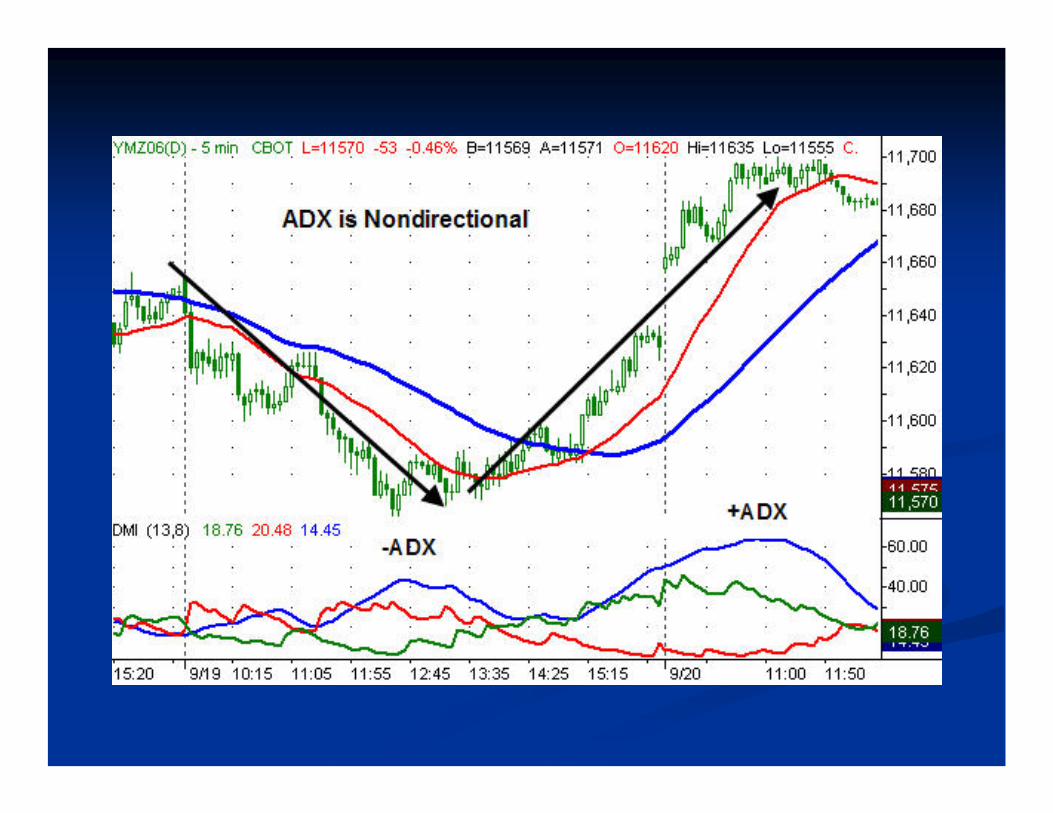
ADX is NondirectionalADX is Nondirectional
ADX measures the strength of a trend, but ADX measures the strength of a trend, but doesndoesn’’t distinguish between uptrends and t distinguish between uptrends and downtrends.downtrends.When there is a strong uptrend, ADX rises. When there is a strong uptrend, ADX rises. When there is a strong downtrend, ADX rises.When there is a strong downtrend, ADX rises.
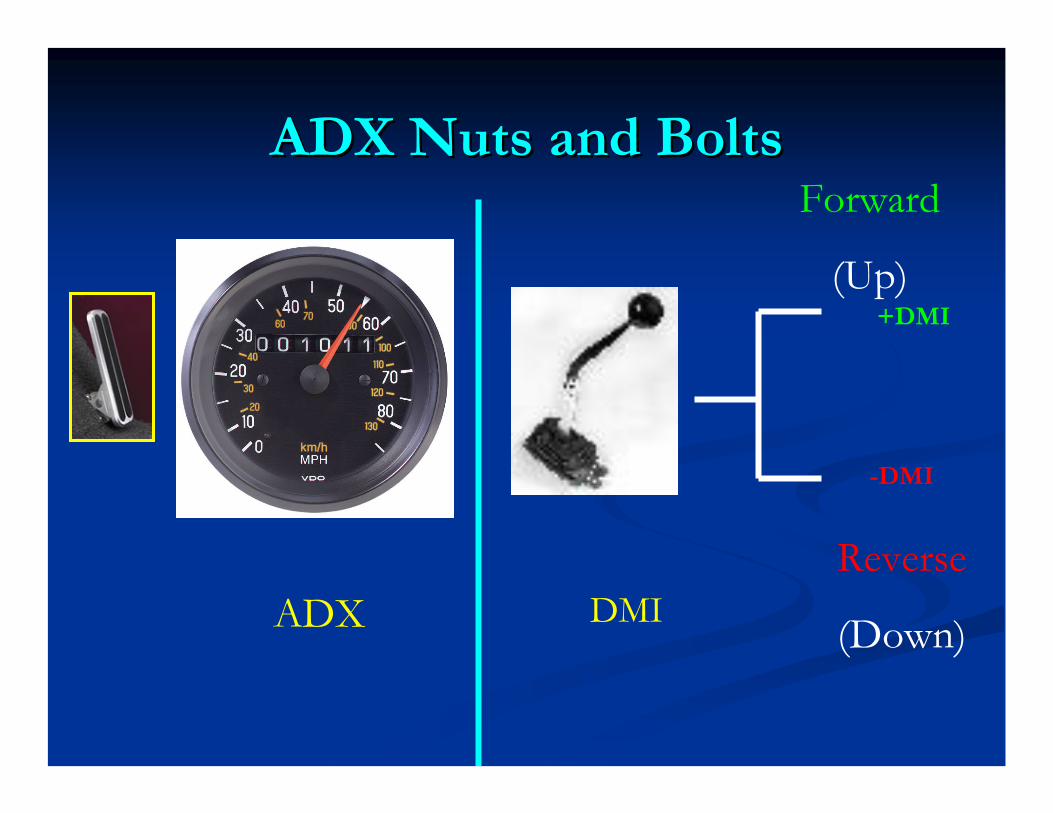
ADX
Forward
(Up)+DMI
-DMI
Reverse
(Down)
ADX Nuts and BoltsADX Nuts and Bolts
DMI
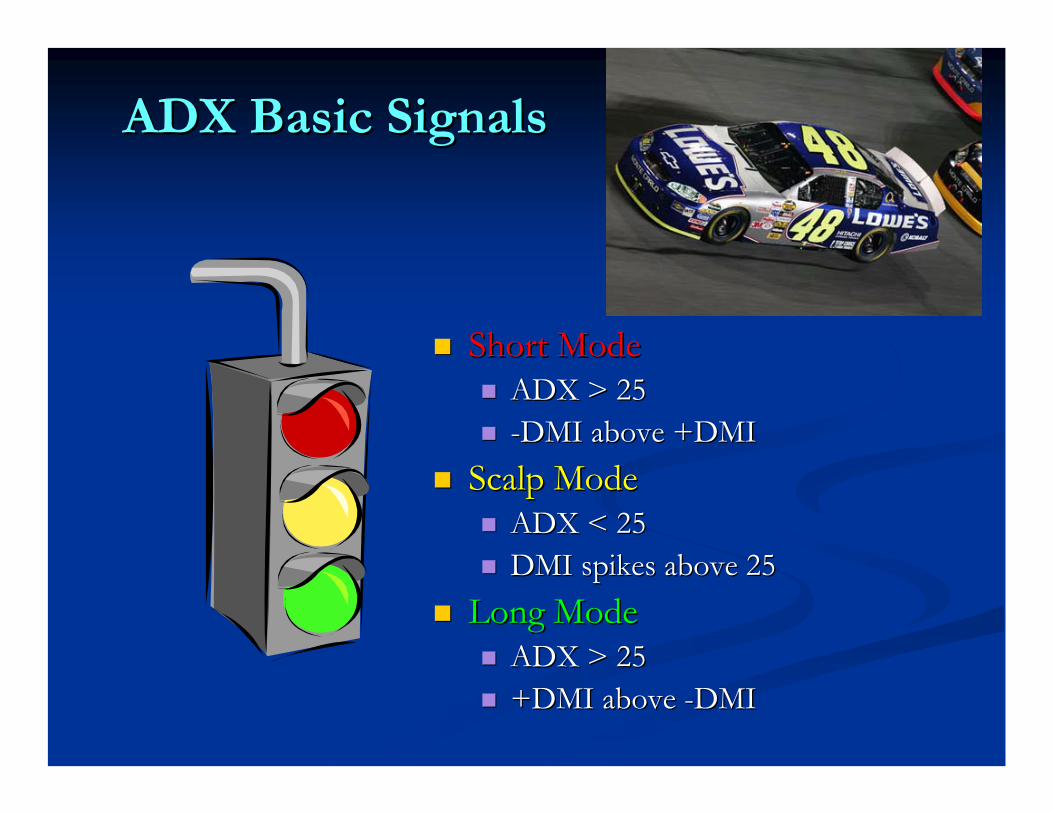
ADX Basic SignalsADX Basic Signals
Short ModeShort ModeADX > 25ADX > 25--DMI above +DMIDMI above +DMI
Scalp ModeScalp ModeADX < 25ADX < 25DMI spikes above 25DMI spikes above 25
Long ModeLong ModeADX > 25ADX > 25+DMI above +DMI above --DMIDMI

School Zone
Cruisin’Pedal to the
Metal
Engine Overheating
Idling
ADXcelleration
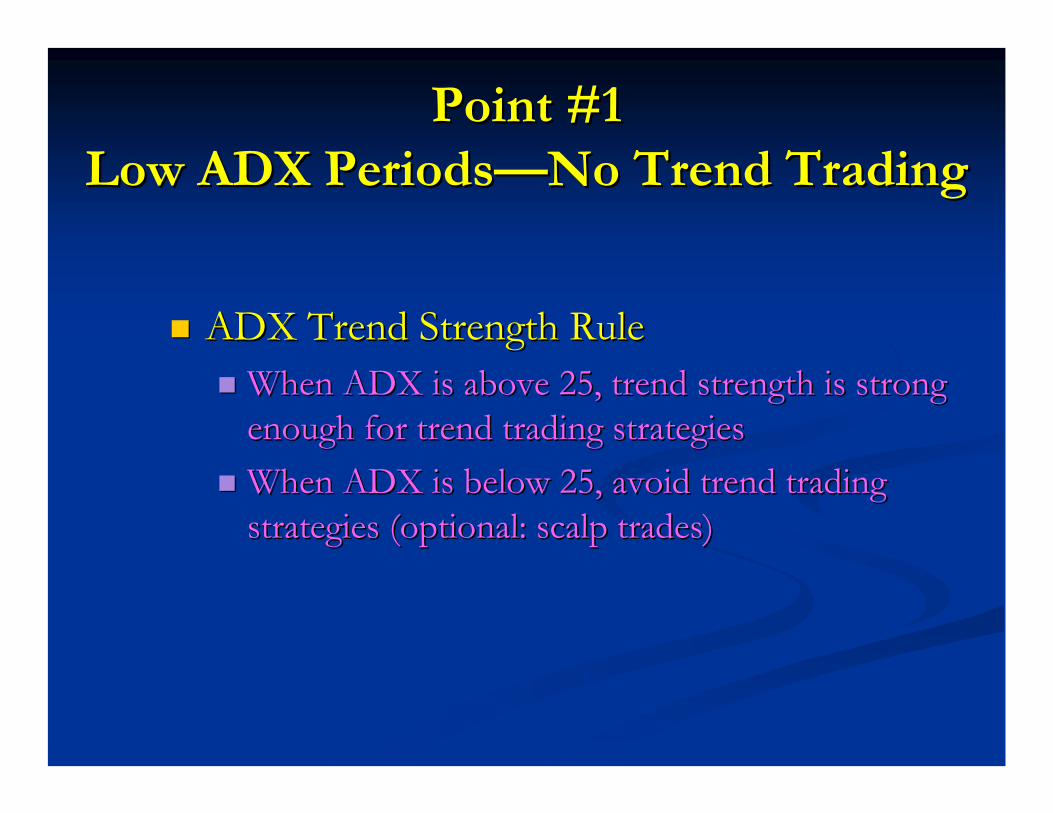
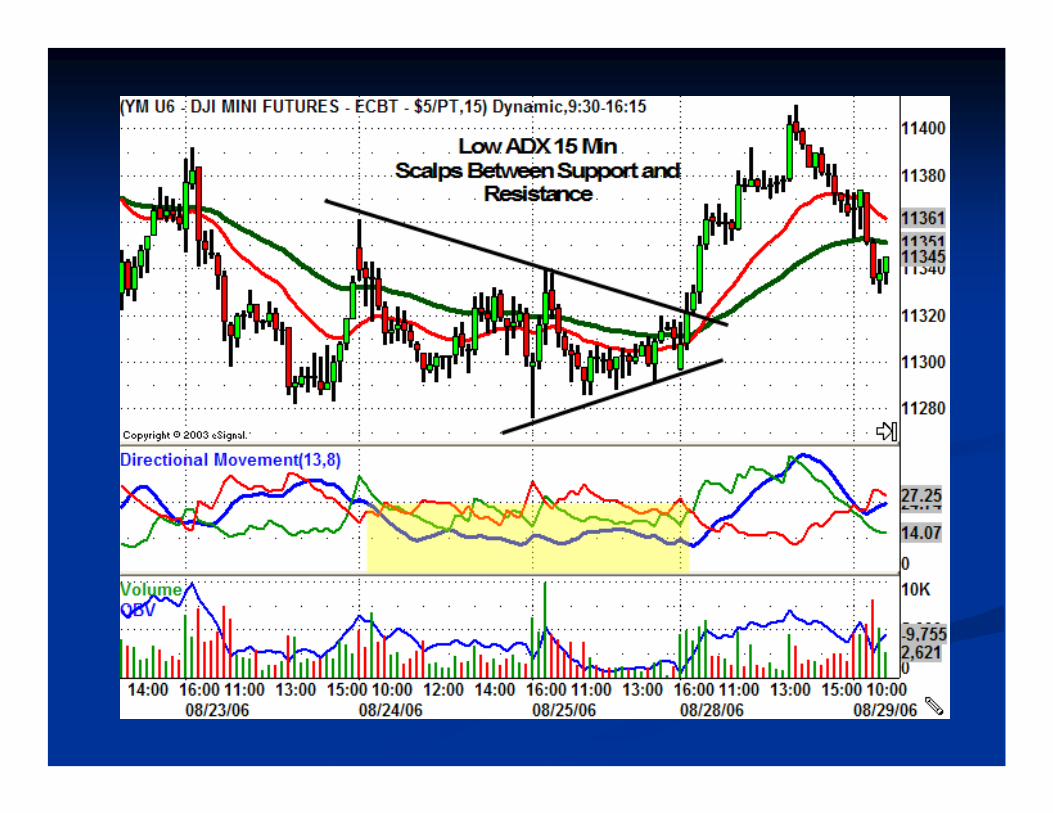
Point #1Point #1Low ADX PeriodsLow ADX Periods——No Trend TradingNo Trend Trading
ADX Trend Strength RuleADX Trend Strength RuleWhen ADX is above 25, trend strength is strong When ADX is above 25, trend strength is strong enough for trend trading strategiesenough for trend trading strategiesWhen ADX is below 25, avoid trend trading When ADX is below 25, avoid trend trading strategies (optional: scalp trades)strategies (optional: scalp trades)

Born to ChopBorn to Chop


Stopped OutStopped Out
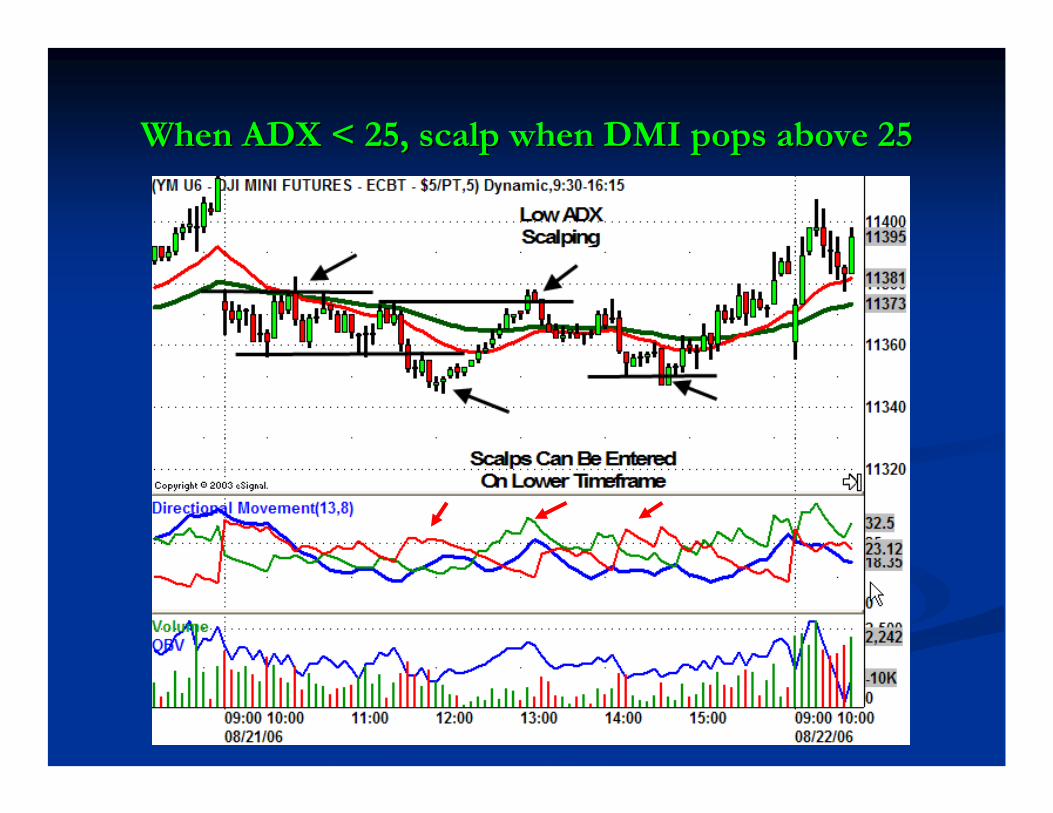
When ADX < 25, scalp when DMI pops above 25When ADX < 25, scalp when DMI pops above 25

Swing on a Higher TimeframeSwing on a Higher Timeframe= Trend on a Lower Timeframe= Trend on a Lower Timeframe
60 Minute 5 Minute

Price alternates between rangecontraction and expansion
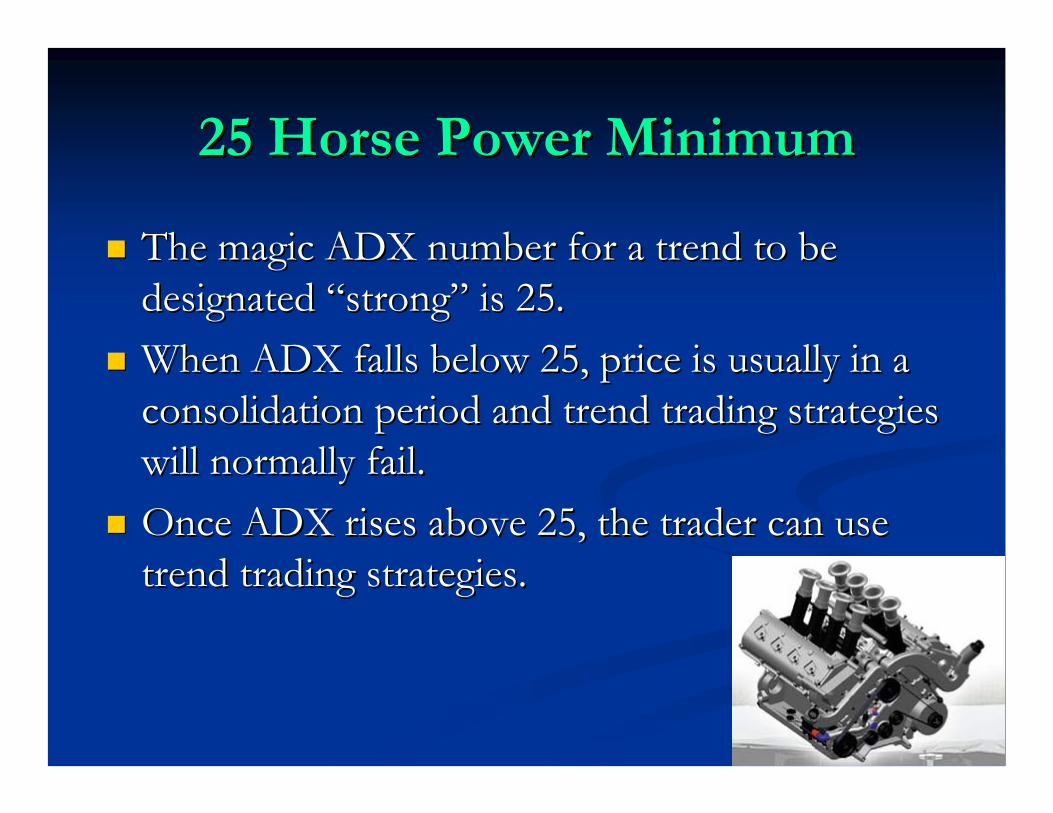
25 Horse Power Minimum25 Horse Power Minimum
The magic ADX number for a trend to be The magic ADX number for a trend to be designated designated ““strongstrong”” is 25. is 25. When ADX falls below 25, price is usually in a When ADX falls below 25, price is usually in a consolidation period and trend trading strategies consolidation period and trend trading strategies will normally fail. will normally fail. Once ADX rises above 25, the trader can use Once ADX rises above 25, the trader can use trend trading strategies. trend trading strategies.

BreakoutsBreakouts

Point # 2Point # 2Best Trades Begin From Low ADX PeriodsBest Trades Begin From Low ADX Periods
ADX Trendline RuleADX Trendline RuleWhen ADX is below 25 for an extended period, When ADX is below 25 for an extended period, draw trendlines on price and wait for a breakoutdraw trendlines on price and wait for a breakout
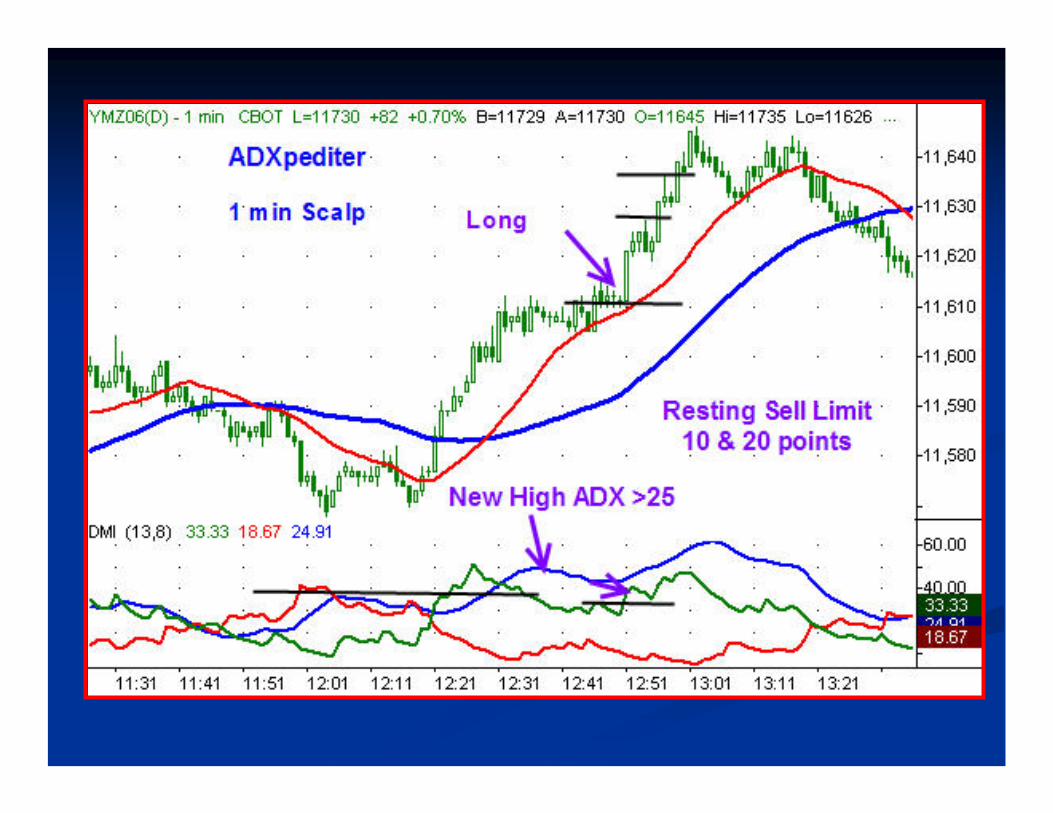
DMI Breakout RuleDMI Breakout RuleA valid breakout up requires a new high in price and A valid breakout up requires a new high in price and a new high in +DMI (and +DMI > 25)a new high in +DMI (and +DMI > 25)A valid breakout down requires a new low in price A valid breakout down requires a new low in price and a new high in and a new high in ––DMI (and DMI (and --DMI > 25)DMI > 25)
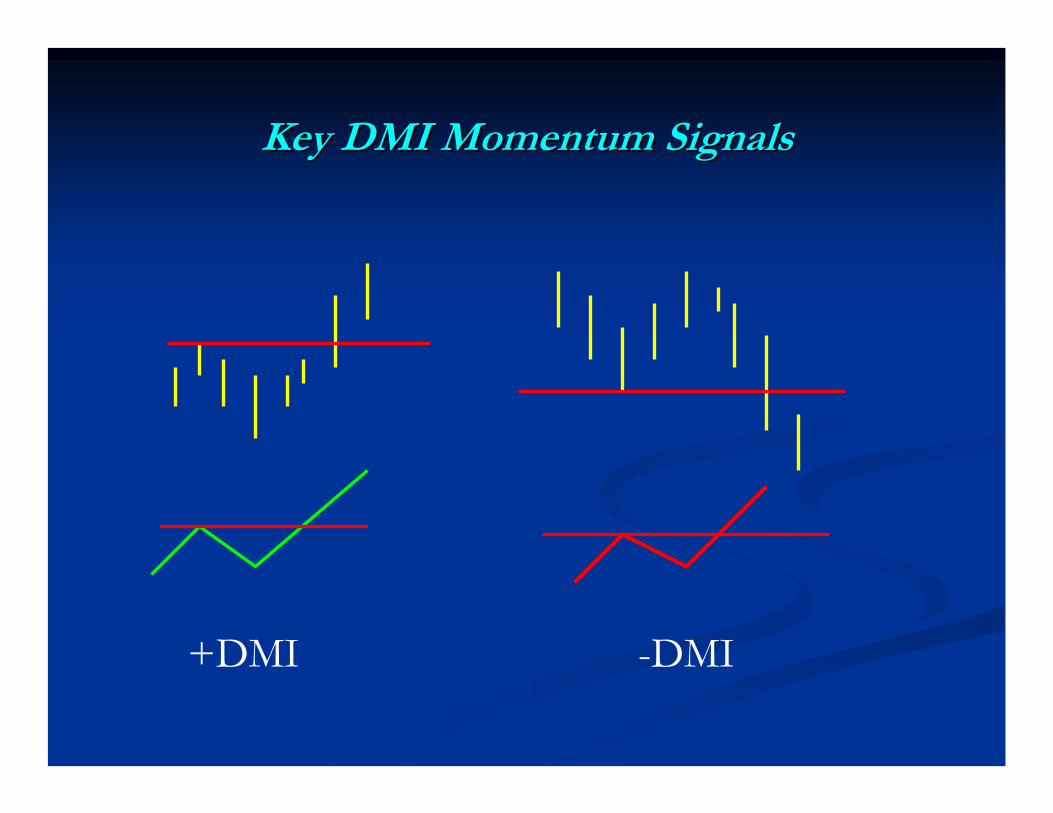
Key DMI Momentum SignalsKey DMI Momentum Signals
+DMI -DMI
ADXodusADXodus™™
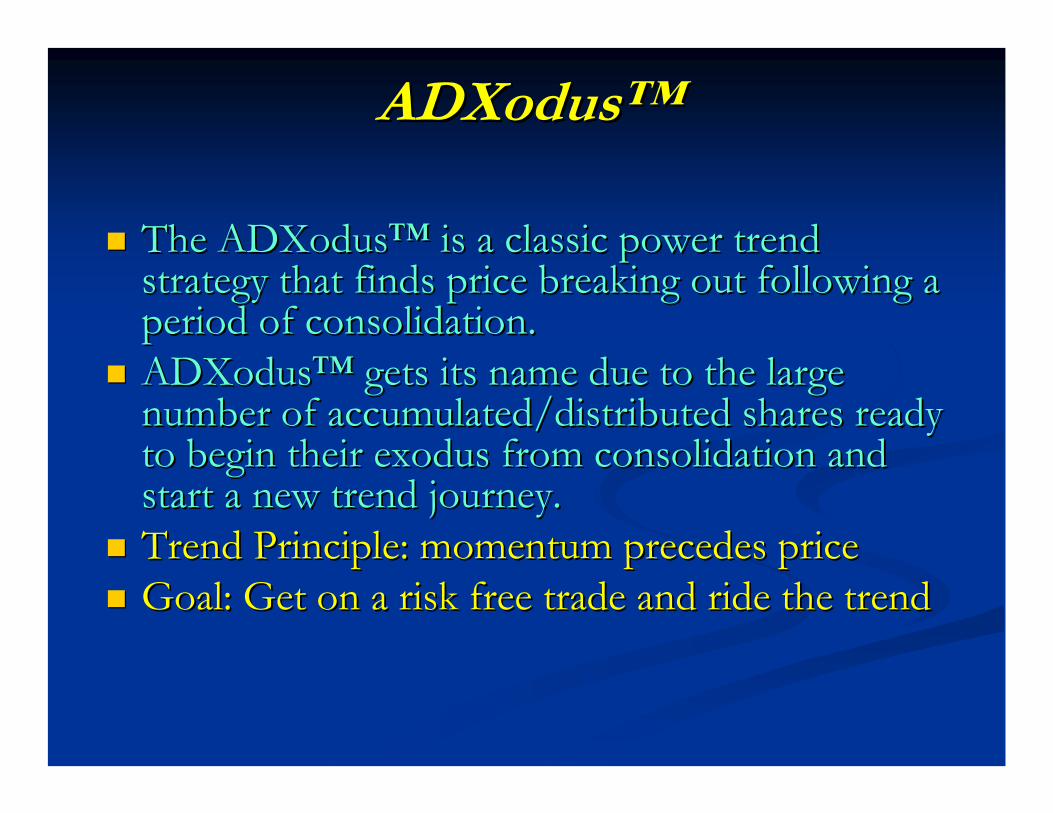
The ADXodusThe ADXodus™™ is a classic power trend is a classic power trend strategy that finds price breaking out following a strategy that finds price breaking out following a period of consolidation. period of consolidation. ADXodusADXodus™™ gets its name due to the large gets its name due to the large number of accumulated/distributed shares ready number of accumulated/distributed shares ready to begin their exodus from consolidation and to begin their exodus from consolidation and start a new trend journey. start a new trend journey. Trend Principle: momentum precedes priceTrend Principle: momentum precedes priceGoal: Get on a risk free trade and ride the trendGoal: Get on a risk free trade and ride the trend

Crossover High (+DMI)Crossover High (+DMI)Change of DominanceChange of Dominance
PRICE

Crossover High (+DMI)Crossover High (+DMI)Change of DominanceChange of Dominance
PRICE

ADXodusADXodus™™ LONG SETUPLONG SETUPPrice has a consolidation period for at least 30 bars (any Price has a consolidation period for at least 30 bars (any timeframe) with a price pattern.timeframe) with a price pattern.ADX is less than 25 during the consolidation (preferably less ADX is less than 25 during the consolidation (preferably less than 15).than 15).Both DMI lines are above ADX prior to the breakout.Both DMI lines are above ADX prior to the breakout.The +DMI makes a crossover high as price breaks the top The +DMI makes a crossover high as price breaks the top trendline.trendline.Price retraces to the 20 EMA and holds (first retracement) Price retraces to the 20 EMA and holds (first retracement) while the +DMI makes a pivot low at or near 25.while the +DMI makes a pivot low at or near 25.Enter long on a price pivot low reversal (up)Enter long on a price pivot low reversal (up)
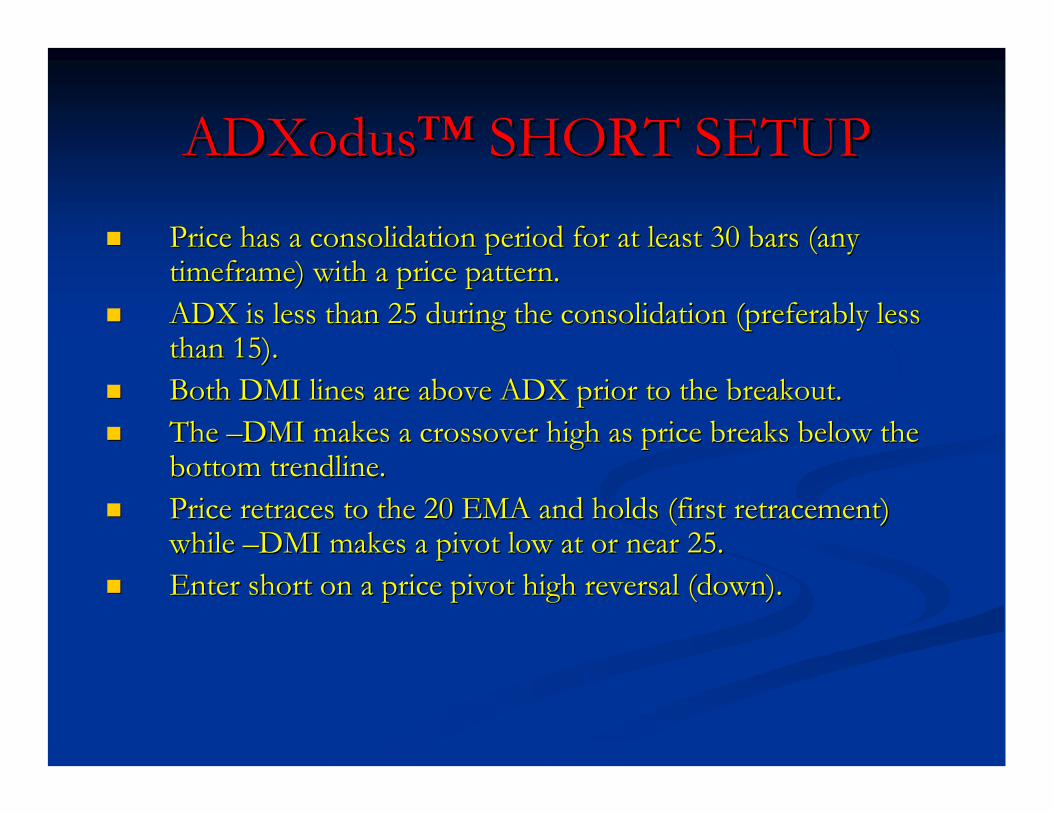
ADXodusADXodus™™ SHORT SETUPSHORT SETUPPrice has a consolidation period for at least 30 bars (any Price has a consolidation period for at least 30 bars (any timeframe) with a price pattern.timeframe) with a price pattern.ADX is less than 25 during the consolidation (preferably less ADX is less than 25 during the consolidation (preferably less than 15).than 15).Both DMI lines are above ADX prior to the breakout.Both DMI lines are above ADX prior to the breakout.The The ––DMI makes a crossover high as price breaks below the DMI makes a crossover high as price breaks below the bottom trendline.bottom trendline.Price retraces to the 20 EMA and holds (first retracement) Price retraces to the 20 EMA and holds (first retracement) while while ––DMI makes a pivot low at or near 25.DMI makes a pivot low at or near 25.Enter short on a price pivot high reversal (down).Enter short on a price pivot high reversal (down).

A Valid Breakout A Valid Breakout is Your Green Flag !is Your Green Flag !


ADXodus (Intraday)ADXodus (Intraday)Trade ManagementTrade Management
Lot = Lot = even # contracts, 4, 8, 10even # contracts, 4, 8, 10Entry:Entry:
Full Lot at 20 EMA pivot lowFull Lot at 20 EMA pivot lowOptional: Optional: ½½ Lot on a new price high after breakout; Lot on a new price high after breakout; then then ½½ lot at 20 MA pivot low if 1lot at 20 MA pivot low if 1stst position position profitableprofitable
Initial Stop: 20 YM Points Initial Stop: 20 YM Points Exit Exit ½½ at entry + 20 points, move stop to at entry + 20 points, move stop to breakevenbreakevenExit Exit ½½ at entry +40 points (or discretionary)at entry +40 points (or discretionary)

ADXodusADXodus

20 MA Entry
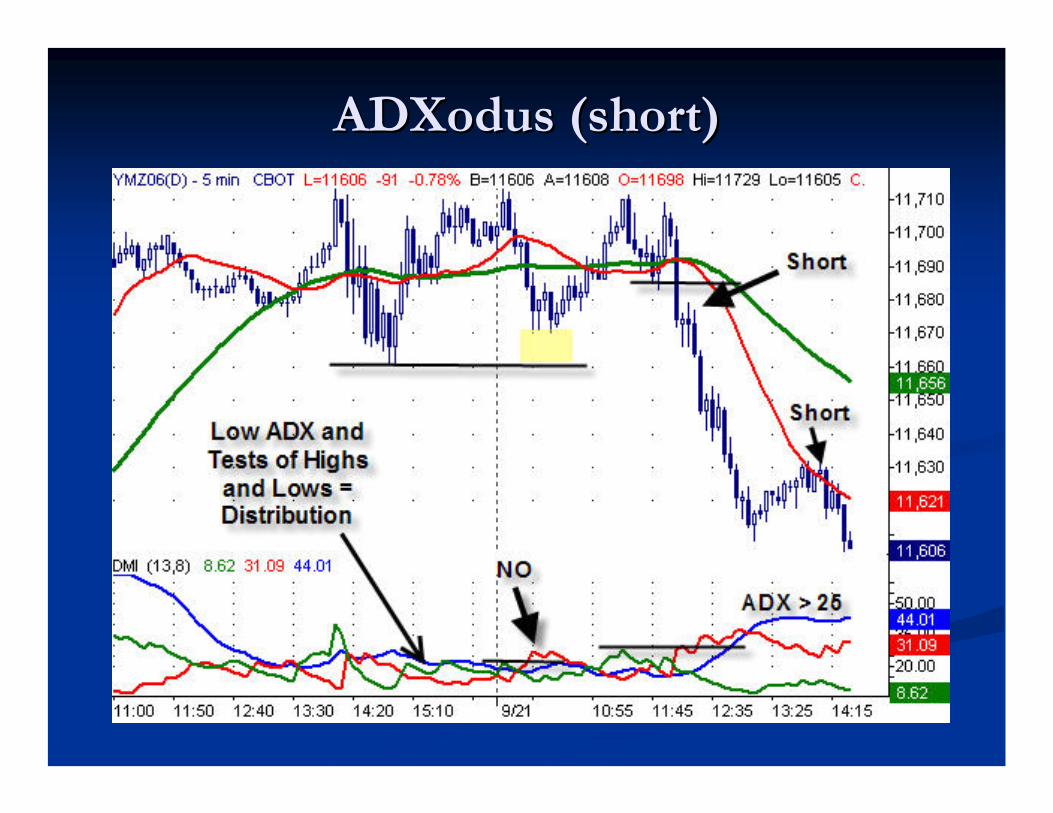
ADXodus (short)ADXodus (short)
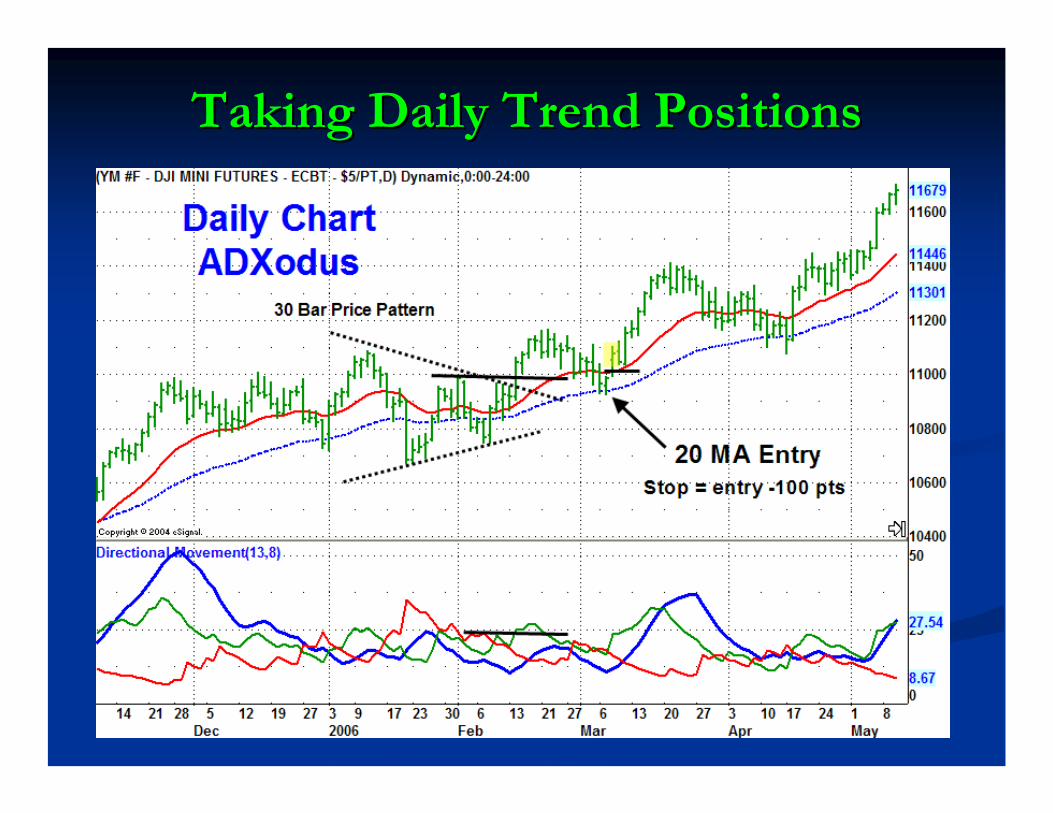
Taking Daily Trend PositionsTaking Daily Trend Positions

ContinuationsContinuations

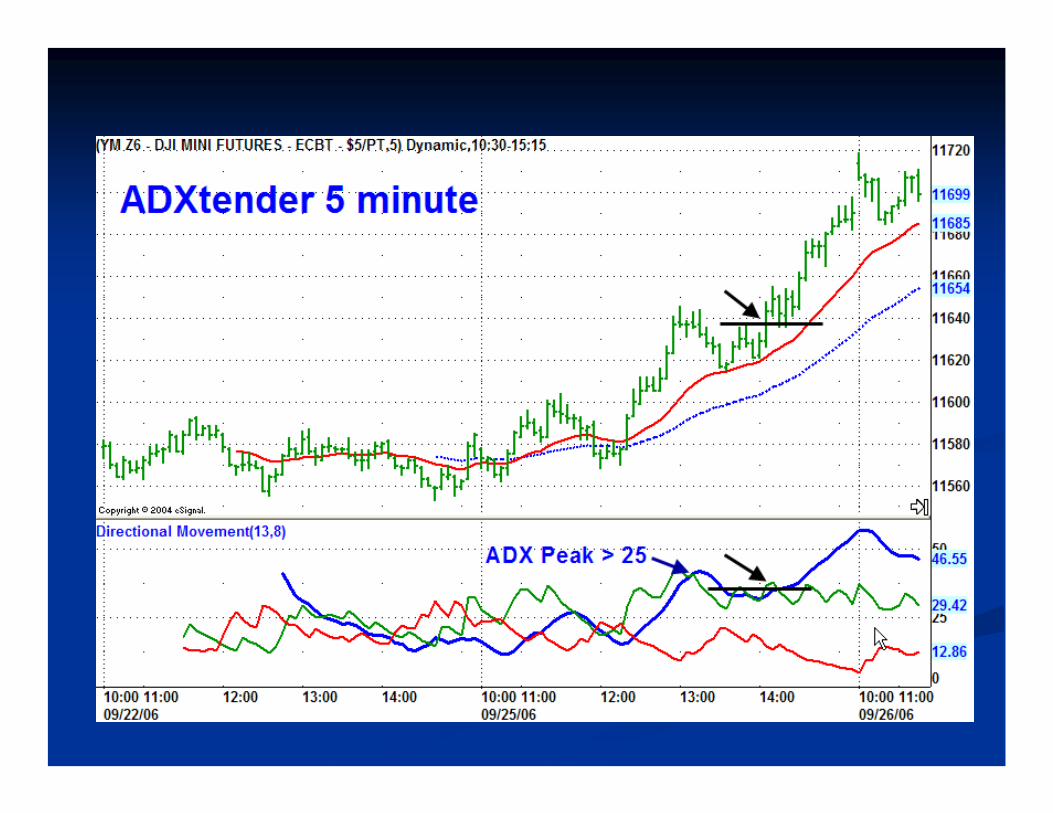
Point #3Point #3Following ADX Peak >25, the Trend is More Following ADX Peak >25, the Trend is More
Likely to Continue Than ReverseLikely to Continue Than Reverse
DMI Continuation High RuleDMI Continuation High RuleDuring a retracement, when DMI dominance is maintained, a During a retracement, when DMI dominance is maintained, a new high in the dominant DMI confirms continuation of the new high in the dominant DMI confirms continuation of the trendtrendNew high New high ––DMI and new low in price, or new high in +DMI DMI and new low in price, or new high in +DMI and a new high in priceand a new high in price
Variation: Cross ADXtenderVariation: Cross ADXtenderDMI lines cross, but there is no change of DMI dominanceDMI lines cross, but there is no change of DMI dominance
ADXtenderADXtender™™
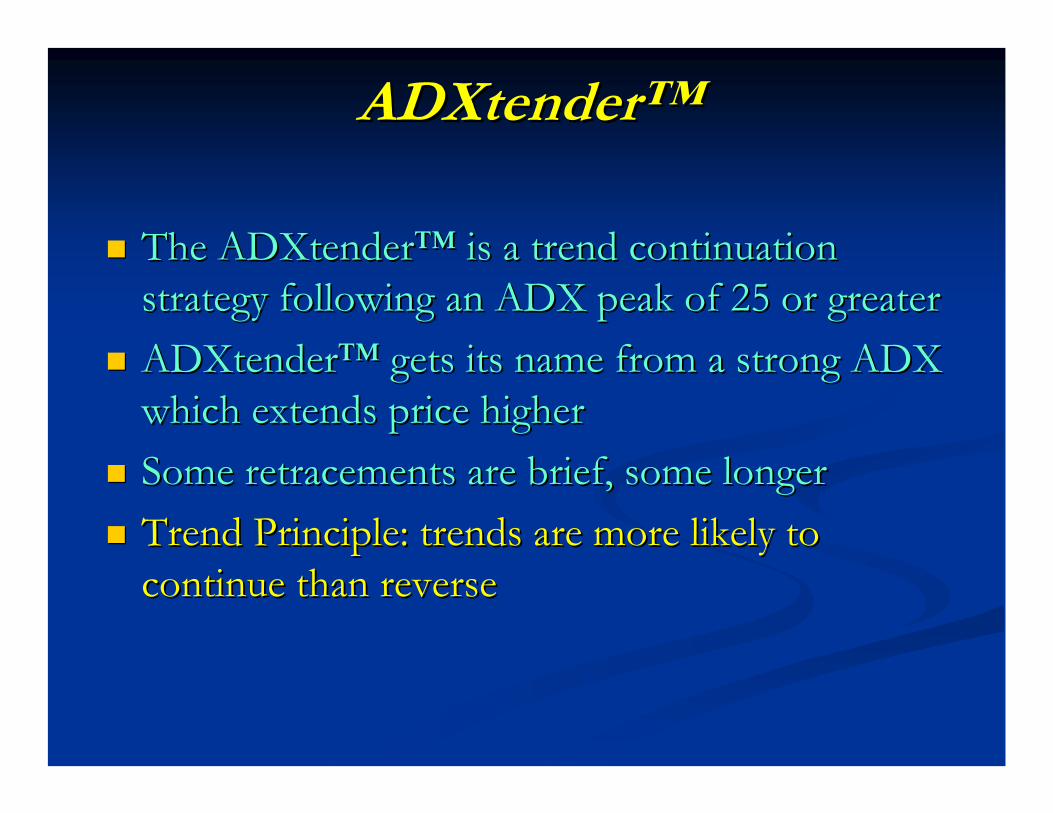
The ADXtenderThe ADXtender™™ is a trend continuation is a trend continuation strategy following an ADX peak of 25 or greaterstrategy following an ADX peak of 25 or greaterADXtenderADXtender™™ gets its name from a strong ADX gets its name from a strong ADX which extends price higherwhich extends price higherSome retracements are brief, some longerSome retracements are brief, some longerTrend Principle: trends are more likely to Trend Principle: trends are more likely to continue than reversecontinue than reverse

ADXtenderADXtender™™ LONG SETUPLONG SETUP
Price makes a new high and ADX rises above 25.Price makes a new high and ADX rises above 25.Price retraces down near the 20 EMA.Price retraces down near the 20 EMA.ADX turns down during the price retracement.ADX turns down during the price retracement.The The ––DMI does not cross +DMI on the retracement.DMI does not cross +DMI on the retracement.Enter long when price makes a new high and +DMI Enter long when price makes a new high and +DMI makes new high.makes new high.
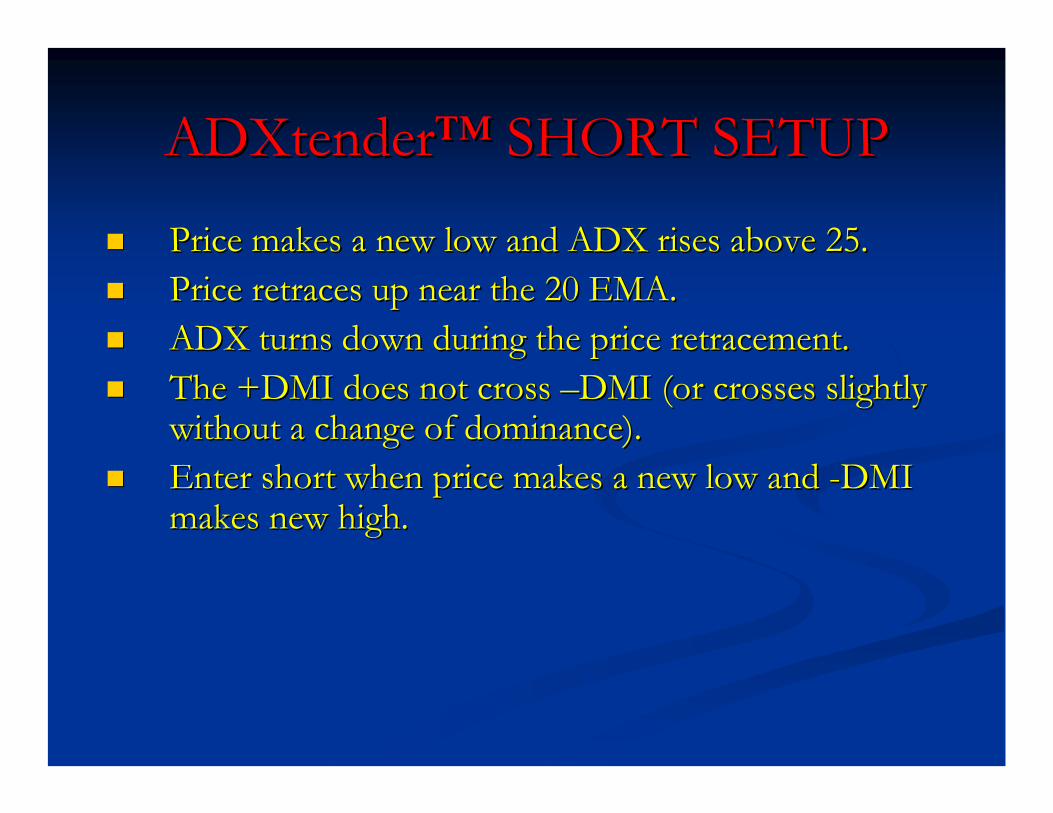
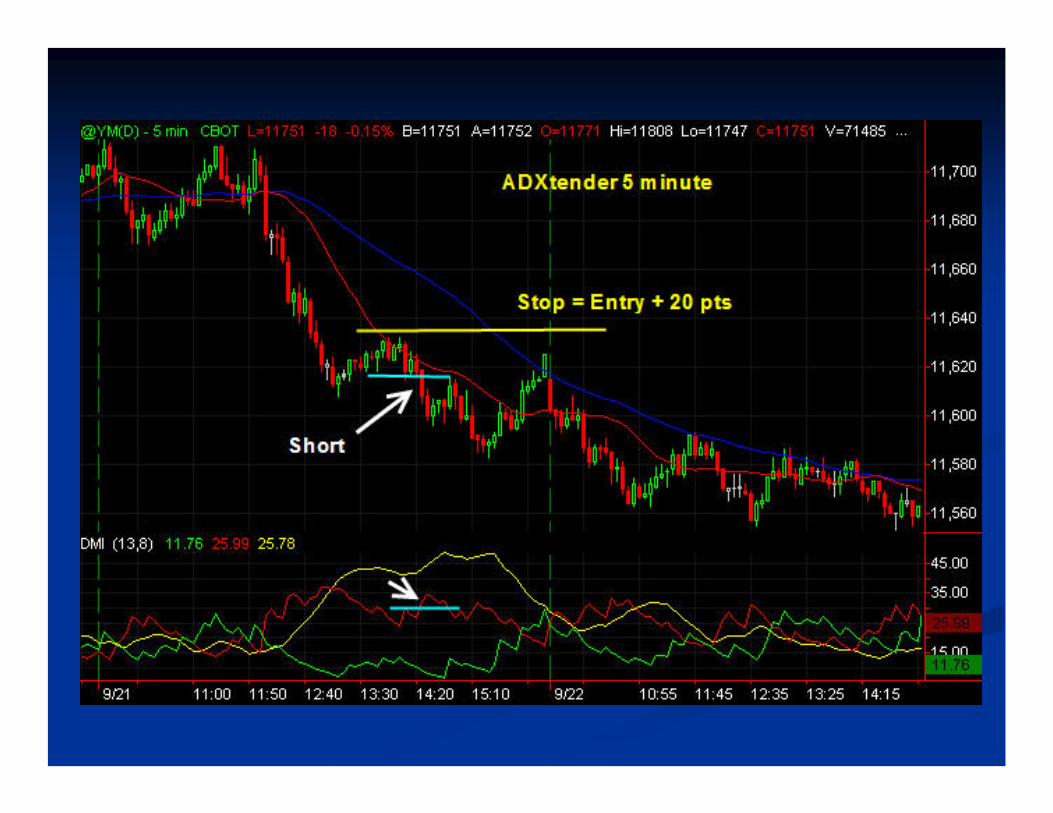
ADXtenderADXtender™™ SHORT SETUPSHORT SETUP
Price makes a new low and ADX rises above 25.Price makes a new low and ADX rises above 25.Price retraces up near the 20 EMA.Price retraces up near the 20 EMA.ADX turns down during the price retracement.ADX turns down during the price retracement.The +DMI does not cross The +DMI does not cross ––DMI (or crosses slightly DMI (or crosses slightly without a change of dominance).without a change of dominance).Enter short when price makes a new low and Enter short when price makes a new low and --DMI DMI makes new high.makes new high.

+DMI Continuation High+DMI Continuation High(ADXtender(ADXtender™™ Signal)Signal)
Price
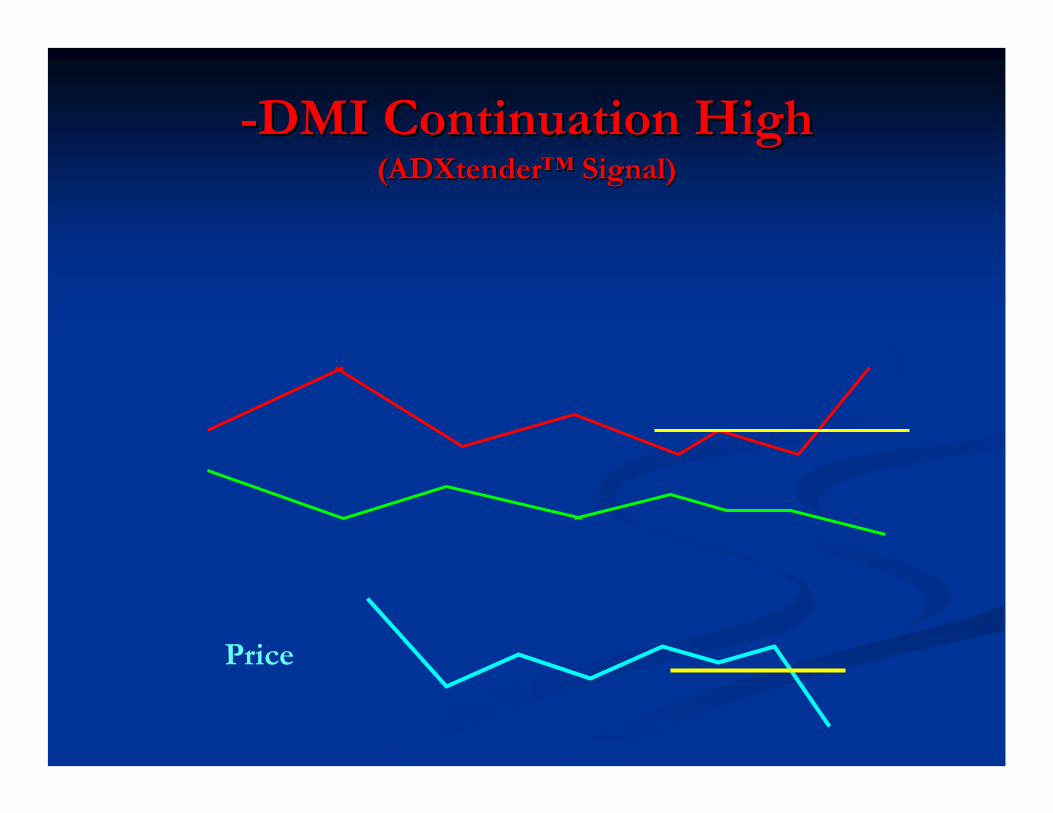
--DMI Continuation HighDMI Continuation High(ADXtender(ADXtender™™ Signal)Signal)
Price
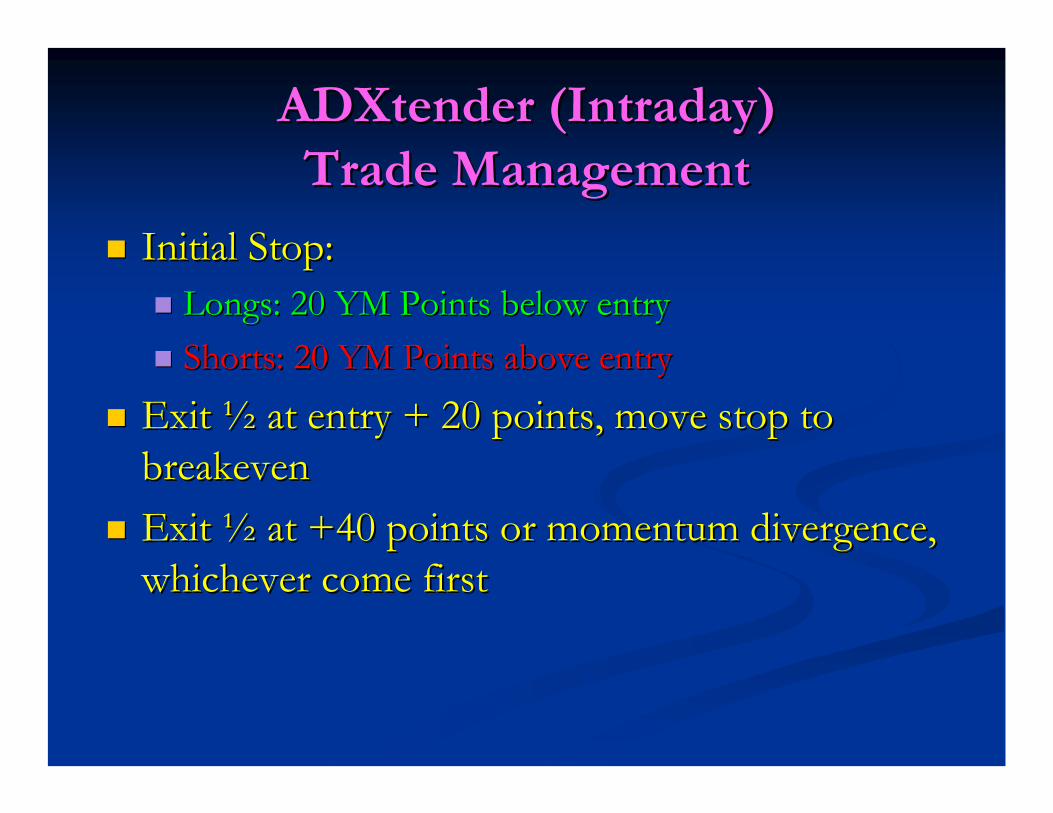
ADXtender (Intraday)ADXtender (Intraday)Trade ManagementTrade Management
Initial Stop: Initial Stop: Longs: 20 YM Points below entryLongs: 20 YM Points below entryShorts: 20 YM Points above entryShorts: 20 YM Points above entry
Exit Exit ½½ at entry + 20 points, move stop to at entry + 20 points, move stop to breakevenbreakevenExit Exit ½½ at +40 points or momentum divergence, at +40 points or momentum divergence, whichever come firstwhichever come first

DonDon’’t Think! Follow Price/DMI Pivotst Think! Follow Price/DMI Pivots
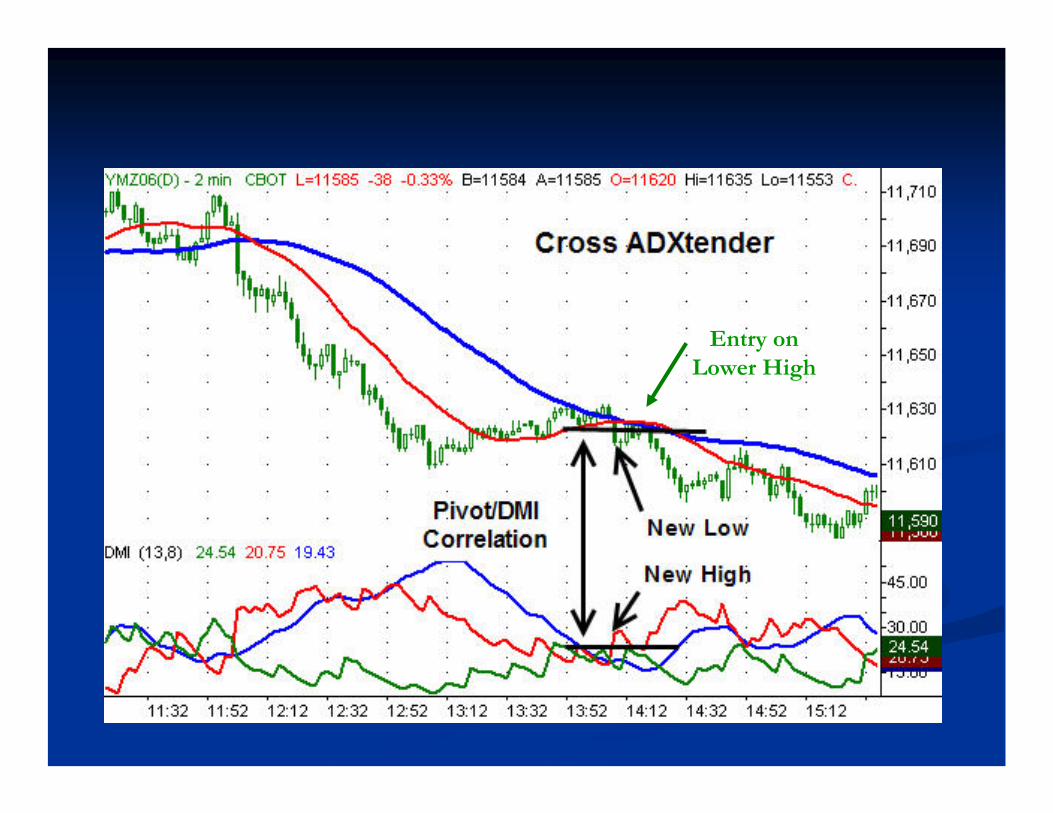
Entry on Lower High

Entry on Higher
Low


XtendedXtended PlayPlay

Point #4Point #4Get Out of a Trend Trade With ADX DivergenceGet Out of a Trend Trade With ADX Divergence
ADX Divergence Rule:ADX Divergence Rule: When ADX is divergent with When ADX is divergent with price, exit part or full positionprice, exit part or full positionMost trading education focuses on making the perfect Most trading education focuses on making the perfect
entryentryExits are harder and more important for profit Exits are harder and more important for profit consistencyconsistency
DDivergenceivergence == DDecisionecisionSell partial position (half) or full exitSell partial position (half) or full exit

ADX DivergencesADX Divergences
Negative ADX Divergence
Positive ADX Divergence
Uptrend
DowntrendPRICE
ADX


Divergence Deception = ClimaxDivergence Deception = Climax
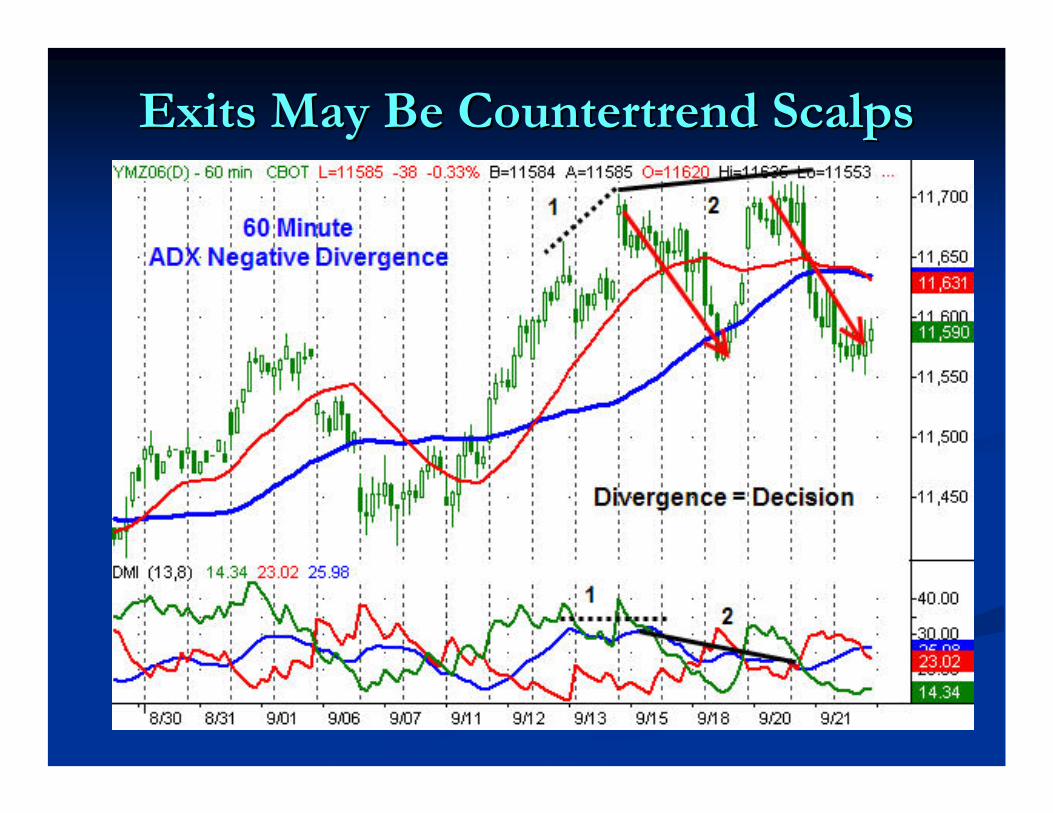
Exits May Be Countertrend ScalpsExits May Be Countertrend Scalps

ReversalsReversals

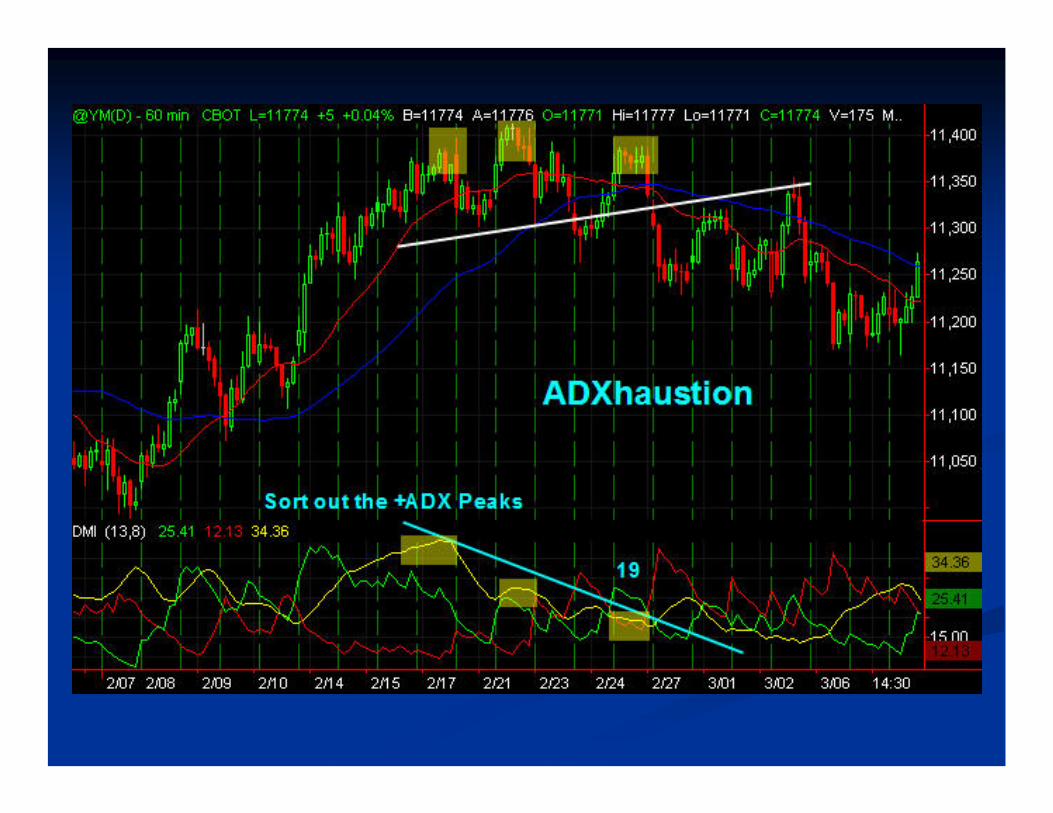
Point #5Point #5ADX Warns a Trend is About to End/ReverseADX Warns a Trend is About to End/Reverse
Declining ADX peaks suggests trend is nearing Declining ADX peaks suggests trend is nearing completioncompletionAn ADX peak of 25 or less often precedes trend An ADX peak of 25 or less often precedes trend reversalsreversalsThe end of a trend is an exit, but not necessarily The end of a trend is an exit, but not necessarily a reversal entrya reversal entry

ADXhaustionADXhaustion™™
The ADXhaustionThe ADXhaustion™™ is a trend reversal strategy is a trend reversal strategy following a series of lower ADX highs, the last following a series of lower ADX highs, the last being 25 or less. being 25 or less. ADXhaustionADXhaustion™™ gets its name from gradual gets its name from gradual price exhaustion at the end of a trendprice exhaustion at the end of a trendPrice is divergent with ADX peaksPrice is divergent with ADX peaksTrend Principle: trends seldom reverse without Trend Principle: trends seldom reverse without warningwarning


ADX Makes You Leader of the PackADX Makes You Leader of the Pack

Have Have ADXADX on Your Dashboard on Your Dashboard When Trading the minWhen Trading the min--sized Dowsized Dow
ADXDMI

Review of TodayReview of Today’’s Pointss Points
Point #1:Point #1: Low ADX PeriodsLow ADX Periods——No Trend TradingNo Trend Trading
Point # 2:Point # 2: Best Trades Begin From Low ADX Best Trades Begin From Low ADX Periods Periods
Point #3:Point #3: Following ADX Peak >25, the Trend is Following ADX Peak >25, the Trend is More Likely to Continue Than ReverseMore Likely to Continue Than Reverse
Point #4:Point #4: Exit a Trend Trade When There Is ADX Exit a Trend Trade When There Is ADX DivergenceDivergence
Point #5:Point #5: ADX Warns a Trend is About to End/Reverse.ADX Warns a Trend is About to End/Reverse.

ADX Basic SignalsADX Basic Signals(Review)(Review)
Short ModeShort ModeADX > 25ADX > 25--DMI above +DMIDMI above +DMI
Scalp ModeScalp ModeADX < 25ADX < 25DMI spikes above 25DMI spikes above 25
Long ModeLong ModeADX > 25ADX > 25+DMI above +DMI above --DMIDMI


Sin City

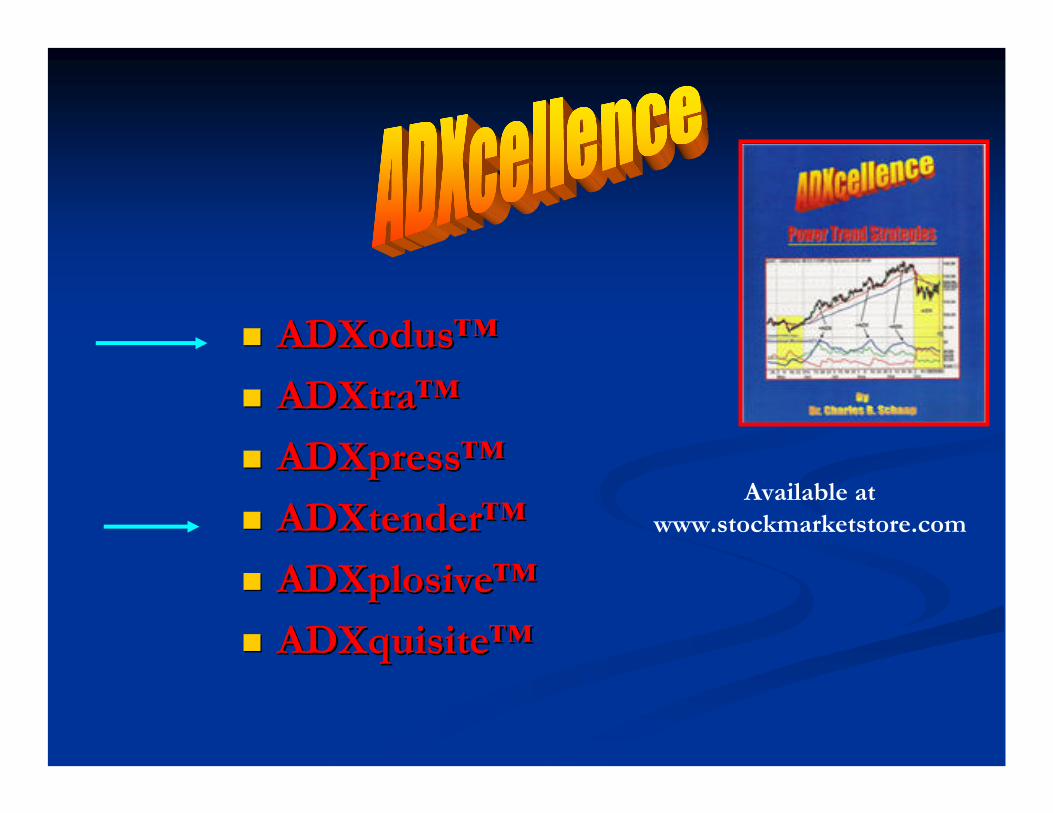
ADXodusADXodus™™
ADXtraADXtra™™
ADXpressADXpress™™
ADXtenderADXtender™™
ADXplosiveADXplosive™™
ADXquisiteADXquisite™™
Available at www.stockmarketstore.com

Chart Study and Free NewsletterChart Study and Free Newsletterwww.adxcellence.comwww.adxcellence.com
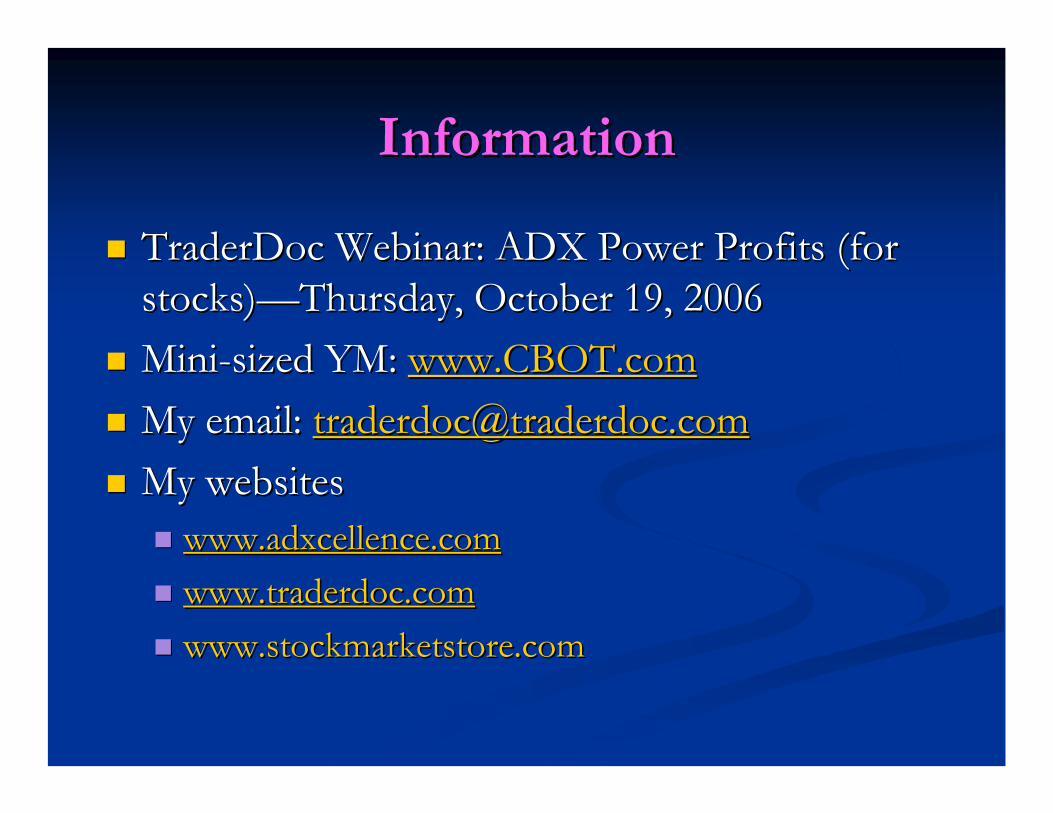
InformationInformation
TraderDoc TraderDoc WebinarWebinar: ADX Power Profits (for : ADX Power Profits (for stocks)stocks)——Thursday, October 19, 2006Thursday, October 19, 2006MiniMini--sized YM: sized YM: www.CBOT.comwww.CBOT.comMy email: My email: [email protected]@traderdoc.comMy websitesMy websites
www.adxcellence.comwww.adxcellence.comwww.traderdoc.comwww.traderdoc.comwww.stockmarketstore.comwww.stockmarketstore.com


May All Your Trades Be ADXcellent!May All Your Trades Be ADXcellent!Thank You.Thank You.