
Using A Buyergraphic Approach To Increase The ROI Of · PDF fileUsing A Buyergraphic Approach...
26
Copyright © 2016 Nielsen Catalina Solutions • Confidential & Proprietary 1 1 Using A Buyergraphic Approach To Increase The ROI Of Your Marketing Spend Todd Morris Karen Fichuk President North America Nielsen John Stermer EVP, Business Development Nielsen Catalina Solutions President Catalina USA
Transcript of Using A Buyergraphic Approach To Increase The ROI Of · PDF fileUsing A Buyergraphic Approach...

Copyright © 2016 Nielsen Catalina Solutions • Confidential & Proprietary 1 1
Using A Buyergraphic Approach To
Increase The ROI Of Your Marketing Spend
Todd Morris Karen Fichuk
President
North America Nielsen
John Stermer
EVP, Business Development
Nielsen Catalina Solutions
President
Catalina USA
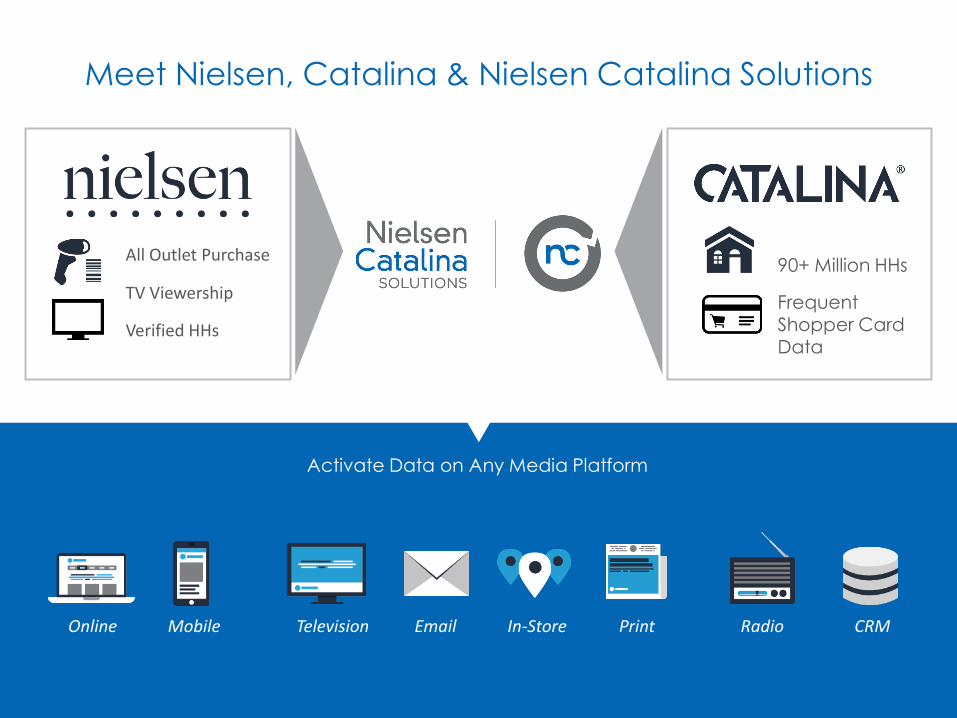
TV Viewership
Online Mobile Television Radio Print Email In-Store
Activate Data on Any Media Platform
Meet Nielsen, Catalina & Nielsen Catalina Solutions
CRM
All Outlet Purchase
Verified HHs
90+ Million HHs
Frequent Shopper Card
Data
Copyright © 2016 Nielsen Catalina Solutions • Confidential & Proprietary 3 3
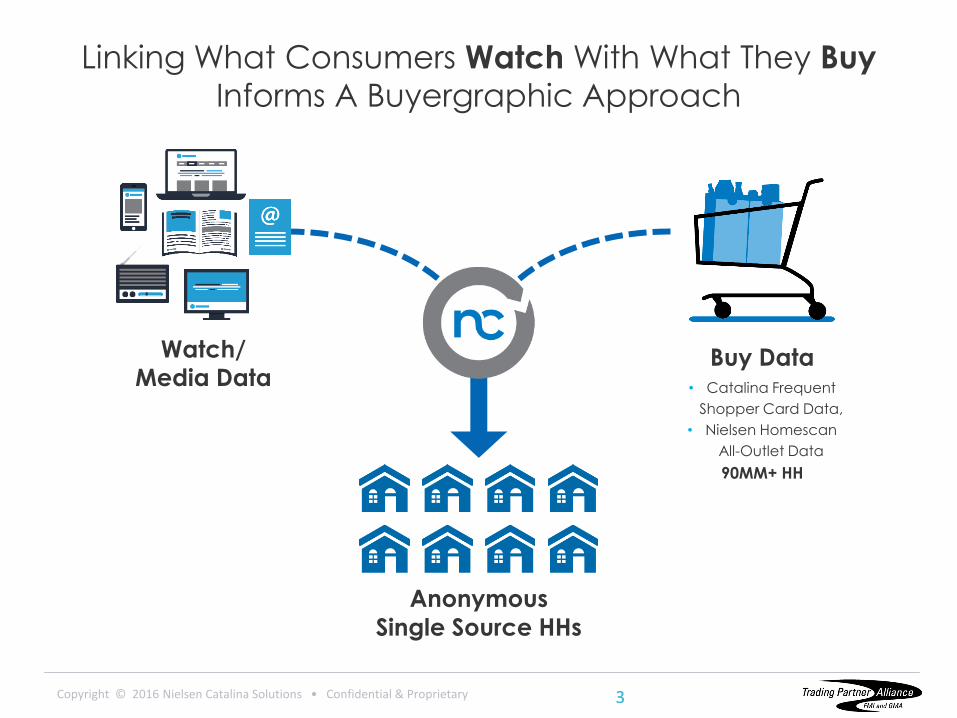
Linking What Consumers Watch With What They Buy
Informs A Buyergraphic Approach
Anonymous
Single Source HHs
Buy Data • Catalina Frequent
Shopper Card Data,
• Nielsen Homescan
All-Outlet Data
90MM+ HH
Watch/ Media Data
What are the current challenges
in the CPG marketplace?

The 2015 Review: How the Top 100 CPG Brands Performed
A
TOUGH
ROAD
TO
GROWTH
Overall, 90 of the Top 100 CPG
brands lost share in 2015
Sales volume declined slightly,
by 0.8 percent
Both gainers and decliners did not
keep pace with category growth

Copyright © 2016 Nielsen Catalina Solutions • Confidential & Proprietary 6 6
Continued Pressure At The
C-Level For Marketing Accountability
Source: The CMO Survey 8/13.
65% of CMOs feel pressure to prove the value of marketing.

What are
Buyergraphics anyway?

Copyright © 2016 Nielsen Catalina Solutions • Confidential & Proprietary 8 8
Audience
Segmentation Ecosystem
Buyergraphics
Define target
audiences and
segments based on
actual retail
purchases.
Demographics
Psychographics Geographics
Buyergraphics

Copyright © 2016 Nielsen Catalina Solutions • Confidential & Proprietary 9 9
Buyergraphics Meet Data Driven Marketing
=
Define
Audience
Increase
Incremental
Sales
Reach Buyers/
Prospects
Increase
ROAS

Why does focusing on
buyers work?

Copyright © 2016 Nielsen Catalina Solutions • Confidential & Proprietary 11 11
Focus Media On Buyers
To Drive Incremental Retail Sales
Brand
Volume
Source: Deconstructing Demographics, Catalina (2012); data and analytics from Nielsen Catalina Solutions
Case Study of 10 CPG brands that spent $415 million on national TV in 2011.
Demo
Target
53% of the brand’s
volume is outside
the demographic
target.

What sales lifts can a typical
brand achieve using this
approach for TV?

Copyright © 2016 Nielsen Catalina Solutions • Confidential & Proprietary 13
* Index of Responsiveness = % Sales Contribution to Total Campaign Response / % Reached Households
Success Story
TV Case Study
Buyergraphic Target Delivers
$36MM More Incremental Sales
Original Target:
Adults 18-34
Buyergraphic Target:
“Heavy Category Buyers”
Increase
Incremental Retail
Sales in MMs $65.4 $101.8 +$36.4
HHs Reached 40% 42% +2%
% Contribution to
Incremental Brand
Sales
45% 70% +25%
Copyright © 2016 Nielsen Catalina Solutions • Confidential & Proprietary 14
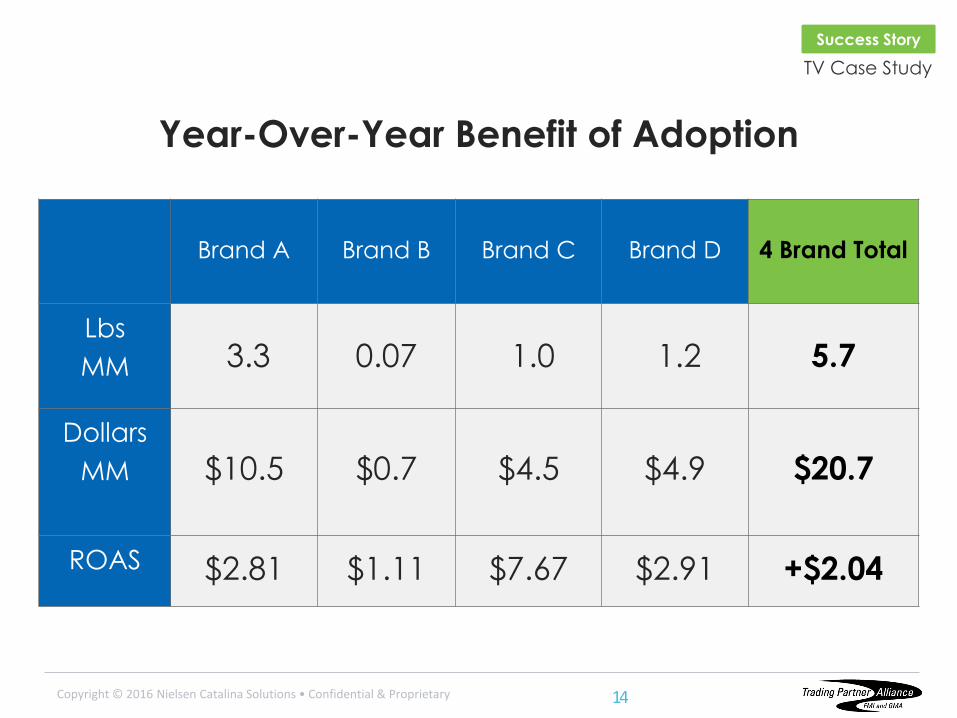
Brand A Brand B Brand C Brand D
4 Brand Total
Lbs
MM 3.3 0.07 1.0 1.2
5.7
Dollars
MM $10.5 $0.7 $4.5 $4.9
$20.7
ROAS $2.81 $1.11 $7.67 $2.91 +$2.04
Year-Over-Year Benefit of Adoption
Success Story
TV Case Study

What ROAS can I expect by using
Buyergraphic Targeting for Digital?

Copyright © 2016 Nielsen Catalina Solutions • Confidential & Proprietary 16
Source: Nielsen Catalina Solutions CPG Benchmarks; over 2,200 studies from
2004 – Q2 2015 for Digital Ads. Copyright 2015 © Nielsen Catalina Solutions
+53%
Merch Food Pet Beverage
CPG Benchmarks 2,200+ Digital Studies
HBA
+46%
+26%
+17%
+7%
With NCS Buyergraphic Targeting
Non-NCS Targeting
CPG ROAS by Category Average ROAS
$2.47
$2.93

Is all big data the same?
How much is enough?
How do I make it actionable?
Is my data measureable?

Copyright © 2016 Nielsen Catalina Solutions • Confidential & Proprietary 18
Retail
Sales Data
+
Advanced
Methodology
=
Smart
Decisions
Not All Created Equal

What’s an example of
Buyergraphics in action?

Copyright © 2016 Nielsen Catalina Solutions • Confidential & Proprietary 20
$167MM 27% Opportunity to get
Neutrogena Shoppers to
buy in one more segment
Of Neutrogena Consumers buy more
than 1 Brand Segment
Activated against consumers
that put on NEUTROGENA Make
Up and wipe it off with a
Competitive Remover
Drove Consumers Cross Segment
- $5.84 ROAS
- $4.7MM in Inc. Sales
How did we help? What did we deliver?
Case Study: Neutrogena
Channel: Mobile & Desktop
Success Story

Buyergraphics Drive Results
Data: Quality & Scale Matters
Measure Incremental Sales
Break Through Barriers

Change Your
Mindset

Thank You
Todd Morris
Karen Fichuk
President, North America Nielsen
Email: [email protected]
Twitter: @nielsen
John Stermer
EVP, Business Development
Nielsen Catalina Solutions
Email: [email protected]
Twitter: @NCSolutions
President, Catalina USA
Email: [email protected]
Twitter: @Catalina

Q & A

Old School --- show of hands!
The following are some potential questions
that Karen could ask to engage the audience


