USGS Hurricane Response Met Challenges in 2017, Prepares ... · Cassi Crow, USGS. José...
11
U.S. Department of the Interior U.S. Geological Survey Cover Story https://soundwaves.usgs.gov/ U.S. Department of the Interior U.S. Geological Survey Cover Story Sound Waves Volume FY 2018, Issue No. 178 June 2018 USGS Hurricane Response Met Challenges in 2017, Prepares for 2018 By Heather Dewar An average hurricane season produces 12 named storms with winds of 39 miles per hour or higher, including six hur- ricanes, and three major hurricanes of Category 3, 4, or 5. For 2018, the NOAA forecast calls for 10 to 16 named storms, including five to nine hurricanes and one to four major hurricanes. The forecast comes in the wake of the challenging 2017 hurricane season, when the USGS mounted a months-long ef- fort to gather scientific information that helped protect lives and property. Not long after Hurricane Nate—the last hur- ricane of 2017 to make a U.S. landfall— disintegrated over Alabama on October 8, the agency’s coastal storm-response lead- ers began preparing for the 2018 season “The USGS’ response to five major hurricanes in 2017 was impressive,” said Jim Reilly, who was sworn in as direc- tor of the USGS on May 14. “USGS employees demonstrated their scientific expertise, creative problem-solving skills, and dedication. We are all hoping for a calmer 2018, but if it isn’t, we’ll be ready to provide the best possible sci- ence to local, state and federal officials and local residents. We will, as always, be ready to provide the data allowing the best possible decisions on response and recovery and to continue the ongo- ing effort to make communities safer and more resilient.” The USGS is phasing in innovations to make its hurricane response even more ef- fective this year, said Athena Clark, the USGS science advisor for the Southeast Region and the bureau’s Coastal Storm Response Team leader. “We work throughout the year in an- ticipation of hurricane season,” Clark said. “We are constantly working to hone our skills and improve technology, with USGS hydrologic technicians Alec MacDonald and Rogelio Hernandez measure floodwaters caused by Hurricane Harvey in Peach Creek at Highway 90 near Waelder, Texas. Photo credit: Cassi Crow, USGS. José Santiago-Saez, USGS Hydrologic Techni- cian, installs a storm-tide sensor in Fajardo, Puerto Rico, before Hurricane Maria made landfall. the goal that every time we respond to a storm, the results get better and better.” 2017 Records Set and Challenges Met With 17 named storms, the 2017 season was the most active since 2005 and the seventh most active on record, based on preliminary measurements of the com- bined strength and duration of the year’s tropical storms and hurricanes. The 2017 season saw about 350 USGS scientists and staff respond to five major hurricanes that affected the U.S. mainland and islands. For two solid months, USGS crews were in the field daily in storm-threatened or storm-ravaged parts of the country, from Texas to Massachusetts, and in Puerto Rico and the U.S. Virgin Islands. USGS crews made more than 400 special mea- surements of river and stream flow, col- lected evidence of floodwater height and extent at 1,939 sites, and documented more than 75 instances when hurricane- swollen rivers and streams reached the highest water levels on record for those sites. In the days before Hurricanes Harvey, Irma, Jose, Maria, and Nate were pre- dicted to make landfall, USGS hydrolo- gists deployed water-level and weather- measuring instruments that are vital to coastal storm surge, erosion, and flooding forecasts. As soon as each storm passed, crews fanned out to document high-water events, and to take measurements of riv- ers overflowing their banks and reservoirs overfilled by record-breaking rain—work that helps emergency officials successfully manage potentially deadly floodwaters. Coastal erosion experts posted 25 sepa- rate forecasts identifying where beaches along the Atlantic and Gulf coasts were at risk of dune erosion, overwashing or (Hurricane Response continued on page 2)
Transcript of USGS Hurricane Response Met Challenges in 2017, Prepares ... · Cassi Crow, USGS. José...
U.S. Department of the InteriorU.S. Geological Survey
Cover Story
https://soundwaves.usgs.gov/
U.S. Department of the InteriorU.S. Geological Survey
Cover Story
Sound Waves Volume FY 2018, Issue No. 178June 2018
USGS Hurricane Response Met Challenges in 2017, Prepares for 2018By Heather Dewar
An average hurricane season produces 12 named storms with winds of 39 miles per hour or higher, including six hur-ricanes, and three major hurricanes of Category 3, 4, or 5. For 2018, the NOAA forecast calls for 10 to 16 named storms, including five to nine hurricanes and one to four major hurricanes.
The forecast comes in the wake of the challenging 2017 hurricane season, when the USGS mounted a months-long ef-fort to gather scientific information that helped protect lives and property. Not long after Hurricane Nate—the last hur-ricane of 2017 to make a U.S. landfall—disintegrated over Alabama on October 8, the agency’s coastal storm-response lead-ers began preparing for the 2018 season
“The USGS’ response to five major hurricanes in 2017 was impressive,” said Jim Reilly, who was sworn in as direc-tor of the USGS on May 14. “USGS employees demonstrated their scientific expertise, creative problem-solving skills, and dedication. We are all hoping for a calmer 2018, but if it isn’t, we’ll be ready to provide the best possible sci-ence to local, state and federal officials and local residents. We will, as always, be ready to provide the data allowing the best possible decisions on response and recovery and to continue the ongo-ing effort to make communities safer and more resilient.”
The USGS is phasing in innovations to make its hurricane response even more ef-fective this year, said Athena Clark, the USGS science advisor for the Southeast Region and the bureau’s Coastal Storm Response Team leader.
“We work throughout the year in an-ticipation of hurricane season,” Clark said. “We are constantly working to hone our skills and improve technology, with
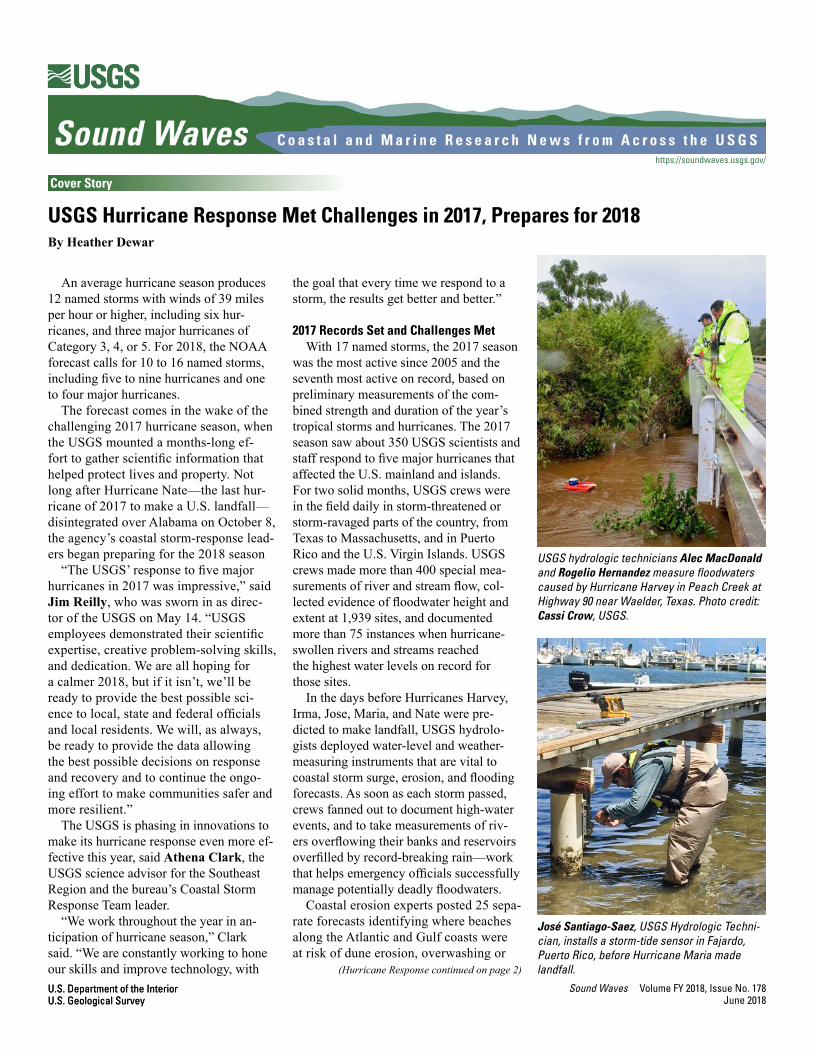
USGS hydrologic technicians Alec MacDonald and Rogelio Hernandez measure floodwaters caused by Hurricane Harvey in Peach Creek at Highway 90 near Waelder, Texas. Photo credit: Cassi Crow, USGS.
José Santiago-Saez, USGS Hydrologic Techni-cian, installs a storm-tide sensor in Fajardo, Puerto Rico, before Hurricane Maria made landfall.
the goal that every time we respond to a storm, the results get better and better.”
2017 Records Set and Challenges MetWith 17 named storms, the 2017 season
was the most active since 2005 and the seventh most active on record, based on preliminary measurements of the com-bined strength and duration of the year’s tropical storms and hurricanes. The 2017 season saw about 350 USGS scientists and staff respond to five major hurricanes that affected the U.S. mainland and islands. For two solid months, USGS crews were in the field daily in storm-threatened or storm-ravaged parts of the country, from Texas to Massachusetts, and in Puerto Rico and the U.S. Virgin Islands. USGS crews made more than 400 special mea-surements of river and stream flow, col-lected evidence of floodwater height and extent at 1,939 sites, and documented more than 75 instances when hurricane-swollen rivers and streams reached the highest water levels on record for those sites.
In the days before Hurricanes Harvey, Irma, Jose, Maria, and Nate were pre-dicted to make landfall, USGS hydrolo-gists deployed water-level and weather-measuring instruments that are vital to coastal storm surge, erosion, and flooding forecasts. As soon as each storm passed, crews fanned out to document high-water events, and to take measurements of riv-ers overflowing their banks and reservoirs overfilled by record-breaking rain—work that helps emergency officials successfully manage potentially deadly floodwaters.
Coastal erosion experts posted 25 sepa-rate forecasts identifying where beaches along the Atlantic and Gulf coasts were at risk of dune erosion, overwashing or
(Hurricane Response continued on page 2)

2June 2018 Sound Waves
CHECK STORIES FOR HYPERLINKS!!!!
inundation (see https://coastal.er.usgs.gov/hurricanes/coastal-change/). And after Hurricane Maria devastated Puerto Rico, USGS landslide experts traveled more than 600 miles overland across the island’s mountains and conducted helicopter surveys to assess the extent and effects of landslides. Meanwhile, geospatial scientists marshalled USGS data-gathering and mapping expertise to provide the National Guard and other first responders with maps packed with infor-mation about the island’s topography and infrastructure.
“USGS’ response to those five hurri-canes was phenomenal,” Clark said. “Our agency and our employees were taxed, but people in other government agencies and the public could see that we were able to rise to the occasion.”
The agency is ready to do so again, Clark said. Here is the process that will unfold if a major hurricane threatens a landfall on the U.S. coast, or if especially vulnerable resources or areas lie in a weaker storm’s forecast path.
2018: Preparing for a LandfallTo prepare for landfall of a major storm,
USGS crews deploy in advance to position special storm-tide sensors that can mea-sure the height, extent, and timing of the tide pushed ashore by the hurricane. The storm-tide sensors, housed in vented steel pipes a few inches wide and about a foot
Cover Story
Cover Story, continued
long, are part of the USGS Storm Tide Monitoring Network.
Designed for quick installation on bridg-es, piers, and other structures that have a good chance of surviving a hurricane, they collect water-pressure readings that help de-fine the depth and duration of a storm tide, the time it arrives, and its retreat. That infor-mation helps officials assess storm damage, tell the difference between wind and flood damage, and improve computer models for forecasting effects of future storms.
New Sites Will Provide New InsightsThis year, for the first time, those storm-
tide sensors will be deployed to sites that have been selected at the start of the sea-son, along the coast from the Carolinas to Texas. Based on a similar network of sites put in place in the mid-Atlantic and North-east after Hurricane Sandy, the Southeast and Gulf Coast sites were chosen in part for their ability to withstand a storm and in part because wherever storm-tide sen-sors have been placed in the past, new data from those sites are especially valuable.
“It’s critical to be able to monitor at the same locations for different hurricanes,” Clark said. “Being able to see the differ-ence in impact between a Category 1 and a Category 5 is valuable information that can improve our ability to predict what future storm tides will do.”
Some of the permanently designated sites “are strung like pearls along the
(Hurricane Response continued from page 1)
(Hurricane Response continued on page 3)
Sound Waves
Editor Jolene Gittens
St. Petersburg, Florida Telephone: 727-502-8038
E-mail: [email protected] Fax: 727-502-8182
Assistant Editor Laura Torresan
Santa Cruz, California Telephone: 831-460-7468
E-mail: [email protected] Fax: 831-427-4748
Print & Web Layout Editor Betsy Boynton
St. Petersburg, Florida Telephone: 727-502-8118
E-mail: [email protected] Fax: (727) 502-8182
SOUND WAVES (WITH ADDITIONAL LINKS) IS AVAILABLE ONLINE AT URL
https://soundwaves.usgs.gov/
Submission Guidelines
Deadline: The deadline for news items and publication lists for the 179th issue of Sound Waves is Wednesday, July 18, 2018.Publications: When new publications or products are released, please notify the editor with a full reference and a bulleted summary or description.Images: Please submit all images at publica-tion size (column, 2-column, or page width). Resolution of 200 to 300 dpi (dots per inch) is best. Adobe Illustrator© files or EPS files work well with vector files (such as graphs or diagrams). TIFF and JPEG files work well with raster files (photographs or rasterized vec-tor files).
Any use of trade, firm, or product names is for descriptive purposes only and does not imply endorsement by the U.S. Government.
U.S. Geological Survey Earth Science Information Sources: Need to find natural-science data or information? Visit the USGS Frequently Asked Questions (FAQ’s) at URL https://www.usgs.gov/faq/
Can’t find the answer to your question on the Web? Call 1-888-ASK-USGS
Want to send your question to the USGS? Fill out the form here: https://answers.usgs.gov/cgi-bin/gsanswers?tmplt=4
USGS Coastal Change Hazards Portal—Hurricane Irma.
Contents
Cover Story 1News Briefs 5Research 7Fieldwork 8Awards 9Staff and Center News 10Publications 11
3 Sound Waves June 2018
CHECK STORIES FOR HYPERLINKS!!!!
Cover Story, continued
Cover Story
(Hurricane Response continued from page 2)
(Hurricane Response continued on page 4)
coast” roughly five miles apart, Clark said. Others are set in straight lines or transects running inland so they can record how the storm tide changes as it moves away from shore.
The team also decides whether to sup-plement flood information from the USGS network of more than 8,200 permanent stream gauges by setting out specially de-signed rapid-deployment gauges in areas where flooding is likely, but no gauge is already in place. Data from the stream-gauge network helps the National Weather Service develop flood forecasts, the U.S. Army Corps of Engineers make flood control decisions, and local agencies plan their emergency response.
Forecasting Coastal ChangeResearch scientists at the USGS St.
Petersburg Coastal and Marine Science Center have developed a sophisticated computer model that provides detailed predictions of likely effects of a hurricane on sand dunes and other coastal features. The coastal change hazard forecast model covers the Atlantic and Gulf Coast regions where storm effects are expected, making predictions at one-kilometer intervals. Its forecasts predict where protective sand dunes are likely to be eroded at their bases or overtopped by storm waves, and where coastal areas behind the dunes could be inundated by seawater.
The forecasts can help emergency managers decide which areas to evacuate, which roads to use, and where to position equipment for post-storm clean-up. The forecasts begin 48 hours before a storm is expected to make landfall, are updated based on the latest forecasts from the Na-tional Hurricane Center, and are available to the public at the USGS Coastal Change Hazards Portal (see https://marine.usgs.gov/coastalchangehazardsportal/).
Working with the National Weather Ser-vice, the St. Petersburg-based team has also developed a forecast viewer that is updated several times a day, with real-time water levels from the weather service’s Near-shore Wave Prediction System. The Total Water Level and Coastal Change Forecast Viewer (see https://coastal.er.usgs.gov/hurricanes/research/twlviewer) currently
covers selected areas from Florida through Maine, totaling about 1,865 miles (3,000 kilometers) of coastline. Ultimately it will include the entire U.S. coastline. The viewer predicts the timing and magnitude of water levels at the shoreline, as well as potential impacts to coastal dunes. NOAA will use the viewer’s predictions to help in-form forecasters at the National Hurricane Center, and will also make the predictions available to meteorologists at selected Na-tional Weather Service forecasting offices.
During the Storm: Monitoring FloodsHurricane rains can cause flooding far
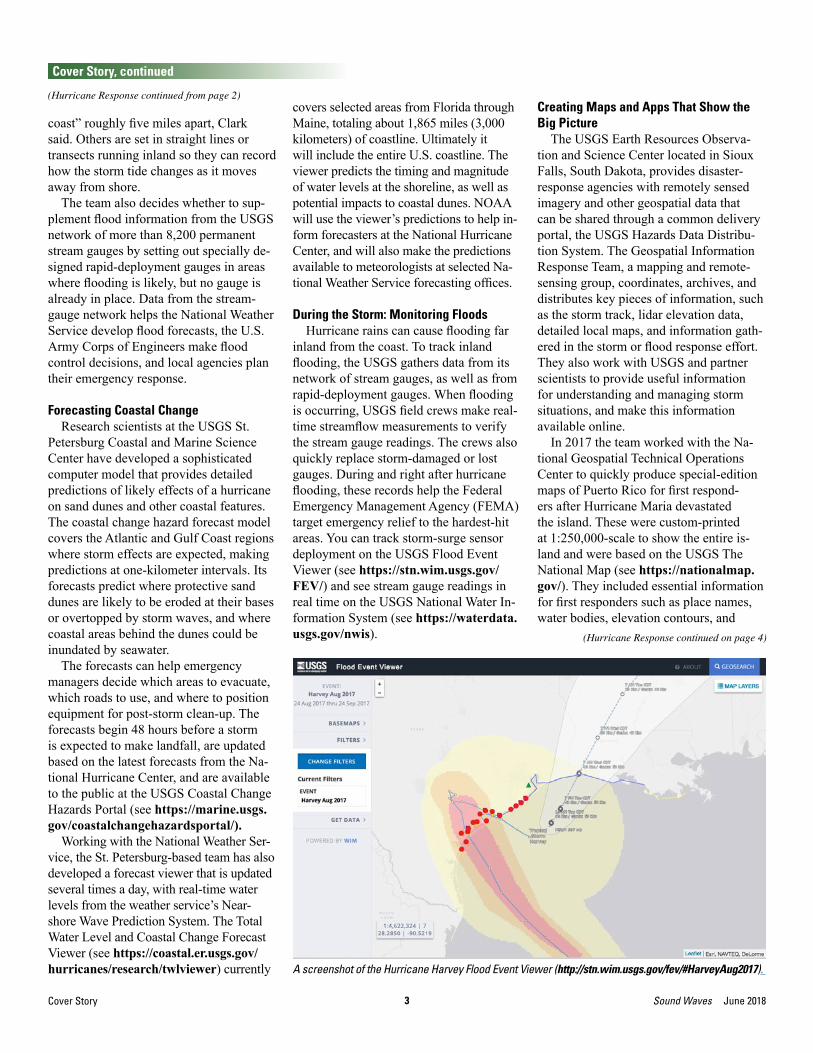
inland from the coast. To track inland flooding, the USGS gathers data from its network of stream gauges, as well as from rapid-deployment gauges. When flooding is occurring, USGS field crews make real-time streamflow measurements to verify the stream gauge readings. The crews also quickly replace storm-damaged or lost gauges. During and right after hurricane flooding, these records help the Federal Emergency Management Agency (FEMA) target emergency relief to the hardest-hit areas. You can track storm-surge sensor deployment on the USGS Flood Event Viewer (see https://stn.wim.usgs.gov/FEV/) and see stream gauge readings in real time on the USGS National Water In-formation System (see https://waterdata.usgs.gov/nwis).
Creating Maps and Apps That Show the Big Picture
The USGS Earth Resources Observa-tion and Science Center located in Sioux Falls, South Dakota, provides disaster-response agencies with remotely sensed imagery and other geospatial data that can be shared through a common delivery portal, the USGS Hazards Data Distribu-tion System. The Geospatial Information Response Team, a mapping and remote-sensing group, coordinates, archives, and distributes key pieces of information, such as the storm track, lidar elevation data, detailed local maps, and information gath-ered in the storm or flood response effort. They also work with USGS and partner scientists to provide useful information for understanding and managing storm situations, and make this information available online.
In 2017 the team worked with the Na-tional Geospatial Technical Operations Center to quickly produce special-edition maps of Puerto Rico for first respond-ers after Hurricane Maria devastated the island. These were custom-printed at 1:250,000-scale to show the entire is-land and were based on the USGS The National Map (see https://nationalmap.gov/). They included essential information for first responders such as place names, water bodies, elevation contours, and
A screenshot of the Hurricane Harvey Flood Event Viewer (http://stn.wim.usgs.gov/fev/#HarveyAug2017).

4June 2018 Sound Waves
CHECK STORIES FOR HYPERLINKS!!!!
Cover Story, continued
Cover Story
transportation networks. US Topo maps, produced nationwide at a scale of 1:24,000 and maintained on a 3-year schedule, were also printed and distributed to first responders for the 2017 hurricane season. Maps derived from The National Map “are the only high-quality, consistent, nation-ally standardized map series available that can be used to support disaster response,” said Lance Clampitt, emergency response coordinator for the National Geospatial Program. The team is ready to produce similar maps during the 2018 season.
After the Storm: Repairing, Recovering, Recording Effects
As soon as it is safe to do so, USGS crews head into the field in flood-impacted areas to determine and document the ex-tent of flooding. They do this by making in-the-field observations of water heights and flows, and by flagging and surveying high-water marks on buildings, bridges, embankments, and trees. High-water marks are seeds and other debris left be-hind by floodwaters, recording their extent and depth. FEMA uses this and related information to steer relief to areas of greatest need.
After hurricanes, crews typically must repair or replace some storm-damaged, lost, or destroyed gauges. Wherever flood-ing occurred that went unmeasured be-cause of a lost or damaged stream gauge, the crews develop indirect measurements of the water flow, using the highest high-water mark at that site. A computer model uses detailed information about the shape, depth, and geology of the stream, along with information about past floods at that site, to determine how much water flow it would take to create a flood matching the one recorded by the high-water mark.
After a hurricane strike on a U.S. sandy shoreline, the Coastal Change Hazards storm team uses NOAA satellite imagery to assess the impact of storm surge and waves. These NOAA images document changes to the coast after the storm, help-ing the USGS fine-tune its coastal change forecasting model. In 2017 the hazards team conducted pre- and post-storm photo comparisons for Hurricanes Harvey, Irma, and Nate. The team also collected lidar data along Florida beaches affected by Hurricane Irma, combining that informa-tion with some ground and drone surveys and high-angle oblique photos provided by NOAA to study storm-related changes to Florida beaches in detail.
The USGS is even prepared to help land managers cope with one of the unex-pected consequences of hurricane-related flooding: the spread of non-native aquatic species carried along by floodwaters into areas they normally cannot reach. Some non-native plants and animals have the po-tential to become invasive, out-competing
native species and causing them to disap-pear. Others can inflict physical damage on vulnerable ecosystems. After a hur-ricane, land managers coping with a range of issues are hard-pressed to track down and control these incursions.
In a pioneering effort in 2017, the USGS Non-Indigenous Aquatic Species Program developed special sets of search-able maps (see https://nas.er.usgs.gov/viewer/Flooding/) showing the areas that were flooded by Hurricanes Harvey, Irma, Maria, and Nate, and the non-native species that could potentially have been spread by each storm’s floodwaters. The maps allow land managers to narrow down areas of potential non-native species introductions and plan early campaigns to control their spread. The U.S. Fish and Wildlife Service has used them at some national wildlife refuges where hurricane floodwaters spread in 2017, and scientists with the Non-Indigenous Aquatic Species Program plan to produce similar maps, if needed, in 2018.
Recovering and RebuildingMeanwhile, the work of repairing and
rebuilding in the aftermath of 2017 contin-ues. Congress has appropriated about $37 million for hurricane-related expenditures in Puerto Rico, Florida, and other parts of the U.S. affected by hurricane strikes in 2017. The money allocated to the USGS includes funding for several projects to restore scientific infrastructure that was damaged by Hurricanes Irma and Maria in Puerto Rico, such as stream gauges,
USGS scientist David Rodriguez records high-water marks from storm surge caused by Hur-ricane Harvey near Corpus Christi, Texas. Photo credit: Kurt Kraske, USGS.
This screenshot of a “storm tracker” map shows the potential area paraná sailfin catfish could have spread around Galveston Bay during the flooding caused by Hurricane Harvey.
(Hurricane Response continued from page 3)
(Hurricane Response continued on page 5)
5 Sound Waves June 2018
CHECK STORIES FOR HYPERLINKS!!!!
Cover Story, continued
Cover Story / News Briefs
earthquake-monitoring instruments, and coral reef research equipment. The ap-propriation also is supporting scientific fieldwork that will factor in the dramatic changes made to many streams, rivers, and mountainsides. Based on those field observations and new data collected by new or repaired instruments, scientists will
be able to develop updated flood and land-slide predictions.
In Puerto Rico, the U.S. Virgin Islands, and on the mainland, the funding will pay for highly accurate coastal elevation data, based on lidar images and other sources. The lidar data, most of which will be available in 2019, will improve the USGS
capacity to predict coastal erosion in future years.
While the USGS is readying for the coming season, people potentially in the path of hurricanes can prepare as well, by going to Ready.gov (see http://ready.gov/)or Listo.gov (see http://listo.gov/) for advice on what steps they can take to protect lives and property.
(Hurricane Response continued from page 4)
News Briefs
Sound Waves News BriefsEdited by Rex Sanders • June 2018
} 10 Things You May Not Know About Our Coasts
June 15—Over 126 million people in the U.S., or 40 percent of the Nation’s total population, live in coastal counties. These coastal environments provide many benefits to their inhabitants, including both people and wildlife, and to the entire country. For example, coastal wetlands act as a natural defense against storm surge and also provide crucial food resources for waterfowl. However, coastal areas from Florida to Hawai’i and Alaska are threatened by changing conditions, such as rising seas, increasing water temperatures, more frequent extreme storms, and coastal erosion. Scientists with the National and Regional Climate Adaptation Science Centers (CASCs) are actively working to understand and monitor these impacts. Learn more about our work in these 10 examples. More: https://casc.usgs.gov/content/10-things-you-may-not-know-about-our-coasts
} Amy East Elected GSA Fellow for Insights into Landscape Response to Changes in Sediment Supply
June 8, 2018—The Geological Society of America (GSA) elected USGS re-search geologist Amy East to be a GSA Fellow, “an honor bestowed on the best of our profession,” at the spring GSA Council meeting. Amy East was nominat-ed by Jon Major of the USGS Cascades Volcano Observatory “for insightful re-search contributions that have extended fundamental understanding of landscape responses to changes in sediment sup-ply in modern and ancient sedimentary systems.” East’s research includes studies on how altered sediment supply affected Washington State’s Elwha River during and after removal of two large dams, how California coastal watersheds respond to extreme rainfall, how Glen Canyon Dam affects downstream river-borne and wind-driven sediment in the Grand Can-yon, and how the sedimentary records of active plate margins get preserved or de-stroyed over long time scales. More:
https://www.usgs.gov/center-news/amy-east-elected-gsa-fellow-insights-landscape-response-changes-sediment-supply
} Average-sized Dead Zone Forecasted for the Gulf of Mexico
June 7—NOAA scientists are forecast-ing that this summer’s Gulf of Mexico hypoxic zone or ‘dead zone’—an area of low to no oxygen that can kill fish and other marine life—will be approximately 5,780 square miles, approximately the size of Connecticut. The forecast is based on nitrogen runoff and river discharge data from the USGS. The 2018 forecast is similar to the 33-year average Gulf dead zone of 5,460 square miles and is smaller than the 8,776 square mile 2017 Gulf dead zone, which was the largest dead zone measured since mapping began in 1985. “The Gulf’s recurring summer hypoxic zone continues to put important habitats and valuable fisheries at risk,” said Steve Thur, director of NOAA’s National Cen-
(News Briefs continued on page 6)
6June 2018 Sound Waves
CHECK STORIES FOR HYPERLINKS!!!!
News Briefs, continued
News Briefs
ters for Coastal Ocean Science. “Although there has been some progress in reducing nutrients, the overall levels remain high and continue to strain the region’s coastal economies.” More: https://www.usgs.gov/news/average-sized-dead-zone-forecasted-gulf-mexico
} New Study Provides the First Comprehensive, Long-term Look at Alaska’s Changing Ecosystems
May 29—New research has revealed significant changes to Alaska’s land-scape in recent decades. During the past 32 years, about 13 percent of the state—67,000 square miles or an area larger than the state of Wisconsin—has changed, according to a new USGS-led study in collaboration with researchers from academia and other federal agencies. Alaska has experienced glacial retreat, shrub and treeline expansion, wildfires, erosion, pollution disturbances, and other changes over the last 32 years. Most of that change occurred in boreal regions due to the residual effects of fires that are still apparent after 60 years. “The upshot is that combined effects could push sys-tems past tipping points and impact large areas, especially after fires,” said USGS scientist Bruce Wylie, who co-authored the study. Permafrost-dominated coasts of Alaska have drastically changed as the result of coastal transgression and storm-surge flooding which can result in the loss of cultural sites and damage to infrastructure. More: https://www.usgs.gov/news/new-study-provides-first-comprehensive-long-term-look-alaska-s-changing-ecosystems
} USGS Fish Passage Research Helps Fish Get to Spawning Grounds
May 25—The Blackstone River in Rhode Island is where one of the Nation’s first fish passages was built back in 1714 to help fish navigate past manmade obstruc-tions so they could complete their instinc-tual migration cycles. More than 300 years later and not far from the original fish pas-sage site there on the river, USGS research-ers have been working with dam operators and other cooperators to expand scientific understanding of the effects these barriers and dams can have on migratory fish, and what can be done to maximize their chance to travel freely up and down rivers, to and from oceans. “As a core component of healthy streams and oceans, migratory fish play crucial roles in stable ecosystems for a lot of different reasons,” said Ted Castro-Santos, a research ecologist at the USGS Leetown Science Center. “The fact they are a major food source for so many different species is probably one of their most impor-tant roles.” More: https://www.usgs.gov/news/usgs-fish-passage-research-helps-fish-get-spawning-grounds
} USGS Partnership with Lower Elwha Klallam Tribe Featured in New Fact Sheet on Elwha River Dam Removals
May 24—The USGS has published a new Fact Sheet, “Science Partnership between U.S. Geological Survey and the Lower Elwha Klallam Tribe: Under-standing the Elwha River Dam Removal Project.” Two large hydroelectric dams on the Elwha River in Washington State were removed in the period 2011–2014 to restore the river ecosystem and recover imperiled salmon populations. The new fact sheet summarizes findings by a mul-tidisciplinary team of scientists from the Lower Elwha Klallam Tribe, the USGS, other agencies, universities, and non-governmental organizations who collected data before, during, and after dam re-moval. The 4-page fact sheet lists key les-sons, details some impacts of dam removal on river sedimentation and the physical and biological makeup of the estuary and coast, and lists references with in-depth information. More: https://www.usgs.gov/center-news/usgs-partnership-lower-elwha-klallam-tribe-featured-new-fact-sheet-elwha-river-dam
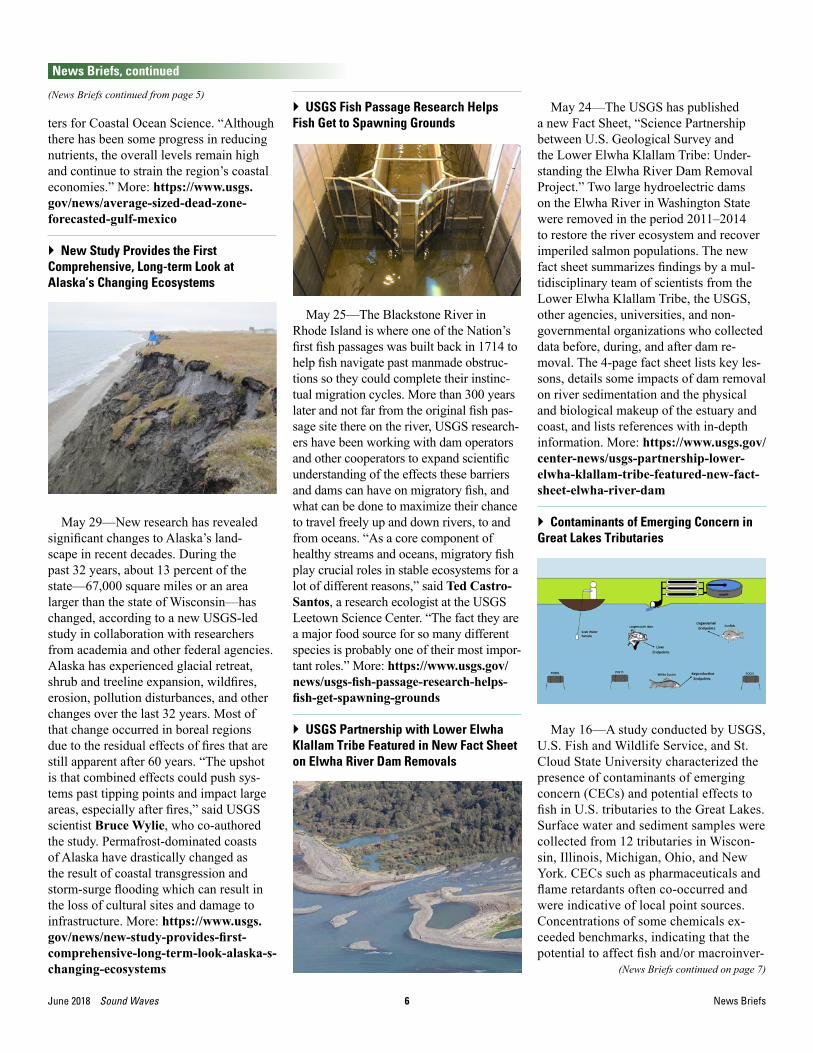
} Contaminants of Emerging Concern in Great Lakes Tributaries
May 16—A study conducted by USGS, U.S. Fish and Wildlife Service, and St. Cloud State University characterized the presence of contaminants of emerging concern (CECs) and potential effects to fish in U.S. tributaries to the Great Lakes. Surface water and sediment samples were collected from 12 tributaries in Wiscon-sin, Illinois, Michigan, Ohio, and New York. CECs such as pharmaceuticals and flame retardants often co-occurred and were indicative of local point sources. Concentrations of some chemicals ex-ceeded benchmarks, indicating that the potential to affect fish and/or macroinver-
(News Briefs continued from page 5)
(News Briefs continued on page 7)

7 Sound Waves June 2018
CHECK STORIES FOR HYPERLINKS!!!!
} Kīlauea Volcano Erupts
May 4—The Kilauea Volcano erupted in the Lower Puna district of Hawai’i, known as the “Big Island” of the Hawaiian Island chain, which is home to roughly 200,000 people and a haven for tourists and adventure seekers.
As of mid-June, lava completely fills Kapoho Bay, extending more than 0.8 miles from the former coastline. This is a developing story, so please keep checking USGS web sites for daily updates. More: https://www.usgs.gov/news/k-lauea-volcano-erupts
For all USGS Coastal and Ma-rine Geology Program news: https://go.usa.gov/xQBBE
For all USGS news: https://www.usgs.gov/news
Or follow us on Facebook: @coastalandoceanscience, @USGeologicalSurvey; and Twitter: @USGSCoastChange, @USGS
News Briefs / Research
News Briefs, continued
(News Briefs continued from page 6)
tebrate health was likely. Concurrent with water sample collection, bluegill sunfish were assessed for indices indicative of contaminant exposure in 6 tributaries. Many of the fish showed signs of stress, however no direct relationship between adverse effects and specific CECs or classes of CECs was determined. Re-sults from this study can help inform restoration and support management efforts within the Great Lakes Basin. More: https://mn.water.usgs.gov/about/newsletter/2018_Spring/
Research
Scientists in the USGS National Assessment of Coastal Change Hazards Project Ready for 2018 Hurricane Season By Kara Doran
The 2018 hurricane season got an early start this year with sub-tropical storm Alberto forming on May 25. Scientists with the USGS National Assessment of Coastal Change Hazards (NACCH) project were ready to provide data and tools (see https://marine.usgs.gov/coastalchangehazardsportal/ui/alias/alberto) to guide response and recovery efforts for Alberto.
Since 2011, NACCH project research-ers have provided forecasts of coastal erosion based on lidar-derived beach mor-phology and modeled storm waves and water levels. Scenario-based forecasts are updated every year using simulated hurri-
cane waves and surge and the most recent beach morphology from the USGS. These scenarios can be used to plan for potential future storm impacts.
During a landfalling storm, storm-specific probabilities of coastal change are made using real-time waves and surge forecasts from NOAA. Both scenario-based and real-time fore-casts of coastal erosion are avail-able in the Coastal Change Hazards Portal (see https://marine.usgs.gov/
coastalchangehazardsportal/) and are updated as conditions change. During the extremely active 2017 hurricane sea-son, project scientists posted 25 separate forecasts identifying where beaches along the Atlantic and Gulf coasts were at risk of dune erosion, overwashing, or inundation.
In collaboration with the National Weather Service (NWS), the NACCH project has also developed an Operational
Coastal change forecasts were produced for five different storms during the 2017 hurricane season. (Scientists Ready continued on page 8)
The Operational Total Water Level and Coastal Change Forecast Viewer shows the timing and elevation of extreme water levels along with dune crest and toe height for Miami Beach, Florida, during the approach of Hurricane Irma.

8June 2018 Sound Waves
CHECK STORIES FOR HYPERLINKS!!!!
Research, continued
Research / Fieldwork
Total Water Level and Coastal Change Forecast Viewer. This viewer is updated several times a day with real-time water levels from the NWS Nearshore Wave Prediction System and is currently avail-able for over 3000 kilometers of the Gulf of Mexico and Atlantic coasts from Flor-ida through Maine. The viewer includes predictions of the timing and magnitude of water levels at the shoreline and potential impacts to coastal dunes. Observations collected by USGS water-science offices during Hurricanes Irma and Nate are being used to validate the model.
(Scientists Ready continued from page 7)
The NACCH project is constantly working to improve forecasts of coastal change through observations and research. Video cameras (see https://coastal.er.usgs.gov/hurricanes/research/video-remote-sensing.php) at Madeira Beach and Sand Key, Florida, collect observa-tions of the coast that can be used to moni-tor a range of processes, such as beach and dune erosion during extreme storm events. These observations are used to evaluate models for predicting water levels at the shoreline driven by surge and waves, and to help improve our understanding of coastal processes during storms when tra-ditional surveys are too dangerous.
Unmanned aircraft systems (UAS), commonly referred to as drones, are
another tool for NACCH project scientists to obtain rapid-response observations of the coast. Equipped with a small digital camera, a UAS can be deployed to col-lect aerial imagery before and after storm events. With a flight time of 10-15 min-utes, the UAS can capture images from a stationary position to create standard image products for extracting water lev-els, shoreline position, and bathymetry. Additionally, the UAS can fly along the coast capturing multiple snapshot images, from which elevation data can be extracted using a new technique termed structure-from-motion (SfM). Preliminary SfM analysis from Madeira Beach has been used to measure the changes due to Irma and subsequent recovery.
The video camera at Madeira Beach shows elevated water levels at the beach on May 24, 2017.
Elevation change at Madeira Beach, Florida, due to Hurricane Irma, produced by applying struc-ture-from-motion techniques to UAS (drone) aerial imagery. The blue color indicates sand loss on the lower beach and the red color indicates sand gain on the upper beach. Figure credit: Jenna Brown, USGS.
Recent FieldworkRex Sanders • June 2018
Last month USGS scientists visited 11 coastal and offshore locations while moni-toring beaches, marshes, and offshore ar-eas, and testing new equipment. Here’s a quick overview of some fieldwork by our researchers.
• Little Egg Inlet, New Jersey: Collected geologic-framework information from the inner shelf and inlet for coastal-change studies, May 29–June 15. De-tails: https://cmgds.marine.usgs.gov/fan_info.php?fan=2018-001-FA
• Long Island, New York: Measured sed-iment transport of wetlands in Jamaica Approximate locations of some recent USGS coastal and offshore fieldwork. Dark blue areas out-
line the U.S. Exclusive Economic Zone; purple areas show U.S. Great Lakes waters.(Recent Fieldwork continued on page 9)
Fieldwork

9 Sound Waves June 2018
CHECK STORIES FOR HYPERLINKS!!!!
Fieldwork, continued
Fieldwork / Awards
Bay and Great South Bay, June 11–14. Details: https://cmgds.marine.usgs.gov/fan_info.php?fan=2018-041-FA
• San Francisco, California: Monitored changes in Ocean Beach sand volume and distribution, June 12. Details: https://cmgds.marine.usgs.gov/fan_info.php?fan=2018-640-FA
• Grand Bay, Mississippi and Alabama: Measured marsh thickness and estab-lished sites for erosion studies, June 4–8. Details: https://cmgds.marine.usgs.gov/fan_info.php?fan=2018-332-FA
• Tampa Bay, Florida: Collected water samples to validate instrumentation, June 4–8, May 29. Details: https://cmgds.marine.usgs.gov/fan_info.php?fan=2018-339-FA and
https://cmgds.marine.usgs.gov/fan_info.php?fan=2018-337-FA
• Oceanside, California: Measured sand distribution, thickness, and grain size on the continental shelf, May 21–26, 2018. Details: https://cmgds.marine.usgs.gov/fan_info.php?fan=2018-638-FA
• Stellwagen Bank National Marine Sanctuary, Massachusetts: Collected seabed sediment samples for geological mapping, May 21–24. Details: https://cmgds.marine.usgs.gov/fan_info.php?fan=2018-027-FA
• Taunton, Massachusetts: Created ele-vation base map to aid flood-inundation maps using drone photos, May 23. De-tails: https://cmgds.marine.usgs.gov/fan_info.php?fan=2018-011-FA
• Clearwater, Florida: Collected GPS data and photos for Sand Key video coastal monitoring station, May 23. De-tails: https://cmgds.marine.usgs.gov/fan_info.php?fan=2018-338-FA
• Cape Cod, Massachusetts: Monitored coastal erosion and tested grain-size mapping using drones at Sandwich Town Neck Beach, May 21–22. De-tails: https://cmgds.marine.usgs.gov/fan_info.php?fan=2018-019-FA
• Madeira Beach, Florida: Collected drone photos to test the structure-from-motion technique for estimating coastal topography, May 22. Details: https://cmgds.marine.usgs.gov/fan_info.php?fan=2018-336-FA
For a complete list of USGS Coastal and Marine Geology program fieldwork, see: https://cmgds.marine.usgs.gov/data_search.php.
(Recent Fieldwork continued from page 8)
Awards
Most-Cited Award for Marine Geology Special Issue: “Tsunami Hazard along the U.S. Atlantic Coast”By Uri ten Brink and Helen Gibbons
A USGS-led special issue of Marine Ge-ology received a most-cited certificate from the journal in May 2018. “Tsunami hazard along the U.S. Atlantic coast” (volume 264, no. 1–2; see https://www.sciencedirect.com/journal/marine-geology/vol/264/issue/1-2) was published in 2009 and was among the journal’s three most-cited spe-cial issues in 2016 and 2017.
Seafloor (dark gray) off the U.S. East Coast, showing areas of past landslides (blue). NC—Norfolk Canyon, WC—Wilmington Canyon, HC—Hudson Canyon, VC—Veatch Canyon. Inset shows study area location. NES—New England Seamounts. BS—Blake Spur, BE—Blake Escarpment. Figure 1 from Preface (see https://darchive.mblwhoilibrary.org/bitstream/handle/1912/2965/tenbrink_mg.pdf?sequence=1) to “Tsunami Hazard along the U.S. Atlantic Coast” (see https://www.sciencedirect.com/journal/marine-geology/vol/264/issue/1-2) Image credit: David Twichell, USGS.
(Tsunami Hazard continued on page 10)

10June 2018 Sound Waves
CHECK STORIES FOR HYPERLINKS!!!!
Awards / Staff and Center News
Awards, continued
The U.S. Atlantic Coast (also called the East Coast) is highly vulnerable to tsunami damage because major population centers and industrial facilities are located near the shoreline at low-lying elevations. As-sessing the tsunami hazard in this region is a challenge—assessment typically relies on analysis of past events, but very few tsunamis have struck the U.S. East Coast in historical times and evidence for pre-historic tsunamis is scarce.
A diverse group of marine geologists, geophysicists, geotechnical engineers, and hydrodynamic modelers joined forces to address this problem, developing methods to evaluate the likely sources of tsunamis that could impact the East Coast. Although earthquakes trigger most Pacific and In-dian Ocean tsunamis, the primary source
(Tsunami Hazard continued from page 9)of potential tsunamis on the U.S. Atlantic Coast is underwater landslides—a major focus of the 2009 special issue.
Eight of the papers presented new re-search conducted as part of a Nuclear Reg-ulatory Commission (U.S. NRC)-funded project, which provided tsunami-hazard evaluations for use by electrical power utili-ties and the U.S. NRC in the licensing proc-ess for new nuclear power plants. The ninth paper was written in response to an evalua-tion request by an insurance company. The Preface provides an overall summary.
The compilation was among three most-cited special issues of Marine Geology in 2016–2017 because it addressed fun-damental aspects of landslide generation, mobilization, and probability, as well as providing an overview of landslide and earthquake-generated tsunami hazards
to the heavily populated, low-elevation U.S. East Coast. USGS authors included Brian Andrews, Brian Buczkwoski, Jason Chaytor, Eric Geist, Homa Lee, Tom Parsons, Uri ten Brink, and David Twichell. Ten Brink also served as guest editor of the special issue.
After the publication appeared, further assessment of East Coast tsunami hazards proceeded with additional funding from the U.S. NRC for another 7 years, result-ing in five coring and geophysical cruises (for example, see https://soundwaves.usgs.gov/2009/08/fieldwork.html, and https://soundwaves.usgs.gov/2014/06/), a scientific workshop, numerous other pa-pers and reports, and the publication of a 330-page report to the U.S. NRC.
Congratulations to all who contributed!
Staff and Center News
USGS Seafloor-Mapping Expert Visits Korea Institute of Geology and Mineral Industries (KIGAM) in South KoreaBy: Helen Gibbons and Sam Johnson
Research geologist Sam Johnson of the USGS Pacific Coastal and Marine Sci-ence Center made an invited visit to the Korea Institute of Geoscience and Mineral Industries (KIGAM) in Daejon, South Korea, from April 24 to 26, 2018. His host was Dr. Gee Soo Kong of the Petroleum and Marine Division (see http://english.kigam.re.kr/html/en/sub01/sub01_0103.html), assisted by Drs. Deniz Cukur, Jae Hwa Jin, Kyong-O Kim, and Nam-Hyung Koo.
Johnson is a leader of the multi-agency California Seafloor Mapping Program (see https://walrus.wr.usgs.gov/mapping/csmp/), a project to develop bathymetric (seafloor depth), habitat, and geologic maps for all of California’s State Waters (mean high-water line out to 3 nautical miles). Support from partners in the feder-al, state, academic, and private sectors has led to one of the world’s largest and most comprehensive seafloor-mapping datasets. Johnson also investigates the composi-tion and structure of rocks underlying the
Sam Johnson (front row, third from left) with host Gee Soo Kong (front row, far left) and other staff from the Korea Institute of Geoscience and Mineral Industries (KIGAM) Petroleum and Marine Division. (Expert Visits Korea continued on page 11)

11 Sound Waves June 2018
CHECK STORIES FOR HYPERLINKS!!!!
Staff and Center News / Publications
Awards, continuedStaff and Center News, continued
seabed, the forces that shape the coast and seafloor, and coastal earthquake, tsunami, and landslide hazards.
During his visit to KIGAM, Johnson presented two seminars: (1) The California Seafloor Mapping Program—His-tory, Challenges, Applications, Lessons Learned; and (2) U.S. Geological Survey Marine Geohazards Research, Central and Northern California. He also toured KIGAM’s marine core (sediment sample) and laboratory facilities and learned about the institute’s plans for a new research vessel and a 3-D seismic-reflection system
USGS scientist Sam Johnson presents a semi-nar on USGS offshore hazards research at the Korea Institute of Geoscience and Mineral Industries (KIGAM) in Daejon, South Korea.
(Expert Visits Korea continued from page 10)to image structures, like faults, in rock lay-ers beneath the seafloor. Johnson enjoyed numerous stimulating discussions with KIGAM staff regarding seafloor mapping, active faults, and submarine landslides off-shore of South Korea.
Johnson’s KIGAM hosts provided exceptional hospitality, including a great introduction to Korean food. Scientists from KIGAM have come to the Pacific Coastal and Marine Science Center several times (see https://walrus.wr.usgs.gov/mapping/csmp/news.html#apr17)to discuss seafloor mapping and off-shore hazards.
Publications
Recent Publications
• Bernier, J.C., Tuten, T.M., Flocks, J.G., Georgiou, I.Y., Kulp, M.A., Brown, Michael, and Courtois, Andrew, 2018, Sediment data for samples collected in 2015, 2016, and 2017 from coastal Louisiana: U.S. Geological Survey data release, https://doi.org/10.5066/F71G0KKD.
• Brenner, O.T., Henderson, R.E., Hapke, C.J., and Reynolds, B.J., 2018, Hurricane Sandy Beach Response and Recovery at Fire Island, New York—Shoreline, Beach Profile Data, and Breach Shoreline Data, October 2012 to October 2017: U.S. Geological Survey data release, https://doi.org/10.5066/P9ANYQ8G.
• Donatelli, C., Ganju, N.K., Fagherazzi, S., and Leonardi, N., 2018, Seagrass impact on sediment exchange between tidal flats and salt Marsh, and the sediment budget of shallow bays: Geophysical Research Letters, https://doi.org/10.1029/2018GL078056.
• Flannery, J.A., Richey, J.N., Toth, L.T., Kuffner, I.B., and Poore, R.Z., 2018, Sr/Ca and linear extension data for five modern O. faveolata colonies from Dry Tortugas National Park, Florida, USA: U.S. Geological Survey data release, https://doi.org/10.5066/P90M2W6D.
• Lacy, J., Ferner, M.C., and Callaway, J.C., 2018, The influence of neap-spring tidal variation and wave energy on sediment flux in salt marsh tidal creeks: Earth Surface Processes and Landforms, https://doi.org/10.1002/esp.4401.
• Limber, P., Barnard, P., Vitousek, S., and Erikson, L., 2018, A model ensemble for projecting multi-decadal coastal cliff retreat during the 21st century: Journal of Geophysical Research F: Earth Surface, https://doi.org/10.1029/2017JF004401.
• McGann, M., and Conrad, J.E., 2018, Faunal and stable isotopic analyses of benthic foraminifera from the Southeast Seep on Kimki Ridge offshore southern California, USA: Deep Sea Research Part II: Topical Studies in Oceanography, v. 150, p. 92–117, https://doi.org/10.1016/j.dsr2.2018.01.011.
• Morgan, K.L.M., and Nelson, P.R., 2018, Baseline coastal oblique aerial photographs collected from Tampa Bay to the Marquesas Keys, Florida, June 22–23, 2010: U.S. Geological Survey data release, https://doi.org/10.5066/P9HALPEP.
• Nelson, P.R., Bosse, S.T., Smith, C.G., 2018, A GIS compilation of vector
shorelines derived from aerial imagery for the Grand Bay region of Mississippi and Alabama—2010 and 2012: U.S. Geological Survey data release, https://doi.org/10.5066/F7VT1R8Q.
• Powell, A.N., Clarke, M.E., Fruh, E., Chaytor, J., Reiswig, H.M., and Whitmire, C.E., 2018, Characterizing the sponge grounds of Grays Canyon, Washington, USA: Deep Sea Research Part II: Topical Studies in Oceanography, v. 150, p. 146–155, https://doi.org/10.1016/j.dsr2.2018.01.004.
• Stalk, C.S., Fredericks, J.F., Locker, S.D., and Carlson, C.S., 2018, Multibeam bathymetry data collected in 2016 from Grand Bay Alabama/Mississippi: U.S. Geological Survey data release, https://doi.org/10.5066/F7MC8Z9N.
• Toth, L.T., Stathakopoulos, Anastasios, and Kuffner, I.B., 2018, Descriptive core logs, core photographs, radiocarbon ages, and accretion data from Holocene reef cores collected throughout the Florida Keys reef tract: U.S. Geological Survey data release, https://doi.org/10.5066/F7NV9HJX.