USGS DDS-43, Geology and minerals issues
41
Sierra Nevada Ecosystem Project: Final report to Congress,vol. II, Assessments and scientific basis for management options. Davis: University of California, Centers for Water and Wildland Resources, 1996. 18 Geology and Minerals Issues MICHAEL F. DIGGLES AND NINE OTHER AUTHORS James R. Rytuba Barry C. Moring Chester T. Wrucke Dennis P. Cox Steve Ludington Roger P. Ashley William J. Pickthorn C. Thomas Hillman Robert J. Miller ABSTRACT This chapter consists of maps and text describing possible undis- covered and known ore deposits, mineral-development issues, pub- lic health and safety issues such as asbestos, mercury, and open-pit mines, the role of calcium, as well as the hazards posed by volca- noes and earthquakes in the Sierra Nevada ecosystem. Maps of likely undiscovered and known deposits of gold, copper, sulfide, and others show the present distribution of such ores and are useful in metal-supply issues, water quality studies, and planning for avoiding environmental hazards. Information on exploration shows potential for development and is important to rural communities, the general economy, employment, and mineral supply. Mercury has important effects on plant communities and water systems in the Sierra Ne- vada ecosystem, with possible consequences for humans. Asbestos occurs naturally in the study area, though its health risk for humans is controversial. Calcium from carbonate rocks is essential for meta- bolic processes of aquatic life and in the buffering system of waters in the area. Volcanic activity and earthquakes have played a major role in shaping the environment of the study area. EARTH SCIENCES OVERVIEW Geology As part of the U.S. Geological Survey (USGS) National Min- eral Resource Assessment Program, an overview of Califor- nia minerals was produced by Dellinger (1989), excerpts of which are reproduced here. The Sierra Nevada extends 644 km (400 mi) from the Modoc Plateau in the north to the Mojave Desert in the south; it varies in width from 64 to 161 km (40 to 100 mi). The range is highest and most rugged along much of its east side, and overall elevation gradually decreases to the west. The range can be divided into western and eastern belts that have different geological characteristics. The western belt, along the west edge of the north half of the range, consists of Paleozoic to Mesozoic oceanic, island-arc, and composite ter- ranes that are intruded by Mesozoic quartz dioritic to grano- dioritic plutons. These three terranes form narrow bands that parallel the trend of the range; generally the oceanic terrane band is closest to the core of the range, and the island-arc terrane band lies along the west edge. The eastern belt of the Sierra Nevada is batholithic terrane, composed almost entirely of Mesozoic granodioritic to granitic plutons that enclose remnants of older Mesozoic, deep-marine volcanic and clas- tic rocks in its western part and Paleozoic, shallow-marine quartzose and carbonate rocks in the eastern part. The differ- ent geologic characteristics of the eastern and western belts are reflected in the different mineral deposit types found in these two regions. The western belt is historically important as the center of the California gold rush in the middle nineteenth century. The Mother Lode is in the western belt, and about a third of California’s total gold production was taken from gold-quartz veins in this region; the belt contains nearly all the large lode- gold deposits in California (Albers, 1981). Virtually the entire western belt is considered geologically permissive for min- eral deposits containing gold, chromium, nickel, copper, zinc, manganese, or mercury, and about a third of the belt has nu- merous known deposits of one or more of these metals. The large disseminated-gold deposit at Jamestown, southwest of Sonora, lies within the western belt. Gold-quartz vein depos- its are present in all three terranes of this belt, but the exist- ence of other mineral deposit types is more restricted. Podiform chromite and laterite nickel deposits are associated with ultramafic rocks that occur typically within or at the margins of oceanic and composite terranes. Chert-associated manganese deposits occur mostly in oceanic and composite terranes, but they also occur in a small area of island-arc ter- rane that lies northeast of the oceanic terrane at the north end of the range. Pyrite-rich massive sulfide deposits are restricted to the island-arc band.
Transcript of USGS DDS-43, Geology and minerals issues
18
Geology and Minerals Issues
MICHAEL F. DIGGLES ANDNINE OTHER AUTHORS
James R. RytubaBarry C. MoringChester T. WruckeDennis P. CoxSteve LudingtonRoger P. AshleyWilliam J. PickthornC. Thomas HillmanRobert J. Miller
ABSTRACT
This chapter consists of maps and text describing possible undis-
covered and known ore deposits, mineral-development issues, pub-
lic health and safety issues such as asbestos, mercury, and open-pit
mines, the role of calcium, as well as the hazards posed by volca-
noes and earthquakes in the Sierra Nevada ecosystem. Maps of
likely undiscovered and known deposits of gold, copper, sulfide, and
others show the present distribution of such ores and are useful in
metal-supply issues, water quality studies, and planning for avoiding
environmental hazards. Information on exploration shows potential
for development and is important to rural communities, the general
economy, employment, and mineral supply. Mercury has important
effects on plant communities and water systems in the Sierra Ne-
vada ecosystem, with possible consequences for humans. Asbestos
occurs naturally in the study area, though its health risk for humans
is controversial. Calcium from carbonate rocks is essential for meta-
bolic processes of aquatic life and in the buffering system of waters
in the area. Volcanic activity and earthquakes have played a major
role in shaping the environment of the study area.
E A R T H S C I E N C E S O V E RV I E W
Geology
As part of the U.S. Geological Survey (USGS) National Min-eral Resource Assessment Program, an overview of Califor-nia minerals was produced by Dellinger (1989), excerpts ofwhich are reproduced here. The Sierra Nevada extends 644km (400 mi) from the Modoc Plateau in the north to the MojaveDesert in the south; it varies in width from 64 to 161 km (40 to100 mi). The range is highest and most rugged along much ofits east side, and overall elevation gradually decreases to thewest. The range can be divided into western and eastern beltsthat have different geological characteristics. The western belt,
Sierr a Nevada Ecosyste m Project : Fina l repor t t o Congress , vol. II, Assessment s and Water and Wildland Resources, 1996.
along the west edge of the north half of the range, consists ofPaleozoic to Mesozoic oceanic, island-arc, and composite ter-ranes that are intruded by Mesozoic quartz dioritic to grano-dioritic plutons. These three terranes form narrow bands thatparallel the trend of the range; generally the oceanic terraneband is closest to the core of the range, and the island-arcterrane band lies along the west edge. The eastern belt of theSierra Nevada is batholithic terrane, composed almost entirelyof Mesozoic granodioritic to granitic plutons that encloseremnants of older Mesozoic, deep-marine volcanic and clas-tic rocks in its western part and Paleozoic, shallow-marinequartzose and carbonate rocks in the eastern part. The differ-ent geologic characteristics of the eastern and western beltsare reflected in the different mineral deposit types found inthese two regions.
The western belt is historically important as the center ofthe California gold rush in the middle nineteenth century. TheMother Lode is in the western belt, and about a third ofCalifornia’s total gold production was taken from gold-quartzveins in this region; the belt contains nearly all the large lode-gold deposits in California (Albers, 1981). Virtually the entirewestern belt is considered geologically permissive for min-eral deposits containing gold, chromium, nickel, copper, zinc,manganese, or mercury, and about a third of the belt has nu-merous known deposits of one or more of these metals. Thelarge disseminated-gold deposit at Jamestown, southwest ofSonora, lies within the western belt. Gold-quartz vein depos-its are present in all three terranes of this belt, but the exist-ence of other mineral deposit types is more restricted.Podiform chromite and laterite nickel deposits are associatedwith ultramafic rocks that occur typically within or at themargins of oceanic and composite terranes. Chert-associatedmanganese deposits occur mostly in oceanic and compositeterranes, but they also occur in a small area of island-arc ter-rane that lies northeast of the oceanic terrane at the north endof the range. Pyrite-rich massive sulfide deposits are restrictedto the island-arc band.
scientifi c basi s fo r management options. Davis: University of California, Centers for
2VOLUME I I , CHAPTER 18
Internet Access to SNEP Earth Sciences Data
The files produced by the USGS and the U.S. Bureau of Minesfor the Sierra Nevada Ecosystem Project (SNEP) are on theInternet and available via anonymous file transfer protocol(FTP) from mojave.wr.usgs.gov/pub/mdiggles/snep. Thisarea also contains a text file, contents.txt, that describes thefiles in the directory. The maps were produced by BarryC. Moring and Robert J. Miller of the USGS and CharlesBishop of the U.S. Bureau of Mines. Users may addressquestions to Michael F. Diggles at USGS via e-mail [email protected] or phone (650) 329-5404. A sum-mary of U.S. Geological Survey and U.S. Bureau of Mineswork for SNEP is available via the Internet’s World Wide Web(WWW) in a Home Page whose Universal Resource Locator(URL) (“address”) is http://caldera.wr.usgs.gov/mdiggles/SNEP-USGS.html.
M I N E R A L D E P O S I T S I NT H E S I E R R A N E VA D A
The major minerals issues within the SNEP study area con-cern metallic deposits of gold, silver, copper, lead, and zinc.Tungsten and industrial minerals such as sand and gravel arealso potential issues. The assessments of undiscovered re-sources that are part of the USGS Mineral Resource Surveysprogram provide useful tools for addressing minerals issues.Some areas that are permissive for undiscovered mineral re-sources are areas where, were a deposit discovered and de-veloped, an environmental impact could take place.Knowledge of where such deposits are likely to be preparesland-use managers to help minimize impacts.
For mineralized rock in a deposit to be considered “ore,” itmust be possible to mine it at a profit. The quantitative as-sessment presents numerical estimates of amounts of copper,zinc, lead, silver, and gold in undiscovered mineral deposits.It does not include additions to resources that can be madeby extending known deposits. That an undiscovered depositmight exist does not mean it will be discovered or, if discov-ered, if it will be mined.
Quantitative Resource Assessment Technique
This resource assessment is part of a pilot project for an on-going assessment of all mineral resources in the United States.The purpose of the assessment is to maintain a consistent,minimum level of current mineral-resource information sothat such information can be considered in planning for theoptimum use of public lands and for obtaining secure, long-term mineral supplies from domestic and internationalsources. Further details are given in McCammon and Briskey1992. An assessment is an estimation or evaluation in this in-
stance of undiscovered resources of base and precious metalswithin specific volumes of rock. This assessment is quanti-fied in that the result is expressed in numbers. Because of theuncertainty inherent in such an assessment, the obtained re-sults are presented probabilistically.
Methods used in this study are based on mineral depositmodels. Mineral deposit models are collections of data in aconvenient form that describe a group of deposits that havesimilar characteristics and origins. They are based on world-wide literature and observation. They contain information onthe common geologic attributes of the deposits and the envi-ronments in which they are found. Grade and tonnage mod-els consist of information on the grade and size of theindividual deposits, which serve as examples for that deposittype. To begin an assessment, we review the geology of thearea and select appropriate deposit models. We then delin-eate permissive tracts for each type of deposit. The permis-sive tract is defined by the environments of formationdescribed in the deposit model. Geologic maps and mapsshowing location and type of mineral deposits and occur-rences, if any exist, are used in outlining these permissivetracts. Geophysical and geochemical maps as well as satelliteimages, are also useful, and the exploration history may beimportant. Estimates of undiscovered resources are made toa depth of 1 km (0.6 mi) beneath the surface of the permissivetract. If an area of permissive rock is covered by more than 1km (0.6 mi) of rock or sediment, it is excluded from the tract.Then we review the worldwide data on grade and tonnagefor each model. Reasoning by analogy, the undiscovered de-posits that are estimated in the area should be similar in gradeand tonnage to known examples. For many deposit types,these data are available in the form of grade and tonnagemodels in USGS Bulletins 1693 (Cox and Singer, 1986) and2004 (Bliss, 1992).
We review the grade and tonnage data for known depos-its, if there are any, in the tract, decide whether the world-wide models are appropriate for the tract, and modify themif necessary. In well-exposed areas the largest deposits areoften discovered first, and we consider how this might affectthe expected tonnage of undiscovered deposits.
The Mineral Resource Data System (MRDS) of the USGS isa computerized database containing nearly 110,000 recordsof mines, prospects, and occurrences throughout the world.Records can contain detailed information on the name(s), lo-cation, commodities, exploration and development, depositdescription, geology, references, production, and reserves andresources. Most of the data have been collected from pub-lished literature and unpublished files maintained by USGSgeologists. Additionally, some data have come from the fieldobservations of USGS geologists and, to a lesser degree, con-tributions from other federal agencies (such as the U.S. Bu-reau of Mines, U.S. Forest Service, U.S. Bureau of LandManagement [BLM], U.S. Department of State), state geologi-cal surveys, mining companies, and private consultants. Plansare under way to release MRDS and its updates on CD-ROM

3Geology and Minerals Issues
in the near future. For access to MRDS in the meantime, con-tact Nancy Milton, Acting Eastern Regional Geologist, or Jo-seph S. Duval, Eastern Minerals Chief Scientist, at the USGS,12201 Sunrise Valley Drive, Reston, Virginia 22092. For smallrequests, contact the senior author, Michael F. Diggles.
Finally, we estimate the number of undiscovered depositsof each type in the permissive areas. The estimates are sub-jective and are expressed in terms of percentage chance of Xor more deposits. Estimates are made by teams of geoscien-tists who know about the deposit type or about the area, pref-erably both. The result of the estimation process is aprobability distribution of numbers of undiscovered depos-its. Details regarding the deposit estimation procedure aregiven in Root et al. 1992, which include a an explanation ofthe Mark 3 simulation program.
The deposits estimated should be consistent with the gradeand tonnage model. That is, if ten deposits are estimated, fiveof them are visualized to be larger than the median tonnageand five of them (not necessarily the same five) are visual-ized to have a higher grade than the median grade. If the gradeand tonnage model is based on district data, then the numberof undiscovered districts is estimated.
There are many geologic, geochemical, and geophysicalcharacteristics useful in estimating undiscovered mineraldeposits. Estimates can be guided by counting mineral oc-currences, geochemical anomalies, or exploration “plays” andassigning to each a probability of its being a member of thegrade and tonnage distributions. Estimates can also be guidedby analogy with well-explored areas that contain known num-bers of deposits and that are geologically similar to the studyarea. Areas with geologic or morphologic structures com-monly associated with mineralization are likely permissive.
The probability distribution of numbers of undiscovereddeposits is then combined with probability distributions fortonnage and grades. A Monte Carlo simulation technique isused to select randomly, from each distribution, a number, atonnage, and a grade. This procedure is done iteratively bycomputer many thousands of times, and a new probabilitydistribution is generated that shows the distribution of con-tained metal.
Qualitative Descriptions
Quantitative assessments were made for lead, copper, zinc,gold, and silver. In addition to these assessments, treated inseparate sections later, qualitative descriptions and discus-sion of issues for some other deposit types are included here.
Placer Gold and Recreational Prospecting
Information on placer gold and recreational prospecting isuseful to rural communities and also to studies of spawninggravels in riparian habitat and in water-clarity work. Anec-dotal information from the Gold Prospectors Association ofAmerica suggests that about 50,000 to 100,000 Californians ayear engage in recreational prospecting in the Sierra Nevada.
An additional 10,000 to 20,000 nonresidents are thought toparticipate as well. The average recreational prospectorspends from three to ten days a year in this activity and spendsperhaps $50 a day in the local areas. Under the Mining Lawof 1872, placer deposits can be claimed, and the claim holderacquires the mineral rights. In 1994, to increase public accessto placer deposits for recreational prospecting, the BLM hasremoved from Mining Law coverage the 11 km (7 mi) stretchof the Mokolumne River from Highway 49 to Electra and nowissues two-week permits for prospecting in placer depositsthere. The U.S. Bureau of Mines has summarized placer loca-tions on maps elsewhere in this chapter that show areas withthe greatest number of occurrences.
Tungsten Mineralization
Tungsten, with associated gold, silver, copper, and molybde-num, is found in narrow bands of highly altered rock (“tactite”or “skarn”) at contacts between granitic intrusions and meta-morphosed calcareous sedimentary rocks (Einaudi and Burt1982). Most of these deposits occur at the margins of meta-morphic rock pendants generally located in the eastern partof the central Sierra Nevada.
In 1916, deposits of scheelite, a tungsten-bearing mineral,were discovered in the Pine Creek area (Bateman 1965). ThePine Creek mine began operation in 1918; it has been amongthe free world’s largest tungsten producer. Scheelite has alsobeen discovered and mined in the nearby Mount Morrisonarea and in numerous small bodies of calcareous metamor-phic rocks elsewhere in the east-central Sierra Nevada. ThePine Creek and Mount Morrison pendants contain most ofthe known tungsten resources in the Sierra Nevada (Newberry1982). The Pine Creek mine and associated deposits, whichlie just outside the eastern boundary of the John Muir Wil-derness in the Pine Creek pendant, form the largest, mostproductive tungsten reserves in the United States (du Bray etal. 1982), with proven reserves of 1.5 million tons of mineral-ized rock as of 1995. The Pine Creek mine shut down whenPresident Carter, in reaction to the former Soviet Union’s in-vasion of Afghanistan, put an embargo on such high-techexports to the former USSR as deep-drilling technology forSiberia. As a result, Hughes Tool Company required less tung-sten for the production of drill bits. By the time the embargowas lifted, United States trade relations with China—the coun-try with the largest tungsten deposit in the world—had beennormalized. Availability of low-cost Chinese tungsten and thelower demand for bomb casings since the end of the VietnamWar have kept the world price at a level too low for the PineCreek mine to be reopened. A joint venture of Strategic Min-erals Corporation of Connecticut and Avocet Ventures, Inc.,of London hopes to mine Pine Creek reserves in the near fu-ture (R. Kattelmann, letter to M. Diggles, August 1995). In thelong run, the world’s known tungsten reserves can do noth-ing but decrease. For mineralized rock to be considered “ore,”it must be possible to mine it at a profit, something that hasnot been done at Pine Creek recently. Because the Pine Creek

4VOLUME I I , CHAPTER 18
mine is located on the up-thrown side of the Sierra Nevadafront fault, water drains from the mine without the use ofpumps. The tendency of the mine to drain naturally and thefact that the ore here falls easily into the crusher enhance thepotential that operators will reopen the mine sometime in thefuture.
North of Lake Tahoe, the Sierra Nevada batholith containsa few roof pendants that have deposits of, and are geologi-cally permissive for, tungsten or gold deposits. Much of thearea between Lake Tahoe and Bridgeport is permissive forgold, tungsten, mercury, manganese, or uranium in skarndeposits in roof pendants and in hot-spring, vein, and otherdeposits in Cenozoic volcanic rocks, but known deposits aresparse (Dellinger, 1989). South of Bridgeport, the batholithicterrane contains numerous roof pendants; collectively, thesebodies have numerous deposits of, and are considered to begeologically permissive for, tungsten and molybdenum inskarn deposits, gold in quartz veins, iron in epigenetic mag-netite deposits, or chromium in podiform chromite depositsthat occur in roof pendants of oceanic affinity along the westedge of the batholith. Batholithic rocks along the central eastedge of the Sierra Nevada, from Mono Lake to Independence,contain numerous roof pendants and are considered to begeologically permissive for deposits of tungsten and gold.Deposits of tungsten, gold, or molybdenum occur locally, butknown deposits are sparse or absent in most of this area. Mostof the Sierra Nevada south of the thirty-sixth parallel is con-sidered to be geologically permissive for gold, tungsten, lead,zinc, antimony, or mercury in roof-pendant skarn deposits orin gold-quartz and other vein deposits. Known deposits ofgold, tungsten, antimony, or mercury occur in parts of thearea, but most of the area lacks known deposits.
Sand and Gravel
Sand and gravel production in California had a total value1.2 times as much as gold in 1994. Sand and gravel depositsare abundant in alluvium in the lower parts of drainage ba-sins. Development of these deposits is limited by the highcost of transporting them to markets, but as sources closer tothe markets are depleted and Sierra Nevada population cen-ters grow, these resources will become more important. Asthe highway systems widen, expand, and need repair or re-placement, the need for sand and gravel deposits will increase.A consideration in developing these deposits is the potentialfor a significant impact on riparian habitat and siltation ofstreams needed for clean water supplies. A source of sandand gravel available in some parts of southern California isclosed military bases, particularly low-lying alluvial areasoccupied by airfields. These areas, however, sometimes con-tain dump sites for fuels and solvents that have permeatedthe gravels (L. Darlene Batatian, conversation with MichaelF. Diggles, December 1991). With these issues in mind, suchdeposits may be available to fill the needs in parts of the Si-erra Nevada. Land-use planners need to be able to adjust fromheavy-industry sand and gravel production during the life of
the deposit to some other land use after the deposit is de-pleted (Kockelman 1990). The sites need to be reclaimed forother uses, particularly for urban buildout that is moving to-ward these deposit sites.
Environmental problems in the sand and gravel industryfaces include damage to riparian habitat and fisheries, waterquality, air emissions of small particulate matter, diesel-engine emissions, and blasting activities. Commercial andhousing developments are being built ever closer to these op-erations, and as potential issuers of complaints against groundvibrations, their needs must be met (Clark 1992). Dust can becontrolled by watering down the operation or other moresophisticated methods (Scherer, 1992). Solutions are apt toincrease water-supply needs and introduce runoff consider-ations. Congress has been concerned with visibility aroundnational parks and may enact new visibility regulations thatcould affect the industrial-mineral industry. Mining opera-tions may be in conflict with wetlands programs in which ano-net-loss policy is common. There may be cases where in-dustry has the opportunity to create wetlands.
L O W- S U L F I D E G O L D - Q U A RT ZV E I N D E P O S I T S
The Mother Lode held the world record for gold deposits formany decades. It still produces some gold today and has itsown health and safety issues.
Descriptive Model
Low-sulfide gold-quarts vein deposits contain gold in mas-sive persistent quartz veins mainly in shear zones in region-ally metamorphosed volcanic rocks and volcanic sedimentaryrocks (Model 36A, Berger 1986).
Rationale for Model Choice
Gold-bearing mesothermal quartz veins are localized alongmajor deep-seated, through-going structural features in low-to moderate-grade marine metasedimentary and metavol-canic rocks. Many of the type examples used by Berger (1986)in the low-sulfide gold-quartz descriptive model (Model 36A)are in the Pacific Coast region.
Rationale for Tract Delineation
The permissive tract was defined principally by the locationof low- to moderate-grade regionally metamorphosed marinesedimentary and volcanic rocks of Jurassic and older age,based on the state geologic maps for California and Oregon(Jennings 1977; Walker and MacLeod 1991) and the personalknowledge of the assessors (figure 18.1). Geophysical evidence

Areas permissive forlow-sulfide gold-quartz deposits
Tracts permissive forlow-sulfide gold-quartz deposits.
LassenN. P.
Lake Tahoe Basin Management Unit
National park and national forest lands
SNEP boundary
SNEP-core boundary
L a s s e n N. F.
P l u m a s N. F.
E l d o r a d o
N. F.
S t a n i s l a u s
N. F.
N. P.Y o s e m i t e
S i e r r a N. F.
Inyo N.F.
M o d o c N. F.
M o
d o
c
N
. F
.T a h o e N. F.
Inyo N.F.
Sequoia N.F.
U.S. Geological Survey / SNEP
VISALIA
RENO
FRESNO
SACRAMENTO
Sequoia-Kings-Canyon N.P.
Lakes
N e v a d a
Ca
li
fo
rn
i a
0 10 20 30 40 50 60 70
Kilometers0 5 10 15 20 25 30 35 40
Miles
Figure 18.1

6VOLUME I I , CHAPTER 18
was used to extend the tracts into areas of valley fill or thinQuaternary, Tertiary, or Cretaceous cover. In California mostof the tract contains known gold deposits and includes thosedeposits in the famed California Mother Lode (Clark, 1976).
Potential Environmental Concerns
The following discussion was provided by Richard Goldfarb(letter to Michael F. Diggles, May 1995) of the GeochemistrySection of the Central Minerals Team at the USGS and is partof a draft mineral-environmental model book (Goldfarb et al.in preparation). The principal environmental concerns for low-sulfide gold-quartz vein deposits, also called Mother Lodedeposits, are as follows:
• Potential for moderate amounts of acid mine drainagewhere local, relatively high sulfide concentrations occur inassociation with the gold ore, where broad zones of sul-fide minerals characterize wall rocks, or where much ofthe ore is hosted by greenstones that have relatively lowacid-buffering capacity.
• Oxidation of mine tailings or soils formed from unmined,yet sulfide minerals rock can convert harmless arseno-pyrite to potentially harmful arsenates, arsenites, andmethylarsenic species.
• Increased concentration of arsenic, antimony, and, less con-sistently, other trace metals downstream from occurrences.The use of cyanide for gold extraction at many active minespresents a potential additional contaminant in wastewaterdischarges.
• Mercury amalgamation carried out during historic opera-tions may be a source of mercury contamination in aquaticlife and in surface sediments for many tens of years post-mining. The use of mercury amalgamation and roastingfor gold extraction is a direct and serious health concern.
• Disposal of tailings from deposit development can causesedimentation problems in adjacent waterways.
• Modern open-pit mining methods, allowing for develop-ment of previously uneconomical, low-grade, low-sulfidegold deposits, provide quality-of-life concerns when min-ing is near population centers. These concerns include traf-fic, noise, and dust generation. Open-pit mining alsoproduces significantly greater volumes of untreated wasterock.
Cyanide
Cyanide is commonly referred to as “toxic” but not “hazard-ous.” The distinction is that it can be harmful, but it can alsobe controlled with little difficulty. Cases occur, nonetheless,where it is not controlled despite the lack of difficulty. In aboutAugust 1995, there was a major breach of a cyanide-laced tail-ings pond in South America by a United States gold com-
pany that caused massive fish and livestock deaths. The com-pany used helicopters to go down the river broadcasting tothe local population of the oncoming cyanide-laced flood(James J. Rytuba, e-mail to Michael F. Diggles, August 1995).
Open-Pit Mines
The Jamestown mine is a former underground mine that waslater mined by open-pit methods. Other underground work-ings may be open-pitted in the future, but the extent of suchpits would be limited. The ore bodies tend to be tabular innature, and, because they also tend to dip downward at anacute angle, accessing them by excavating a pit becomes in-creasingly expensive with depth (Richard M. Tosdal, conver-sation with Michael F. Diggles, September 1995). The pit atJamestown is small by comparison to the pits at the large hot-springs-type deposits at McLaughlin (Coast Ranges) andMesquite (Mojave Desert). Ore reserves the Mesquite mineare about 56 million tonnes (62 million short tons) and about35 million tonnes (39 short tons) for the McLaughlin mine. Byapplying a 20% expansion factor and a density of 2.7 g/cc(grams per cubic centimeter), Mesquite’s figure converts toabout 33 million cubic yards for the ore body. A stripping ra-tio of between 1:1 and 1:6 can be applied that will increasethis volume. Nearly all the material stays on the site exceptfor some wind-blown sediment, and dust-abatement treat-ment is applied to reduce this. The amount of material movedduring even these large open-pit operations is small by com-parison to the hydraulic mining of the 1880s. In 1880 alone,about 46 million cubic yards left the sites and entered the Sac-ramento and San Joaquin Rivers. Even more material left thesites but stayed in the drainages where it was mined. Theamount of sediment that eventually settled in San FranciscoBay totaled more than 1.1 billion cubic yards (McPhee 1992),and that is just the fine-grained fraction.
The U.S. Geological Survey MRDS shows 106 open-pitmines in and within 10 km2 (6.2 mi2)of the SNEP study area(Lorre A. Moyer, e-mail to Michael F. Diggles, September 1995)(plate 18.1). Of these, forty-six are wholly within the SNEPstudy area. Within the SNEP study area, two deposits are listedin MRDS as “large,” the Jamestown gold mine and the Atlasasbestos mine. Three others are listed as “medium,” the B&Bmercury mine and the Oasis clay mine, both in EsmeraldaCounty, and the Tungstar tungsten mine in Inyo County. Fortyare listed as “small.” Of the small open-pit mines, seven aregold, sixteen are other metals (chromium, copper, mercury,antimony, tungsten), and seventeen are nonmetallic (clay, talc,gems, mica). Sand and gravel operations constitute an open-pit mining activity that statewide is probably at least as ex-tensive as the other minerals combined.
Arsenic Issues
The Central Eureka mine in Sutter Creek, Amador County, isone of 123 mineral deposits in a 16 km (10 mi) stretch of theMother Lode belt that are in the USGS MRDS database. TheMesa de Oro housing project is situated on the mine lands
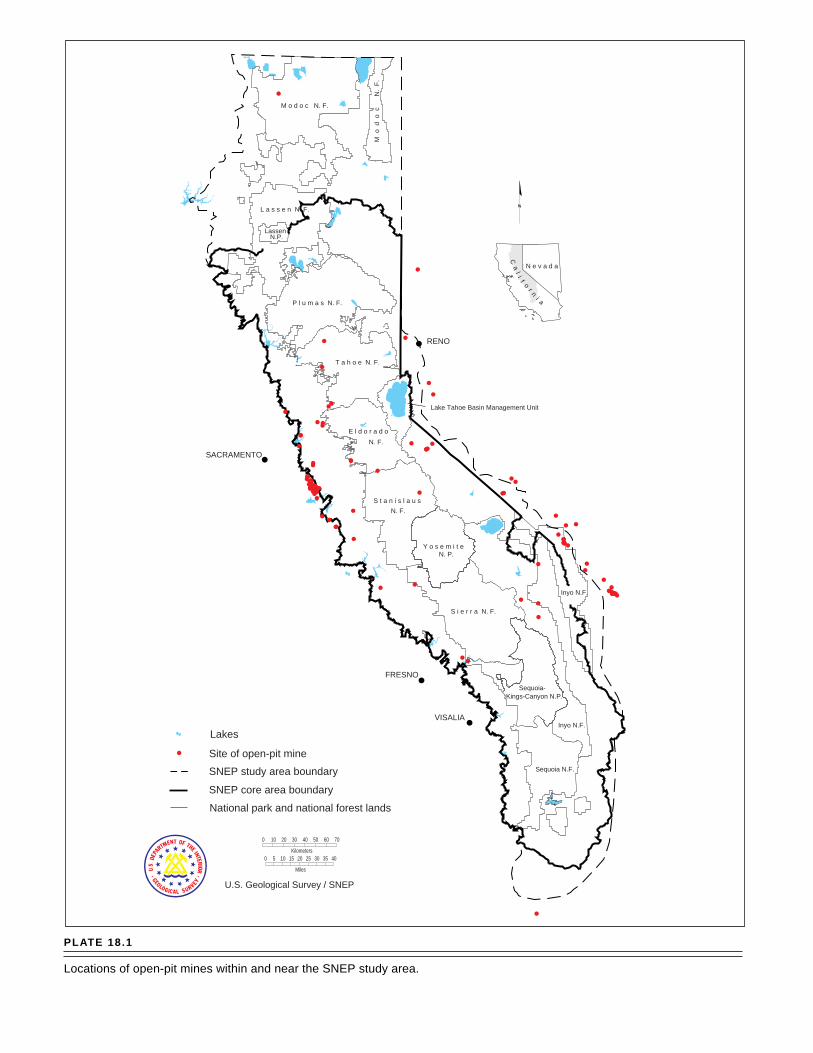
PLATE 18.1
Locations of open-pit mines within and near the SNEP study area.
Lakes
National park and national forest lands
SNEP study area boundary
SNEP core area boundary
0 10 20 30 40 50 60 70
Kilometers0 5 10 15 20 25 30 35 40
Miles
E l d o r a d o
N. P.Y o s e m i t e
S i e r r a N. F.
Inyo N.F.
M o d o c N. F.
M o
d o
c
N
. F
.
T a h o e N. F.
Inyo N.F.
Sequoia N.F.
U.S. Geological Survey / SNEP
VISALIA
RENO
FRESNO
SACRAMENTO
Sequoia-Kings-Canyon N.P.
N e v a d a
Ca
li
fo
rn
i a
Site of open-pit mine
Lassen
Lake Tahoe Basin Management Unit
L a s s e n N. F.
P l u m a s N. F.
S t a n i s l a u s
N. F.
N.P.
N. F.
7Geology and Minerals Issues
and is the topic of an extensive U.S. Environmental Protec-tion Agency (EPA) project addressing arsenic content. Othersuch sites may be of interest for buildout as the population ofthe Sierra Nevada increases and a workable, effective man-agement strategy for dealing with arsenic in the Mother Lodebecomes established.
Until arsenic-rich soils are covered, it is difficult to sell prop-erty because potential buyers cannot get mortgages. The com-munity consists of one-third finished houses, one-thirddeserted houses, and one-third vacant lots. According to in-terviews with home owners, (M. F. Diggles, unpublisheddata), when two feet of topsoil are in place to cover thearsenic-rich surface that is there now, an attachment to eachhome owner’s deed will state that the work has been done,so that banks will lend on the properties again. Work is alsobeing done to stabilize the sides of the “mesa” because whenit gets wet, the finely ground material runs off. Popular opin-ion is mixed, but generally it is felt that the EPA thresholdsare fair. Measurements are 1,000 to 1,200 parts per million(ppm) arsenic compared to about a tenth that in Jackson. Manyhomes are built around Mother Lode tailings heaps in thefoothills, but Mesa de Oro is the only housing project builton one.
Important Examples of Deposit Type
The low-sulfide gold-quartz grade and tonnage model isbased on deposits containing 100 metric tons or more of gold(Bliss 1986). More than 50% of the deposits in the worldwidemodel (Bliss and Jones 1988) are located within this tract andinclude those of the California Mother Lode and the GrassValley district in the Sierra Nevada foothills, as well as de-posits in the Klamath, Siskiyou, and Trinity Mountains innorthern California and southern Oregon. Several majormines in the tract are currently in operation or have beenactive recently. Most notable are the Harvard mine nearJamestown and the Royal Mountain King mine nearCopperopolis, both in the California Mother Lode. Reservesat the Harvard mine are estimated to be in excess of 100 met-ric tons of gold (Bliss and Jones 1988).
Rationale for Numerical Estimate
The team concluded that nearly all deposits that are exposedat the surface have been discovered. The part of the tract mostfavorable for undiscovered deposits is that part that is cov-ered by less than 1 km (0.6 mi) of Cretaceous sedimentaryand Tertiary volcanic rocks between the Klamath Mountainsand the Sierra Nevada. Estimates for this area were madeusing deposit density data. The shallow-covered region ex-tending southeast from the Klamath Mountains has an areaof 490 km2 (191 mi2). The shallow-covered region extendingnorthwest from the Sierra is 1,700 km2 (664 mi2) in area. Thedensity of distribution of low-sulfide gold-quartz vein depos-its in the Klamath Mountains is four deposits per 1,000 km2
(390 mi2); for the Sierra Nevada, the density is 4.6 accordingto Bliss et al. (1987). Inasmuch as the concentration of depos-its tends to drop off with distance from the zones of greatestmineralization, we expect that the density of deposits in theareas beyond the known deposits is half that given by Bliss.These densities (2 and 2.3 per 1,000 km2 [390 mi2]) multipliedby the areas of covered tract results in an expected value ofabout one deposit for the Klamath Mountains and about fourfor the Sierra Nevada.
The tract considered includes not only the Sierra Nevadabut the Klamath Mountains, areas near Monterey, and areasin southern California . Of the 113,300 km2 (43,745 mi2) con-sidered, the 51,800 km2 (20,000 mi2) in the SNEP study areaare thought to contain nearly all the deposits. The estimates,therefore, should be treated as minimums but only slightlylow. In the exposed part of the tract, the team estimated thatonly about one undiscovered deposit could exist giving a to-tal expected value of about six undiscovered deposits. Forthe ninetieth, fiftieth, tenth, fifth, and first percentiles, the teamestimated to, six, nine, twelve, and fifteen or more depositsconsistent with the grade and tonnage model of Bliss (1986).The “expected value” for this set of estimates is 5.8 deposits.Deposits of this type worldwide have a mean tonnage of 0.03million tonnes (0.033 million short tons) and a mean grade of1.6 grams per tonne (ppm) gold and 2.5 g/t (ppm) silver. Themean amount of contained metal is 9.54 tonnes (10.54 shorttons) gold and 1.22 tonnes (1.35 short tons) silver.
M A S S I V E S U L F I D E D E P O S I T S ,S I E R R A N K U R O K O T Y P E
Base and precious metals produced from kuroko types ofdeposits are important to the nation’s metal supply. Aciddrainage is a major environmental consideration. These de-posits contain copper and zinc in massive sulfide deposits inintermediate to felsic marine volcanic rocks. Triassic and Ju-rassic deposits have significantly lower tonnages than world-wide kuroko-type deposits (Model 28A.1, USGS Bull. 2004).
Rationale for Model Choice
Volcanogenic massive sulfide deposits are located in and nearthe foothills of the Sierra Nevada, in belts of intermediate tofelsie marine volcanic rock. Volcanogenic massive sulfidedeposits have been a historically important source of copper,zinc, silver, and gold in this region. Relatively high grades ofpolymetallic ores, simple metallurgy, and potential for largedeposits make these deposits attractive exploration targets;exploration for, and development of, these deposits contin-ues. Although both kuroko (Singer 1986) and Cyprus typesof massive sulfide deposits are possible in this tract, the teamassessed only the kuroko type because it is the only type with

8VOLUME I I , CHAPTER 18
significant known deposits. The Sierran kuroko model, whichis defined to be restricted to deposits of Triassic and Jurassicage (Model 28A.1) (Singer, 1992), was selected because theknown deposits, many of which are included in the Sierrankuroko model, are in Jurassic rocks.
Potential Environmental Concerns
These types of deposits, with their high sulfide content, havebeen areas with acid mine-drainage problems. The Penn minesuperfund cleanup site is from one such deposit. Acid-buff-ering maps can be made for mine-drainage and water-claritywork once a digital geologic map of the Sierra Nevada is re-leased. A draft had been completed by July 1995. As Mount(1995) pointed out, base metals become more toxic to aquaticlife in water that has a higher temperature, contains reduced,dissolved oxygen, and is acidic. Where high-carbonate-con-tent rocks crop out downslope or downstream from kuroko-type deposits, sulfuric acidformed from the weathering ofpyrite could be buffered. Conversely, where such buffering isnot available, managers and mineral producers can be madeaware of potential acid mine-drainage issues and take miti-gating steps. A treatment of mine-drainage issues and min-eral-environmental models is given by Plumlee et al. 1994.
Durkin (in press) describes techniques of mitigation inan acid mine drainage area. His paper is also available at:http://www.enviromine.com/case_hist/richmondhill/ch1.html on the World Wide Web. Action includesremoving reactive rock from the dump and leach pads, back-filling, grading slopes, capping with a multimedia cover, andrevegetation. The cover consists of “6 inches of onsite crushedlimestone, 18 inches of compacted low-permeability manu-factured soil, 4.5 feet of nonreactive crushed waste materialfor thermal/frost/root protection of the manufactured soillayer, and 4 to 6 inches of topsoil.” The revegetation is donewith “a mixture of aggressive grass species to limit the estab-lishment of deeply rooting woody species and trees that coulddamage the integrity of the soil liner.” The cap included ariprap-lined channel to manage runoff and control erosion.The reactive ore left on the leach pad was treated by mix-ing limestone with it. Postclosure monitoring is included inthe plan.
Rationale for Tract Delineation
All map units in the foothills of the Sierra Nevada that con-tain sequences of submarine volcanic rocks have been in-cluded and define the permissive tract for volcanogenicmassive sulfide deposits (figure 18.2). The tract extends west-ward under the Great Valley where the depth to Jurassic base-ment is no more than 1 km (.62 mi), based on drillhole data(Wentworth et al., in press).
Important Examples of Deposit Type
The Penn mine is one of the larger examples of volcanogenicmassive sulfide deposits from the Sierra foothills metavolcanicterranes. It produced 38,000 metric tons of copper, 10,000metric tons of zinc, 66 metric tons of silver, and 2 metric tonsof gold. The Blue Moon and Western World deposits havebeen actively explored in recent years.
Rationale for Numerical Estimate
The tract considered includes not only the SNEP study area,but areas nearby. Of the 13,500 km2 (5,300 mi2) considered,the 9,240 km2 (3,600 mi2) in the SNEP study area are thoughtto contain nearly all the deposits. The estimates, therefore,should be treated as minimums but only slightly low. Thisregion has been explored extensively in the past, focusing oneasily observed surface gossans. There are seven known de-posits and nineteen smaller occurrences in the area, and wejudged that about a quarter of those occurrences could bedeposits falling within the grade and tonage models with fur-ther exploration and development. This observation, coupledwith consideration of substantial amounts of concealed po-tential host rocks, guided our estimate for the fiftieth percen-tile. The substantial concealed area also guided our estimatefor the tenth percentile. For the ninetieth, fiftieth, and tenthpercentiles, the team estimated two, thirteen, and twenty-fiveor more deposits consistent with the Sierran kuroko gradeand tonnage model of Singer 1992. The “expected value” forthis set of estimates is 13.2 deposits. Deposits of this typeworldwide have a mean tonnage of 0.31 million tonnes (0.34million short tons and a mean grade of 0.37% copper, 2.9%zinc, and 2.4% lead. The mean amount of contained metal is1.51 tonnes (1.66 short tons) gold, 81.59 tonnes (89.95 shorttons) silver, 25,987 tonnes (28,651 short tons) zinc, and 11,733tonnes (12,936 short tons) lead.
P O R P H Y R Y C O P P E R D E P O S I T S
The generalized porphyry copper deposit model includesvarious subtypes, all of which contain chalcopyrite instockwork veinlets in hydrothermally altered porphyry andadjacent country rock (Model 17, Cox 1986a).
Rationale for Model Choice
The Lights Creek porphyry copper deposit (Storey 1978) islocated in the northernmost part of the Sierra Nevada, in thePlumas County copper belt of Knopf (1935). Lights Creekconsists of two mineralized zones 3 km (1.9 mi) apart. It dif-fers from typical porphyry copper systems in that magnetiteis more abundant than pyrite and chlorite is the main alter-

National park and national forest lands
SNEP boundary
SNEP-core boundary
Figure 18.2
Areas permissive for kuroko-type deposits
Areas permissive forkuroko-type deposits.
LassenN. P.
Lake Tahoe Basin Management Unit
L a s s e n N. F.
P l u m a s N. F.
E l d o r a d o
N. F.
S t a n i s l a u s
N. F.
N. P.Y o s e m i t e
S i e r r a N. F.
Inyo N.F.
M o d o c N. F.
M o
d o
c
N
. F
.T a h o e N. F.
Inyo N.F.
Sequoia N.F.
U.S. Geological Survey / SNEP
VISALIA
RENO
FRESNO
SACRAMENTO
Sequoia-Kings-Canyon N.P.
Lakes
N e v a d a
Ca
li
fo
rn
i a
0 10 20 30 40 50 60 70
Kilometers0 5 10 15 20 25 30
10VOLUME I I , CHAPTER 18
ation mineral. Zoned potassic and phyllic alteration typicalof porphyry copper deposits is indistinct. The copper belt in-cludes the Engels and Superior copper vein deposits nearLights Creek (Anderson, 1931) and the Walker vein deposit20 km (12 mi) to the southeast. The vein deposits are largecompared to polymetallic vein median tonnage and containmagnetite, tourmaline, and actinolite in addition to chalco-pyrite, bornite, and other sulfides. Deposits in the PlumasCounty copper belt are all related to stocks of gabbroic to gra-nodioritic composition that are older than the major batho-liths in the northern Sierra Nevada.
The abundance of magnetite in these deposits suggests anaffinity with porphyry copper-gold systems, but no goldgrades for the deposits are available. The general porphyrycopper grade and tonnage model (Model 17) (Singer et al.1986) was used in the assessment.
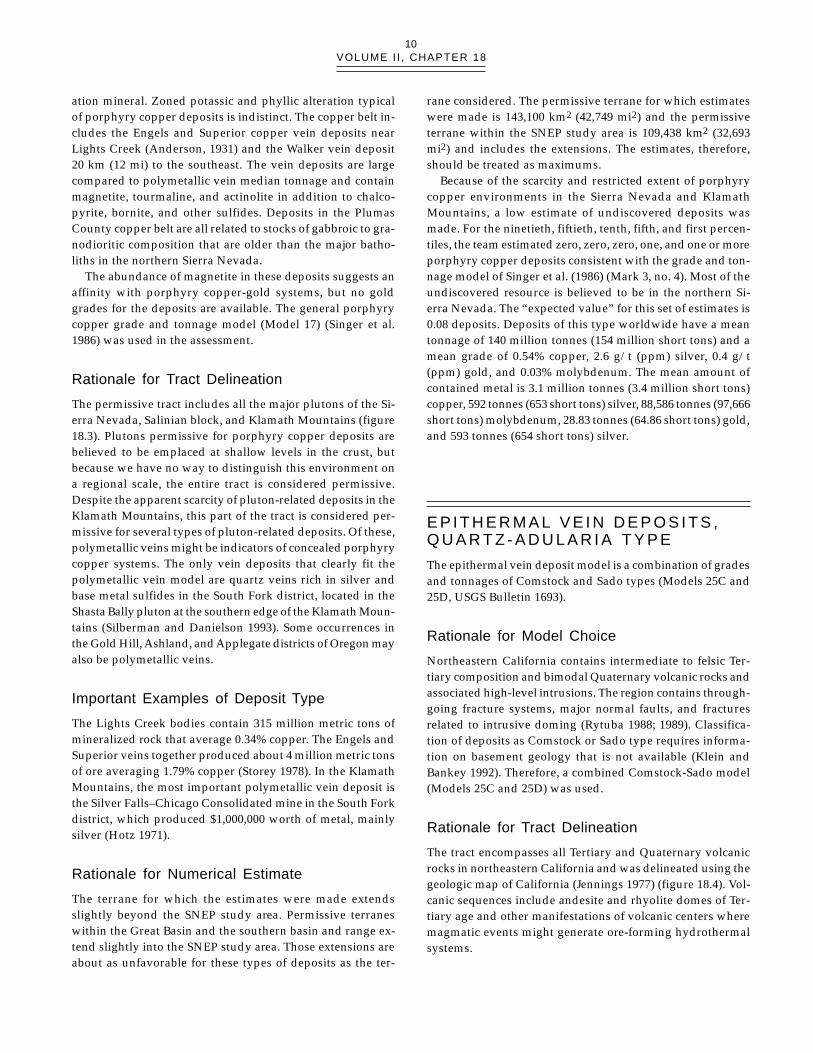
Rationale for Tract Delineation
The permissive tract includes all the major plutons of the Si-erra Nevada, Salinian block, and Klamath Mountains (figure18.3). Plutons permissive for porphyry copper deposits arebelieved to be emplaced at shallow levels in the crust, butbecause we have no way to distinguish this environment ona regional scale, the entire tract is considered permissive.Despite the apparent scarcity of pluton-related deposits in theKlamath Mountains, this part of the tract is considered per-missive for several types of pluton-related deposits. Of these,polymetallic veins might be indicators of concealed porphyrycopper systems. The only vein deposits that clearly fit thepolymetallic vein model are quartz veins rich in silver andbase metal sulfides in the South Fork district, located in theShasta Bally pluton at the southern edge of the Klamath Moun-tains (Silberman and Danielson 1993). Some occurrences inthe Gold Hill, Ashland, and Applegate districts of Oregon mayalso be polymetallic veins.
Important Examples of Deposit Type
The Lights Creek bodies contain 315 million metric tons ofmineralized rock that average 0.34% copper. The Engels andSuperior veins together produced about 4 million metric tonsof ore averaging 1.79% copper (Storey 1978). In the KlamathMountains, the most important polymetallic vein deposit isthe Silver Falls–Chicago Consolidated mine in the South Forkdistrict, which produced $1,000,000 worth of metal, mainlysilver (Hotz 1971).
Rationale for Numerical Estimate
The terrane for which the estimates were made extendsslightly beyond the SNEP study area. Permissive terraneswithin the Great Basin and the southern basin and range ex-tend slightly into the SNEP study area. Those extensions areabout as unfavorable for these types of deposits as the ter-
rane considered. The permissive terrane for which estimateswere made is 143,100 km2 (42,749 mi2) and the permissiveterrane within the SNEP study area is 109,438 km2 (32,693mi2) and includes the extensions. The estimates, therefore,should be treated as maximums.
Because of the scarcity and restricted extent of porphyrycopper environments in the Sierra Nevada and KlamathMountains, a low estimate of undiscovered deposits wasmade. For the ninetieth, fiftieth, tenth, fifth, and first percen-tiles, the team estimated zero, zero, zero, one, and one or moreporphyry copper deposits consistent with the grade and ton-nage model of Singer et al. (1986) (Mark 3, no. 4). Most of theundiscovered resource is believed to be in the northern Si-erra Nevada. The “expected value” for this set of estimates is0.08 deposits. Deposits of this type worldwide have a meantonnage of 140 million tonnes (154 million short tons) and amean grade of 0.54% copper, 2.6 g/t (ppm) silver, 0.4 g/t(ppm) gold, and 0.03% molybdenum. The mean amount ofcontained metal is 3.1 million tonnes (3.4 million short tons)copper, 592 tonnes (653 short tons) silver, 88,586 tonnes (97,666short tons) molybdenum, 28.83 tonnes (64.86 short tons) gold,and 593 tonnes (654 short tons) silver.
E P I T H E R M A L V E I N D E P O S I T S ,Q U A R T Z - A D U L A R I A T Y P E
The epithermal vein deposit model is a combination of gradesand tonnages of Comstock and Sado types (Models 25C and25D, USGS Bulletin 1693).
Rationale for Model Choice
Northeastern California contains intermediate to felsic Ter-tiary composition and bimodal Quaternary volcanic rocks andassociated high-level intrusions. The region contains through-going fracture systems, major normal faults, and fracturesrelated to intrusive doming (Rytuba 1988; 1989). Classifica-tion of deposits as Comstock or Sado type requires informa-tion on basement geology that is not available (Klein andBankey 1992). Therefore, a combined Comstock-Sado model(Models 25C and 25D) was used.
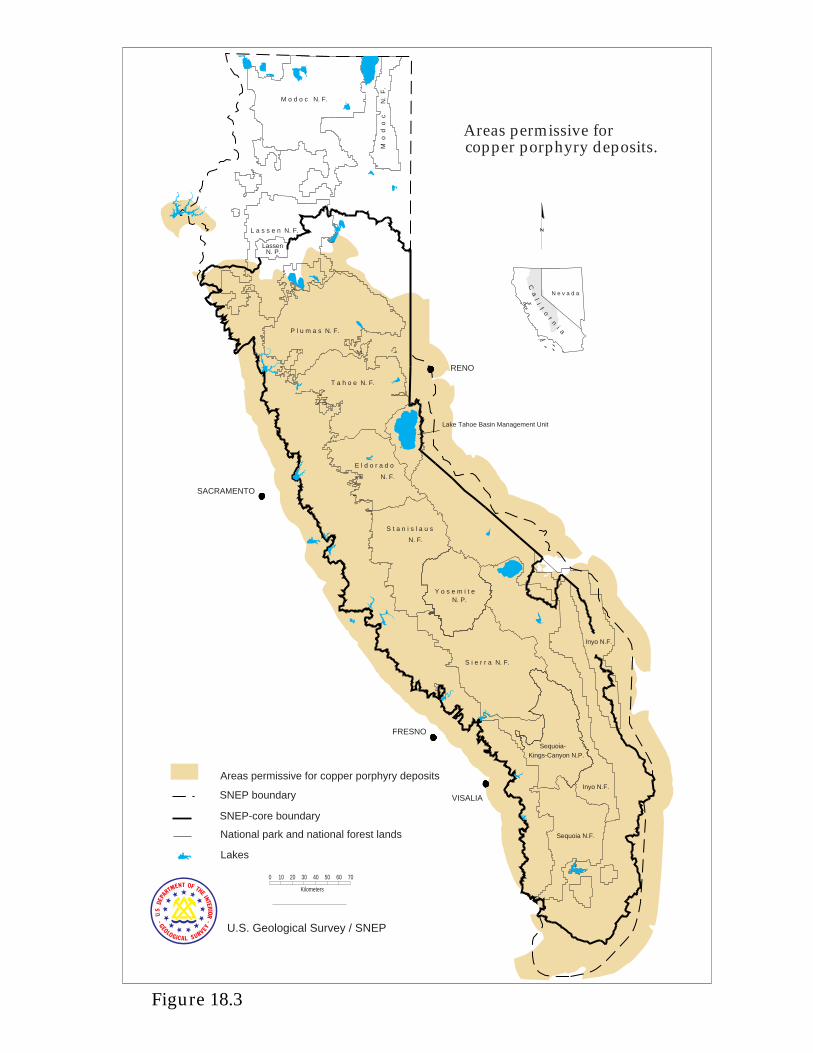
Rationale for Tract Delineation
The tract encompasses all Tertiary and Quaternary volcanicrocks in northeastern California and was delineated using thegeologic map of California (Jennings 1977) (figure 18.4). Vol-canic sequences include andesite and rhyolite domes of Ter-tiary age and other manifestations of volcanic centers wheremagmatic events might generate ore-forming hydrothermalsystems.
National park and national forest lands
SNEP boundary
SNEP-core boundary
LassenN. P.
Lake Tahoe Basin Management Unit
Areas permissive for copper porphyry deposits
Areas permissive forcopper porphyry deposits.
L a s s e n N. F.
P l u m a s N. F.
E l d o r a d o
N. F.
S t a n i s l a u s
N. F.
N. P.Y o s e m i t e
S i e r r a N. F.
Inyo N.F.
M o d o c N. F.
M o
d o
c
N
. F
.T a h o e N. F.
Inyo N.F.
Sequoia N.F.
U.S. Geological Survey / SNEP
VISALIA
RENO
FRESNO
SACRAMENTO
Sequoia-Kings-Canyon N.P.
Lakes
N e v a d a
Ca
li
fo
rn
i a
0 10 20 30 40 50 60 70
Kilometers
Figure 18.3
Areas permissive for epithermal deposits
Tracts permissive forepithermal deposits
LassenN. P.
L a s s e n N. F.
P l u m a s N. F.
E l d o r a d o
N. F.
S t a n i s l a u s
N. F.
N. P.Y o s e m i t e
S i e r r a N. F.
Inyo N.F.
M o d o c N. F.
M o
d o
c
N
. F
.
T a h o e N. F.
Inyo N.F.
Sequoia N.F.
U.S. Geological Survey / SNEP
VISALIA
RENO
FRESNO
SACRAMENTO
Sequoia-Kings-Canyon N.P.
Lakes
N e v a d aC
al
if
or
ni a
Figure 18.4

13Geology and Minerals Issues
Important Examples of Deposit Type
There are no known quartz-adularia deposits in the area. TheSkedaddle Mountain Wilderness Study Area on BLM land eastof Susanville had more than 280 lode claims for epithermaldeposits (Diggles et al. 1988; Munts and Peters 1987).
Rationale for Numerical Estimate
The terrane for which the estimates were made does not in-clude the entire permissive tract within the SNEP study area,but rather a large subset of it. The permissive terrane withinthe SNEP study area is 68,495 km2 (26,756 mi2) and the ter-rane within it for which the estimates were made is 47,760km2 (18,656 mi2). The remainder is in five subsets of largerterranes that include much of the Great Basin and Oregon.The estimates, therefore, should be treated as minimums butonly slightly low. The estimators thought that there was a 50%chance of one or more undiscovered districts. For the nineti-eth, fiftieth, and tenth percentiles, the team estimated zero,one, and two or more quartz-adularia epithermal-vein dis-tricts. The “expected value” for this set of estimates is onedeposit. Because the size of any undiscovered deposit willdepend on its deposit type, more information about the tar-get area is needed to list an expected mean tonnage and grade;Comstock-type deposits worldwide have a mean containedamount of silver of 1.6 million tonnes (1.8 million short tons)while Sado-type deposits have just over 10% as much.
C O P P E R S K A R N
Copper-skarn deposits contain chalcopyrite in calc-silicatemetasomatic rocks near contacts with weakly mineralizedigneous intrusive rocks (Model 18B,Cox and Theodore 1986).
Rationale for Model Choice
Although copper skarn deposits (Model 18B) are much lesscommon in this tract than lead-zinc dominated systems, wide-spread igneous intrusions into carbonate rocks represent per-missive conditions for copper skarn formation. Copper skarnmineral assemblages were observed in ores from the GoldBottom–Copper Queen mine (Dennis Cox, unpublished data).
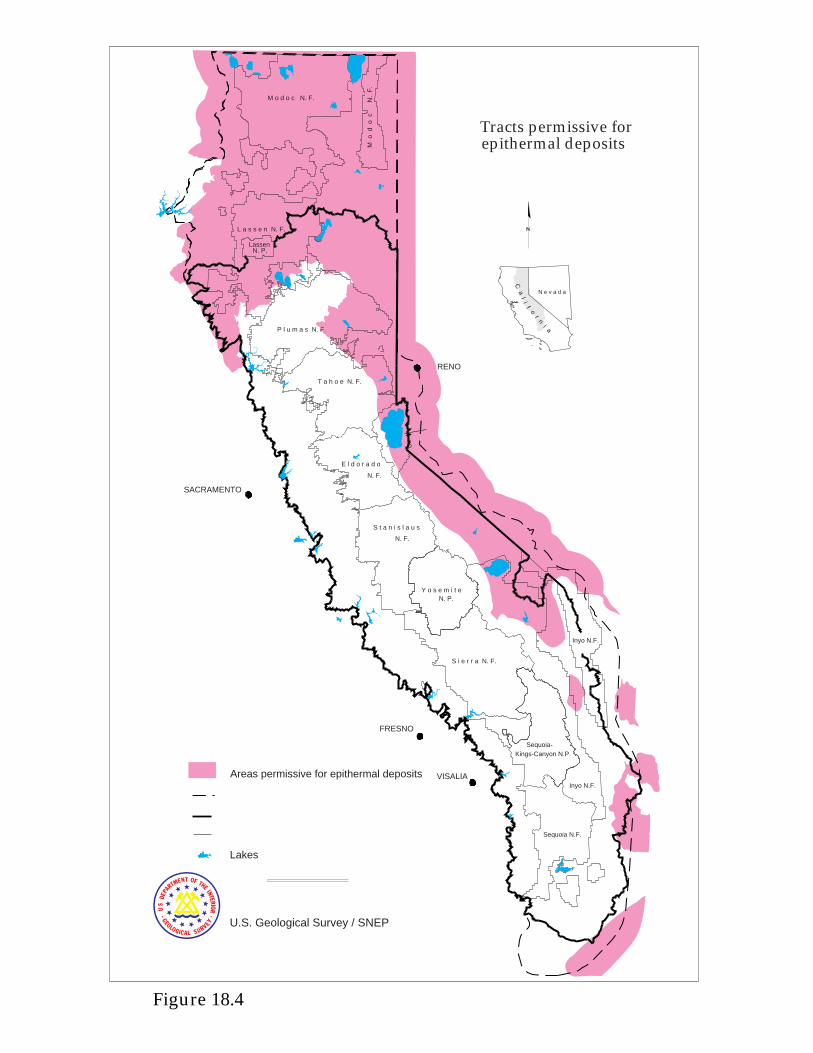
Rationale for Tract Delineation
The permissive tract is a nearly continuous area marked bysmall plutons that intrude Precambrian metamorphic andPrecambrian and Paleozoic sedimentary rocks in a highlyfaulted part of the Mesozoic continental margin (figure 18.5).There are few areas that truly lack carbonate or other reactiverocks, so the entire sedimentary section is included. Small
areas of basin fill more than 1 km (0.6 mi) in depth are ex-cluded.
Rationale for Numerical Estimate
The terrane for which the estimates were made does not in-clude the entire permissive tract within the SNEP study area,but rather a subset of it. The permissive terrane within theSNEP study area is 63,147 km2 (24,667 mi2) and the terranewithin it for which the estimates were made is 17,700 km2
(6,900 mi2). The remainder is in four subsets of larger nearbyterranes. The additional terrane is thought to be mostly muchless favorable for deposits of this type. The estimates, there-fore, should be treated as minimums but only slightly low.For the ninetieth, fiftieth, tenth, and fifth percentiles, the teamestimated zero, one, one, and two or more copper skarn de-posits consistent with the grade and tonnage model of Jonesand Menzie (1986) (Mark 3, no. 8). The “expected value” forthis set of estimates is 0.7 deposits. Deposits of this type world-wide have a mean tonnage of 0.56 million tonnes (0.62 mil-lion short tons) and a mean grade of 1.7% copper, 2.8 g/t(ppm) gold, and 36 g/t (ppm) silver. The mean amount ofcontained metal is 55,496 tonnes (61,184 short tons) copper,0.91 tonne (1.00 short ton) gold, and 8.20 tonnes (9.0 shorttons) silver.
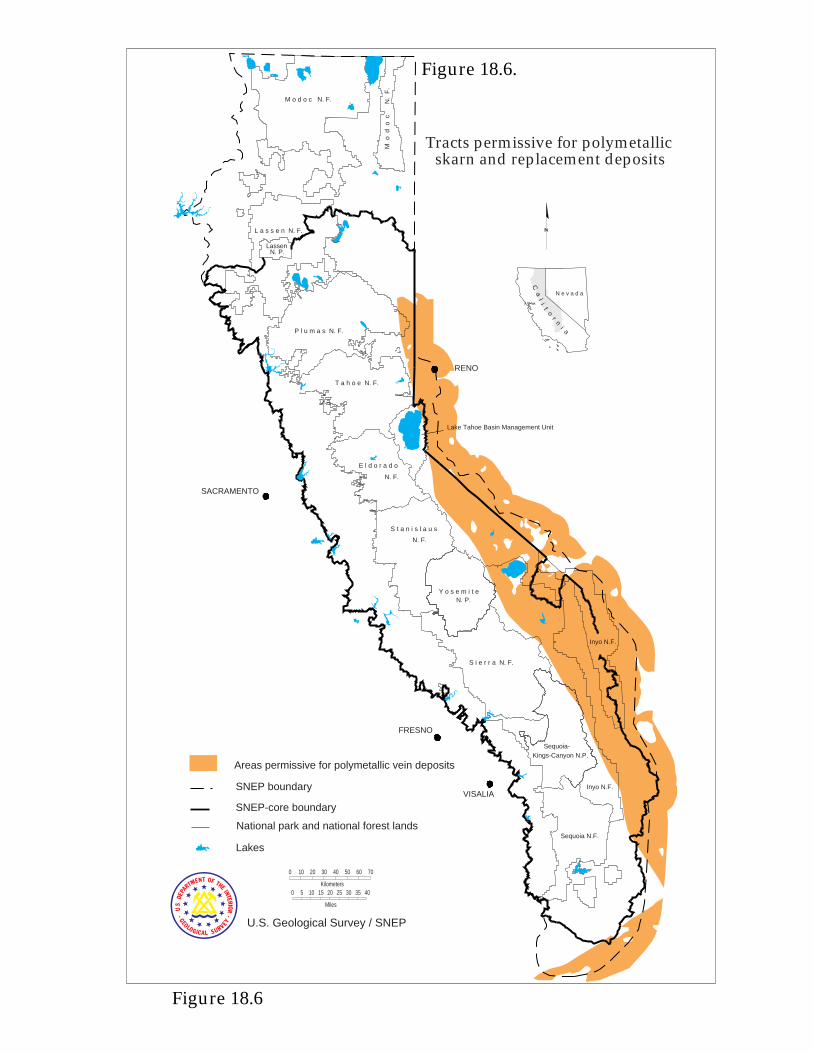
P O LY M E TA L L I C S K A R N A N DR E P L A C E M E N T D E P O S I T S
Polymetallic skarn and replacement deposits are hydrother-mal, epigenetic deposits that contain silver, lead, zinc, andcopper minerals in massive lenses in limestone, dolomite, orother reactive rocks, with or without calc-silicate minerals,near igneous intrusive contacts (Models 19A and 18C, USGSBulletin 1693).
Rationale for Model Choice
Mesozoic plutons on the southeast flank of the Sierra Nevadabatholith show a consistent association with numerous zinc-lead skarn and polymetallic replacement districts where theyintrude Paleozoic carbonate rocks (figure 18.6). These districtsinclude Darwin, Cerro Gordo, Modoc, Santa Rosa (MacKevett1953), and Ubehebe (McAllister 1955). Darwin, the largest,produced more than a million metric tons of ore containingabout 6% lead, 6% zinc, 0.2% copper, 200 g/t (ppm) silverand recoverable gold (Hall and MacKevett 1962; Newberryet al. 1991).
The Shoshone (Tecopa) district (Carlisle et al. 1954) pro-duced about 600,000 metric tons of lead-zinc-silver ore and isthe largest of a group of similar districts that includes Queenof Sheba, Honolulu, Ashford, Paddy’s Pride, and Blackwater.
Areas permissive forskarn deposits.
Areas permissive for skarn deposits
LassenN. P.
Lake Tahoe Basin Management Unit
L a s s e n N. F.
P l u m a s N. F.
E l d o r a d o
N. F.
S t a n i s l a u s
N. F.
N. P.Y o s e m i t e
S i e r r a N. F.
Inyo N.F.
M o d o c N. F.
M o
d o
c
N
. F
.
T a h o e N. F.
Inyo N.F.
Sequoia N.F.
U.S. Geological Survey / SNEP
VISALIA
RENO
FRESNO
SACRAMENTO
Sequoia-Kings-Canyon N.P.
Lakes
N e v a d aC
al
if
or
ni a
0 10 20 30 40 50 60 70
Kilometers0 5 10 15 20 25 30 35
Figure 18.1
Figure 18.5
skarn and replacement depositsTracts permissive for polymetallic
LassenN. P.
L a s s e n N. F.
P l u m a s N. F.
E l d o r a d o
N. F.
S t a n i s l a u s
N. F.
N. P.Y o s e m i t e
S i e r r a N. F.
Inyo N.F.
M o d o c N. F.
M o
d o
c
N
. F
.T a h o e N. F.
Inyo N.F.
Sequoia N.F.
U.S. Geological Survey / SNEP
VISALIA
RENO
FRESNO
SACRAMENTO
Sequoia-Kings-Canyon N.P.
N e v a d a
Ca
li
fo
rn
i a
0 10 20 30 40 50 60 70
Kilometers0 5 10 15 20 25 30 35 40
Miles
Areas permissive for polymetallic vein deposits
Lakes
National park and national forest lands
SNEP boundary
SNEP-core boundary
Lake Tahoe Basin Management Unit
Figure 18.6.
Figure 18.6
16VOLUME I I , CHAPTER 18
These districts are all localized within the Late ProterozoicNoonday Dolomite and have no consistent relation with ig-neous rocks of any specific age. They also have much lowerpyrite contents compared to the ores related to Jurassic plu-tons. They may be incorrectly classified here as polymetallicreplacement districts; however, more work needs to be doneto establish their classification.
Zinc-lead skarn deposits are possible in the same environ-ment as polymetallic replacement deposits; therefore, a newmodel that combines the zinc-lead skarn (Mosier 1986) andpolymetallic replacement (Mosier et al. 1986) was used to rep-resent the undiscovered districts (Models 19A and 18C) (Mark3, no. 92).
Rationale for Tract Delineation
The permissive tract is a nearly continuous area that encom-passes many small plutons that intrude Proterozoic metamor-phic and Proterozoic and Paleozoic sedimentary rocks in ahighly faulted part of the Mesozoic continental margin. Smallareas of basin fill more than 1 km (0.6 mi) in depth are ex-cluded.
Rationale for Numerical Estimate
The terrane for which the estimates were made does not in-clude the entire permissive tract within the SNEP study area,but rather a large subset of it. The permissive terrane withinthe SNEP study area is 31,680 km2 (12,375 mi2) and the ter-rane within it for which the estimates were made is 19,505km2 (7,619 mi2). The remainder is in two subsets of largerterranes, much of which is less favorable for undiscovereddeposits. The estimates, therefore, should be treated as mini-mums but only slightly low. For the ninetieth, fiftieth, tenth,and fifth percentiles, the team estimated zero, three, five, andeight or more districts consistent with the combined gradeand tonnage model for zinc-lead skarn (Cox 1986) andpolymetallic replacement districts (Morris 1986) of D. A.Singer (Donald A. Singer, e-mail to David H. Root, Septem-ber 1994) (Mark 3, no. 92). This estimate was based on thebelief that approximately three known districts have gradesand tonnages close to the median of the combined model. Anequal number of undiscovered districts probably exists un-der cover or in old districts that are, as currently known, toosmall to fit the tonnage model distribution. The “expectedvalue” for this set of estimates is 2.93 deposits. Because thesize of any undiscovered deposit will depend on its deposittype, more information about the target area is needed to listan expected mean tonnage and grade; polymetallic replace-ment-type deposits worldwide have a mean containedamount of zinc and lead of 0.336 million and 0.344 milliontonnes (0.370 million and 0.379 million short tons), respec-tively, whereas polymetallic skarn-type deposits have 0.113million and 0.256 million tonnes (0.125 million and 0.282 mil-lion short tons) respectively.
K N O W N M I N E S , C L A I M S ,A N D P R O S P E C T S
The U.S. Bureau of Mines at the Western Field OperationsCenter in Spokane, Washington, has produced a series of mapsfor the SNEP report. The data consist of minerals availabilityinformation, mine-claim maps, and maps showing areas ofdevelopment interest.
The Mineral Industry Location System (MILS) database isa subset of the Minerals Availability System (MAS) whichmaintains comprehensive minerals development informationon significant deposits as well as less-detailed data on manyadditional deposits and mineralized areas worldwide. MILSemphasizes properties that have undergone exploration/pros-pecting or some form of past, present, or intended futuredevelopment. Database fields include location, mineral com-modities, production status, type of operation (for example,prospect, surface, underground, placer, processing facility),and bibliography. Where the data are not proprietary, infor-mation on reserves, tonnage, and grade may be included.Database searches can be performed on any element in thedatabase. Additionally, data from MILS are easily combinedwith other data to screen on abandoned and inactive minelands for chemical hazards. Plate 18.2 shows the total con-centration of mineral deposits in the SNEP study area. A ver-sion of MILS is in preparation as a CD-ROM (Oddenino etal., 1995) and should be available by the end of 1995.
The BLM claim recordations database for both Californiaand Nevada was used. Several maps derived from it havebeen placed on the anonymous FTP site mojave.wr.usgs.gov/pub/mdiggles/snep. These maps show the diversity of openlode claims per section (640 acres) (plate 18.3), density of openplacer claims per section (plate 18.4), density of total claimsper section, both open (active) and closed (former) and bothlode and placer (plate 18.5), and density of open claims persection, both lode and placer (plate 18.6).
The mine-claim database is used to generate various mapsand lists and help analyze the extent of past, present, andpotential future mineral development. More sophisticatedanalyses were performed when elements of the claim data-base were combined with other mining and geological infor-mation to delineate known mineral deposit areas (plate 18.7).This map is used to analyze environmental disturbances andsocioeconomic costs and benefits for potential future devel-opment.
M E R C U R Y I N T H E S I E R R AN E VA D A E C O S Y S T E M
Both anthropogenic and natural sources of mercury affect theSierra Nevada ecosystem. Natural sources of mercury include

California
Oregon
Mineral locations from U.S. Bureau of Mines MILS (MineralIndustry Location System) – all commodities
U.S. Forest Service
National Park Service
Bureau of Land Management
SNEP study area boundary
SNEP core area boundary

PLATE 18.2
Location of mineral deposits within the SNEP study area.
California
Nevada
Nevada
Oregon
California
Tom HillmanU.S. Bureau of Mines W.F.O.C.(509) 353-2700

California
California
Nevada
Oregon
1-12 open claims/section13-24 open claims/section25+ open claims/section
U.S. Forest ServiceNational Park ServiceBureau of Land ManagementSNEP study area boundarySNEP core area boundary
Nevada
Oregon
California
Tom HillmanU.S. Bureau of Mines W.F.O.C.(509) 353-2700
Claim Density data courtesy ofU.S. Bureau of Land ManagementDenver Service Center, CO
PLATE 18.3
Density of open lode claims per section in the SNEP study area.

California
California
Nevada
Oregon
Nevada
Oregon
California
Tom HillmanU.S. Bureau of Mines W.F.O.C.(509) 353-2700
Claim Density data courtesy ofU.S. Bureau of Land ManagementDenver Service Center, CO
1-12 open claims/section
13-24 open claims/section
25+ open claims/section
U.S. Forest Service
National Park Service
Bureau of Land Management
SNEP study area boundary
SNEP core area boundary
PLATE 18.4
Density of open placer claims per section in the SNEP study area.

California
California
Nevada
Oregon
Nevada
Oregon
California
Tom HillmanU.S. Bureau of Mines W.F.O.C.(509) 353-2700
Claim Density data courtesy ofU.S. Bureau of Land ManagementDenver Service Center, CO
1-12 open claims/section
13-24 open claims/section
25+ open claims/section
U.S. Forest Service
National Park Service
Bureau of Land Management
SNEP study area boundary
SNEP core area boundary
PLATE 18.5
Total claim density per section in the SNEP study area.

California
California
Nevada
Oregon
Nevada
Oregon
California
Tom HillmanU.S. Bureau of Mines W.F.O.C.(509) 353-2700
Claim Density data courtesy ofU.S. Bureau of Land ManagementDenver Service Center, CO
1-12 open claims/section
13-24 open claims/section
25+ open claims/section
U.S. Forest Service
National Park Service
Bureau of Land Management
SNEP study area boundary
SNEP core area boundary
PLATE 18.6
Open claim density per section in the SNEP study area.

California
California
Nevada
Oregon
Known mineraldeposit areas
U.S. Forest Service
National Park Service
Bureau of Land Management
SNEP study area boundary
SNEP core area boundary
Nevada
Oregon
California
Tom HillmanU.S. Bureau of Mines W.F.O.C.(509) 353-2700
PLATE 18.7
Known mineral deposit areas in the SNEP study area.
17Geology and Minerals Issues
mineral deposits containing anomalous concentrations ofmercury, undeveloped hot springs and thermal gas vents,recently active faults, passively degassing volcanoes, andmercury derived from the natural global atmospheric mer-cury cycle and added to the ecosystem through wet and drydeposition (plate 18.8). Anthropogenic sources of mercuryinclude mercury introduced during gold mining and process-ing (Lindberg et al. 1979), developed geothermal areas, andmercury, derived from the atmosphere, primarily from coalcombustion (Mason et al., 1994), and added to the ecosystemby precipitation. Plant communities in the ecosystem are im-portant in concentrating and redistributing mercury (Lindberget al. 1995).
Mercury from the GlobalAtmospheric Mercury Cycle
The primary source of mercury to the Sierra Nevada ecosys-tem is from the global atmospheric mercury cycle. Both an-thropogenic and natural sources of mercury are of equalimportance to the global mercury cycle, adding about 6,000to 7,500 metric tons of mercury to the atmosphere per year(Nriagu and Pacyna 1988). The most important natural sourceis from evasion of elemental mercury vapor, Hgo, from theworld’s oceans; the major anthropogenic source comes fromcoal combustion (Fitzgerald 1989; Rasmussen 1994). Soil gasemission is the third most important source of Hgo to the at-mosphere. The atmospheric mercury flux to the terrestrialenvironment has increased substantially since the beginningof the industrial period (about 1850) because of anthropogenicrelease of mercury into the atmosphere.
In California, sources of anthropogenic mercury emissionto the atmosphere include waste incineration, electric utilitypower plants (including coal, oil, and geothermal poweredplants), coal and petroleum combustion and uses, industrial-commercial sources, paint emissions, mine roasting and smelt-ers, mobile sources (vehicles, tractors, locomotives), fugitiveemissions from mine tailings and waste, landfills, and, in thepast, mercury catalysts for caustic soda (now nearly all re-placed). Natural sources of mercury to the atmosphere in de-creasing importance include oceans, erupting volcanoes, soilvapor flux (Lindberg et al. 1995), geothermal systems and hotsprings (Janik et al. 1994; Rytuba and Miller 1994), passivelydegassing volcanoes (Varekamp and Buseck 1986), fumaroles,soil vapor from mineralized areas, and active faults.
Wet Deposition of Mercury
Pacific weather fronts that move through the Sierra Nevadaecosystem are the primary source of wet deposition of mer-cury from the atmosphere in either rain or snow. The mer-cury species in precipitation is primarily in the ionic, oxidizedform, Hg++, which is derived from photooxidation of elemen-tal mercury vapor, Hgo, and Hgo aerosols, primarily by ozone(Gill and Bruland 1990). The flux of wet deposition of mer-cury to the Sierra Nevada ecosystem is about 13 mg/m2/yr
and may vary by several micrograms near regional pointsources that vent mercury to the atmosphere.
Dry Deposition of Mercury
Dry deposition of mercury is important in the terrestrial partof the atmospheric mercury cycle. Elemental mercury vapor,Hgo, and Hgo aerosols from the atmosphere are taken up byplant communities in the Sierra Nevada ecosystem. Dry depo-sition accounts for about 6 mg/m2/yr of mercury added tothe ecosystem.
Effect on Plant Communitiesof Elevated Mercury Content
Mercury in Ambient Air
Typical mercury concentrations in ambient atmosphere in theSierra Nevada ecosystem range from 2 to 3 mg/m3. Ambientconcentration of mercury in the atmosphere is important indetermining whether plant communities in the Sierra Nevadaecosystem take up mercury into their leaves. Mercury uptakethrough the plant’s root system is low relative to uptakethrough foliage. At low ambient mercury concentrations,plants give off mercury to the atmosphere through their foli-age, and the foliage does not increase in mercury concentra-tion during its growth cycle. At high ambient concentrationsof mercury, plants take up mercury through their leaves di-rectly from the air. Thus, for example, in a contaminated minesite where ambient air concentration of mercury is high, themercury content of leaves increases throughout the growthcycle. Litter fall from plants and wash off from leaves are majorcomponents of mercury added to soils, creeks, and lakes.
Elemental mercury vapor, Hgo, is the dominant mercuryspecies in the atmosphere at normal ambient concentrations(Seigneur et al. 1994) as well as in geologic environmentswhere elevated concentrations of mercury are present in air.Hg++ is present at low levels in the atmosphere. ParticulateHg may be a significant component in emanations from vol-canoes such as Lassen Peak. In volcanic and geothermal en-vironments and contaminated mine sites, the ambient airconcentration can increase to several orders of magnitudeabove normal.
Natural geologic sources of mercury having the greatestpotential regional impact on ambient atmospheric concentra-tion include, in decreasing importance, active volcanoes, pas-sively degassing volcanoes, geothermal areas, mineralizedareas, and active faults. Permissive tract maps for epithermaldeposits (figure 18.4), low-sulfide gold quartz (Mother Lodegold) (figure 18.1), and kuroko (figure 18.2) (listed in decreas-ing order of importance) delineate those areas with the po-tential for elevated ambient mercury concentrations in airwhere these deposits are exposed at the surface or coveredby residual soils and alluvium. Deeply buried, these depositswill not contribute mercury to the ambient atmosphere. El-evated fluxes of soil gas emission from these areas, combinedwith the atmospheric mercury flux, may cause above-normal
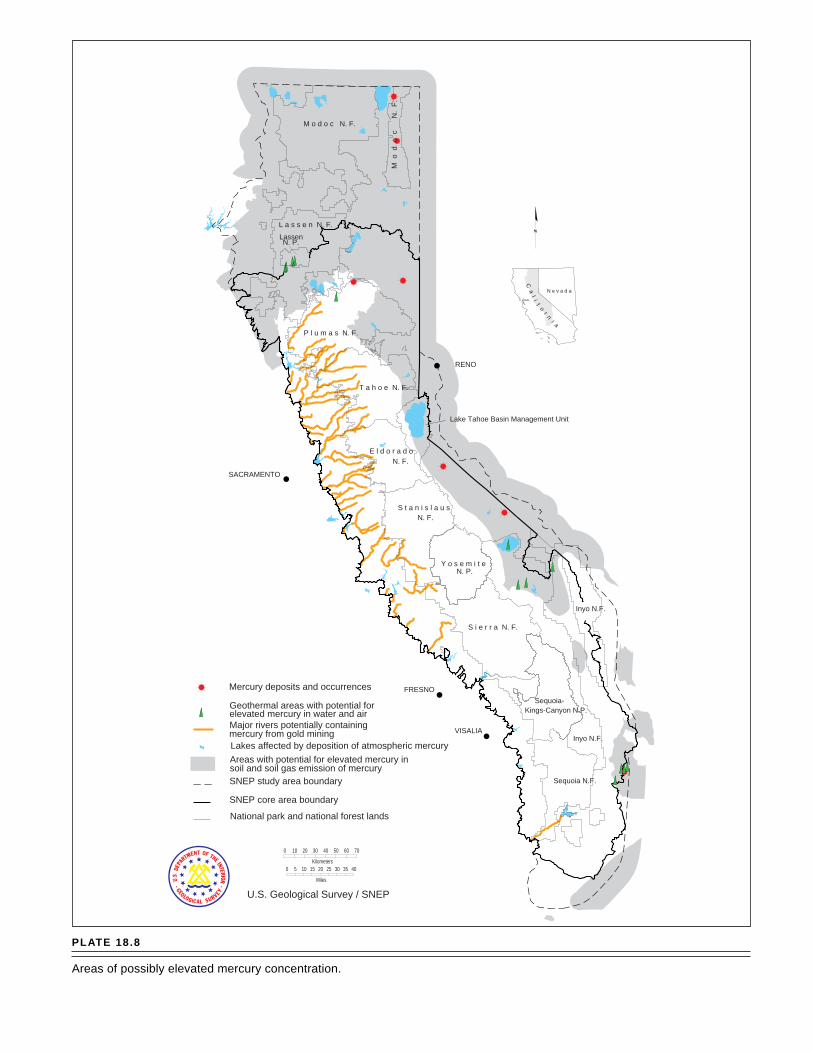
soil and soil gas emission of mercuryAreas with potential for elevated mercury in
Lakes affected by deposition of atmospheric mercury
Major rivers potentially containingmercury from gold mining
Geothermal areas with potential forelevated mercury in water and air
Mercury deposits and occurrences
National park and national forest lands
SNEP study area boundary
SNEP core area boundary
0 10 20 30 40 50 60 70
Kilometers0 5 10 15 20 25 30 35 40
Miles
LassenN. P.
Lake Tahoe Basin Management Unit
L a s s e n N. F.
P l u m a s N. F.
E l d o r a d oN. F.
S t a n i s l a u sN. F.
N. P.Y o s e m i t e
S i e r r a N. F.
Inyo N.F.
M o d o c N. F.
T a h o e N. F.
Inyo N.F.
Sequoia N.F.
U.S. Geological Survey / SNEP
VISALIA
RENO
FRESNO
SACRAMENTO
Sequoia-Kings-Canyon N.P.
N e v a d aC
al
if
or
ni a
M o
d o
c
N
. F
.
PLATE 18.8
Areas of possibly elevated mercury concentration.

18VOLUME I I , CHAPTER 18
concentrations of mercury in plant foliage. Plant material fall-ing to the forest floor leads to litter-fall deposition flux ofmercury exceeding the normal level of 20 mg/m2/yr. Plantsin these tracts are an important source of mercury contami-nation to creeks and lakes.
Mercury Concentrations at Geothermal Sites
Natural point sources of mercury that persist over geologi-cally long periods may have a regional impact on the ambi-ent atmospheric concentration of mercury in the atmosphere.More importantly, these sources will affect the uptake of mer-cury by plant communities adjacent to these areas. Geother-mal areas in the Sierra Nevada ecosystem such as the Lassen,Long Valley, and Coso volcanic centers are point sources formercury emission into the atmosphere. Ambient mercury con-centrations in air are elevated in these areas, and adjacent plantcommunities will take up mercury through their leaves andconcentrate mercury in foliage. Mercury concentrations inwash off and litter fall from these plant communities will haveelevated and will exceed the normal flux of mercury fromlitter fall, about 20 mg/m2/yr, and wash off, about 6 mg/m2/yr, to the soil and into drainage basins and lakes.
Mercury Concentrations at Mine Sites and Ore Deposits
In areas with kuroko, low-sulfide gold-quartz (Mother Lodegold), and epithermal ore deposits (see figures 18.1, 18.2, and18.4), elevated mercury levels can be expected in soils aboveand adjacent to the deposit. In mine sites where mercury wasused in the gold amalgamation process, elevated mercury lev-els are present in the soils and tailings. In these areas, nativemercury was also released into nearby creeks.
Gas emission from soils above and adjacent to ore depositsand from contaminated soils in mine sites can be expected toexceed the natural soil gas flux of mercury of about 7 mg/m2/yr. Elemental mercury vapor flux from contaminatedsoils, soils from mineralized areas, and soils in areas withnaturally elevated background mercury is controlled pri-marily by volatilization of Hgo and secondarily by biotic andabiotic reduction of Hg++ in pore water to Hgo. The Hgo fluxfrom soil increases exponentially with increases in soil tem-perature. Thus, during the summer, soil gas emission willbe greatest, and uptake of mercury into plant leaves willbe highest.
Typical Hgo flux from contaminated soils in mine sites andmeasured above contaminated soils range from 10,000–22,000mg/m2/h, compared to background values of 1–10 mg/m2/h. Mercury concentration in air over contaminated soils rangesfrom 3–4 mg/m3, compared to background concentrations of1–2 mg/m3. The yearly soil emission flux of mercury froma contaminated soil or mine site ranges from 10–100 kg ofHgo/km2.
Mercury in Water and Sedimentof Seepage Lakes
In seepage lakes within the Sierra Nevada ecosystem, the glo-bal increase in the mercury flux is recorded in lake sediments(Hurley et al. 1994). Before about 1850, baseline mercury con-centrations in lake sediments are relatively constant and rangefrom 10–50 mg/m2/yr. From about 1850 until about 1960–70,anthropogenic mercury associated with industrializationadded to the atmospheric mercury cycle and increased mer-cury content in lake sediments. Maximum recorded mercuryconcentrations range from 55–2,000 mg/g. Because of restric-tion of mercury release to the atmosphere since the 1960–70period, sediments deposited in lakes since that time showdecreased mercury concentration. However, this mercurycontent is still above initial baseline concentration.
The ratio of the maximum mercury content in the sedimen-tary record at about 1960–70 to the baseline concentrationbefore evidence of anthropogenic input is termed the enrich-
ment factor. Enrichment factors for seepage lakes are a func-tion of the lake’s location and range from two to about six.Little is known about the exact magnitude of enrichment fac-tors for lakes in the Sierra Nevada ecosystem or about theeffect of regional point source mercury sites on these lakes.
Methylmercury concentration in lake sediments shows asimilar pattern of enrichment and then decline in last twodecades, but the concentrations of methylmercury are con-siderably lower. The enrichment factors are much higher how-ever, ranging from twelve to fifteen. In preindustrial (pre-1850)sediments, methylmercury typically constitutes 0.15%–0.3%of the total mercury present, and, in the sediments reflectinghigh anthropogenic mercury input, methylmercury consti-tutes from 0.4%–1.4% of the total mercury present. Methyl-mercury concentration in sediment corese before the industrialperiod is about 0.2 mg/g and in modern-day sediments rangesup to 1.5 mg/g.
In the lakes, biologically mediated reduction of Hg++ inlarge part controls the Hgo concentration and evasion rate ofHgo from the lake to the atmosphere. Removal of mercurythrough sedimentation is relatively low and about equiva-lent to the fluvial flux of mercury into lakes. Evasion is theprimary factor in removal of mercury from seepage lakes inthe Sierra Nevada ecosystem. The total mercury flux addedto lakes is about 50 mg/m2/yr.
Methylmercury in Lakes
Formation of methylmercury in lakes is an important envi-ronmental factor. Methylmercury (CH3Hg+) concentrationincreases in organisms that are higher in the food chain re-sulting in significant biomagnification of methylmercury inspecies such as fish. This high concentration results princi-pally because methylmercury has a long biological half-lifein fish. Low levels of methylmercury in lake water may re-sult in very high levels in fish and affect the wildlife that con-

19Geology and Minerals Issues
sume fish, as well as the quality of fisheries for human con-sumption. This problem is the primary environmental con-cern with respect to methylmercury.
Formation of methylmercury in lakes and wetlands is fa-vored by low pH of the water and high levels of dissolvedorganic carbon. Mercury methylation is a co-metabolic reac-tion, and biotic methylation accounts for nearly all the meth-ylmercury in most lakes. Sulfate-reducing bacteria are themost important mediators in the biotic methylation process,a process inhibited by the absence of sulfate. Methylmercuryfrom precipitation accounts for less than 1% of total mercuryin a lake system.
Wetlands play a major role in forming methylmercury be-cause of their low pH and high levels of dissolved organiccarbon. In the wetland environment, abiotic methylation ofHg++ most likely occurs in the presence of humic acids andmetal catalysts.
Demethylation is primarily mediated by enzymes in singlecells in a variety of organisms within lakes. Detrital particlessuch as clays and organic matter absorb Hg++ from water,and sedimentation of these particles reduces the methylationprocess. Methylmercury is also partly removed from thewater during sedimentation and sequestered in sediments.The sediment trap flux is typically an important factor in themethylmercury cycle.
Nearly all methylmercury is formed in the lake ecosystem.For many lakes the primary concentration of methylmercuryresides in the fish population. Methylmercury in the watercolumn is relatively low and only somewhat higher than thatpresent in zooplankton.
S E R P E N T I N E A N D L I M E S TO N EA S H O S T S F O R R A R E P L A N T S
A preliminary digital version of the geologic map of Califor-nia (Jennings 1977) is currently being revised by the USGSand the California Division of Mines and Geology. We haveused this draft digital file to produce a map showing areasunderlain by ultramafic rocks, such as serpentine (unit um)(Jennings 1977) (plate 18.9). This map is useful in assessingthe extent of areas where rare plants are likely to be presentand in assessing the completeness of the rare-plant lists, be-cause the plants that have adapted to serpentine soils areuncommon. Plants that grow in such soils include, but arenot limited to, Lewisia, pitcher plant, Indian paintbrush,Mariposa lily, and lady’s slipper (Kruckeberg 1984). Soils de-veloped on carbonate rocks also host rare plants. Therefore,we plotted those areas underlain by carbonate rocks, such aslimestone and for other map units that contain carbonaterocks. The units that contain carbonate rocks are further di-vided into those dominated by carbonate rocks and thosedominated by clastic rocks. On Jennings’s (1977) map, the
units are ls (limestone), Pm (Permian rocks that may containlimestone and dolomite), Tr (Triassic units that likewise mayinclude carbonate rocks), and D (Devonian units that like-wise may include carbonate rocks).
S E R P E N T I N E - H O S T E DA S B E S T O S
Chrysotile (white asbestos) is found in veins in serpentinizedultramafic rocks. Protoliths include ophiolite and stratiformcomplexes. The veins commonly originate from fractures de-veloped in response to stresses in shear zones, notably nearchanges in rock competency, as near margins of serpentinitebodies and contact aureoles of later intrusive rocks, but somedeposits may result from more uniformly distributed stresses.Minor asbestos veins can be found in unaltered ultramaficrocks adjacent to serpentinite. General references on the ge-ology of these deposits are Virta 1989; Ross 1981; Shride 1969,1973; Chidester et al. 1978; and Anhaeusser 1986. Referenceson the environmental geology include Coleman in press andDerkies 1985.
The following discussion is part of a draft mineral-envi-ronmental model book that is in preparation by the MineralsTeams at the USGS (Wrucke in preparation).
Economic Geology
Serpentine-hosted asbestos deposits do not show significantcorrelation between tonnage and grade (Orris 1992). The meantonnage is 17 tonnes (19 short tons) with the range at one stan-dard deviation of between 2 and 149 tonnes (2.2 and 164 shorttons). The mean grade asbestos is 4.6% with the range at onestandard deviation of between 1.9% and 11%. These figuresare reported with no distinction between types of asbestos(cross and slip fibers).
Potential Environmental Impact
Reserves of chrysotile fiber at the asbestos deposit nearCopperopolis, Calaveras County, are reported to be about 1.2million tonnes (1.3 million short tons) (Rice 1966). The de-posit, now closed, is used as an asbestos waste dump. Theimpact of deposits of this type consist of the following
1. Natural exposures of asbestos-bearing rock, particularlyserpentinite derived from ultramafic rocks, are readilyeroded by natural agents and human activities becausemost serpentinite is composed of incompetent, highly frac-tured rock. A few serpentinite bodies are highly resistantto erosion.

Areas with possible limestone outcrops
Ultramafic rock outcrops
0 10 20 30 40 50 60 70
Kilometers0 5 10 15 20 25 30 35 40
Miles
LassenN. P.
Lake Tahoe Basin Management Unit
National park and national forest lands
SNEP study area boundary
SNEP core area boundary
L a s s e n N. F.
P l u m a s N. F.
E l d o r a d o
N. F.
S t a n i s l a u s
N. F.
N. P.Y o s e m i t e
S i e r r a N. F.
Inyo N.F.
M o d o c N. F.
M o
d o
c
N
. F
.
T a h o e N. F.
Inyo N.F.
Sequoia N.F.
U.S. Geological Survey / SNEP
VISALIA
RENO
FRESNO
SACRAMENTO
Sequoia-Kings-Canyon N.P.
Lakes
N e v a d a
Ca
li
fo
r ni a
PLATE 18.9
Serpentine and carbonate-rich rocks.
20VOLUME I I , CHAPTER 18
2. Asbestos from sedimentary deposits and debris slides fromasbestos-bearing rocks is redistributed by water and wind.
3. Vehicles driven across serpentinite and mine waste candislodge asbestos, adding it to dust or runoff. Roads alsoproduce channels that aid runoff. The surface area of roadsin the southern half of the chrysotile-bearing New Idriaserpentinite in San Benito County exceeds the area dis-turbed by the three largest asbestos mines (Woodward-Clyde Associates 1989).
4. Waste generated from asbestos mining and milling opera-tions exposes asbestos to erosion by natural agents. TheEPA considers mine waste containing more than 1% as-bestos to be hazardous (Derkies 1985). The California AirResources Board considers asbestos contents of mine wastegreater than 5% as a potential toxic hazard (Resolution 91-27, April 1990).
5. Asbestos fibers can be picked up by surface drainage inareas of asbestos-bearing rocks and mines. In central Cali-fornia, water in the California aqueduct system containsasbestos (Kanarek et al. 1980; Coleman 1995). However,the EPA has concluded that there is no significant risk ofcancer from the ingestion of asbestos fibers (EPA 1991).
6. Chrysotile deposits may contain small amounts of fibroustremolite, which the EPA classifies as asbestos and a riskto human health (OSHA 1975).
7. Health risks to humans from exposure to small quantitiesof chrysotile asbestos in the environment are controver-sial. The controversy results from the EPA assumption thatany amount of asbestos is potentially hazardous.
Environmental Considerations
Host Rocks and Surrounding Geologic Terrane
Serpentine-hosted deposits are present in massive serpen-tinite, commonly highly sheared and widely exposed, thathas largely replaced the host protolith. Associated ultramaficrocks locally host asbestos veins. Most serpentine-hosted de-posits have developed in ophiolite complexes, which are com-posed of oceanic crustal fragments consisting of a basalperidotite (that becomes serpentinized) overlain in sequenceby cumulate gabbro, sheeted dikes, and pillow basalt, oftencapped by deep-oceanic pelagic sedimentary deposits.Accreted ophiolite often is dismembered into structurallycomplicated relationships.
Mineral Characteristics
Chrysotile is one of six mineral species called asbestos be-cause of their fibrous habit (Skinner et al. 1988). Of these,chrysotile is the only fibrous serpentine mineral. The five otherasbestos minerals belong to the amphibole group; these aregrunerite asbestos (commonly referred to as amosite),riebeckite asbestos (commonly referred to as crocidolite),
anthophyllite asbestos, tremolite asbestos, and actinolite as-bestos.
Hydrology
Debris slides along the flanks of serpentinite bodies and indrainage channels can contain asbestos-bearing material avail-able for removal and dispersion by streams (Cowan 1979).During flood stage, streams flowing into the San Joaquin Val-ley from the New Idria mass have introduced sediments intothe California aqueduct (Coleman 1995). Asbestos fibers havebeen found in the water supply for San Francisco (Kanarek etal. 1980).
Asbestos Mobility from Mining Operations
Mine dumps and mill tailings at chrysotile deposits aresources of asbestos in runoff water and are more easily erodedthan outcrops. The principal concerns associated with min-eral processing include dust and tailings from asbestos mill-ing operations. Asbestos fibers in tailings are available forairborne and fluvial transport.
Controversy Regarding Health Risks toHumans from Chrysotile Asbestos
The risk of asbestos to human health has been known since atleast 1906 when deaths of workers in an asbestos weavingmill in France were noted (D’Agostino and Wilson 1993). Inthe 1920s, a death from asbestosis (fibrosis of the lung) wasreported, and the disease was named (Sawyer 1987). How-ever, not until the 1960s were the biologic effects of asbestosfibers documented in great detail and a relationship clearlyestablished between exposure to asbestos and lung disease,including cancer. As a result of increasing concern about thehealth hazards of asbestos minerals, the U.S. OccupationalSafety and Health Administration (OSHA) in 1971 issuedregulations restricting airborne asbestos in the workplace, andin 1987 OSHA established the current standard of 0.2 fibersper cubic centimeter of air in the workplace. However, theregulations do not discriminate between fibers of the differ-ent asbestos minerals. Since the establishment of these regu-lations, numerous studies have supported the conclusion thatsignificant differences exist in the health effects of the vari-ous asbestos minerals. For example, the few cases of mesothe-liomas (cancer of the pleura or peritoneum) in Canadianchrysotile miners and mill workers appear to be not fromchrysotile but perhaps from small amounts of tremolite as-bestos, and a study of British workers manufacturing frictionmaterials using only chrysotile showed no excess of deathsfrom lung diseases (Mossman et al. 1990). Chrysotile has beenfound to have the least health effects of any asbestos mineralin occupational exposure and to produce no excess lung can-cer in people exposed to chrysotile alone in amounts morethan ten times higher than recommended by the EPA(Coleman in press).

21Geology and Minerals Issues
Risk Assessment
Hazards resulting from the inhalation of asbestos fibers havebeen documented by the EPA and have been the topic of con-siderable scientific inquiry (McDonald and McDonald 1995;D’Agostino and Wilson 1993; Mossman et al. 1990; Skinner etal. 1988; Ross 1981, 1987; Ross and Skinner 1994). Althoughasbestos as a cause of lung disease is well documented, de-bate continues regarding the risk from low levels of exposureto asbestos fibers. In a report prepared for the California En-vironmental Protection Agency, risk from asbestos was notranked because data on low-level exposure were consideredinadequate (California Comparative Risk Project 1994). Stud-ies show that important factors to be considered in evaluat-ing risk from the inhalation of asbestos are the type of asbestosmineral, length and diameter of the asbestos fibrils, amountof asbestos inhaled, and the duration of the exposure. Yet,despite conclusions that risks from chrysotile asbestos are al-most certainly lower than for other asbestos minerals, uncer-tainty in the degree of risk from exposure to chrysotile remainsand results in part from disagreement on the threshold be-low which which inhalation can be considered safe or if sucha threshold level even exists (D’Agostino and Wilson 1993).
The EPA has concluded that inhalation of any amount ofasbestos is potentially hazardous, that a single asbestos fibercan be lethal (Abelson 1990). This conclusion results frombelief that the relationship between asbestos dose and healthrisk is linear, such that there is some risk even at very lowlevels of exposure (D’Agostino and Wilson 1993). Accordingto this theory, there is no safe level of asbestos exposure. In anonlinear relationsh, risk from exposure decreases rapidly atlow levels, and a threshold value can be reached below whichthe risk is zero. Recent studies suggest that low-level expo-sure to chrysotile asbestos in the environment has generatedunwarranted concern (D’Agostino and Wilson 1993) and thatthe single-fiber view is unproved (Abelson 1990). Other stud-ies suggest that there is a threshold value below which expo-sure to chrysotile asbestos causes no measurable health effects(Ross 1987).
Estimates of risk to human health from numerous activi-ties have been quantified, including everyday risks, and a fewattempts have been made to quantify risk of exposure tochrysotile asbestos under different environmental conditions(D’Agostino and Wilson 1993; Coleman 1995). For example,data show that risks from inhaling asbestos during recre-ational activities at the chrysotile-bearing New Idria ser-pentinite or from exposure to asbestos in schools are low.Coleman (in press) concluded that “the apparent risk in mak-ing one trip by automobile to New Idria is 300 times greaterthan inhaling [chrysotile] fibers during a lifetime of recreationin this area.” Risks from occupying schools containing chryso-tile fibers is even lower and has been categorized as harm-lessly small (Abelson 1990).
C A L C I U M C O N C E N T R AT I O N S
James Shevock, a botanist with the U.S. Forest Service in SanFrancisco, suggested the usefulness of a calcium-concentra-tion map for SNEP. Such a map is also being produced byTom Frost, Gary Raines, and Lynn Decker for the InteriorColumbia Basin Ecosystem Management Project. The follow-ing text is excerpted and adapted from Frost, Raines, andDecker (Thomas P. Frost, letter to Michael F. Diggles, Febru-ary 1995).
Rock Types and Calcium Content
A bedrock calcium-concentration map (see plate 18.9 for sim-plified version) might serve as a tool for both addressingstream productivity and providing a measure of acid minedrainage and acid rain buffering capacity. We produced sucha map by grouping rock types into calcium content classes.The base map from which the classes were defined is the digi-tal version of the geologic map of California at 1:750,000 scale(Jennings 1977). Calcium carbonate, or calcite, is the domi-nant carbonate phase or mineral.
Rocks have different calcium contents and the easiest wayto classify elemental abundances is by the weight percentageof the equivalent oxide, in this case CaO. Calcium rarely oc-curs as a mineral CaO, but it occurs complexed in distinctminerals. For example, the mineral calcite (CaCO3) is the maincomponent of limestone and calcic marble or calcite. Calciteis very soluble in water relative to other common mineralsand is typically the dominant mineral dissolved to form hardwater. Other calcium-rich minerals are less soluble undernormal surficial conditions and thus may not be as readilyavailable to the aquatic habitat under otherwise similar con-ditions. Plagioclase feldspar is one of the most common min-erals in the earth’s crust, but there are variations in the calciumand sodium contents of plagioclases found in different rocktypes. Calcium in basalts is localized in calcic plagioclase,clinopyroxene, and glass, which are relatively unstable un-der surficial conditions and readily alter to clays, calcite, andother soft minerals. The calcium, once soluble, is availablefor biotic uptake.
Rocks such as granites have low calcium content. In areassuch as that underlain by the Sierra Nevada batholith, rela-tively little Ca is available. Some of the folded, faulted, andlocally metamorphosed sedimentary rocks of the Sierra Ne-vada roof pendants are high in Ca and are included in plate18.9 with other carbonate-rich rocks.
Carbonate rocks are soluble, but where climate is arid, ason the east side of the Sierra Nevada, carbonate rocks tend tobe the rock types most resistant to erosion. In arid areas, abun-dant calcium may not be available to the aquatic environmentbecause there is no mechanism to dissolve it.

22VOLUME I I , CHAPTER 18
Role of Calcium in Aquatic Systems
The calcium content of waters varies from region to region,reflecting both local geography and climate. Calcium is es-sential for metabolic processes in all living organisms. It playsan important role in its effect on pH and is essential in themain buffering system of natural waters.
Virtually all vertebrates, mollusks, and certain other inver-tebrates require large quantities of calcium (in the form ofCaCO3) as a major skeletal-strengthening material. Becauseanimals need large amounts of calcium, their growth and,ultimately, size may be limited by the lack of it. Where cal-cium is plentiful, for example in what are commonly referredto as “chalk streams,” one will potentially find large macroin-vertebrates and large fish.
Most lakes have a pH of 6 to 9. When the pH of a lake fallsbelow 4 or 5, the species diversity is likely to be severely re-stricted. Most fish species can live in waters with pH rangingfrom 5 to 9. In general, the higher the pH, the greater the pro-ductivity of the waters and the faster the growth rates of thefish and macroinvertebrates. The most productive waters (ingeneral) have a pH of about 8. However, only a few fish areadapted for living in water of pH 8.5 or greater. One exampleof a fish adapted for life in alkaline waters is the Eagle Laketrout in Lassen County, where pH levels may reach 9.6. Ingeneral, water of pH greater than 10 or less than 4 will befatal to fish.
There are at least two obvious difficulties with attemptingto work out ratios of various minerals in solution in a drain-age basin. One is the differential solubilities of minerals andthe other is that the aquatic biota exert selective effects ondissolved substances.
V O L C A N I C H A Z A R D S
The principal volcanic-hazard area in the SNEP study area isin the vicinity of Mammoth Lakes in the Long Valley caldera.Outside the SNEP core study area and within the greaterSNEP study area, volcanic centers of the Cascade Range areimportant as well. These include Lassen Peak, Mount Shasta,and Medicine Lake Volcano.
Long Valley Caldera
Long Valley and Mono Craters have been the site of volcanicactivity for millions of years. Bailey (1989) presents a geo-logic map of the region that shows extent, ages, and de-scriptions of volcanic rocks in the area. He includes acomprehensive treatment of the formation of the caldera,which was the resulted from massive eruptions more than700,000 years ago.
Earthquake activity in the Long Valley region began to in-
crease in 1978 and peaked in 1980. This activity was inter-preted to be the result of magma movement beneath LongValley caldera. Miller et al. (1982) show potential hazard zonesin the region, taking into account common wind directionsand topographic barriers.
A comprehensive response plan for volcanic hazards in theLong Valley caldera and Mono Craters area was prepared byHill et al. (1991) of the USGS in cooperation with the Califor-nia Division of Mines and Geology. In their report, Hill et al.(1991) state that recurring earthquake swarms in Long Valleycaldera through the 1980s and associated inflation of the re-surgent dome in the caldera emphasize that this geologicallyyouthful volcanic system is capable of further volcanic activ-ity. Specific response actions under their plan are keyed to afive-level status ranking of activity level. The activity levelsare eruption likely within hours to days, and intense strong,moderate, or weak unrest. The USGS continuously monitorsvolcanic activity in Long Valley caldera and vicinity by meansof a seismic network and deformation monitoring networks(dilatometers [strainmeters], tiltmeters, and magnetometers).
If activity levels indicate that an eruption is likely, the re-sponse plan states that an eruption will most likely producesmall to moderate volumes of silicic lava similar to the erup-tions that occurred 650 years ago at the north end of MonoCraters and 550 years ago at the Inyo Domes. In this case, wemay expect to see
• phreatic eruptions as the magma interacts with the shal-low ground water producing steam blasts that can throwlarge rocks several hundred meters from the vent (the“eruption” could stop at this point as it did with thephreatic blasts that formed the Inyo Craters)
• an explosive magmatic phase during which hot pumice andash would be ejected thousands of feet into the air produc-ing thick pumice accumulations near the vent, extensivedeposits of fine ash hundreds of kilometers downwind, anddestructive pyroclastic flows that may reach distances asgreat as 5 to 10 km (3–6 mi) from the vent
• a final phase that involves the slow extrusion of lava toform steep-sided flows and domes.
Like the eruptions 550 and 650 years ago, eruptions may oc-cur from several separate vents in succession with the ventsspaced over a distance of 5 to 10 km (3 to 6 mi). Individualeruptions may be separated in time by days or perhaps weeks.Larger, more destructive eruptions following the same basicpattern are possible, but less likely. Also possible, but lesslikely, is a small to moderate eruption of basaltic lava similarto the eruptions that produced the Red Cones several thou-sand years ago. This lava could travel at speeds ranging froma few meters per hour to several kilometers per hour. Theresulting lava flows may extend 10 km (6 mi) or more fromthe vents depending on the vigor and duration of theeruption.

23Geology and Minerals Issues
Miller et al. (1982) include a hazard zone for the unlikelyevent of an eruption as large as that which took place 700,000years ago. Devastation within 120 km (75 mi) would be se-vere to total. Pyroclastic flows would move at speeds of sev-eral hundreds of kilometers per hour. Deposits of ash 15 cm(6 in) thick would fall as far away as 500 km (300 mi) withappreciable thickness deposited all across North America.Such an event has not taken place anywhere on the earth inhistoric times.
Cascade Volcanoes
The three volcanic centers of the Cascade Range within theSNEP study area are Medicine Lake Volcano, Lassen Peak,and Mount Shasta (USGS 1994). Information about Cascadevolcanoes is available from the Cascade Volcano Observatoryof the USGS on the WWW Home Page whose URL is http://vulcan.wr.usgs.gov/home.html. Lassen Peak erupted earlythis century, and Mount Shasta’s last eruption (Miller 1980)was about two hundred years ago. Medicine Lake Volcanohas not erupted in nearly a thousand years.
The following text is published on the WWW at http://vulcan.wr.usgs.gov.
Lassen Peak
This text is excerpted from Hoblitt et al. 1987. The Lassenvolcanic center consists of a chain of vents aligned roughlynorth-south that extends about 8 km (5 mi) north from LassenPeak. Although volcanism began between about 600,000 and350,000 years ago, events of the last 35,000 years are the mostthoroughly studied and form the basis for assessing hazardsfrom future eruptions in the region. The stratigraphic recordof late Pleistocene and Holocene eruptions in this region con-tains evidence of many eruptions during the last 35,000 years
35,000 years ago: Eruptions produced two pyroclasticflows from a vent east of Sunflower Flat near the northend of the chain. These eruptions were followed by ex-trusion of one or more domes at vents in the same area.
25,000–35,000 years ago: Eruptions at Hat Mountain pro-duced andesitic lava flows that reached up to 6 km (4mi) from their vents. About the same time, eruptions ata vent now buried by the Lassen Peak dome producedat least four pyroclastic flows and several short rhyolitelava flows.
20,000 years ago: Eruptions formed an ancestral dome,now buried by the Lassen Peak dome, which is thoughtto have erupted shortly before 11,000 years ago. Duringlate Wisconsin deglaciation, lahars formed on the slopesof Lassen Peak and flowed at least several kilometers,primarily to the northeast.
1,000–1,200 years ago: The Chaos Crags eruptive episodebegan with eruption of a pumiceous tephra. At least two
pyroclastic flows traveled west down Manzanita Creekabout 4 km (2.5 mi) and a similar distance north downLost Creek. Explosive activity generated pyroclasticflows that extended down Manzanita, Lost, and HatCreeks. Shortly thereafter, extrusion of five dacite domesformed the Chaos Crags.
300 years ago: Three or more rockfalls from the ChaosCrags generated high-velocity avalanches of rock debristhat traveled as far as 4.3 km (2.7 mi) westward from theChaos Crags. The falls may have resulted from earth-quakes, steam explosions, or intrusion of a dome intothe central part of the Chaos Crags.
A. D. 1914–1917: The most recent eruption at Lassen Peaktook place early in this century, when a small phreaticeruption occurred on May 30, 1914, at a new vent nearthe summit of the peak. More than 150 explosions ofvarious sizes occurred during the following year. A ver-tical eruption column resulting from the pyroclastic erup-tion rose to an altitude of more than 9 km (5.6 mi) abovethe vent and deposited a lobe of pumiceous tephra thatcan be traced as far as 30 km (19 mi) to the east-north-east. The fall of fine ash was reported as far away as Elko,Nevada, more than 500 km (300 mi) east of Lassen Peak.Intermittent eruptions of variable intensity continueduntil about the middle of 1917.
The record of late Pleistocene and Holocene eruptive activityat the Lassen volcanic center suggests that the most likelyhazardous future events include pyroclastic eruptions thatproduce pyroclastic flows and tephra. The Lassen volcaniccenter is one of the principal candidates in the Cascade Rangefor future silicic, probably explosive, eruptions. Based on itshistory, pyroclastic flows could endanger areas within sev-eral tens of kilometers of an active vent. Lahars and floodscould affect low-lying areas even farther from the vent, par-ticularly if eruptions occur during periods of thick snow cover.Eruptions that produce lava flows are generally less danger-ous, although both lava flows and domes can become unstableand produce pyroclastic flows and rockfall avalanches thatcould affect areas as far as several kilometers away. Mixingof hot debris with snow can generate lahars that could inun-date valley bottoms for tens of kilometers as in 1915.
Mount Shasta
Future eruptions like those of the last ten thousand years willprobably produce deposits of lithic ash, lava flows, domes,and pyroclastic flows and could endanger works of humansthat lie within several tens of kilometers of the volcano. Lavaflows and pyroclastic flows may affect low areas within about15–20 km (9–13 mi) of the summit of Mount Shasta or anysatellite vent that might become active. Lahars could affectvalley floors and other low areas as far as several tens of kilo-meters from Mount Shasta. Owing to great relief and steepslopes, a part of the volcano could also fail catastrophically

24VOLUME I I , CHAPTER 18
and generate a very large debris avalanche and lahar. Suchevents could affect any sector around the volcano and couldreach more than 50 km (32 mi) from the summit. Explosivelateral blasts could also occur as a result of renewed eruptiveactivity, or they could be associated with a large debris ava-lanche; such events could affect broad sectors to a distance ofmore than 30 km (19 mi) from the volcano. On the basis ofHolocene behavior, the probability is low that Mount Shastawill erupt large volumes of pumiceous ash in the future.The distribution of Holocene tephra and the prevailing winddirections suggest that areas most likely to be affected bytephra are mainly east and within about 50 km (32 mi) of thevolcano’s summit. However, the andesitic and dacitic com-position of its products suggests that Mount Shasta coulderupt considerably larger volumes of tephra in the future.Moreover, Christiansen (1982) has suggested that because itis a long-lived volcanic center and has erupted only relativelysmall volumes of magma for several thousand years, MountShasta is the Cascade Range volcano most likely to produce avery large explosive eruption (101–102 km3 [24.7–24.9 mi3]).Such an event could produce tephra deposits as extensive andas thick as the Mazama ash deposits and pyroclastic flowsthat could reach more than 50 km (32 mi) from the vent. Theannual probability for such a large event may be no greaterthan 10–5, but it is finite.
Medicine Lake Volcano
Eruptions occurring during the past ten thousand years forma reasonable basis for assessing hazards from future erup-tions. Similar eruptions of silicic magma are likely from ventswithin and just outside the summit caldera, which is thoughtto be underlain by silicic magma (Heiken 1978; Eichelberger1981), part of which could still be molten. These eruptionsprobably will produce tephras that could fall as much as sev-eral hundred kilometers downwind and mostly east of thevolcano (Christiansen 1982; Miller, in press). Such eruptionscould also produce pyroclastic flows that could endanger ar-eas within about 10 km (6 mi) of the active vent, althoughsuch phenomena are not known to have occurred duringHolocene time. Silicic eruptions are likely to culminate witheruption of dacite to rhyolite lava flows or domes that couldreach as far as several kilometers from their vents. Eruptionsof basalt and basaltic andesite lava may also occur from ventson the flanks of the Medicine Lake volcano (Christiansen1982). Such eruptions may begin by forming cinder cones anddispersing mafic tephra as far as 20 km (13 mi) from the ac-tive vent and culminate with the production of lava flowsthat may extend for tens of kilometers downslope from theirvents. Eruptions of both mafic and silicic magma may be fedby dikes. As a consequence, eruptions of basalt and rhyolitemay occur simultaneously, or nearly so, from multiple, prob-ably aligned vents. Eruptions of volumes larger than those ofHolocene time are possible, including a caldera-forming erup-tion (Christiansen, 1982), because of the inferred existence ofa large body of silicic magma beneath the Medicine Lake vol-
cano (Heiken 1978; Christiansen 1982). Future eruptions ofthis type could deposit thick accumulations of tephra overwide regions and produce pyroclastic flows that could affectareas more than 50 km (32 mi) from the vent. Debris ava-lanches and laterally directed blasts are not known to haveoccurred in this region in the past. Owing to the limited reliefof the Medicine Lake volcano, debris avalanches are not con-sidered likely in the future. Because of the absence of perma-nent snow and ice, future eruptions are not likely to generatelarge-volume lahars and floods, although lahars and floodsof moderate volumes are possible if eruptions occur whensnow covers the ground.
E A RT H Q U A K E H A Z A R D S
The alignment of epicenter clusters along the east side of theSierra Nevada branches northward from the south end of theSan Andreas fault system in the Salton Trough and bends backtoward the north terminus of the San Andreas fault system atthe Mendocino triple junction in northern California (Hill etal. 1990). A dense cluster of epicenters in the Mammoth Lakesarea represents an episode of intense earthquake activity inLong Valley caldera that began in 1978 (Hill et al. 1985). Tomake a map showing twentieth-century seismicity in the Si-erra Nevada (plate 18.10), we downloaded the latest data (asof January 16, 1996) from the Northern California EarthquakeData Center at the University of California, Berkeley, usingtheir Home Page whose URL is http://www.quake.geo.berkeley.edu/ and imported the data into Arc/Info soft-ware. A total of 3,321 earthquakes with magnitudes of at least3.0 that occurred since 1910 are plotted on the map. Frommagnitude 3.0 to 3.9, there are 2,614 points; from magnitude4.0 to 4.9, there are 616 points; from magnitude 5.0 to 5.9 thereare 79 points; and from magnitude 6.0 to 6.3 there are 12 points.No earthquakes greater than magnitude 6.3 have occurred inthe SNEP area during this century.
The largest historic earthquakes in the region were inOwens Valley in 1872. Between twenty-three and twenty-ninepeople died in the magnitude 7.6 earthquake in Lone Pine onMay 26 (Sharp 1972), and the town was virtually leveled whenthe entire 100–110 km (63–69 mi) length of the Owens Valleyfault ruptured (Ellsworth 1990). A magnitude 6.75 aftershockoccurred later that same day, and another magnitude 6.75 af-tershock occurred north of Bishop several days later (Goteret al. 1994). Adobe and brick buildings in Owens Valley sus-tained most of the damage. John Muir experienced the shak-ing from Yosemite Valley where he witnessed a rockfalltriggered by the event. Ellsworth (1990) points out that thefirst long-term seismic forecast was made by G. K. Gilbert in1883 when he noted that rebuilding Independence with woodwas an extravagance because “the spot which is the focus ofan earthquake . . . is thereby exempted [unlikely to have an

LassenN. P.
Lake Tahoe Basin Management Unit
L a s s e n N. F.
P l u m a s N. F.
E l d o r a d o
N. F.
M o d o c N. F.
M o
d o
c
N
. F
.
T a h o e N. F.
RENO
SACRAMENTO
N e v a d aC
al
if
or
ni a

PLATE 18.10
Earthquake epicenters from 1910 to the present.
S t a n i s l a u s
N. F.
N. P.Y o s e m i t e
S i e r r a N. F.
Inyo N.F.
Inyo N.F.
Sequoia N.F.
U.S. Geological Survey / SNEP
VISALIA
FRESNOSequoia-
Kings-Canyon N.P.
Lakes
Intensity
4.0 to 4.9
5.0 to 5.9
3.0 to 3.9
6.0 to 6.3
National park and national forest lands
SNEP study area boundary
SNEP core area boundary
ZONESRUPTURE
1872
0 10 20 30 40 50 60 70
Kilometers0 5 10 15 20 25 30 35 40
Miles
Selected faults showing young offsets
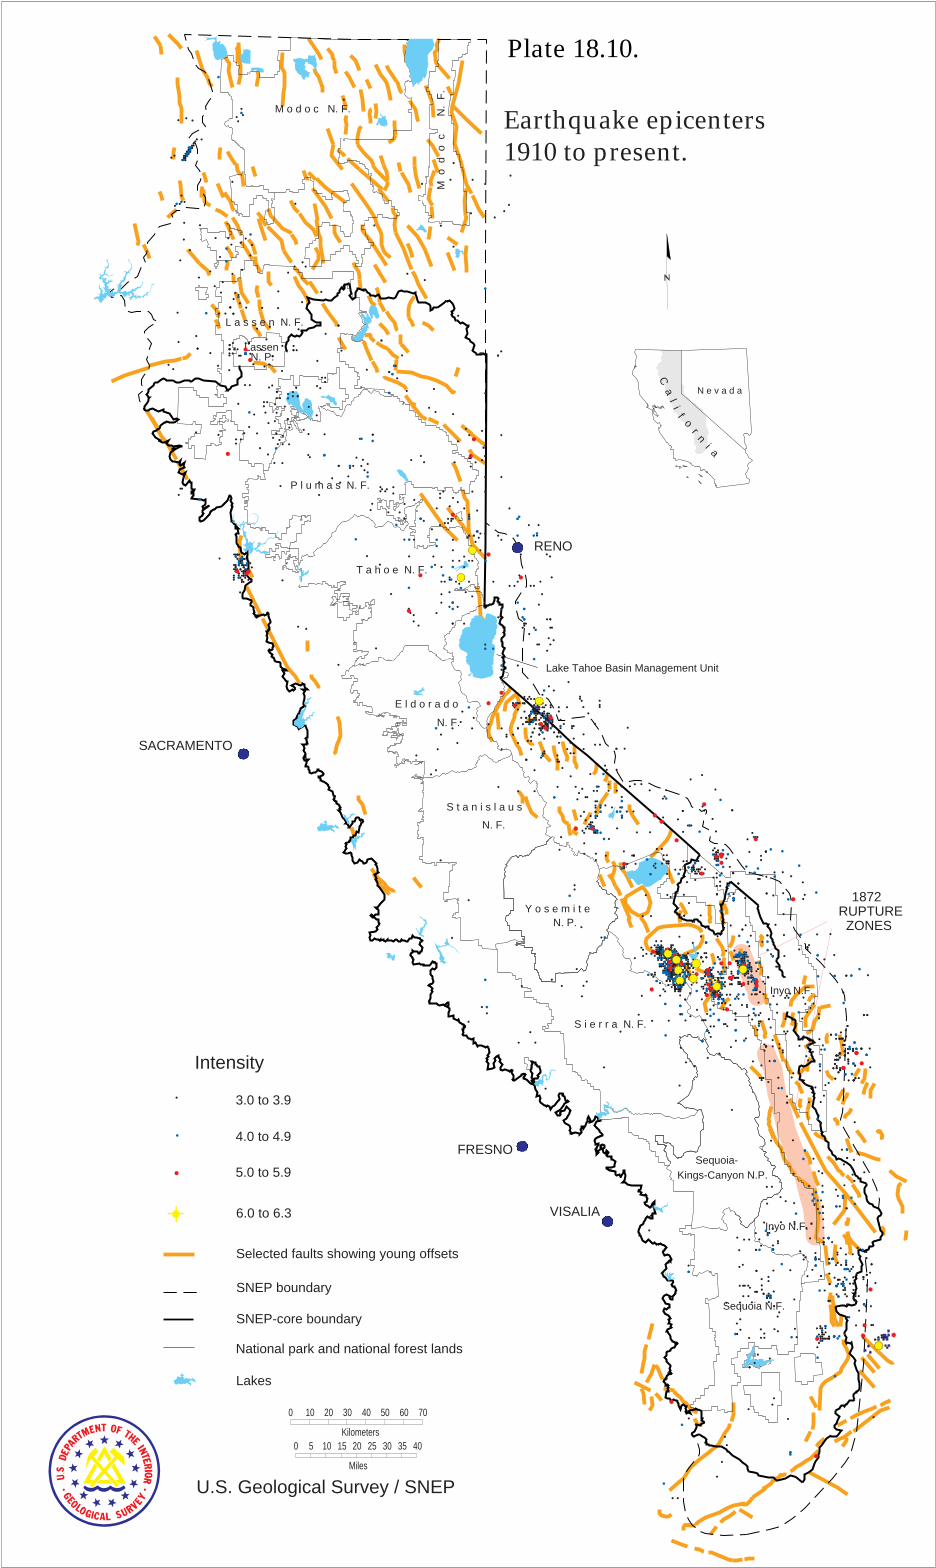
LassenN. P.
Lake Tahoe Basin Management Unit
L a s s e n N. F.
P l u m a s N. F.
E l d o r a d o
N. F.
S t a n i s l a u s
N. F.
N. P.Y o s e m i t e
S i e r r a N. F.
Inyo N.F.
M o d o c N. F.
M o
d o
c
N
. F
.
T a h o e N. F.
Inyo N.F.
Sequoia N.F.
U.S. Geological Survey / SNEP
VISALIA
RENO
FRESNO
SACRAMENTO
Sequoia-Kings-Canyon N.P.
Lakes
N e v a d a
Ca
li
fo
rn
i a
Earthquake epicenters1910 to present.
Intensity
4.0 to 4.9
5.0 to 5.9
3.0 to 3.9
6.0 to 6.3
National park and national forest lands
SNEP boundary
SNEP-core boundary
ZONESRUPTURE
1872
0 10 20 30 40 50 60 70
Kilometers0 5 10 15 20 25 30 35 40
Miles
Plate 18.10.
Selected faults showing young offsets

25Geology and Minerals Issues
earthquake] for a long time” (Gilbert 1884). It has now been along time, and attention to seismic building standards is wiseand encouraged.
A more general map showing all of California and Nevadawas produced by Goter et al. (1994). It covers all events up toits publication date, including those with magnitudes below1.0 and those that occurred in the last century. In that report,the authors point out that many faults capable of producinglarge earthquakes are quiescent for long periods between suchevents. Therefore, the faults indicated by seismicity on mapsdo not represent all faults in the region that have seismic-hazard potential.
A C K N O W L E D G M E N T S
The authors of the different parts of this chapter are MichaelF. Diggles (U.S. Geological Survey, Menlo Park, California),“Earth Sciences Overview” and “Mineral Deposits in the Si-erra Nevada”; William J. Pickthorn (Isochem Co., Palo Alto,California) and Michael F. Diggles, “Low-Sulfide Gold-QuartzVein Deposits”; Dennis P. Cox (U.S. Geological Survey, MenloPark, California), Steve Ludington (U.S. Geological Survey,Menlo Park, California), and Michael F. Diggles, “Massive Sul-fide Deposits, Sierran Kuroko Type”; Dennis P. Cox and RogerP. Ashley (U.S. Geological Survey, Menlo Park, California),“Porphyry Copper Deposits”; Michael F. Diggles, “EpithermalVein Deposits, Quartz-Adularia Type”; Dennis P. Cox, “Cop-per Skarn” and “Polymetallic Skarn and Replacement Depos-its”; C. Thomas Hillman (U.S. Bureau of Mines, Spokane,Washington) and Michael F. Diggles, “Known Mines, Claims,and Prospects”; James R. Rytuba (U.S. Geological Survey,Menlo Park, California), “Mercury in the Sierra Nevada Eco-system”; Michael F. Diggles and Barry C. Moring (U.S. Geo-logical Survey, Menlo Park, California), “Serpentine andLimestone as Hosts for Rare Plants”; Chester T. Wrucke (U.S.Geological Survey, Menlo Park, California) and Michael F.Diggles, “Serpentine-Hosted Asbestos”; Michael F. Diggles,Barry C. Moring, and Robert J. Miller (U.S. Geological Sur-vey, Menlo Park, California), “Calcium Concentrations”;Michael F. Diggles, “Volcanic Hazards”; and Michael F.Diggles, “Earthquake Hazards.”
Information for the discussion of undiscovered preciousand base metal deposits (gold, silver, copper, lead, and zinc)is from work in review on the resource assessment of theUnited States. Dennis P. Cox and Steve Ludington were thenational team leaders for this work. Barry C. Moring, Dan L.Mosier, and Paul C. Schruben were the software engineers.Michael F. Diggles was the regional team leader; David H.Root and William Scott were the statisticians and program-mers. Present and former USGS staff who helped make esti-mates or otherwise contributed to the process are as follows:George V. Albino, Roger P. Ashley, Byron R. Berger, Richard J.Blakely, Joseph A. Briskey Jr., William F. Cannon, Stanley E.Church, Dennis P. Cox, Michael F. Diggles, Lawrence J. Drew,
Susan H. Garcia, Donald F. Huber, Robert C. Jachens, M. DeanKleinkopf, Steve Ludington, W. David Menzie, J. ThomasNash, Steven G. Peters, Jocelyn A. Peterson, Willaim J.Pickthorn, James J. Rytuba, Michael G. Sawlan, Donald A.Singer, Gregory T. Spanski, Richard M. Tosdal, and Robert A.Zierenberg. Compilations and other work on data for knowndeposits were done by Russell C. Evarts, Steve Ludington,Dan L. Mosier, Lorre A. Moyer, and Miles L. Silberman of theUSGS and Charles Bishop, J. Douglas Causey, ThomasGunther, C. Thomas Hillman, and Paul C. Hyndman of theU.S. Bureau of Mines.
David Oppenheimer at USGS suggested the earthquakedata-retrieval and display strategy. Douglas Neuhauser atNorthern California Earthquake Data Center at University ofCalifornia, Berkeley, set up Diggles’s account on their machineand helped perform the data retrieval. Barry C. Moring atUSGS combined the data with standard SNEP layers in Arc/Info software and produced the plot.
R E F E R E N C E S
Abelson, P. H. 1990. The asbestos removal fiasco.: Science 247:1017.Albers, J. P., 1981, A lithologic-tectonic framework for the metallogenic
provinces of California. Economic Geology 76 (4):765–90.Anderson, C. A. 1931. Geology of the Engels and Superior Mines,
Plumas County, California (with a note on the ore deposits of theSuperior mine): California University Geological Sciences Bulletin 20(8): 293–330.
Anhaeusser, C. R. 1986. The geological setting of chrysotile asbestosoccurrences in southern Africa. In Mineral deposits of southern Africa,
edited by C.R. Anhaeusser and S. Mask, 359–75. Johannesburg:,Geological Society of South Africa.
Bailey, R. A. 1989. Geologic map of the Long Valley caldera, Mono-Inyo Craters volcanic chain, and vicinity, eastern California. U.S.Geological Survey Miscellaneous Geologic Investigations Map I-1933, scale, 1:62,500.
Bateman, P. C. 1965. Geology and tungsten mineralization of the Bishop
district, California. U.S. Geological Survey Professional Paper 470.Berger, B. R. 1986. Descriptive model of low-sulfide Au-quartz veins.
In Mineral deposit models, edited by D. P. Cox and D. A. Singer, 239.U.S. Geological Survey Bulletin 1693.
Bliss, J. D. 1986. Grade and tonnage model of low-sulfide Au-quartzveins. In Mineral deposit models, edited by D. P. Cox and D. A. Singer,239–43. U.S. Geological Survey Bulletin 1693.
Bliss, J. D., ed. 1992. Developments in mineral deposit modeling. U.S.Geological Survey Bulletin 2004.
Bliss, J. D., and G. M. Jones. 1988. Mineralogic and grade-tonnage
information on low-sulfide Au-quartz veins. U.S. Geological SurveyOpen-File Report 88-0229.
Bliss, J. D., W. D. Menzie, G. J. Orris, and N. J Page. 1987. Mineraldeposit density: A useful tool for mineral-resource assessment.U.S. Geological Survey research on mineral resources—1987 program
and abstracts, edited by J. S. Sachs, 6. U.S. Geological SurveyCircular 995.
California Comparative Risk Project. 1994. Toward the 21st century:
Planning for protection of California’s environment. Sacramento:California Environmental Protection Agency.

26VOLUME I I , CHAPTER 18
Carlisle, D., D. L. Davis, M. B. Kildale, and R. M. Stewart. 1954. Base
metal and iron deposits of southern California. California Division ofMines and Geology Bulletin 170:41–49.
Chidester, A. H., A. L. Albee, and W. M. Cady. 1978. Petrology, structure,
and genesis of the asbestos-bearing ultramafic rocks of the Belvidere
Mountain area in Vermont. U.S. Geological Survey ProfessionalPaper 1016.
Christiansen, R. L. 1982. Volcanic hazard potential in the CaliforniaCascades. California Division of Mines and Geology, Special Publication
63:41–59.Clark, D. 1992. Future actions to meet industrial-mineral needs. In
Industrial minerals in the Basin and Range region—workshop
proceedings, edited by E. W. Tooker, 96–98 U.S. Geological SurveyBulletin 2013.
Clark, W. B. 1976. Gold districts of California. California Division ofMines and Geology Bulletin 193.
Cowan, D. S. 1979. Serpentinite flows on Joaquin Ridge, southernCoast Ranges, California. Geological Society of America Bulletin
81:2615–28.Cox, D. P. 1986a. Descriptive model of porphyry Cu deposits. In
Mineral deposit models, edited by D. P. Cox and D. A. Singer, 76.U.S. Geological Survey Bulletin 1693.
———. 1986b. Descriptive model of Zn-Pb skarn deposits. In Mineral
deposit models, edited by D. P. Cox and D. A. Singer, 90. U.S.Geological Survey Bulletin 1693.
Cox, D. P., and D. A. Singer, eds. 1986. Mineral deposit models. U.S.Geological Survey Bulletin 1693.
Cox, D. P., and T. G. Theodore. 1986. Descriptive model of Cu skarndeposits. In Mineral deposit models, edited by D. P. Cox and D. A.Singer, 86. U.S. Geological Survey Bulletin 1693.
D’Agostino, J. R., and R. Wilson. 1993. Asbestos: The hazard, the risk,and public policy. In Phantom risk, edited by K. R. Foster, D. E.Bernstein, and P. W. Huber, 183–210. Cambridge: MassachusettsInstitute of Technology.
Dellinger, D. A., 1989. California’s unique geologic history and its role in
mineral formation, with emphasis on the mineral resources of the
California Desert region. U.S. Geological Survey Circular 1024.Derkies, D. 1985. Wastes from the extraction and beneficiation of metallic
ores, phosphate rock, asbestos, overburden from uranium mining, and
oil shale, prepared for Environmental Protection Agency. NationalTechnical Information Service Report PB 88-162631.
Diggles, M. F., J. G. Frisken, D. Plouff, S. R. Munts, and T. J. Peters.1988. Mineral resources of the Skedaddle Mountain Wilderness Study
Area, Lassen County, California, and Washoe County, Nevada. U.S.Geological Survey Bulletin 1706-C.
du Bray, E. A., D. A. Dellinger, H. W. Oliver, M. F. Diggles, M. F.Johnson, F. L. Thurber, H. K. Morris, T. J. Peters, and D. S. Lindey.1982. Mineral resource potential map of the John Muir Wilderness,Fresno, Inyo, Madera, and Mono counties, California. U.S.Geological Survey Miscellaneous Field Studies Map MF-1185-C,scale 1:125,000, 2 sheets.
Durkin, T. V. In press. Acid mine drainage: Reclamation at theRichmond Hill and Gilt Edge mines, South Dakota. Proceedings
EPA seminar series on managing environmental problems at inactive
and abandoned metals mine sites, Anaconda, MT, Denver, CO,
Sacramento, CA, 1994.
Eichelberger, J. C. 1981. Mechanism of magma mixing at GlassMountain, Medicine Lake Highland volcano, California. In Guides
to some volcanic terranes in Washington, Idaho, Oregon, and northern
California, edited by D. A. Johnston and J. M. Donnelly-Nolan, 183–89. U.S. Geological Survey Circular 838.
Einaudi, M. T., and D. M. Burt. 1982. Introduction—terminology,classification, and composition of skarn deposits: Economic Geology
77:745–54.Ellsworth, W. L. 1990. Earthquake history, 1769 - 1898. In The San
Andreas fault system, California, edited by R. E. Wallace, 153–88.U.S. Geological Survey Professional Paper 1515.
Fitzgerald, W. F. 1989. Atmospheric and oceanic cycling of mercury.Chemical Oceanography 10:151–86.
Gilbert, G. K. 1884. A theory of the earthquakes of the Great Basin,with a practical application. American Journal of Science ser. 3, 27(157): 49–53.
Gill, G. A., and K. W. Bruland. 1990. Mercury speciation in surfacefreshwater systems in California and other areas: Environmental
Science and Technology 24 (13): 1392–1400.Goldfarb, R. J., B. R. Berger, T. L. Klein, W. J. Pickthorn, M. L.
Silberman. In preparation. Low sulfide Au quartz veins (Model36a, Cox And Singer, 1986). Mineral-environmental models, editedby E. A. Du Bray. U.S. Geological Survey Bulletin.
Goter, S. K., D. H. Oppenheimer, J. J. Mori, M. K. Savage, and R. P.Massé. 1994. Earthquakes in California and Nevada. U.S.Geological Survey Open-File Report 94-647, scale 1:1,000,000.
Hall, W. E., and E. M. MacKevett Jr. 1962. Geology and ore deposits of
the Darwin quadrangle, Inyo County California. U.S. GeologicalSurvey Professional Paper 368.
Heiken, G. 1978. Plinian-type eruptions in the Medicine LakeHighland, California, and the nature of the underlying magma.Journal of Volcanology and Geothermal Research 4:375–402.
Hill, D. P., J. P. Eaton, and L. M. Jones. 1990. Seismicity, 1980–86. InThe San Andreas fault system, California, edited by R. E. Wallace,115–52. U.S. Geological Survey Professional Paper 1515.
Hill, D. P., M. J. Johnston, J. O. Langbein, S. R. McNutt, C. D. Miller,C. E. Mortensen, A. M. Pitt, and S. A. Rojstaczer. 1991. Response
plans for volcanic hazards in the Long Valley Caldera and Mono Craters
area, California. U.S. Geological Survey Open-File Report 91-270.Hill, D. P., R. E. Wallace, and R. S. Cockerham. 1985. Review of
evidence on the potential for major earthquakes and volcanism inthe Long Valley-Mono Craters-White Mountains regions of easternCalifornia. Earthquake Prediction Research 3 (3-4): 571–93.
Hoblitt, R. P. C. D. Miller, and W. E. Scott. 1987. Volcanic hazards with
regard to siting nuclear-power plants in the Pacific Northwest. U.S.Geological Survey Open-File Report 87-0297.
Hotz, P. E. 1971. Geology of lode gold districts in the Klamath Mountains,
California and Oregon. U.S. Geological Survey Bulletin 1290.Hurley, J. P., D. P. Krabbenhoft, C. L. Babiarz, and A. W. Andren.
1994. Cycling of mercury across the sediment-water interface inseepage lakes. In Environmental chemistry of lakes and reservoirs,
edited by A. Baker, 425–49. American Chemical Society SeriesNo. 237.
Janik, C. J., F. Goff, and J. J. Rytuba. 1994. Mercury in waters andsediments of the Wilbur Hot Springs area, Sulphur Creek MiningDistrict, California: EOS Transactions American Geophysical Union
75 (44): 243.Jennings, C. W. 1977. Geologic map of California: California Division
of Mines and Geology Geologic Map of California, scale 1:750,000.Jones, G. W. and W. D. Menzie. 1986. Grade-tonnage model of Cu
skarns. In Mineral deposit models, edited by D. P. Cox and D. A.Singer, 86–89. U.S. Geological Survey Bulletin 1693.
27Geology and Minerals Issues
Kanarek, M. S., P. M. Conforti, L. A. Jackson, R. C. Cooper, and J. C.Murcho. 1980. Asbestos in drinking water and cancer incidence inthe San Francisco Bay area: American Journal of Epidemiology 112:54-72.
Klein, D., and V. Banky. 1992. Geophysical model of Creede,Comstock, Sado, Goldfield and related epithermal precious metaldeposits, Cox and Singer models 25b Creede, 25c Comstock, 25dSado, and 25e quartz-alunite Au. In The geophysical expression of
selected mineral deposit models, edited by D. B. Hoover, W. D. Heran,and P. L. Hill, 98–106. U.S. Geological Survey Open-File Report92-557.
Knopf, A. 1935. The Plumas County copper belt, California. In Copper
Resources of the World 1:241–45. Sixteenth International GeologicCongress, Washington DC.
Kockelman, W. J. 1990. Land-use planing and reclamation. InIndustrial minerals in California: Economic importance, present
availability, and future development, edited and compiled by E. W.Tooker and D. J. Beebe, 43–44. U.S. Geological Survey Bulletin 1958.
Kruckeberg, A. R. 1984. California serpentines, flora, vegetation, geology,
and soils. Berkeley and Los Angeles: University of California Press.Lindberg, S. E., D. R. Jackson, J. W. Huckabee, S. A. Janzen, M. J.
Levin, and J. R. Lund. 1979. Atmospheric emission and plantuptake of mercury from agricultural soils near the Almadenmercury mine: Journal of Environmental Quality 8:572–78.
Lindberg, S. E., K. Kim, T. P. Meyers, and J. G. Owens. 1995.Micrometeorological gradient approach for quantifying air/surface exchange of mercury vapor: tests over contaminated soils:Environmental Science and Technology 29 (1): 126–35.
Lindberg, S.E., T. P. Meyers, G. E. Taylor, R. R. Turner, and W. H.Schroeder. 1992. Atmosphere-surface exchange of mercury in aforest: Results of modeling and gradient approaches: Journal of
Geophysical Research 97 (D2): 2519–28.MacKevett, E. M., Jr. 1953. Geology of the Santa Rosa lead mine, Inyo
County California. California Division of Mines and Geology SpecialReport 34.
Mason, R. P., W. F. Fitzgerald, and F. M. M. Morel. 1994. Thebiogeochemical cycling of elemental mercury: Anthropogenicinfluences: Geochimica et Cosmochimica Acta 58 (15): 3191–98.
McAllister, J. F. 1955. Geology and mineral deposits of the Ubehebe Peak
quadrangle. California Division of Mines and Geology SpecialReport 42.
McCammon, R. B., and J. A. Briskey, Jr. 1992. A proposed nationalmineral-resource assessment: Nonrenewable Resources 1:259–66.
McDonald, J. C., and A. D. McDonald. 1995. Chrysotile, tremolite,and mesothelioma. Science 267:778–79.
McPhee, J. 1992. Annals of the former world: Assembling California—I. The New Yorker, 7 September, 36–68.
Miller, C. D. 1980. Potential hazards from future eruptions in the vicinity
of Mount Shasta volcano, northern California. U.S. Geological SurveyBulletin 1503.
———. In press. Potential volcanic hazards from future volcanic eruptions
in California. U.S. Geological Survey Bulletin.Miller, C. D., D. R. Mullineaux, D. R. Cradell, and R. A. Bailey. 1982.
Potential hazards from future volcanic eruptions in the Long Valley-
Mono Lake area, east-central California and southwest Nevada—a
preliminary assessment. U.S. Geological Survey Circular 877.Morris, H. T. 1986. Descriptive model of polymetallic replacement
deposits. In Mineral deposit models, edited by D. P. Cox and D. A.Singer, 99–100. U.S. Geological Survey Bulletin 1693.
Mosier, D. L. 1986. Grade-tonnage model of Zn-Pb skarns. In Mineral
deposit models, edited by D. P. Cox and D. A. Singer, 90–93. U.S.Geological Survey Bulletin 1693.
Mosier, D. L., H. T. Morris, and D .A. Singer. 1986. Grade-tonnagemodel of polymetallic replacement deposits. In Mineral deposit
models, edited by D. P. Cox and D. A. Singer, 101–4. U.S. GeologicalSurvey Bulletin 1693.
Mossman, B. T., J. Bignon, M. Corn, A. Seaton, and J .B. L. Gee. 1990.Asbestos: Scientific developments and implications for publicpolicy. Science 247:294–301.
Mount, J. F. 1995. California rivers and streams: The conflict between
fluvial process and land use. Berkeley and Los Angeles: Universityof California Press.
Munts, S. R., and T. J. Peters. 1987. Mineral resources of the Skedaddle
study area, Lassen County, California and Washoe County, Nevada. U.S.Bureau of Mines Open-File Report MLA 22-87.
Newberry, R. T. 1982. Tungsten-bearing skarns of the Sierra Nevada.I. The Pine Creek mine. Economic Geology 77:823–44.
Newberry, R. J., M. T. Einaudi, and H. S. Eastman. 1991. Zoning andgenesis of the Darwin Pb-Zn-Ag skarn deposit, California: Areinterpretation based on new data. Economic Geology. 86(5):960–82.
Nriagu, J. O., and J. M. Pacyna. 1988. Quantitative assessment ofworldwide contamination of air, water and soils by trace metals:Nature 333:134–39.
Oddenino, C. L., L. V. Coppa, and J. Dillon. 1995. Spatial data extracted
from the Mineral Availability System/Mineral Industry Location System
(MAS/MILS). U.S. Bureau of Mines Special Publication 12-95, CD-ROM. Available from the U.S. Government Printing Office,Superintendent of Documents, Mail Stop SSOP, Washington, DC,20402–9328, Telephone order: (202) 783-3238.
Orris, G. J. 1992. Grade and tonnage models of serpentine-hostedasbestos, model 8d. In Industrial minerals deposit models: Grade and
tonnage models, edited by G. J. Orris and J. D. Bliss, 2–4. U.S.Geological Survey Open-File Report 92-437.
Plumlee, G. S., K. S. Smith, and W. H. Ficklin. 1994. Geoenvironmental
models of mineral deposits and geology-based mineral-environmental
assessments of Public lands. U.S. Geological Survey Open-File Report94-203.
Rasmussen, P. E. 1994. Current methods of estimating atmosphericmercury fluxes in remote areas: Environmental Science and
Technology 28 (13): 2233–41.Rice, S. J. 1966. Asbestos. In Mineral resources of California, 86–92.
California Division of Mines and Geology Bulletin 191.Root, D. H., W. D. Menzie, and W. A. Scott. 1992. Computer Monte
Carlo simulation in quantitative resource assessment. Nonrenewable
Resources 1:125–38.Ross, M. 1981. The geologic occurrences and health hazards of
amphibole and serpentine asbestos. In Amphiboles and other hydrous
pyriboles—mineralogy, edited by D. R. Veblen, 279–323.Mineralogical Society of America Reviews in Mineralogy 9A.
———. 1987. Minerals and health: the asbestos problem. In Aggregates
to zeolites (AZ) in Arizona and the Southwest: Proceedings of the 21st
forum on the geology of industrial minerals, April 9-12, 1985, editedby W. H. Peirce, 101–15. Tucson: Arizona Bureau of Geology andMineral Technology.
Ross, M., and C. W. Skinner. 1994. Minerals and cancer. Geotimes 39:13–15.
Rytuba, J. J. 1988. Volcanism, extensional tectonics, and epithermalsystems in the northern Basin and Range, CA, NV, OR, and ID[abs.]. Geological Society of Nevada Newsletter May, 1–2.

28VOLUME I I , CHAPTER 18
———. 1989. Volcanism, extensional tectonics, and epithermalmineralization in the northern basin and range province,California, Nevada, Oregon, and Idaho. U.S. Geological Survey
research on mineral resources—1989 program and abstracts, fifth annual
V. E. McKelvey forum on mineral and energy resources [abs.], editedby K. S. Schindler, 59–61. U.S. Geological Survey Circular 1035.
Rytuba, J. J., and W. R. Miller. 1994. Environmental geochemistry ofactive and extinct hot spring mercury deposits in the CaliforniaCoast Ranges. In USGS research on mineral resources—1994 part A—
program and abstracts, edited by L. M. H. Carter, M. I. Toth, and W.C. Day, 90–91. U.S. Geological Survey Circular 1103-A.
Sawyer, R. N. 1987. Asbestos exposure: health effects update. National
Asbestos Council Journal 5 (2): 25–29.Scherer, J. 1992. Environmental concerns for land, air, and water. In
Industrial minerals in the Basin and Range region—workshop
proceedings, edited by E. W. Tooker, 94–96. U.S. Geological SurveyBulletin 2013.
Seigneur, C., J. Wrobel, and E. Constantinou. 1994. A chemical kineticmechanism for atmospheric mercury: Environmental Science and
Technology 28:2433–40.Sharp, R. P., 1972, Geology field guide to southern California. Dubuque,
IA: Kendall/Hunt.Shride, A. F. 1969. Asbestos. In Mineral and water resources of Arizona,
63–73. Arizona Bureau of Mines Bulletin 180.———. 1973. Asbestos. In United States mineral resources, edited by
D. A. Brobst and W. P. Pratt, 63–73. U.S. Geological SurveyProfessional Paper 820.
Silberman, M. L., and J. Danielson. 1993. Gold-bearing quartz veinsin the Klamath Mountains in the Redding 1° x 2° quadrangle,northern California. California Geology 46:35–44.
Singer, D. A. 1986. Descriptive model of kuroko massive sulfide. InMineral deposit models, edited by D. P. Cox and D. A. Singer, 189.U.S. Geological Survey Bulletin 1693.
———, 1992. Grade and tonnage model of Sierran kuroko deposits.Developments in mineral deposit modeling, edited by J. D. Bliss, 29–32. U.S. Geological Survey Bulletin 2004.
Singer, D. A., D. L. Mosier, and D. P. Cox. 1986. Grade-tonnage modelof porphyry copper. In Mineral deposit models, edited by D. P. Coxand D. A. Singer, 77–81. U.S. Geological Survey Bulletin 1693.
Skinner, H. C. W., M. Ross, and C. Frondel. 1988. Asbestos and other
fibrous materials, mineralogy, crystal chemistry, and health effects. NewYork: Oxford.
Storey, L. O. 1978. Geology and mineralization of the Lights Creekstock, Plumas County, California. Proceedings of the porphyry copper
symposium: Arizona Geological Society Digest 11:49–58.U.S. Environmental Protection Agency (EPA). 1991. Final national
primary drinking water rules: 56 Federal Register 3578 (30 January,1991).
U.S. Geological Survey (USGS). 1994. Preparing for the next eruption
in the Cascades. U.S. Geological Survey Open-File Report 94-585.Available from http://vulcan.wr.usgs.gov/Vhp/OFR_nexteruption.html.
U.S. Occupational Safety and Health Administration (OSHA). 1975.Occupational exposure to asbestos. Federal Register 47652, 47660(9 October).
Varekamp, J. C., and P. R. Buseck. 1986. Global mercury flux fromvolcanic and geothermal sources: Applied Geochemistry 1:65–73.
Virta, R. L., 1989, Asbestos. Metals and minerals. U.S. Bureau of MinesMinerals Yearbook 2:127–34.
Walker, G. W., and N. S. MacLeod. 1991. Geologic map of Oregon.U.S. Geological Survey, 2 sheets, scale 1:500,000.
Wentworth, C. M., G. R. Fisher, P. Levine, and R.C. Jachens. 1995. The
surface of crystalline basement, Great Valley and Sierra Nevada,
California: A digital map database. U.S. Geological Survey Open-FileReport 95-0096.
Woodward-Clyde Associates. 1989. Draft regional study of miningdisturbances and exploration-related disturbances of asbestos-bearing material in the New Idria–Coalinga–Table Mountain studyregion. Report prepared for U.S. Environmental Protection Agency,EPA contract 68-01-6939.
Wrucke, C. T. In preparation. Serpentine-hosted asbestos (Model 8e;Cox and Singer 1986) and carbonate-hosted asbestos (Model 18d;Cox and Singer 1986), geoenvironmental model. 1995. In Mineral-
environmental models, edited by E. A. Du Bray. U.S. GeologicalSurvey Bulletin.


![2012 Minerals Yearbook - USGS Mineral … [AdVAnce ReLeAse] U.s. GeOLOGicAL sURVeY MineRALs YeARBOOK—2012 for exploration and other mineral-related information— • Australian](https://static.fdocuments.net/doc/165x107/5b5f2ea77f8b9aa3048e941b/2012-minerals-yearbook-usgs-mineral-advance-release-us-geological-survey-minerals.jpg)

![2013 Minerals Yearbook - USGS · PDF file2013 Minerals Yearbook U.S. Department of the Interior U.S. Geological Survey CHILE [ADVANCE RELEASE] ... (CODELCO). The Economic and Social](https://static.fdocuments.net/doc/165x107/5a74dc667f8b9aea3e8c0db0/2013-minerals-yearbook-usgs-a-2013-minerals-yearbook-us-department-of.jpg)


