LIBERTY-I QUICK START GUIDE - BISNEWS AFE - The Market Know-How

User Guide for the
BISNEWS WebStation
Bisnews AFE (Thailand) Limited

Contents 2© TeleTrader Software GmbH 2013
ContentsFirst Steps with the BISNEWS WebStation 3
Selecting Securities 7Search ............................................................................................................................................................................ 7Personalized Watchlists ................................................................................................................................................. 9Favorites....................................................................................................................................................................... 10
Displaying Quote Information 11Available Detail Views .................................................................................................................................................. 12Performing Actions for a Symbol .................................................................................................................................. 13
Charts and Technical Analysis 15Flash Chart ................................................................................................................................................................... 15
Organizing the Chart ......................................................................................................................................... 16Indicators........................................................................................................................................................... 17Drawing on the Chart ........................................................................................................................................ 18Saving, Loading and Printing Charts ................................................................................................................. 20
HTML5 Chart ................................................................................................................................................................ 20Organizing the Chart ......................................................................................................................................... 21Indicators........................................................................................................................................................... 22Drawing on the Chart ........................................................................................................................................ 23
Image Chart.................................................................................................................................................................. 24
News and Calendar 25
Useful Tools 27Alerts ............................................................................................................................................................................ 27Comparing Securities ................................................................................................................................................... 27
Tips and Tricks 29
Settings 31
System Requirements 33

First Steps with the BISNEWS WebStation 3© TeleTrader Software GmbH 2013
First Steps with the BISNEWSWebStationThe BISNEWS WebStation is a web-based information platform. It offers real-time quotes, historical data and newsas well as charts and technical analysis.
Logging in to the BISNEWS WebStation
The BISNEWS WebStation is called up with the following link: http://bw.bisnews.com; or go to your stock broker'swebsite and select BISNEWS WebStation.
To log in, enter the User name and Password that you have received.
To log off, click the button and choose Logout.
Market overviews
From the navigation bar you can call up various market overviews with one click.
Depending on the type of information displayed, you can call up various detail views: Quote data, charts, rankings,company profiles and much more.
For each symbol, you can click on the button next to the symbol name to perform a range of actions: Forexample, you can add the symbol to a personalized watchlist, or copy quote data to a CSV file.

First Steps with the BISNEWS WebStation 4© TeleTrader Software GmbH 2013
News
In the navigation bar you can also find overviews of the most current newsitems in real-time.
The NewsFlash below the navigation bar shows the latest news messagesand updates dynamically. Important news stories ("breaking news") arehighlighted in yellow.
You can also search directly for news or filter them by numerous criteria.
Customizable sections
Automatically sent e-mail alerts when a specific price limit is reached helpyou to react quickly to changes in the market.
With personalized watchlists you can create your own set of symbols andcompare them with one another.
In the Favorites section (bookmarks), links to the most-often used pages inthe BISNEWS WebStation are stored.
Tip Use the Drag & Drop function to customize your WebStation – drag a symbol to one of the above-mentioned areas and drop it to insert it there!
Search possibilities
Search with Securities Search or the Live Search (CTRL + -) for individualsymbols.
You can scroll through the search results shown in the navigation area withthe arrow keys ← / → or by swiping left / right on your tablet.
Interactive charts and technical analysis
With the Interactive Flash Chart, the HTML5 Chart and the Image Chart youcan follow the development of one or more symbols.
Chart type, data compression (including tick and intraday charts) and timeframe are determined by you. Additionally, you can add indicators and drawon the chart.
Drag & Drop: Drag and drop any symbol onto a chart in order to have itoverlaid on your chart!
Configuring the BISNEWS WebStation
To configure your BISNEWS WebStation individually, use the following buttons in the title bar:
Change the global settings of the WebStation, like e-mail address, time zone, etc. You can alsochoose a personal start page for the WebStation here.
Activate the push quotes for dynamically updating overview lists, market depth, times & sales andnews.
Open the current view in a new browser window.
Show / hide the navigation pane with one click.
For changing table columns for lists, use the Settings button on the respective list view.

First Steps with the BISNEWS WebStation 5© TeleTrader Software GmbH 2013
Data export and printing
The current quote data of a symbol and its historical times & sales data can be exported as Text or CSV File.
Any pages you like can be printed simply by clicking the Print button.

Selecting Securities 7© TeleTrader Software GmbH 2013
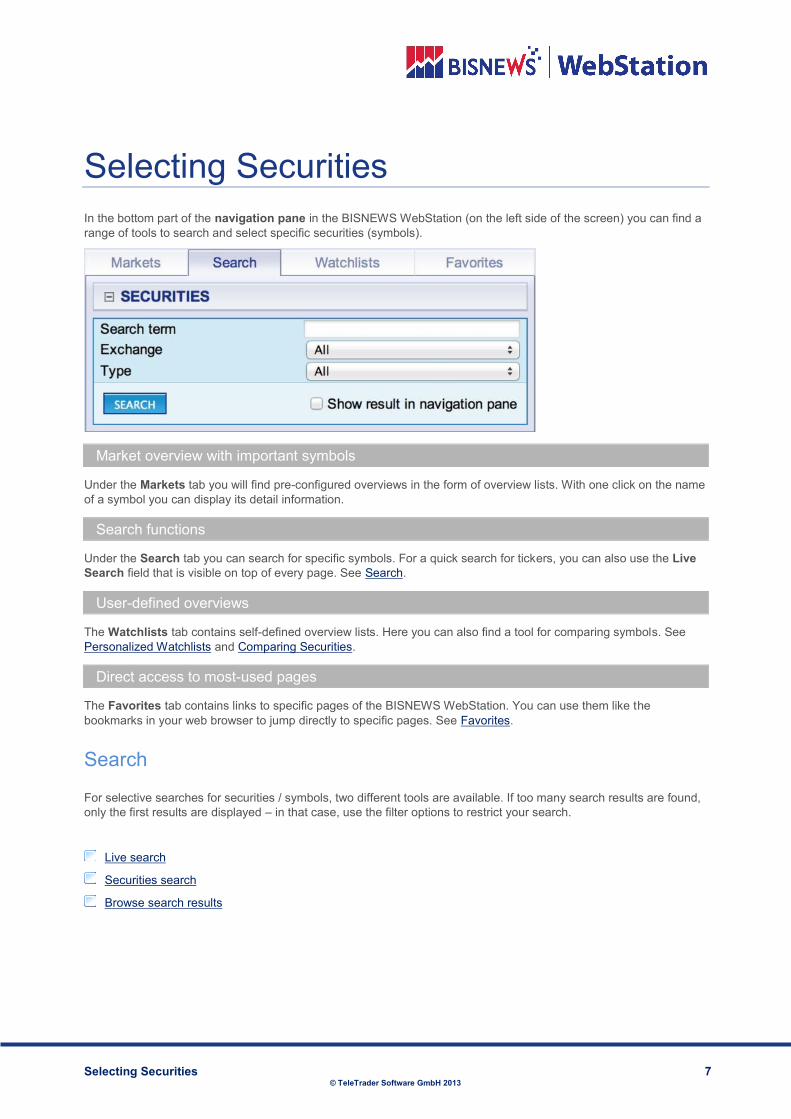
Selecting SecuritiesIn the bottom part of the navigation pane in the BISNEWS WebStation (on the left side of the screen) you can find arange of tools to search and select specific securities (symbols).
Market overview with important symbols
Under the Markets tab you will find pre-configured overviews in the form of overview lists. With one click on the nameof a symbol you can display its detail information.
Search functions
Under the Search tab you can search for specific symbols. For a quick search for tickers, you can also use the LiveSearch field that is visible on top of every page. See Search.
User-defined overviews
The Watchlists tab contains self-defined overview lists. Here you can also find a tool for comparing symbols. SeePersonalized Watchlists and Comparing Securities.
Direct access to most-used pages
The Favorites tab contains links to specific pages of the BISNEWS WebStation. You can use them like thebookmarks in your web browser to jump directly to specific pages. See Favorites.
Search
For selective searches for securities / symbols, two different tools are available. If too many search results are found,only the first results are displayed – in that case, use the filter options to restrict your search.
Live search
Securities search
Browse search results
Selecting Securities 8© TeleTrader Software GmbH 2013
Live search
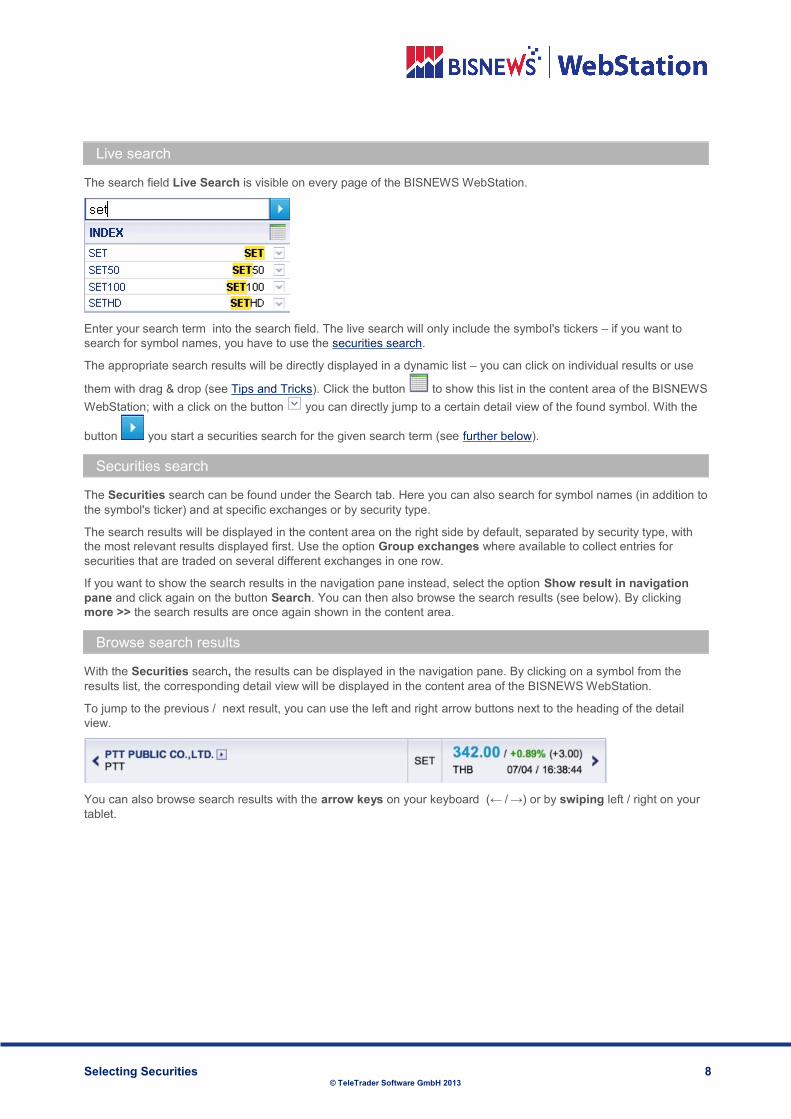
The search field Live Search is visible on every page of the BISNEWS WebStation.
Enter your search term into the search field. The live search will only include the symbol's tickers – if you want tosearch for symbol names, you have to use the securities search.
The appropriate search results will be directly displayed in a dynamic list – you can click on individual results or use
them with drag & drop (see Tips and Tricks). Click the button to show this list in the content area of the BISNEWSWebStation; with a click on the button you can directly jump to a certain detail view of the found symbol. With the
button you start a securities search for the given search term (see further below).
Securities search
The Securities search can be found under the Search tab. Here you can also search for symbol names (in addition tothe symbol's ticker) and at specific exchanges or by security type.
The search results will be displayed in the content area on the right side by default, separated by security type, withthe most relevant results displayed first. Use the option Group exchanges where available to collect entries forsecurities that are traded on several different exchanges in one row.
If you want to show the search results in the navigation pane instead, select the option Show result in navigationpane and click again on the button Search. You can then also browse the search results (see below). By clickingmore >> the search results are once again shown in the content area.
Browse search results
With the Securities search, the results can be displayed in the navigation pane. By clicking on a symbol from theresults list, the corresponding detail view will be displayed in the content area of the BISNEWS WebStation.
To jump to the previous / next result, you can use the left and right arrow buttons next to the heading of the detailview.
You can also browse search results with the arrow keys on your keyboard (← / →) or by swiping left / right on yourtablet.

Selecting Securities 9© TeleTrader Software GmbH 2013
Personalized Watchlists
Under the Watchlists tab in the navigation pane you can create your own set of symbols.
Creating a new watchlist
▪ Click on the Watchlists tab, then on the Create New Watchlist button.
▪ Enter a name for the watch list and click Save.
▪ Drag & Drop: Drag a symbol name to the Watchlists tab and drop it on the Create New Watchlist button.
Adding symbols to a watchlist
▪ Click on the arrow button next to the symbol name in the detail view of a symbol and select the actionAdd to watchlist.
▪ Drag & Drop: Drag the symbol name to the Watchlists tab and drop it on the desired watchlist.
Ordering watchlists
▪ Click on the name of the watchlist in the navigation pane and drag it to a new position.
Comparing selected symbols
▪ Check all the symbols in your watchlist that you want to compare.
▪ Click on the button Compare Selected Symbols. See also Comparing Securities.
Showing / hiding news
▪ Click on the name of the watchlist. It will be opened in the content area of the BISNEWS WebStation.
▪ Click on the button Show News.
▪ For every symbol, the latest news messages are displayed in the watchlist.
▪ To hide the news messages again, click Hide News.
Enabling daily e-mail alerts for a watchlist
▪ Click on the name of the watchlist. It will be opened in the content area of the BISNEWS WebStation.
▪ Click on the link Enable e-mail notification for this watchlist.
▪ You will now receive a daily overview for this watchlist per e-mail. The time at which you receive the e-mail canbe configured in the section Watchlist Notifications under Alert (see Alerts).
▪ To disable e-mail notifications again, click Disable e-mail notification for this watchlist.
Renaming / deleting a watchlist
▪ Click on the name of the watchlist. It will be opened in the content area of the BISNEWS WebStation.

Selecting Securities 10© TeleTrader Software GmbH 2013
▪ Click on the arrow next to the name of the watchlist and select the desired action: Rename watchlist or Deletewatchlist.
Favorites
Under the Favorites tab, links to specific BISNEWS WebStation pages are stored. As with bookmarks, you candesignate the most commonly used pages for easy recall.
Adding a page to Favorites
▪ Click on the star button in the upper right corner of the page which you would like to add to your favorites.
▪ Drag & Drop: Drag a symbol name to the Favorites tab and drop it on the list of favorites.
Editing Favorites
▪ Below the favorites list, click the Edit Favorites button.
▪ Click the button next to the favorite that you want to edit. You can now change the name of the favorite.
▪ Click to save your changes, to cancel and keep the old name, or to revert to the default name.
▪ Click Exit Editing below the favorites list.
Deleting Favorites
▪ Click on the star button in the upper right corner of the page you would like to delete, or
▪ Click the Edit Favorites button below the favorites list and click on the X next to the favorite you would like todelete.

Displaying Quote Information 11© TeleTrader Software GmbH 2013
Displaying Quote InformationQuote information, charts, news stories and the like can be displayed in the content area of the BISNEWSWebStation.
Detail views
Depending on the type of information displayed, a variety of detail views can be called up for each symbol – forexample charts, time & sales data etc. For indices, for example, a list with index constituents and rankings will bedisplayed in addition to the default views.
On the market overviews in the navigation pane or from other lists you can click the button to jump directly to aspecific detail view of a symbol. See Available Detail Views.
Actions for the displayed symbol
You can perform various actions for the symbol displayed in the detail view – for example copying data or addingsymbols to a watchlist. Some actions are only available for certain security types, and some are only available incertain views. See Performing Actions for a Symbol.
Automatic updates with push quotes
In order to get dynamic price updates in the BISNEWS WebStation, click on the Push Quotes button in the upperright hand corner of the title bar:
BISNEWS WebStation is displaying static information – click to display dynamically updating data.
BISNEWS WebStation is displaying dynamic data – click to deactivate push quotes.
If push quotes are active, updates will take place in all overview lists, in market depth and in news whenever new datacomes in. If the (activated) push connection is lost (for example because of problems with the Internet connection), awarning message will be shown in the title bar.
In order to also receive those updates in the Times & Sales view, the Push Quotes button must also beclicked there. You will only receive dynamic data in times & sales if both buttons are active.
Different views in lists
In most lists you can choose between three different views: Overview , Charts and QuoteBoard .
In the Overview mode, you can compare the listed symbols or index constituents by their current price or volume, butalso by selected key figures (like market capitalization). Click the Settings button to add more columns (seebelow).
The Charts view shows a chart for each symbol – you can adapt the chart settings by clicking on .
The QuoteBoard shows a block for each symbol. The color of this block is determined by the symbol's currentperformance (the colors are adjusted on-the-fly when push quotes are active). In the settings you can choose the timeperiod which is used for calculating performance (intraday, weekly, monthly, yearly performance etc.), the sort orderof the different blocks and the block size.
Changing the columns in overview lists
Click the Settings button in the heading of the list. The settings are valid for all lists within one area (for examplefor all tabs in the Equity area).
You can change the order of the columns with drag & drop: Click on the area at the beginning of each columnand drag the column to its new position.

Displaying Quote Information 12© TeleTrader Software GmbH 2013
To return to the default settings, click the Settings button and then click Default.
Note The width of the content area will automatically adjust as additional columns are added. In order toadjust the width manually, simply pull the right border of the content area left or right.
Sorting overview lists
Click on the up or down button in the column by which you would like to sort the list.
Available Detail Views
Depending on the type of security, different views are available for a symbol. Click on the appropriate tab to switch tothe desired view.
Overview
Chart
Constituents
Ranking
Profile
Times&Sales
Overview
In the Overview, the most important data for a symbol is displayed depending on the security type. Usually, thismeans the most current quotes, an overview chart and the latest news for a symbol. For many symbols, an overviewof current market depth is additionally available – you can show this view in a separate browser window by clicking
the button .
Chart
The Chart view displays historical data of the selected symbol. You can add additional symbols to the chart asoverlays, insert indicators and drawing tools, and much more. See also Charts and Technical Analysis.
Indices
The Indices view is only visible for special symbols such as SET or MAI. It displays a list of indices connected to theSET or MAI symbols.
Constituents
The Constituents view displays a list of index constituents.
Ranking
The Ranking view for indices displays Gainers, Losers and other relevant rankings for an index. The view can be
updated any time by using the Reload button.
Profile
The Profile view opens in a new browser window. It is available for many stocks and displays an overview about themost important company data.

Displaying Quote Information 13© TeleTrader Software GmbH 2013
Financials
The Financials view also opens in a new browser window. It shows key figures from the company's financial report.
Times&Sales
The Times&Sales view displays the latest transactions and current trading activity. If push quotes are activated,
Times&Sales can also be dynamically updated: Click the Push Quotes button in Times&Sales. See alsoAutomatic updates with push quotes.
In order to request historical data, use the entry fields at the top of the view and click on Show History. You candisplay intraday data (under the Latest Transactions tab) as well as daily data (under History). By using actions,you can also export this data as text or as a CSV file (see Performing Actions for a Symbol).
Performing Actions for a Symbol
Various actions can be performed for the symbol that is displayed in the detail view. Some actions are only availablefor certain security types, and some are only available in certain views.
In order to perform an action, click on the arrow next to the symbol name in detail view, and select thedesired action from the list.
Add to watchlist
Add notification
Copy as text
Download as CSV
Open in new browser window
Add to watchlist
With the Add to watchlist action, you copy the current symbol to a watchlist. See Personalized Watchlists.
Add notification
With the Add notification action, you create alerts (limits) for the current symbol. See Alerts.
Copy as text
The Copy as text action is available for the views Overview, Times&Sales and Constituents (indices), as well asfor news messages.
For the current symbol or the displayed overview list, the current stock data is copied to the clipboard. For news, thecomplete text of the news message is copied. You can insert this data in any program with the Insert or the keycombination CTRL + V.
Download as CSV
The Download as CSV action is available for the views Overview, Times&Sales and Constituents (indices).
For the current symbol or the displayed overview list, a CSV file is created which contains the current stock data.
Open in new browser window
The current view is opened in a new browser window.

Displaying Quote Information 14© TeleTrader Software GmbH 2013
Instead of this action, you can also use the button with symbol links, or the button in the title bar of eachpage.

Charts and Technical Analysis 15© TeleTrader Software GmbH 2013
Charts and Technical AnalysisThe BISNEWS WebStation offers three types of charts: The interactive Flash Chart, the interactive HTML5 Chart andthe static image chart. You can set different parameters like chart type and time frame as well as insert indicators anddrawing tools for technical analysis.
In order to change between the different chart technologies, click on the buttons Flash, HTML5 or Image in thebottom area of the detail view Chart.
Flash Chart
On the Flash Chart you can display several symbols (for example indices or securities) in an interactive chart. Youcan also add indicators and draw on the chart. Your current chart can be saved for later usage.
To show the chart on the full screen, click the button .
Main symbol and comparison symbols
▪ The main symbol (current symbol) is automatically used as the base of every indicator on the chart.
▪ You can add one or more comparison symbols with the dropdown list Compare. Comparison symbols are addedas overlays in the main chart panel. They cannot be used as the base of an indicator.
▪ New comparison symbols can also be added with Drag & Drop: Just drag another symbol (for example from themarket overview) to the chart to add it as an overlay.
▪ You can remove comparison symbols from the chart by clicking on the X button next to the symbol’s name:
Charts and Technical Analysis 16© TeleTrader Software GmbH 2013
Data compression and time period of the chart
▪ Choose the data compression of the chart from the dropdown list. You can show the data in a daily, weekly ormonthly compression, use intraday data with pre-defined intervals (for example 5 minutes or 1 hour), or show allticks as they are coming in (Tick-by-Tick).
▪ Click on the desired time period that is displayed above the chart, for example Intraday, 6 Months, 10 Years etc.
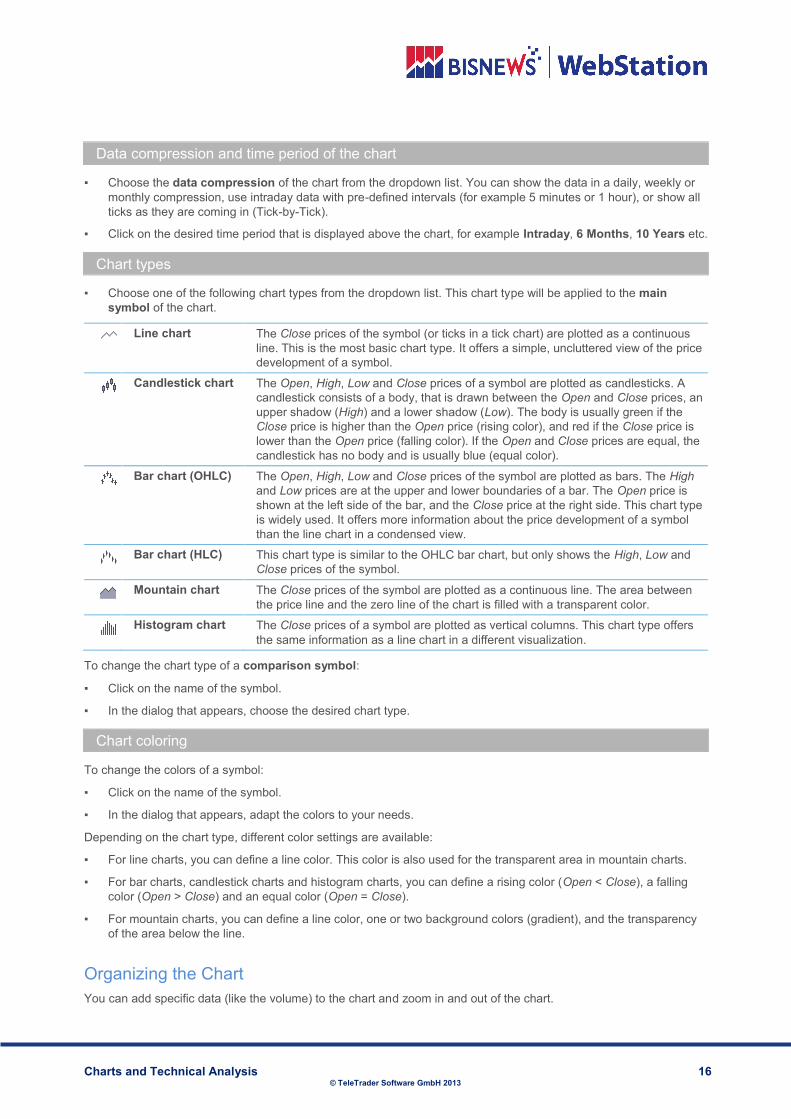
Chart types
▪ Choose one of the following chart types from the dropdown list. This chart type will be applied to the mainsymbol of the chart.
Line chart The Close prices of the symbol (or ticks in a tick chart) are plotted as a continuousline. This is the most basic chart type. It offers a simple, uncluttered view of the pricedevelopment of a symbol.
Candlestick chart The Open, High, Low and Close prices of a symbol are plotted as candlesticks. Acandlestick consists of a body, that is drawn between the Open and Close prices, anupper shadow (High) and a lower shadow (Low). The body is usually green if theClose price is higher than the Open price (rising color), and red if the Close price islower than the Open price (falling color). If the Open and Close prices are equal, thecandlestick has no body and is usually blue (equal color).
Bar chart (OHLC) The Open, High, Low and Close prices of the symbol are plotted as bars. The Highand Low prices are at the upper and lower boundaries of a bar. The Open price isshown at the left side of the bar, and the Close price at the right side. This chart typeis widely used. It offers more information about the price development of a symbolthan the line chart in a condensed view.
Bar chart (HLC) This chart type is similar to the OHLC bar chart, but only shows the High, Low andClose prices of the symbol.
Mountain chart The Close prices of the symbol are plotted as a continuous line. The area betweenthe price line and the zero line of the chart is filled with a transparent color.
Histogram chart The Close prices of a symbol are plotted as vertical columns. This chart type offersthe same information as a line chart in a different visualization.
To change the chart type of a comparison symbol:
▪ Click on the name of the symbol.
▪ In the dialog that appears, choose the desired chart type.
Chart coloring
To change the colors of a symbol:
▪ Click on the name of the symbol.
▪ In the dialog that appears, adapt the colors to your needs.
Depending on the chart type, different color settings are available:
▪ For line charts, you can define a line color. This color is also used for the transparent area in mountain charts.
▪ For bar charts, candlestick charts and histogram charts, you can define a rising color (Open < Close), a fallingcolor (Open > Close) and an equal color (Open = Close).
▪ For mountain charts, you can define a line color, one or two background colors (gradient), and the transparencyof the area below the line.
Organizing the ChartYou can add specific data (like the volume) to the chart and zoom in and out of the chart.
Charts and Technical Analysis 17© TeleTrader Software GmbH 2013
Showing additional data on the chart
▪ Click one of the icons of the following list to show additional data on the chart. Activated icons are shown in adifferent color. Some icons are already activated by default – you can deactivate them with a click.
Show the volume of the main symbol in a new panel.
Use a percentage price scale. The first loaded Close price represents 0%. This mode is useful tocompare the performance of several symbols.Alternatively, you can also use a logarithmic scale. On this scale, equal distances on the scale representan equal percentage change.When both options are deactivated, a linear price scale is used. It shows the absolute prices of the mainsymbol from its minimum to its maximum during the visible time period.
Show the last value of the main symbol as a line on the chart and as a label on the price scale.
Show the previous Close value of the main symbol as a line on the chart and as a label on the pricescale.
Show the data info box when positioning the mouse on the chart. The data info box displays date and timeof the current data point, as well as various values for all visible symbols and indicators.
Show the history panel. The history panel shows an overview of the development of the main symbol forthe complete period of time that is loaded in the chart. The section that is currently visible in the main panelof the chart is highlighted in the history panel.
Zooming in and out of the chart
▪ Click on the icon to zoom into the chart.
▪ Click on the icon to zoom out of the chart.
▪ Use the history panel to choose a specific date range on the chart: Either drag the handles on the left and rightside of the highlighted section in the history panel, or click on the date box next to the handle to choose a datefrom the calendar.
▪ You can also use the scroll wheel of your mouse to zoom in and out of the chart.
Moving the chart with drag and drop
▪ Click on the icon.
▪ Click on the chart, hold the mouse button down and drag the chart left or right. The time series is positioned onthe screen accordingly. You will notice that the highlighted range in the history panel automatically moves alongwith the chart.
IndicatorsIndicators are applied to the price data of the main symbol in your chart. They visualize the available data in adifferent way so that you can interpret it more easily.
Adding an indicator to the chart
▪ Click on the icon.
▪ In the Add Indicator dialog, click on the indicator that you want to insert. You can search for an indicator bytyping its name into the search field on top.
▪ On the Params tab on the right side you can adapt the parameters of this indicator. Click on a value to edit it.
▪ You can choose into which panel the indicator will be inserted. Indicators can be shown in the main paneltogether with the main symbol, or in a new panel below the main panel.
Charts and Technical Analysis 18© TeleTrader Software GmbH 2013
▪ On the Style tab, you can adapt the colors and line style of the indicator.
Changing the properties of an inserted indicator
▪ Click on the name of the indicator.
▪ In the dialog that appears, adapt the parameters and style settings to your needs.
Removing an indicator from the chart
▪ Click on the X button next to the indicator’s name:
▪ If the indicator was shown in a separate panel, this panel is removed as well.
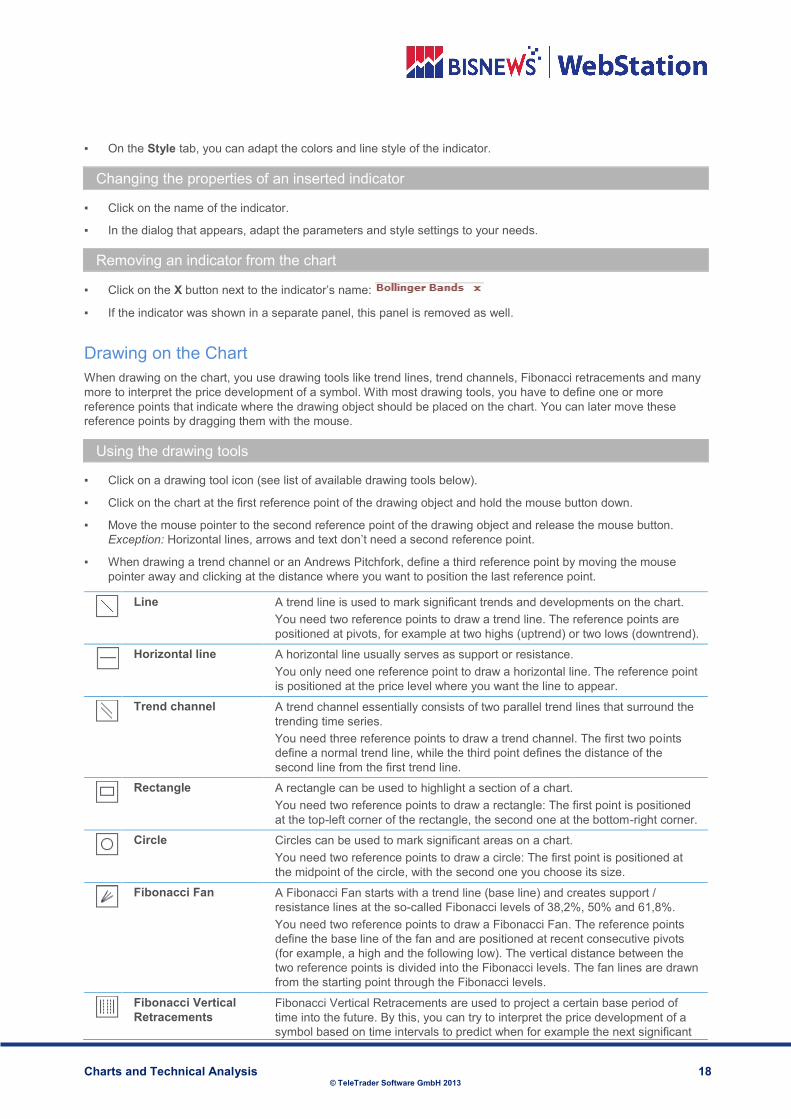
Drawing on the ChartWhen drawing on the chart, you use drawing tools like trend lines, trend channels, Fibonacci retracements and manymore to interpret the price development of a symbol. With most drawing tools, you have to define one or morereference points that indicate where the drawing object should be placed on the chart. You can later move thesereference points by dragging them with the mouse.
Using the drawing tools
▪ Click on a drawing tool icon (see list of available drawing tools below).
▪ Click on the chart at the first reference point of the drawing object and hold the mouse button down.
▪ Move the mouse pointer to the second reference point of the drawing object and release the mouse button.Exception: Horizontal lines, arrows and text don’t need a second reference point.
▪ When drawing a trend channel or an Andrews Pitchfork, define a third reference point by moving the mousepointer away and clicking at the distance where you want to position the last reference point.
Line A trend line is used to mark significant trends and developments on the chart.You need two reference points to draw a trend line. The reference points arepositioned at pivots, for example at two highs (uptrend) or two lows (downtrend).
Horizontal line A horizontal line usually serves as support or resistance.You only need one reference point to draw a horizontal line. The reference pointis positioned at the price level where you want the line to appear.
Trend channel A trend channel essentially consists of two parallel trend lines that surround thetrending time series.You need three reference points to draw a trend channel. The first two pointsdefine a normal trend line, while the third point defines the distance of thesecond line from the first trend line.
Rectangle A rectangle can be used to highlight a section of a chart.You need two reference points to draw a rectangle: The first point is positionedat the top-left corner of the rectangle, the second one at the bottom-right corner.
Circle Circles can be used to mark significant areas on a chart.You need two reference points to draw a circle: The first point is positioned atthe midpoint of the circle, with the second one you choose its size.
Fibonacci Fan A Fibonacci Fan starts with a trend line (base line) and creates support /resistance lines at the so-called Fibonacci levels of 38,2%, 50% and 61,8%.You need two reference points to draw a Fibonacci Fan. The reference pointsdefine the base line of the fan and are positioned at recent consecutive pivots(for example, a high and the following low). The vertical distance between thetwo reference points is divided into the Fibonacci levels. The fan lines are drawnfrom the starting point through the Fibonacci levels.
Fibonacci VerticalRetracements
Fibonacci Vertical Retracements are used to project a certain base period oftime into the future. By this, you can try to interpret the price development of asymbol based on time intervals to predict when for example the next significant

Charts and Technical Analysis 19© TeleTrader Software GmbH 2013
move will take place.You need two reference points to draw Fibonacci Vertical Retracements. Thetwo points define the first (base) interval. All other intervals are then calculatedbased on this reference interval, using the Fibonacci sequence (1, 1, 2, 3, 5, 8,13, 21, 34… times the base interval). This means that the first two intervals willhave the same size, the third interval will be double size, the fourth interval threetimes as big, etc.
FibonacciRetracements
Fibonacci Retracements start with a trend line (base line) and divide it into theso-called Fibonacci levels. The horizontal lines at those levels are believed toprovide support / resistance when the price moves into the opposite direction ofthe current trend (retracements).You need two reference points to draw Fibonacci Retracements. The referencepoints define the base line and are positioned at recent consecutive pivots (forexample, a high and the following low). The vertical distance between the tworeference points is divided into the Fibonacci levels.
Fibonacci Arcs With Fibonacci Arcs, you can try to identify support and resistance levels at theso-called Fibonacci levels of 38,2%, 50% and 61,8%.You need two reference points to draw Fibonacci Arcs. The reference pointsdefine the base line and are positioned at recent consecutive pivots (forexample, a high and the following low). The vertical distance between the tworeference points is divided into the Fibonacci levels. The arc lines are thendrawn from the second point with the radii of the resulting distances.
Andrews Pitchfork The Andrews Pitchfork (also called Median Lines) can be used to draw achannel of support and resistance lines, along with a middle line.The pitchfork needs three reference points that are drawn from a sequence ofthree consecutive pivots (for example, Low – High – Low or High – Low – High).The first reference point is set at the latest pivot, the second reference point atthe preceding pivot, and the third reference point at the pivot before that. Thus,you draw the pitchfork starting from the present and going into the past.The median line of the pitchfork is drawn from the third reference point; the outerlines of the pitchfork start at the first two points and run parallel to the medianline. Those lines are believed to act as support and resistance for the followingprice movements.
Standard DeviationChannel
A Standard Deviation Channel consists of a middle line that shows the linearregression trend between two reference points, and two channel lines that aredrawn at the distance of one standard deviation away from the linear regressiontrend line. The channel borders serve as support / resistance lines.You need two reference points to draw a Standard Deviation Channel. Thereference points define the period of time for which the linear regression trend isshown on the chart. The standard deviation channel lines are addedautomatically.
Arrow UpArrow Down
With the arrow tools, you can draw two types of arrows on a chart, pointing up ordown.You only need one reference point to draw an arrow. The reference point isplaced at the position where you want the arrow to appear.
Text With the text tool, you can label other objects on the chart, add descriptions etc.To add text, just click on the chart at the position where you want the text toappear. Then, type your text into the box and choose the desired text style andcolor.You can later edit the text by clicking on it. You can also delete it by using theDelete link in the Add Text dialog.
Colors and line styles
▪ To change the color of a drawing object, click on the drawing object (for example the trend line) and then click
to choose a color.

Charts and Technical Analysis 20© TeleTrader Software GmbH 2013
Deleting drawing objects
▪ To directly remove a drawing object, click on it and choose Delete.
▪ To remove drawing objects, click on the icon and then click on each drawing object that you want to remove.
To deactivate the delete tool, click on any other drawing tool or on the hand tool .
▪ To remove all drawing objects from the chart at once, click on the icon.
Saving, Loading and Printing ChartsYou can save the current settings of the chart as a template and apply a pre-defined chart design to your charts.
Saving and loading templates
▪ Click below the chart on Save Template to save the current chart as a template. A template stores all chartsettings, including comparison symbols and indicators, but removes the main symbol and any object created withdrawing tools (e.g. trend lines).
▪ Choose a template from the Choose template drop down list to apply a saved template to the current chart. Thismeans that all information stored in the template (e.g. chart settings, comparison symbols and indicators) will beadded to the chart and applied to the chart’s current main symbol.
▪ Click below the chart on Set template as default to automatically use the current template for all new charts.
Choosing a pre-defined chart design
▪ Under Choose chart design (below the chart), choose a basic design (background color) for your chart.
Printing the chart
▪ Click on the icon to print the current chart, including all panels.
HTML5 Chart
Similar to the Flash Chart, you can also use the interactive HTML5 chart to display several symbols (for exampleindices or securities) at once, add indicators and draw on the chart.
To show the chart on the full screen, click the button .
Main symbol and comparison symbols
▪ The main symbol (current symbol) is automatically used as the base of every indicator on the chart.
▪ You can add one or more comparison symbols with the dropdown list Compare. Comparison symbols are addedas overlays in the main chart panel. They cannot be used as the base of an indicator.
▪ New comparison symbols can also be added with Drag & Drop: Just drag another symbol (for example from themarket overview) to the chart to add it as an overlay.
▪ You can remove comparison symbols from the chart by clicking on the X button next to the symbol’s name:
Data compression and time period of the chart
▪ Choose the data compression of the chart from the dropdown list. You can show the data in a daily, weekly ormonthly compression, use intraday data with pre-defined intervals (for example 5 minutes or 1 hour), or show allticks as they are coming in (Tick-by-Tick).

Charts and Technical Analysis 21© TeleTrader Software GmbH 2013
▪ Click on the desired time period that is displayed above the chart, for example Intraday, 6 Months, 10 Years etc.
Chart types
▪ Choose one of the following chart types from the dropdown list. This chart type will be applied to the mainsymbol of the chart.
Line chart The Close prices of the symbol (or ticks in a tick chart) are plotted as a continuousline. This is the most basic chart type. It offers a simple, uncluttered view of the pricedevelopment of a symbol.
Candlestick chart The Open, High, Low and Close prices of a symbol are plotted as candlesticks. Acandlestick consists of a body, that is drawn between the Open and Close prices, anupper shadow (High) and a lower shadow (Low). The body is usually green if theClose price is higher than the Open price (rising color), and red if the Close price islower than the Open price (falling color). If the Open and Close prices are equal, thecandlestick has no body (equal color).
Bar chart (OHLC) The Open, High, Low and Close prices of the symbol are plotted as bars. The Highand Low prices are at the upper and lower boundaries of a bar. The Open price isshown at the left side of the bar, and the Close price at the right side. This chart typeis widely used. It offers more information about the price development of a symbolthan the line chart in a condensed view.
Bar chart (HLC) This chart type is similar to the OHLC bar chart, but only shows the High, Low andClose prices of the symbol.
Mountain chart The Close prices of the symbol are plotted as a continuous line. The area betweenthe price line and the zero line of the chart is filled with a transparent color.
Histogram chart The Close prices of a symbol are plotted as vertical columns. This chart type offersthe same information as a line chart in a different visualization.
To change the chart type of a comparison symbol:
▪ Click on the name of the symbol.
▪ In the dialog that appears, choose the desired chart type.
Chart coloring
To change the colors of a symbol:
▪ Click on the name of the symbol.
▪ In the dialog that appears, adapt the colors to your needs.
Depending on the chart type, different color settings are available:
▪ For line charts, you can define a line color and line weight.
▪ For bar charts, candlestick charts and histogram charts, you can define a rising color (Open < Close), a fallingcolor (Open > Close) and an equal color (Open = Close).
▪ For mountain charts, you can define a line color and a background color (gradient).
Organizing the ChartYou can add specific data (like the volume) to the chart and zoom in and out of the chart.
Showing additional data on the chart
▪ Click one of the icons of the following list to show additional data on the chart. Activated icons are shown in adifferent color. Some icons are already activated by default – you can deactivate them with a click.
Show the volume of the main symbol in a new panel.

Charts and Technical Analysis 22© TeleTrader Software GmbH 2013
Use a percentage price scale. The first loaded Close price represents 0%. This mode is useful tocompare the performance of several symbols.Alternatively, you can also use a logarithmic scale. On this scale, equal distances on the scale representan equal percentage change.When both options are deactivated, a linear price scale is used. It shows the absolute prices of the mainsymbol from its minimum to its maximum during the visible time period.
Show the last value of the main symbol as a line on the chart and as a label on the price scale.
Show the data info box when positioning the mouse on the chart. The data info box displays date and timeof the current data point, as well as various values for all visible symbols and indicators.
Show the history panel. The history panel shows an overview of the development of the main symbol forthe complete period of time that is loaded in the chart. The section that is currently visible in the main panelof the chart is highlighted in the history panel.
Zooming in and out of the chart
▪ Click on the icon to zoom into the chart.
▪ Click on the icon to zoom out of the chart.
▪ Use the history panel to choose a specific date range on the chart: Either drag the handles on the left and rightside of the highlighted section in the history panel, or click on the date boxes in the upper left corner of the paneland choose a date from the calendar.
▪ You can also use the scroll wheel of your mouse, or, on tablets, pinch with two fingers, to zoom in and out of thechart.
Moving the chart with drag and drop
▪ Click on the icon.
▪ Click on the chart, hold the mouse button down and drag the chart left or right. The time series is positioned onthe screen accordingly. You will notice that the highlighted range in the history panel automatically moves alongwith the chart.
IndicatorsIndicators are applied to the price data of the main symbol in your chart. They visualize the available data in adifferent way so that you can interpret it more easily.
Adding an indicator to the chart
▪ Click on the icon and then on the name of the desired indicator.
Changing the properties of an inserted indicator
▪ Click on the name of the indicator. A dialog appears.
▪ On the Parameters tab on the left side you can adapt the parameters of this indicator. Click on a value to edit it.
▪ On the Style tab, you can adapt the colors and line style of the indicator. For indicators that consist of more thanone line (e.g. Bollinger Bands with its three lines Mid, Upper and Lower), first choose the desired line with the
arrows .
Removing an indicator from the chart
▪ Click on the X button next to the indicator’s name:

Charts and Technical Analysis 23© TeleTrader Software GmbH 2013
▪ If the indicator was shown in a separate panel, this panel is removed as well.
Drawing on the ChartWhen drawing on the chart, you use drawing tools like trend lines or trend channels. With most drawing tools, youhave to define one or more reference points that indicate where the drawing object should be placed on the chart.You can later move these reference points by dragging them with the mouse.
Using the drawing tools
▪ Click on a drawing tool icon (see list of available drawing tools below).
▪ Click on the chart at the first reference point of the drawing object and hold the mouse button down.
▪ Move the mouse pointer to the second reference point of the drawing object and release the mouse button.Exception: The text tool doesn't need a second reference point.
▪ When drawing a trend channel, a third reference point appears that you can use to position the additional line.
Line A trend line is used to mark significant trends and developments on the chart.You need two reference points to draw a trend line. The reference points arepositioned at pivots, for example at two highs (uptrend) or two lows (downtrend).
Horizontal line A horizontal line usually serves as support or resistance.You only need one reference point to draw a horizontal line. The reference pointis positioned at the price level where you want the line to appear.
Trend channel A trend channel essentially consists of two parallel trend lines that surround thetrending time series.You need three reference points to draw a trend channel. The first two pointsdefine a normal trend line, while the third point defines the distance of thesecond line from the first trend line.
Text With the text tool, you can label other objects on the chart, add descriptions etc.To add text, just click on the chart at the position where you want the text toappear. Then, type your text into the box and choose the desired text style, sizeand color. You can later edit the text by clicking on it.
Drawing several lines at once
▪ To use a drawing tool several times without having to select it each time, click the button Draw repeatedly .
▪ Now, choose the desired drawing tool (for example a trend line).
▪ The drawing tool stays active until you select a different tool or deactivate the option Draw repeatedly again.
Colors, line styles and length
▪ To change the color of a drawing object, click on the drawing object (for example the trend line). A dialogappears.
▪ Choose the desired color and line style (if available).
▪ For lines and trend channels, you can additionally use the option Extend to extend the selected line from the
drawn reference points to the left or right edge of the chart.
▪ For text, you can adapt font size and style.
Deleting drawing objects
▪ To remove a drawing object, first click on the object an then on the icon.

Charts and Technical Analysis 24© TeleTrader Software GmbH 2013
Image Chart
In the Image chart, you can display the time series of one or more symbols. Some chart parameters can be defined,like chart type or the displayed period.
If you have changed a parameter, click on Refresh Chart to make your changes visible.
Chart Type
The following chart types are available:
Line chart The Close prices of the symbol (or ticks in a tick chart) are plotted as a continuousline.
Bar chart The Open, High, Low and Close prices of the symbol are plotted as bars.
Candlestick chart The Open, High, Low and Close prices of a symbol are plotted as candlesticks.
Mountain chart The Close prices of the symbol are plotted as a continuous line. The area betweenthe price line and the zero line of the chart is filled with a transparent color.
Time Period
▪ Click on the desired period above the chart. For example, Intraday, 6 Months, 10 Years etc.
Indicators, Volume, Reference Values
▪ You can select from a range of Indicators and Reference Values. A comparison value (overlaid) can also beimported by Drag & Drop.
▪ In order to add a moving average in the chart, enter the desired period in the Mov. Avg. field.
▪ Check Volume in order to display volume data in the chart.

News and Calendar 25© TeleTrader Software GmbH 2013
News and CalendarThe sections News and Calendar contain news as well as a calendar. You can search for specific messages byusing the filter function. The NewsFlash in the navigation pane contains the latest news messages. Important newsstories ("breaking news") are highlighted in yellow.
News Section
The News section contains the latest messages. Click on the heading of news story to read its details. You candownload the text of the news message by clicking on the arrow next to the news heading and choosing the actionCopy as text (see Performing Actions for a Symbol).
You can browse through the news stories with the arrow keys (← / →) on your keyboard, by swiping left/right on yourtablet, or with the arrow buttons left and right of the message header. To return to a search result, click on the arrownext to the message header and select the action Back to search.
NewsFlash
The NewsFlash in the navigation pane contains the latest news messages and is updated automatically whenever anew message arrives. You have to activate push quotes in order to get automatic updates.
You can configure the number of messages shown, and the filter on which they are based on, in the news settings.By clicking you can edit the settings for the chosen filter. If you have removed the NewsFlash by clicking , youcan activate it again in the settings. See Settings.
Calendar Section
The Calendar section opens in a new browser window. It shows an overview for the current, previous and nextmonth.
News Filter
In order to search for specific news stories, click on the Filter News tab. You can save different filter settings – clickon Save Filter and choose a name for the new filter. A filter saved in this way can also be used for the NewsFlash inthe navigation pane.
News Settings
Click on Settings on the Filter News tab. Here, you can configure global settings for the NewsFlash and the news ondetail pages, choose the language for news and activate or deactivate individual news packages. See also Settings.


Useful Tools 27© TeleTrader Software GmbH 2013
Useful ToolsAlerts
The Alert function of the BISNEWS WebStation allows you to react quickly to changes in the market. You will receivean e-mail alert when your self-defined price limit is reached.
E-mail notifications for custom watchlists (if activated) can also be changed or deleted here.
Note The e-mail address for alerts is entered in the general settings of the BISNEWS WebStation (seeSettings).
Creating a new alert
▪ Click on the arrow button next to the symbol name and select Add notification.
▪ Drag & Drop: Drag the symbol name to the Alert section and drop it there.
▪ Select one or more of the following options:
- Upper limit: You will be notified when the price reaches the upper limit.
- Lower limit: You will be notified when the price reaches the lower limit.
- Percent change: You will be notified when the price changes by at least the given percentage incomparison to the previous day (positive or negative change).
- Daily price message: You will receive a notification with the current quote at the same time each day.
▪ Enter any additional remarks if desired.
▪ As soon as one of the conditions is met, you will receive an e-mail alert. If you have entered more than onecondition (for example upper limit & percent change), those conditions will be evaluated separately.
Editing and activating / deactivating alerts
▪ Click on the Alert section. You will now see an overview of all of your self-defined alerts.
▪ To edit an alert, click on the button.
▪ In the Change Notification dialog you can adapt the selected limit, add remarks or activate/deactivate the alertwith the option Active. For watchlist notifications, you can only adapt the time of the daily e-mail notification.
Note Deactivated alerts will be displayed in the overview in gray color.
Deleting alerts
▪ Click on the alert's button to delete it.
Comparing Securities
In order to compare securities with one another, display them together in a chart. For your own watchlists you canperform such security comparisons very easily.
Comparing selected symbols
▪ Click on the Watchlists tab.

Useful Tools 28© TeleTrader Software GmbH 2013
▪ Select the symbols that you would like to compare.
▪ Click on Compare Selected Symbols.
▪ The selected symbols will be displayed in a chart.
Note As an alternative, you can add comparison symbols to an existing chart by using the Comparedropdown list on the chart itself, or add them to the chart with drag & drop (see Charts andTechnical Analysis).
Tips and Tricks 29© TeleTrader Software GmbH 2013
Tips and TricksHere are some tips which will simplify your work with the BISNEWS WebStation.
Drag & Drop
You can use Drag & Drop to simplify the following:
▫ Add a symbol (Overlay) in a chart
▫ Add a symbol to a Watchlist
▫ Create Alerts (limits) for a symbol
▫ Add the detail view of a symbol to Favorites
▫ Change the Order of watchlists or favorites
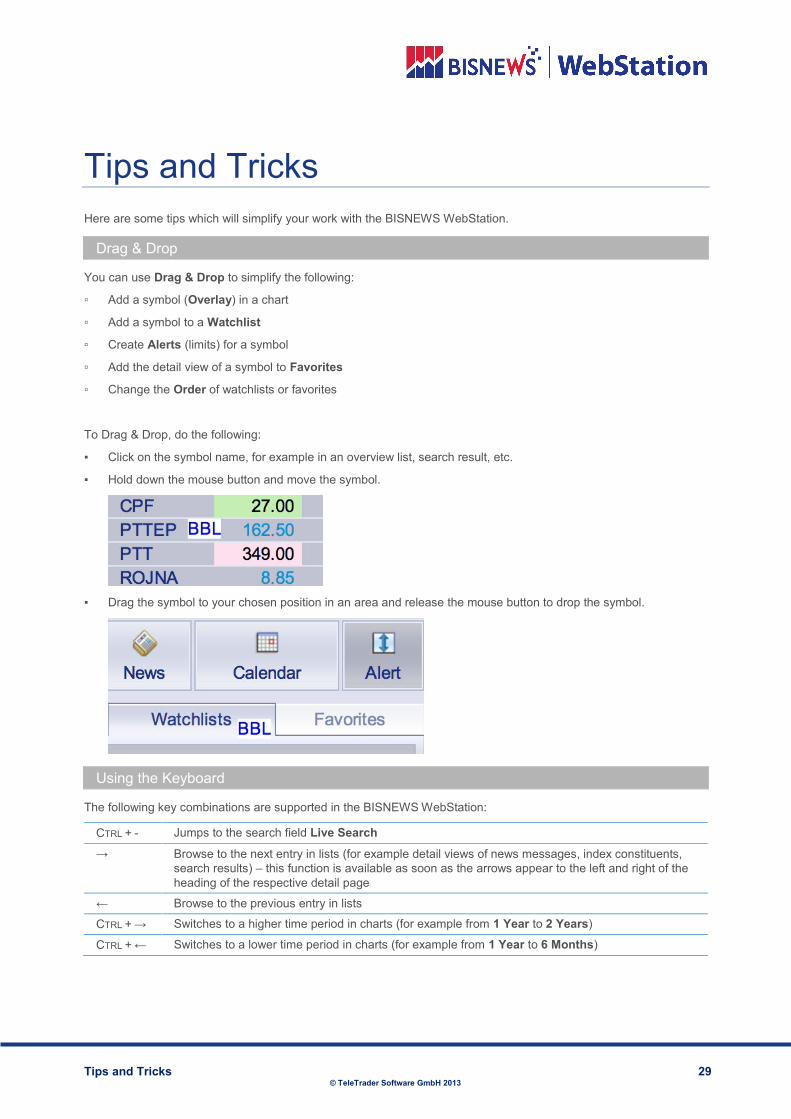
To Drag & Drop, do the following:
▪ Click on the symbol name, for example in an overview list, search result, etc.
▪ Hold down the mouse button and move the symbol.
▪ Drag the symbol to your chosen position in an area and release the mouse button to drop the symbol.
Using the Keyboard
The following key combinations are supported in the BISNEWS WebStation:
CTRL + - Jumps to the search field Live Search
→ Browse to the next entry in lists (for example detail views of news messages, index constituents,search results) – this function is available as soon as the arrows appear to the left and right of theheading of the respective detail page
← Browse to the previous entry in lists
CTRL + → Switches to a higher time period in charts (for example from 1 Year to 2 Years)
CTRL + ← Switches to a lower time period in charts (for example from 1 Year to 6 Months)

Tips and Tricks 30© TeleTrader Software GmbH 2013
Using Gestures on Tablets
If you are using the WebStation on a tablet device, the following additional gestures are available:
Swiping left / righton detail pages
Browses through list entries (for example detail views of news messages, indexconstituents, search results) – this function is available as soon as the arrowsappear to the left and right of the heading of the respective detail page
Pinching with two fingersin HTML5 charts
Zooms into / out of the chart

Settings 31© TeleTrader Software GmbH 2013
SettingsThe global settings are found in the title bar of the BISNEWS WebStation.
Account Settings
▪ Click on the button and select Account Settings.
E-Mail The e-mail address will for example be used for alerts / notifications.
Change E-Mail Click here to change your e-mail address.
Flash Chart Settings Deactivate this option in order to always work with the standard settings of theFlash Chart.
Time Zone Settings Select your time zone.
User-Specific Settings Activate one or both options and click Clear in order to delete all custom chartsettings or all user-defined settings.
News Settings
▪ Click on the News tab under Settings.
News Flash Settings Choose the number of news messages displayed in NewsFlash and thedesired filter.
News Settings Choose the number and maximum age of the news messages displayed ondetail pages.
Language Selection Select the language for displayed news. As long as news are available in thedesired language, they will be displayed.
Packages Select the news packages for displayed news. Individual news packages canbe activated/deactivated here.
Set personal start page
▪ To use the currently shown page as your start page for the WebStation, click on the button and selectSet as start page.
▪ You can call up your personal start page by clicking on the WebStation logo (upper left corner).


System Requirements 33© TeleTrader Software GmbH 2013
System RequirementsFor running BISNEWS WebStation, the following requirements should be met:
Browser
▫ Internet Explorer 7 or higher
▫ Mozilla Firefox – most current version
▫ Mozilla Firefox ESR (Extended Support Release) – most current version
▫ Safari on iPad
JavaScript
JavaScript must be activated.
Flash
For working with the Flash Chart, Flash in the most current version must be activated.
HTML5
For working with the HTML5 Chart, the browser used must support HTML5 (Internet Explorer 9 or higher, currentMozilla Firefox, Safari on iPad).
Cookies
For using the Stay logged in functionality, cookies must be activated.
Internet Connection and Firewalls
A persistent connection to the Internet is necessary.
Access to the following addresses must be possible:
▫ www.teletrader.com
▫ webstation.teletrader.com
▫ push.teletrader.com
▫ push.ttweb.net

© TeleTrader Software GmbH 2013. All rights reserved
For more information:Bisnews AFE (Thailand) Limited17th Fl. U Chu Liang Building968 Rama IV RoadBangkok 10500Thailand
T: +662 637 5555F: +662 637 5679E: [email protected]
www.bisnews.com
User Guide for the BISNEWS WebStation
October 2013
No part of this document may be photocopied, reproduced, or translated without prior written consent of TeleTrader SoftwareGmbH.
All brands and trademarks mentioned in this document are the property of their respective owners.
Subject to change without notice.


![(WSP) Physician User Manual - WebStation for Physicians ...wsp.mclaren.org/Flint/Files/WSPPhysicianUserManualVer[1].3.pdf · Immun – Displays the immunizations entered in the Patient](https://static.fdocuments.net/doc/165x107/5d57812988c9934b1c8bce6d/wsp-physician-user-manual-webstation-for-physicians-wsp-13pdf-immun.jpg)