User-centred approach to the development of NDT … .pdf · User-centred approach to the...
94
Svensk Kärnbränslehantering AB Swedish Nuclear Fuel and Waste Management Co Box 250, SE-101 24 Stockholm Phone +46 8 459 84 00 R-14-06 User-centred approach to the development of NDT instructions Marija Bertovic BAM Federal Institute for Materials Research and Testing Ulf Ronneteg Svensk Kärnbränslehantering AB May 2014
Transcript of User-centred approach to the development of NDT … .pdf · User-centred approach to the...

Svensk Kärnbränslehantering ABSwedish Nuclear Fueland Waste Management Co
Box 250, SE-101 24 Stockholm Phone +46 8 459 84 00
R-14-06
User-centred approach to the development of NDT instructions
Marija Bertovic BAM Federal Institute for Materials Research and Testing
Ulf Ronneteg Svensk Kärnbränslehantering AB
May 2014

Tänd ett lager: P, R eller TR.
User-centred approach to the development of NDT instructions
Marija Bertovic BAM Federal Institute for Materials Research and Testing
Ulf Ronneteg Svensk Kärnbränslehantering AB
May 2014
ISSN 1402-3091
SKB R-14-06
ID 1430722
A pdf version of this document can be downloaded from www.skb.se.

SKB R-14-06 3
Summary
One of the aims of considering human factors in the reliability of non-destructive testing (NDT) – for the purposes of the disposal of spent nuclear fuel – is to identify factors that can lead to errors in the completion of the NDT task and to determine how to prevent these errors. The current study is the first to examine mechanised NDT from the human factors perspective. A number of risks were identified and further analysed. Among a number of influencing factors, the NDT inspection procedure was identified as a potential error source and, therefore, was examined in this study.
NDT inspection procedures and instructions are, without question, some of the most important tools in the everyday life of an NDT inspector. Experience and research have shown that NDT procedures and instructions, despite being written according to requirements and by certified personnel, are not always used as foreseen and may need to be optimised. The suggested approach for developing and optimising NDT procedures and instructions consists of applying human factors principles by adopting a user-centred approach. The user-centred approach refers to involving users in the process of instruction development by learning from their errors during the data evaluation task and connecting those errors to the shortcomings in the instructions.
The first study assessed the quality of the selected NDT instruction by observing four experienced inspectors during the evaluation of data that were collected with the ultrasonic testing (UT) method while the participants followed the instruction. Through the use of an eye-tracking methodology, the participants’ eye movements across the screen were observed and further analysed. This analysis, together with discussions with the individual users, led to the identification of a number of errors and error sources. Such error identification, combined with theoretical considerations, led to the creation of a new version of the instruction. This new instruction was evaluated using the same method in a follow-up study, resulting in the creation of a third (and final) NDT instruction. Throughout this iterative process, version 4.0 of the instruction was replaced first by version 5.5 and then by version 6.0.
As a result of these studies, changes were introduced to the instruction content (e.g. adding missing content) and to the instruction format (e.g. changing the layout, highlighting, presenting the information differently, altering the writing style). The participants reported higher satisfaction with the instruction after the changes were implemented. The main changes included using consistency in writing, high-lighting information (e.g. number values, reporting levels, exceptions, reminders), improving naviga-tion throughout the instruction (e.g. through the use of titles and subtitles), and presenting information more uniformly (e.g. all tasks being listed stepwise following the “one action per step” rule).
Considering the benefits of including the user in the development of the NDT instructions and procedures, the main lesson that was learned in this study is that the review process must be carried out through action rather than by solely reading the instructions. This study exposed a number of problems of which the writer and the reviewer were unaware.
After the new instruction was developed, two empirical studies with 20 participants were conducted to evaluate the instruction information by investigating 1) whether the instruction content was understood by the users (the understanding study) and 2) whether the new format supported a more efficient (i.e. less effortful), effective (i.e. more accurate and complete), and satisfying use of the instruction (the usability study). The aim of these studies was to increase the understanding of the factors that contribute to a high-quality NDT instruction.
In the understanding study, the participants were asked to read the NDT instruction and then to answer a number of questions. Based on their answers, specific problems that were related to their understanding of the written content were identified. The results showed that the understanding of the information can be affected by the information order, information organisation, logics and clarity in the writing, and cognitive demands. The study also emphasised the relevance of placing information in a logical order.

4 SKB R-14-06
In the usability study, it was hypothesised that higher efficiency would be achieved in the use of the instruction by highlighting information (through the use of bold text and adding notes to highlight information), incorporating navigational aids throughout the instruction (through the use of subtitles), and presenting information differently (through stepwise task presentation and one-action steps). To test this hypothesis, the information from the new instruction (version 6.0) was written in two ways: with versus without the formatting changes. The results showed that clearly distinguishing notes from the remainder of the text (by placing them in grey, square boxes) and presenting the tasks in a stepwise manner, with one action per step, had the largest effects on the time that was invested in finding the information in the instruction, i.e. on efficiency.
The participants, in general, showed higher satisfaction with the new instruction versions, both regarding the content and the format. High satisfaction is related to general positive attitudes towards the use of the product and, thus, plays an important role in the usability of the product.
In conclusion, the current studies showed that the NDT procedures and instructions are flawed and should be optimised. Such optimisation can be achieved by adopting a user-centred approach and combining it with theoretical considerations of usability and interface design.
The current study is the first to consider the use of an NDT instruction in the disposal of spent nuclear fuel. As such, the researchers encountered a number of methodological problems, for which a number of solutions were proposed. Future research must overcome these problems and investigate additional factors that might affect the quality of the procedures and the instructions. Instructions and procedures should be developed through a stepwise iterative process, i.e. the same method should be applied repeatedly until the desired quality is achieved. This method is expected to lead to the iden-tification and rectification of problems involving understanding and usability issues. The creation of guidelines for procedure writers may aid in further attempts to create improved procedures.
SKB R-14-06 5
Sammanfattning
Ett syfte med att inkludera mänskliga faktorer vid undersökning av tillförlitligheten av oförstörande provning (OFP) – inom ramen för slutförvaring av använt kärnbränsle – är att identifiera faktorer som kan leda till fel vid oförstörande provning och identifiera hur dessa fel kan förebyggas. Denna studie är den första som undersöker mekaniserad oförstörande provning från ett perspektiv med avseende på mänskliga faktorer. Ett antal risker identifierades och analyserades. Bland påverkande faktorer, identifierades OFP-proceduren som en potentiell felkälla och denna undersöktes därför vidare i denna studie.
OFP-procedurer och instruktioner är utan tvekan några av de viktigaste verktygen i det dagliga arbetet för en OFP-operatör. Erfarenhet och forskning har visat att OFP-procedurer och instruktioner, trots att de skrivits enligt föreskrifter och utarbetade riktlinjer av certifierad personal, inte alltid används som planerat och kan behöva optimeras. Den föreslagna strategin för att utveckla och opti-mera OFP-procedurer och instruktioner består av att tillämpa principer för mänskliga faktorer genom att anamma ett användarcentrerat synsätt. Det användarcentrerade synsättet syftar till att involvera användarna i processen för utveckling av instruktioner genom att ta lärdom av deras misstag vid utvärdering av data och koppla dessa till brister i instruktionerna.
Den första studien undersökte kvaliteten på den valda OFP-instruktionen genom att observera fyra erfarna inspektörer under utvärderingen av ultraljuddata enligt denna OFP-instruktion. Genom att använda eye-tracking-teknik, observerades och analyserades deltagarnas ögonrörelser över skärmen. Denna analys, tillsammans med diskussioner med de enskilda användarna, ledde till identifiering av ett antal fel och felkällor. Identifierade fel, kombinerat med teoretiska överväganden användes som grund för skapande av en ny version av instruktionen. Denna nya instruktion utvärderades med hjälp av samma metod i en uppföljande studie, vilket resulterade i skapandet av en tredje (och slutlig) OFP-instruktion. Under hela denna iterativa process, blev instruktion version 4.0 ersatt först med version 5.5 och sedan med version 6.0.
Som ett resultat av dessa studier, infördes ändringar i instruktionens innehåll (t ex infoga saknat innehåll) och i instruktionens utformning (t ex ändrad layout, framhäva information, presentera informationen annorlunda, ändra skrivsätt). Deltagarna rapporterade högre tillfredsställelse med instruktionen efter det att förändringarna genomförts. De viktigaste förändringarna innefattade kon-sekventa skrivningar, framhävande av information (t ex siffervärden, rapporteringsnivåer, undantag, påminnelser), förbättrad navigeringsstruktur genom hela instruktionen (t ex genom användning av rubriker och underrubriker), och presentera information mer enhetligt (t ex alla åtgärder listade stegvis efter regeln ”en åtgärd per steg”).
Med tanke på fördelarna att inkludera användaren i utvecklingen av OFP-procedurer och instruktio-ner, är den viktigaste lärdomen av denna studie att granskning ska ske genom praktisk tillämpning snarare än genom att enbart läsa instruktionerna. Denna studie identifierade ett antal problem som författaren och granskarna inte kände till.
Efter att den nya instruktionen utvecklats, genomfördes två empiriska studier med 20 deltagare för att utvärdera instruktionen genom att undersöka 1) om instruktionens innehåll förstods av använ-darna (förståelsestudie) och 2) om det nya formatet stödde en effektivare (dvs mindre krävande), effektiv (dvs mera korrekt och fullständig), och tillfredsställande användning av instruktionen (användarbarhetsstudie). Syftet med dessa studier var att öka förståelsen av de faktorer som bidrar till en hög kvalitet hos en OFP-instruktion.
6 SKB R-14-06
I förståelsestudien ombads deltagarna att läsa en OFP-instruktion och sedan svara på ett antal frågor. Utifrån deras svar identifierades specifika problem som var relaterade till deras förståelse av det skriftliga innehållet. Resultaten visade att förståelsen av information kan påverka hur den är ordnad och strukturerad, logik och tydlighet i formuleringar, och kognitiva krav. Studien betonade också betydelsen av att placera information i logisk ordning.
I användarbarhetsstudien hade hypotesen antagits att högre effektivitet skulle uppnås vid användning av instruktionen genom att framhäva information (genom användning av fet text och genom att lägga till notiser för att markera viktig information), införa navigeringshjälpmedel i hela instruktionen (genom användning av underrubriker), och presentera information annorlunda (genom stegvis beskrivning av åtgärderna samt en åtgärd per steg). För att testa denna hypotes, skrevs informationen från den nya instruktionen (version 6.0) på två sätt: med respektive utan ovanstående formatering. Resultaten visade att tydligt skilja notiser från resten av texten (genom att placera dem i grå rutor) och presentera uppgifterna stegvis, med en aktivitet per steg, hade den största inverkan på den tid som krävdes för att finna informationen i instruktionen, dvs effektivitet.
Deltagarna i allmänhet visade högre tillfredsställelse med den nya versionen av instruktionen, både vad gäller innehåll och format. Hög tillfredsställelse är relaterad till allmänt positiv attityd till användningen av instruktionen och spelar därmed en viktig roll för användarbarheten av produkten.
Sammanfattningsvis, visade de aktuella studierna att OFP-procedurer och instruktioner är bristfälliga och bör optimeras. Sådan optimering kan uppnås genom att anamma en användarcentrerad metod och kombinera det med teoretiska överväganden om användarbarhet och gränssnittsdesign.
Denna studie är den första att beakta OFP-instruktioner inom slutförvaring av använt kärnbränsle i betraktande. Som sådan stötte forskarna på ett antal metodproblem, för vilka lösningar föreslogs. Framtida forskning måste övervinna dessa problem och undersöka ytterligare faktorer som kan påverka kvaliteten på procedurer och instruktioner. Procedurer och instruktioner bör utvecklas genom en stegvis iterativ process, dvs samma metod bör tillämpas upprepade gånger tills önskad kvalitet uppnås. Därmed förväntas problem orsakade som följd av brist på förståelse och användar-barhet kunna identifieras och förebyggas. Skapandet av riktlinjer för författare kan vara till stöd vid ytterligare försök att skapa förbättrade procedurer.

SKB R-14-06 7
Contents
1 Background 91.1 Nuclear fuel management 91.2 Humans factors in the reliability of non-destructive testing (NDT) 101.3 Human factors in mechanised NDT for the purpose of managing spent
nuclear fuel 121.3.1 Introduction 121.3.2 NDT procedure/instruction as the cause of error and preventive
measure 12
2 Introduction to the study 15
3 Usability 173.1 Usability definition 173.2 Usability evaluation 183.3 Eye tracking in usability testing 18
4 Shortcomings of NDT procedures and instructions 214.1 Previous studies on the quality of the existing inspection procedures 21
5 Research questions 23
6 Development of the NDT instruction 256.1 Introduction 256.2 Method 26
6.2.1 Participants 266.2.2 Tools 276.2.3 Task 296.2.4 Execution of the study 30
6.3 Study 1: Evaluation of NDT Instruction version 4.0 306.3.1 Task observation 306.3.2 Discussion with the user (RTA) 316.3.3 Identification of errors and error sources 326.3.4 Analysis of the NDT instruction following human factors principles 356.3.5 Generation of improvements 35
6.4 Study 2 (follow-up): Evaluation of the NDT Instruction version 5.5 406.4.1 Task observation 406.4.2 Discussion with the user (RTA) 406.4.3 Identification of errors and error sources 416.4.4 Analysis of the NDT instruction following the human factors
principles 446.4.5 Generation of improvements 44
6.5 User satisfaction 476.6 Discussion 496.7 Limitations of the study 51
7 Empirical study of the instruction content and the instruction format 537.1 Introduction 537.2 Research questions 537.3 Method 54
7.3.1 Participants 547.3.2 Experimental environment 557.3.3 Questionnaires 557.3.4 Execution of the study 56
7.4 Understanding study (instruction content) 567.4.1 Introduction 567.4.2 Method 577.4.3 Results and discussion 587.4.4 Limitations of the study 61

8 SKB R-14-06
7.5 Usability study (instruction format) 627.5.1 Introduction 627.5.2 Method 627.5.3 Results and interpretation of the results 657.5.4 Discussion 717.5.5 Limitations of the study 73
8 Conclusions and outlook 75
Acknowledgements 77
References 79
Appendix 1 Questionnaires 83
Appendix 2 The data evaluation task 85
Appendix 3 NDT instruction development – analysis of data 87
Appendix 4 Empirical study – tools 91
Appendix 5 Usability study – examples of images 95
Appendix 6 Usability study – outliers 101
Appendix 7 Usability study – results 103

SKB R-14-06 9
1 Background
The safety of large-scale complex organisations with high hazard potential, such as those in the nuclear power industry or commercial aviation, has been of major concern since their invention. Ensuring the safe operation of such organisations is a continuous undertaking that involves engineering optimised solutions, quality control of operations and materials, the implementation of preventive measures, and personnel training.
Research on so-called “high-reliability organisations” (HROs) has shown that the reliability of these organisations is both “remarkable and unexpected” (La Porte 1996, p 61). However, the continuous effort to understand how these organisations work and how to avoid accidents enables these organi-sations to operate safely.
1.1 Nuclear fuel managementThe achievement of high safety standards is of great importance in the management of spent nuclear fuel, especially because this industry faces different challenges than its founder, i.e. the nuclear power industry. The most advanced disposal concept is that of the Swedish Nuclear Fuel and Waste Management Company (SKB) and its Finnish equivalent, Posiva, which developed a long-term solution to store spent nuclear fuel. The suggested approach of geological disposal consists of encapsulating the fuel in copper canisters, depositing these canisters in the bedrock at a depth of approximately 500 meters, and utilising a buffer of bentonite clay to protect the canisters against corrosion and movements in the rock. See Figure 1-1 for an illustration of SKB’s disposal plan.
Figure 1‑1. Illustration of SKB’s KBS-3 method for the disposal of spent nuclear fuel (3 barriers: the canister, the bentonite clay, and the bedrock).

10 SKB R-14-06
1.2 Humans factors in the reliability of non-destructive testing (NDT)The most important safety barrier for spent nuclear fuel is the canister. Thus, substantial effort has been invested into the development of the canister and into its mechanical properties to ensure that it can withstand anticipated loads, potential earthquakes, and even upcoming ice ages.
The copper canisters consist of a copper tube, a lid, a bottom (which compose the outer shell), and a cast iron insert. These canisters must be inspected to ensure that no critical defects are present in the materials and welds because such defects could lead to the leakage of radionuclides from the spent nuclear fuel into the environment. This inspection is achieved by means of non-destructive testing (NDT) methods, such as ultrasound, radiography, and eddy current testing. Currently, the advanced ultrasonic (UT) phased array system is the primary inspection method (SKB 2013). Figure 1-2 depicts the canister’s parts.
One of the major concerns in the development of the NDT methods that are used to inspect the canister is defining their reliability. The reliability of NDT is defined as the probability that a system or a device (e.g. the NDT system) will perform its intended function (e.g. to detect a flaw) under the operating conditions. The core of the reliability analysis is estimating the probability with which the NDT system will find a flaw with certain properties (relative to type, size, orientation, or depth) (Pavlovic et al. 2008).
Over the years, reliability estimations have focused mainly on the NDT equipment’s ability to find defects, i.e. its intrinsic capability. However, the Modular Reliability Model (Figure 1-3), which is widely accepted by the NDT community, suggests that application factors (i.e. realistic circumstances under which an inspection is performed) and human factors must be considered (Nockemann and Fortunko 1997). Pursuant to new attempts to include human factors in the consideration of reliability, the organisational context was added to the model in 2009 (Müller et al. 2009).The addition of the organisational context to the model was inspired by the findings of Bertovic et al. (2009, 2011). These authors showed that, to properly address human factors, the human operator should not be excluded from the organisational environment.
Figure 1‑2. Canister parts - the copper tube, the lid/bottom, and the cast iron insert.

SKB R-14-06 11
The definition of human factors in NDT – the “mental and physical make of the individual; the individual’s training and experience; and the conditions under which the individual must operate[,] which influence the ability of the NDE system to achieve its intended purpose” (Stephens 2000) – is rather narrow. Generally, human factors refer to “environmental, organizational and job factors, and human and individual characteristics, which influence behaviour at work in a way which can affect health and safety” (HSE 1999). This definition implies that a search for the influencing factors needs to extend beyond the human link. The modern approach to safety is system-oriented rather than person-centred. In the systems approach, human failure is seen as the result of failure that lies deeper in the system. Thus, Fahlbruch and Wilpert (1997) have suggested that, when searching for a cause of failure, one must examine the interactions between the following five system components (comprising a systemic view of safety): the technical sub-system and the four parts of the social subsystem: the individual (qualification), team (norms), organisation (structure), and environment (regulator, manufacturer). For a visual depiction of the approach, see Figure 1-4.
Figure 1‑3. Modular Reliability Model.
Figure 1‑4. Systemic view of safety (Fahlbruch 2009, p 9).
EnvironmentOrganisation
TeamIndividual
Technology

12 SKB R-14-06
The variability in the inspection results has consistently puzzled the NDT community. The community often either “blamed” the inspector or replaced manual inspections with mechanised inspections. Both of these approaches have the following limitations:
• In compliance with modern theories on human factors, sources of errors can be found not only in the operator but also deeper in the system (Reason 1997, Dekker 2002). In NDT, rather than investigating only the inspector, one must examine the design of the workplace, working conditions, and inspection procedures, for example.
• Replacing manual NDT methods with mechanised methods can lead to a decrement in the number of errors that are committed by the inspector. However, mechanised testing is not free from human and organisational influence. The change in the inspector’s task from conducting the entire task manually to controlling the equipment could lead to new sources of errors, as suggested by research on human interaction with automated systems (e.g. Bainbridge 1987, Mosier and Skitka 1996, Parasuraman and Riley 1997, Manzey 2012). Automated systems are man-machine systems, for which both technical and human factors are important (Bainbridge 1987). Therefore, NDT heavily depends on the human operators who set up the equipment and evaluate the collected data. Bertovic et al. (2013) were the first to address this issue in NDT. Their research study raised the issue that when the correct functioning of an automated software that detects defects is overly trusted, defects can be overlooked.
1.3 Human factors in mechanised NDT for the purpose of managing spent nuclear fuel
1.3.1 IntroductionThe joint project “NDT Reliability IV-V” (2008–2010), conducted among SKB, Posiva, and BAM (the German Federal Institute for Materials Research and Testing), aimed to further develop the techniques used to measure and improve the reliability of NDT methods. Whereas “NDT Reliability IV” focused on developing new approaches to estimating the probability of UT systems to detect certain defects (the probability of detection, POD), “NDT Reliability V” addressed, for the first time, the conceptualisation of human factors and their influence on the reliability of a mechanised inspection process.
The aim of this project was to identify the potential human factors issues in the mechanised data acquisition and data evaluation processes. This was the first project of this type in the management of the spent nuclear fuel and in mechanised NDT. The specific nature of this project (NDT methods remain under development, and their implementation is scheduled to occur approximately 10 years after the time of the project) required a look into the future. This perspective was achieved through a series of customised Failure Modes and Effects Analyses (FMEAs).
In “NDT Reliability V”, an FMEA was used to identify possible failures in the UT data evaluation process arising either from the inspector, the technology or the organisation. In the “NDT Reliability VII” project (2011–2014), the data acquisition process was addressed (SKBdoc 1427252, Bertovic et al. 2013). In a separate project with Posiva, an FMEA was conducted for the following 4 NDT methods, which were to be used as complementary methods for the inspection of canister compo-nents in Finland: ultrasonic, radiographic, eddy current, and visual testing with a remote camera (Bertovic et al. 2013).
1.3.2 NDT procedure/instruction as the cause of error and preventive measureThe analyses showed that errors could occur during all stages of the mechanised NDT task (SKBdoc 1427252). Technical shortcomings (e.g. in hardware or in software), shortcomings in the procedure/instructions, the organisation of the inspection (e.g. responsibilities), unintentional actions (e.g. typing errors, false expectations), and intentional human contributions (e.g. violations, such as not following the procedure) were identified as some of the main contributors to errors. Although some of the errors could be identified through consecutive steps, potential preventive measures beyond inspector training, experience, and formal qualification had to be considered.

SKB R-14-06 13
The most relevant potential preventive measures that were discussed included the following:
• Improvement of the inspection procedures/instructions with respect to missing information and information presentation.
• Introduction of human factors training into the formal NDT training.
• Implementation of human redundancy to avoid the errors of single inspectors.
• Hardware and software improvements (e.g. redesigning the probe fixture, redefining the screen view parameters).
• Automation (e.g. using a bar code reader, automatically refilling the couplant).
• Alarms (e.g. for detecting inconsistencies or typos).
• Decision aids (e.g. the defect catalogue).
This investigation was quite valuable insofar as it inspired further research on the implementation of preventive measures, such as the implementation of human redundancy and the problem of social loafing, i.e. the decrement in motivation observed when people work together as opposed to when they work alone (Bertovic et al. 2013).
Furthermore, during the FMEA, the inspection procedure was identified as one of the probable causes of errors (in terms of shortcomings in the procedure, misinterpretation of the procedure, or failure to follow the procedure) and one of the potential preventive measures (in terms of optimising the procedure). The suggested approach for optimisation consisted of ensuring that the procedure was up-to-date, that it contained all of the relevant information, and that it was clearly written in accordance with the users and such that it would be understood by all of the users (SKBdoc 1427252, Bertovic et al. 2013).
Continuous efforts have been made to improve the procedure content; however, the consideration of other influencing factors has remained lacking. Thus, the current research focuses on this topic.

SKB R-14-06 15
2 Introduction to the study
An important tool in the everyday life of an NDT inspector is the inspection procedure. In general, this procedure refers to a “written description of all essential parameters and precautions to be applied when non-destructively testing products in accordance with standard(s), code(s) or specification(s)” (DIN EN ISO 9712:2012, p 8). During testing, the inspector is guided by a precise, written description of the steps that must be followed, which is known as the NDT instruction (DIN EN ISO 9712:2012). Certified NDT personnel write both the NDT procedure and the NDT instruction according to standards, codes, and specifications. These documents should only be used by trained NDT personnel.
Although the NDT procedures and instructions are written by certified personnel according to requirements, they are not always used properly and thus might need to be optimised. Observations from a comprehensive study on the effects of inspection procedures on inspection reliability have suggested that “the inspection procedure is key to a reliable inspection” (McGrath et al. 2009, p 7). The authors further suggested that, among other things, the procedure must be written in a manner that promotes its systematic application and that it should be designed to assist the inspector in carrying out the inspection as desired (McGrath et al. 2009). With this in mind, written NDT proce-dures and instructions must not only fulfil the content requirements but also be usable and developed in accordance with the user.
Usability, as a trait of human-interface interaction, ensures that the writing of the procedure corresponds to the user’s expectations, allows fast learning, is understandable to the least experienced user, and leads to error-free behaviour. With this in mind, the human factors approach allows the development of new procedures and instructions as well as the optimisation of existing ones (Harris 1988).
The research on the usability of different instruction manuals, including the NDT inspection procedure and instruction, has indicated that the procedures must be written in accordance with the user. The reason for this is to ensure that the procedures are not only qualified for the inspection task but also equally understood by all users and written in a manner that supports their use.
“Human-centred design is an approach to interactive systems development that aims to make systems usable and useful by focusing on the users, their needs and requirements, and by applying human factors/ergo-nomics, and usability knowledge and techniques. This approach enhances effectiveness and efficiency, improves human well-being, user satisfaction, accessibility and sustainability; and counteracts possible adverse effects of use on human health, safety and performance. (DIN EN ISO 9241-210:2011, p 4)
When producing procedures, a user-centred design approach should be adopted to ensure that the procedures take user requirements into account and are in a format that is consistent with the task and the environment within which it is completed. The adoption of such an approach will help to reduce the likelihood of errors and intentional violations and ensure that the procedures are valued and used by the end user (McGrath 2008).
The procedures (or sub-sections thereof) should be produced with an understanding of the user, the task and the environment by gathering the following information (McGrath 2008):
• What is the purpose of the procedure (training, on-the-job support, compliance, etc.)?
• Who will use the procedure? What are the users’ skills, experience, training, and needs?
• How often is it completed, and how complex/difficult is the task?
• How much information does the user require?
• What is the working environment, and what impact does this have on the format?

16 SKB R-14-06
Why is this important? First, suboptimal procedures can have an undesired impact on safety, as shown by Bento’s (2002) evaluation of procedure-related events and emergency reactor shutdowns. One of the aims of a written procedure is to restrict human action to pathways that are not only efficient and productive but also safe (Reason 1997, de Brito 2002). System reliability requires strict adherence to written procedures (de Brito 2002). Second, procedure-related problems can lead to unnecessary financial costs. In a study of 21 nuclear power plants, McCallum et al. (1994) identified 19 categories of procedure-related problems that led to an average approximate loss of $1 million per plant (status 1994) in terms of lost power production and equipment damage.
High-quality NDT procedures and instructions are valuable not only during service but also during the development of NDT techniques. The purpose of the current NDT development at SKB is to support the development and validate the quality of the manufacturing and welding processes. To meet this goal, the application of NDT methods and techniques must provide reliable results. Because reliability depends on both technology and human factors, it is necessary to examine the potential negative effects even in the development phase. The results of copper canister inspections can vary. The FMEA (SKBdoc 1427252, Bertovic et al. 2013) demonstrated that a human factors approach in the development of the NDT instructions could serve as a potential preventive measure against errors that are committed during an NDT inspection task. The aim of a high-quality inspection instruction is to decrease inspector variation by ensuring that the steps are described in an unambiguous manner (i.e. all users interpret the tasks in the same manner) and that adhering to the instruction will lead to the same results. Poor-quality inspection procedures and instructions, by contrast, could have an undesired effect on the inspection results and thus inaccurately portray the quality of the manufacturing and welding processes.
Furthermore, by examining the quality of the NDT procedures and instructions in the development phase, one can learn about the instruction use and the factors that contribute to a high-quality instruc-tion before it is employed in praxis. The instruction is generally viewed as an aid to an experienced and well-trained inspector. However, if the inspection is carried out over large time intervals (as is the case until the operation of the repository begins in approximately 15 years and during the initial operation phase, when only a handful of canisters will be manufactured and inspected yearly), there is a risk of loss of continuity and skill over time. In this case, high-quality instruction plays an even more important role.
The goal of the current study was to apply human factors principles to the development of an NDT instruction. Moreover, the goal was to optimise the instruction to obtain more reliable and accurate NDT performance and to promote the use of the instruction. In line with the usability framework (DIN EN ISO 9241-11:1999), such optimisation can be achieved by creating a document which supports the user in completing his or her task effectively, efficiently, and with satisfaction.
SKB R-14-06 17
3 Usability
To classify a procedure as usable, it is important to determine whether it is administratively and technically correct (via the process of verification) and whether it will function as intended (via the process of validation) during the development process (IAEA 1998). Following this rationale, when usable, the NDT inspection procedures and instructions should enable the NDT inspector to complete the NDT task correctly, accurately, and efficiently.
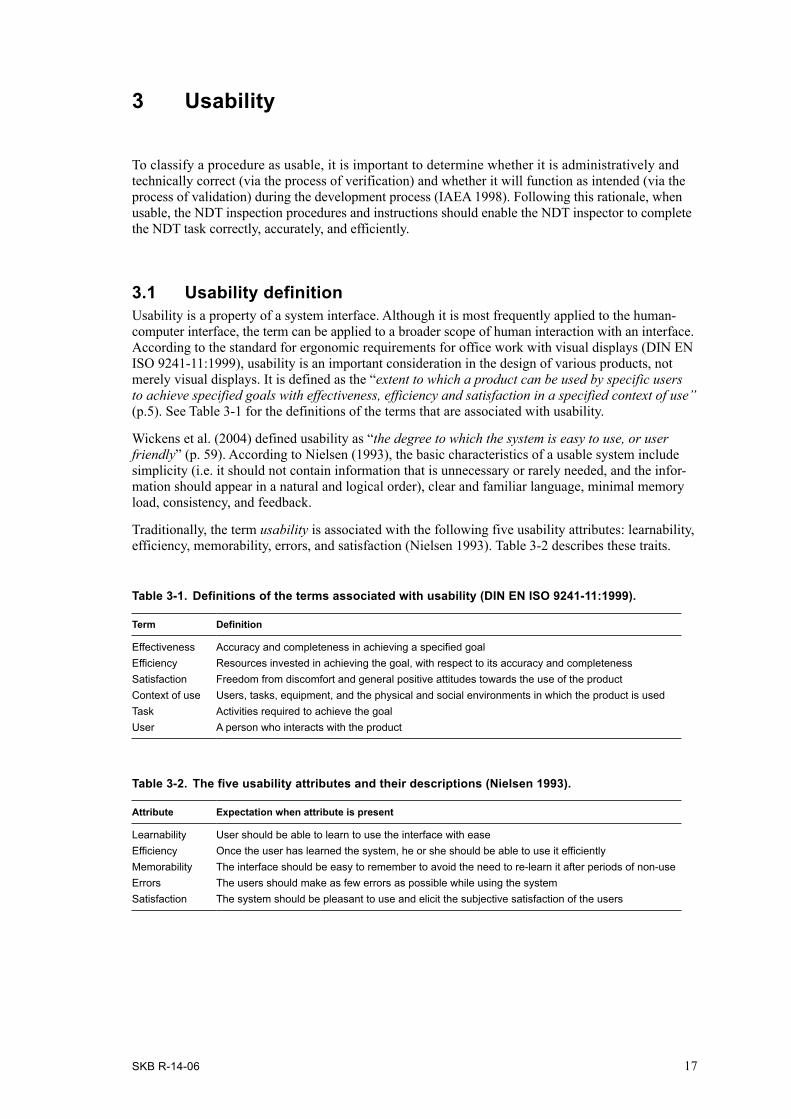
3.1 Usability definitionUsability is a property of a system interface. Although it is most frequently applied to the human-computer interface, the term can be applied to a broader scope of human interaction with an interface. According to the standard for ergonomic requirements for office work with visual displays (DIN EN ISO 9241-11:1999), usability is an important consideration in the design of various products, not merely visual displays. It is defined as the “extent to which a product can be used by specific users to achieve specified goals with effectiveness, efficiency and satisfaction in a specified context of use” (p.5). See Table 3-1 for the definitions of the terms that are associated with usability.
Wickens et al. (2004) defined usability as “the degree to which the system is easy to use, or user friendly” (p. 59). According to Nielsen (1993), the basic characteristics of a usable system include simplicity (i.e. it should not contain information that is unnecessary or rarely needed, and the infor-mation should appear in a natural and logical order), clear and familiar language, minimal memory load, consistency, and feedback.
Traditionally, the term usability is associated with the following five usability attributes: learnability, efficiency, memorability, errors, and satisfaction (Nielsen 1993). Table 3-2 describes these traits.
Table 3-1. Definitions of the terms associated with usability (DIN EN ISO 9241-11:1999).
Term Definition
Effectiveness Accuracy and completeness in achieving a specified goalEfficiency Resources invested in achieving the goal, with respect to its accuracy and completenessSatisfaction Freedom from discomfort and general positive attitudes towards the use of the productContext of use Users, tasks, equipment, and the physical and social environments in which the product is usedTask Activities required to achieve the goalUser A person who interacts with the product
Table 3-2. The five usability attributes and their descriptions (Nielsen 1993).
Attribute Expectation when attribute is present
Learnability User should be able to learn to use the interface with easeEfficiency Once the user has learned the system, he or she should be able to use it efficientlyMemorability The interface should be easy to remember to avoid the need to re-learn it after periods of non-useErrors The users should make as few errors as possible while using the systemSatisfaction The system should be pleasant to use and elicit the subjective satisfaction of the users
18 SKB R-14-06
3.2 Usability evaluationUsability evaluation is considered to be an essential step in the development of products, regardless of the type of product. Wickens et al. (2004) defined usability testing as the “process of having users interact with the system to identify human factors design flaws overlooked by designers” (p.59). The evaluation of usability should be conducted before, during, and after the development of the product (Goldberg and Wichansky 2003).
Numerous usability measures exist. Kwahk and Han (2002) classified them into the following six groups:
• Temporal, e.g. task completion time and time spent in errors.
• Frequency, e.g. frequency of errors and number of tasks completed per unit time.
• Complexity, e.g. number of functions used to perform a task.
• Psychophysical, e.g. rating scale.
• Descriptive, e.g. user comments and verbal reports.
• Physiological, e.g. electromyogram (EMG) or electroencephalogram (EEG).
Similarly, over 100 evaluation techniques are listed in the literature (Kwahk and Han 2002). These techniques can be classified into the following 5 groups: observation/inquiry, empirical testing, introspection (e.g. cognitive walkthrough, thinking-aloud protocol), inspection, and modelling/simulation. Some of the methods include interviews, following guidelines, observation of the user, comparison with standards or with other systems, and experimental testing, e.g. eye tracking (Zülch and Stowasser 2000).
In conclusion, given the many test issues, influencing factors, evaluation methods, and analysis paradigms that the evaluator must consider, there is no straightforward method to measure usability (Kwahk and Han 2002). Therefore, the evaluator must choose the methodology and how it is applied.
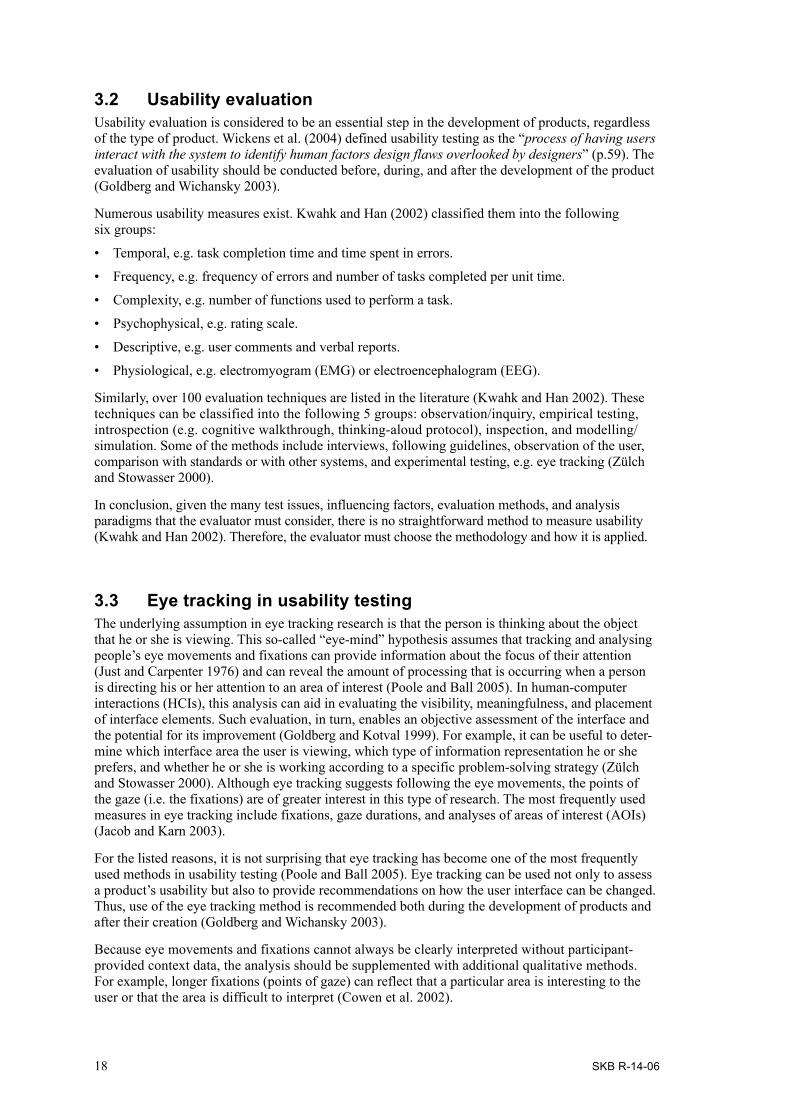
3.3 Eye tracking in usability testing The underlying assumption in eye tracking research is that the person is thinking about the object that he or she is viewing. This so-called “eye-mind” hypothesis assumes that tracking and analysing people’s eye movements and fixations can provide information about the focus of their attention (Just and Carpenter 1976) and can reveal the amount of processing that is occurring when a person is directing his or her attention to an area of interest (Poole and Ball 2005). In human-computer interactions (HCIs), this analysis can aid in evaluating the visibility, meaningfulness, and placement of interface elements. Such evaluation, in turn, enables an objective assessment of the interface and the potential for its improvement (Goldberg and Kotval 1999). For example, it can be useful to deter-mine which interface area the user is viewing, which type of information representation he or she prefers, and whether he or she is working according to a specific problem-solving strategy (Zülch and Stowasser 2000). Although eye tracking suggests following the eye movements, the points of the gaze (i.e. the fixations) are of greater interest in this type of research. The most frequently used measures in eye tracking include fixations, gaze durations, and analyses of areas of interest (AOIs) (Jacob and Karn 2003).
For the listed reasons, it is not surprising that eye tracking has become one of the most frequently used methods in usability testing (Poole and Ball 2005). Eye tracking can be used not only to assess a product’s usability but also to provide recommendations on how the user interface can be changed. Thus, use of the eye tracking method is recommended both during the development of products and after their creation (Goldberg and Wichansky 2003).
Because eye movements and fixations cannot always be clearly interpreted without participant-provided context data, the analysis should be supplemented with additional qualitative methods. For example, longer fixations (points of gaze) can reflect that a particular area is interesting to the user or that the area is difficult to interpret (Cowen et al. 2002).

SKB R-14-06 19
Thinking aloud is one of the most frequently used supportive methods. In this method, the participants are asked to think-aloud while carrying out the task. This technique can be performed concurrently (concurrent think-aloud, CTA) or, as more frequently recommended, while retrospectively observing the recorded eye movements (retrospective think-aloud, RTA), as described by Holmqvist et al. (2011). RTA is a qualitative method in which a user is presented with a replay of the previously performed interactions and eye movements to help cue his or her memory and in which the user is asked to explain his or her thoughts during the task.

SKB R-14-06 21
4 Shortcomings of NDT procedures and instructions
Shortcomings of the various types of procedures (operating procedures, maintenance procedures, etc., mainly for use in the nuclear industry) have been observed and identified. This chapter will present some of the studies that have demonstrated the need for further development and optimisation of the inspection procedure.
4.1 Previous studies on the quality of the existing inspection procedures
The quality of the inspection procedures is of special importance to organisations with high hazard potential, such as nuclear power plants. Such procedures are constantly under high scrutiny, and they must correspond to the highest safety standards.
In 2002, Bento reported the influence of procedures on scrams (emergency shutdowns of the nuclear reactor) and LERs (Licensee Event Reports) in Swedish nuclear power plants in the period 1995–1999. The events or near-events that were related to human factors, referred to as man-technology-organisation (MTO), were of particular interest. He discovered that 15% of all scrams and 31% of MTO-related scrams as well as 10% of all LERs and 25% of MTO-related LERs occurred due to procedural deficiencies. Of all LERs, 23% were related to testing activities.
Deficient procedure content was assigned to 70% of the procedure-related LERs and 85% of the procedure-related scrams, followed by missing procedure and missing updates. Lack of adherence to the procedure was the most important contributing cause of LERs. Procedure-related events were more related to maintenance, testing, and modification tasks (74%) than to operational tasks (20%) (Bento 2002).
McCallum et al. (1994) identified 19 individual procedure problems, classifying these with respect to either procedure content or procedure usability (see Table 4-1).
Table 4-1. Procedure-related problems identified by McCallum et al. (1994), organised into two categories: procedure content and procedure usability.
Category Content Usability
Problem Technical inaccuracyIncorrect referencing and branchingInadequately specified sparesInadequately specified supplies Inadequately specified toolsInadequately specified test equipment Insufficiently detailed instructionsInsufficient support of graphicsInadequate warnings and cautions Procedure scope overly narrowProcedure scope overly broadInstructions overly detailed
Excessive page turning Inappropriate order of stepsLanguage overly difficult to understandData or sign-off sheets difficult to useFormat of instructions difficult to followPoor organisation of the procedureIncorrect step numbering

22 SKB R-14-06
The most frequent procedure usability errors, identified within the scope of an Electric Power Research Institute (EPRI) study, were related to the following issues: a) comprehension, b) internal logic, c) terminology, and d) navigation. The typical errors included failing to associate a statement of caution with the task below it, failing to read critical information embedded in the note section, and failing to read the note section (Spiker 1997).
Several studies have referred to the NDT inspection procedure. In Gaal et al.’s (2009) study, a procedure that was written by a highly experienced and qualified writer was barely understood by the users. The study participants (ten highly experienced UT inspectors) reported satisfaction with the procedure and the ability to use it to complete the inspection task only after the procedure was optimised by taking into consideration the users’ suggestions (e.g. better explanations and more supporting figures).
The Programme for the Assessment of NDT in Industry (PANI) observed that each inspector applied the procedure differently and that the inspectors did not necessarily read the full procedure or apply the procedure as intended by the procedure writers (McGrath 2008). With this in mind, in the third PANI project (i.e. PANI 3), a review of the procedure from a human factors perspective was completed to identify improvements that may encourage the full use of procedures during inspections. The following aspects of the procedure were addressed: length and structure, content and presentation of information, procedural steps, procedure format, and record-keeping.
The PANI team suggested that the procedures should, in general, be as short as possible but contain all relevant information in a manner that allows easy and fast understanding and use. The information that is relevant but not important for the task at hand should be summarised on the front page, whereas the information that must be emphasised should be highlighted. The writer of the procedures should not only attend to the information that must be contained in the procedure but also focus on the reader and his or her understanding of the written text. Each writer should be made aware of this goal, and the users should review each written procedure to verify its clarity and structure. A checklist is a good means to ensure that all tasks have been completed. In conclusion, PANI 3 stated that the inspection procedure is central to a reliable inspection. The best-performing inspectors perform an inspection in a methodical manner; thus, the inspection procedures should be written to promote their systematic application. The procedure must be designed to assist the inspector in performing the inspection in the desired manner. The procedure should also be proportional to the inspectors’ level of training and inspectors should be briefed on the procedures. Furthermore, the terminology must be understood, and any special conditions must be highlighted.

SKB R-14-06 23
5 Research questions
The need to improve the existing NDT procedures and instructions, taking into consideration their content, format, and usability, has been highlighted by both previous research and SKB’s considera-tion of the factors that influence the reliability of NDT. As a result of the FMEA, which identified some of the problems with the inspection procedure and the instructions, SKB acknowledged that their NDT instructions could be improved by applying human factors principles to their design (SKBdoc 1427252).
Before improvements can be made, it is necessary to determine the quality of the existing instructions. It appears that only a few researchers have questioned the quality of existing instructions/procedures. The relationship between the quality of the instruction and the quality of the NDT performance has not yet been established. Therefore, such research is needed.
In an attempt to determine the quality of the current NDT instructions, an appropriate measure must be employed. Because the literature has offered a mostly theoretical perspective on NDT instruction/procedure improvement (e.g. McGrath 2008), an appropriate approach to measuring the quality of the NDT instruction must be found. Such a measurement may be inspired by usability research and adapted for NDT.
Once the shortcomings in the instruction have been identified, the next question is what to do with this information. Related questions include how to optimise the instruction in a manner that leads to a reduced number of errors and how to determine that the instruction has, in fact, been improved. The answers might lie in the user-centred approach, which suggests that the development or design of a product should involve the user and be iterative in nature, as suggested by DIN EN ISO 9241-210:2011). This type of design assumes an iteration of the same steps in the development process until a desired quality has been achieved.
As long as standards, codes, and specifications are followed, NDT procedures and instructions can be written by any individual with sufficient NDT qualifications, i.e. by level 2 and 3 qualified personnel (DIN EN ISO 9712:2012). Given that the NDT procedures and instructions are application- and method-specific, what is the applicability of the current study results? More specifically, what changes in the instruction can be generalised to the general procedure/instruction writing? To answer this question, it is necessary to identify which factors contribute to a high-quality instruction. Following the usability framework (DIN EN ISO 9241-11:1999), such factors should lead to a more effective, efficient, and satisfying user experience and, consequently, to improved NDT performance.

SKB R-14-06 25
6 Development of the NDT instruction
6.1 IntroductionFew studies have addressed NDT inspection procedures and instructions (e.g. McGrath 2008, Spiker 1997, Bento 2002). A human factors approach in the development of the NDT procedure has previously been used only once, during the PANI 3 study (McGrath 2008). However, this approach was based on theory (a group of human factors consultants evaluated the existing procedure and suggested a number of improvements), with little basis on practice. Empirical evidence of the characteristics of a high-quality procedure remains lacking. Drawing inspiration from the PANI project, the aim of the current study was to combine theoretical and practical approaches in the development of an NDT instruction.
The theoretical approach introduces instruction changes that are based on the theoretical considerations of other researchers (namely, the PANI project) and a human factors perspective. The chosen practical approach was to develop a selected NDT instruction following the user-centred approach. According to DIN EN ISO 9241-210:2011, a human- or user-centred design should follow several principles:
• Base the design on an explicit understanding of the users, tasks, and environments.
• Involve the users throughout design and development.
• Change and refine the design according to the user-centred evaluation.
• Iterate the process.
• Address the whole user experience in the design.
• Include multidisciplinary skills and perspectives of the design team.
Following these principles, the current study focused on the methodology that is used to test the quality of existing NDT instructions and on the development of a selected NDT instruction.
During the FMEA, shortcomings in the NDT instructions/procedures were identified as the probable causes of a number of errors that were committed during the data evaluation. In contrast, their improve-ment was identified as a potential measure by which to address the risks that arise from problems in defect identification and characterisation (SKBdoc 1427252). Although problems in defect identifica-tion can be consequences of issues that arise during the data acquisition phase, the problems that were discussed during the FMEA were limited exclusively to problems in detection and characterisation during the data evaluation phase. Because these tasks were evaluated as being highly critical for the future of the component, there was a need for prompt action to decrease them. Thus, the current study focused on the data evaluation task. In addition, eye tracking was considered to be an effective tool by which to gain deeper insight into the problems of defect detection and characterisation. Because eye movements are most commonly measured with the aid of a monitor with integrated cameras, the task was carried out entirely on a computer monitor.
The development of the NDT instruction was conducted in several iterative stages and within two studies, as shown in Figure 6-1.

26 SKB R-14-06
In the first study, 4 qualified inspectors carried out a UT data evaluation task following an appropriate NDT instruction. The aims of the study were to 1) evaluate the quality of the current instruction by assessing the performance resulting from the use of the specific instruction and 2) generate improve-ments, if needed. During the data evaluation phase, the participants were observed with the aid of an eye tracker, a methodology that is used to follow eye movements and fixations across a computer screen. This procedure, combined with discussions with the users, provided insight into the use of the instruction during the task and the potential errors in carrying out the task that resulted from the instruction. The analysis of the collected data, coupled with the theoretical analysis of the instruction from a human factors expert perspective, resulted in a number of suggested changes in the instruction and, consequently, in the creation of a new instruction version.
In the follow-up study, the same methodology was applied to the newly created instruction to 1) determine whether the generated changes, in fact, led to an improved data evaluation performance and 2) generate further improvements. The result of this iterative process was the creation of the final NDT instruction.
In this chapter, the methodology and the resulting NDT instruction development are presented.
6.2 Method6.2.1 ParticipantsTo investigate the status of the current NDT instruction, participants with experience in data evaluation, the data evaluation software (Ultravision), and the instruction were needed. Only 4 participants were qualified to participate. The selected participants were involved in the development of the NDT methods and inspection procedures for SKB. All of the participants were male. At the time of the study, they had an average age of 45 years, more than 5 years of experience in ultrasonic testing, and approximately 1 year of experience in data evaluation with the Ultravision software (including recent experience). One of the participants had written the instruction, one had reviewed it, and the other two had worked with similar instructions.
Figure 6‑1. The process chart of the steps taken in the development of the NDT instruction (from version 4.0 to version 5.5 to the final version 6.0) within the scope of two studies.
Study 1: Evalua�on of the NDT instruc�on v4.0
Study 2 (follow-up): Evalua�on of the NDT instruc�on v5.5
Observa�on of the NDT data evalua�on task
Discussion with the user
Analysis of the NDT instruc�on following the human factors principles Crea�on of the new NDT
instruc�on version (v5.5)
Genera�on of improvements
Iden�fica�on of errors and error sources
Crea�on of the final NDT instruc�on version (v6.0)
Observa�on of the NDT data evalua�on task
Discussion with the user
Analysis of the NDT instruc�on following the human factors principles
Genera�on of improvements
Iden�fica�on of errors and error sources

SKB R-14-06 27
The same 4 participants participated in the follow-up study approximately 1.5 years after the initial study. They all had recent experience with the software and had worked with the new instruction while preparing for the study.
All participants were proficient in the English language. Because version 4.0 of the instruction was partially and version 5.5 was fully written in English, English proficiency was a prerequisite for participating in the follow-up study.
6.2.2 ToolsEye trackerObservation of the data evaluation task was carried out with the use of the eye-tracking methodology. The aim of tracking the participants’ points of gaze was to capture the way that the instruction was used during the completion of the NDT task and to identify errors in the task and in the interpretation of the instruction. Such data could not be identified solely from the collected results, i.e. detected indications.
The eye-tracking method reflects invisible infrared light onto the eye, records the reflection pattern with a sensor system, and then calculates the exact point of gaze. Once the point of gaze is determined, it can be visualised and displayed on a computer monitor (Holmqvist et al. 2011).
Although there are several types of eye trackers on the market, the most frequently used eye tracker in HCI is a computer monitor with integrated infrared cameras, which allow remote and unobtrusive eye tracking in the user’s natural environment (Figure 6-2). Whereas the hardware provides the raw data of eye fixations on a certain dimension in space at a given time, the specifically designed software is used to transform the data into fixations and to visualise them, if needed.
In the current study, the data were collected with the Tobii T60XL eye tracker, and the Tobii Studio version 2.3.0 software was used. By activating the screen recording mode, the Tobii Studio software was used to design the study and to record all eye and mouse movements over the screen. It was also used for the retrospective think-aloud (RTA), during which the participants were presented with the recording of their eye movements and asked to explain their thoughts while carrying out specific tasks in the evaluation of the data. The collection of data was observed by the experimenter via live viewer on a remote desktop, as shown in Figure 6-3, and by a UT expert, who recorded notes on the execution of the evaluation task.
Figure 6‑2. Tobii T60XL eye tracker.

28 SKB R-14-06
RTAIn the RTA, the participants were presented with a replay of parts of the data evaluation task together with their eye movements. This procedure was expected to cue the participants’ memories of their thoughts during the task (Holmqvist et al. 2011). Users’ verbalisation of thoughts allows usability engineers to understand and identify major usability problems. Nielsen (1993), for example, claims that think-aloud methods, such as the RTA, “may be the single most valuable usability engineering method” (p 195). Hyrskykari et al. (2008) suggest that supplementing eye tracking with RTA can aid in producing information that cannot be obtained solely by observation, the analysis of eye tracking data, or interviews.
The purpose of this method was to gather information about the causes of errors and the mental models of the participants during the completion of the data evaluation task. The RTA was conducted as a structured interview, with a series of questions on topics of interest and a focus on single items in the evaluation rather than on the entire task. Carrying out the RTA for the entire task was deemed to be overly time consuming, tiring for the participant, and not useful.
The RTA in Study 1 consisted of 14 questions (11 task-related and 5 general questions), whereas the RTA in Study 2 consisted of 11 questions (6 task-related and 5 general questions). The RTA questions differed in the two studies, which is why the number of questions differed. The questions resulted from the observations during the task and were related to specific problems that were encountered during each study. The task-related questions concerned the following topics:
• Tasks in the setup, e.g.– “Explain how you set the gates.”– “How did you set the position of the shallow u-gate based on the noise level?”
• Difficult parts of the data evaluation, e.g.– “Did you have any doubts/problems while searching for indications close to the channel walls?”– “Was it difficult to interpret the edge distance? What problems did you have?”
• Specific indications, e.g.– “Walk us through your thought process while evaluating this area. What do you see?
What are you doing?”
Figure 6‑3. A typical setup in an eye-tracking experiment. The participant sits in front of the monitor, and the experimenter observes on a remote desktop.

SKB R-14-06 29
Five additional general questions were asked in both studies. Specifically, the participants were asked about the use of the instruction, the difficulties that they encountered, their opinions about the quality of the instruction, and their opinions about aspects that were missing or could be improved in the instruction. The duration of the RTA was approximately 30 minutes per participant.
NDT instructionThe NDT instruction for the mechanised ultrasonic inspection of the cast iron insert, UT31, was evaluated during the study. This instruction covers the phased array ultrasonic inspection of the outer 210 mm of the insert from the envelope surface. The inspection is performed by rotating the insert and moving the ultrasonic phased array probe over the insert surface in the axial direction. The ultrasonic signal data are collected in increments of 2 mm. The inspector then evaluates the entire data set by using dedicated software and following the specific steps in the instruction.
Two NDT instructions were evaluated within the scope of this study:
• Study 1: The NDT instruction for the ultrasonic inspection of the cast iron insert, UT31, version 4.0 (hereafter referred to as “Instruction v4.0”).
• Study 2: The NDT instruction for the ultrasonic inspection of the cast iron insert, UT31, version 5.5 (hereafter referred to as “Instruction v5.5”).
An NDT instruction typically consists of general information (e.g. introduction, scope, component, personnel, equipment, inspection techniques, reference object, reporting level, reference documents), preparation of the equipment (e.g. component, rotator, reference object, probe fixture, UT equipment), sensitivity settings (in v4.0, called “calibration before”), inspection, sensitivity check (calibration after’), evaluation, and reporting. The current study focused on the evaluation part.
Instruction v4.0 was written in two languages, Swedish and English, whereas Instruction v.5.5 was written only in English.
Data evaluation software and hardwareThe data evaluation task was carried out on a standard notebook with 64-bit Windows using the Ultravision software (version 3.3B1 in the first study and version 3.4R5 in the second study).
QuestionnairesExperience and qualification questionnaire: To collect data on the participants’ age, education, experience, and qualifications, a 15-item questionnaire was created. The questionnaire was designed with Tobii Studio and implemented on a computer screen (for a list of the questions, see Appendix 1).
User satisfaction questionnaire: For the purposes of evaluating the participants’ satisfaction with the previous and the newly created versions and investigating whether the new instruction improved satisfaction, a user satisfaction questionnaire was created. In this questionnaire, which was designed for the purposes of the current study, the participants were asked to rate 27 different properties of the instruction on a scale from 1 (not satisfied) to 6 (very satisfied). The final question (No. 28) related to general satisfaction with the instruction. Additionally, the participants were asked if they would like the instruction to be further developed and in what manner (and to comment, if desired). The 28 items in this questionnaire were developed after creating the Instruction v5.5. The items relate to the main changes that were made during the development of the instruction. (For the full questionnaire, see Appendix 1.)
6.2.3 Task The task was to evaluate a set of ultrasonic data of the previously inspected cast iron insert (19 indications in the initial and 16 in the follow-up study) using the Ultravision software. Because the same participants took part in both studies, the evaluation task was similar but not identical. Thus, data from the same inspection but from a different inspected region of the component were used. Because this data set focused on finding the same type of indications, the difficulty level of the task was maintained at approximately the same level.
30 SKB R-14-06
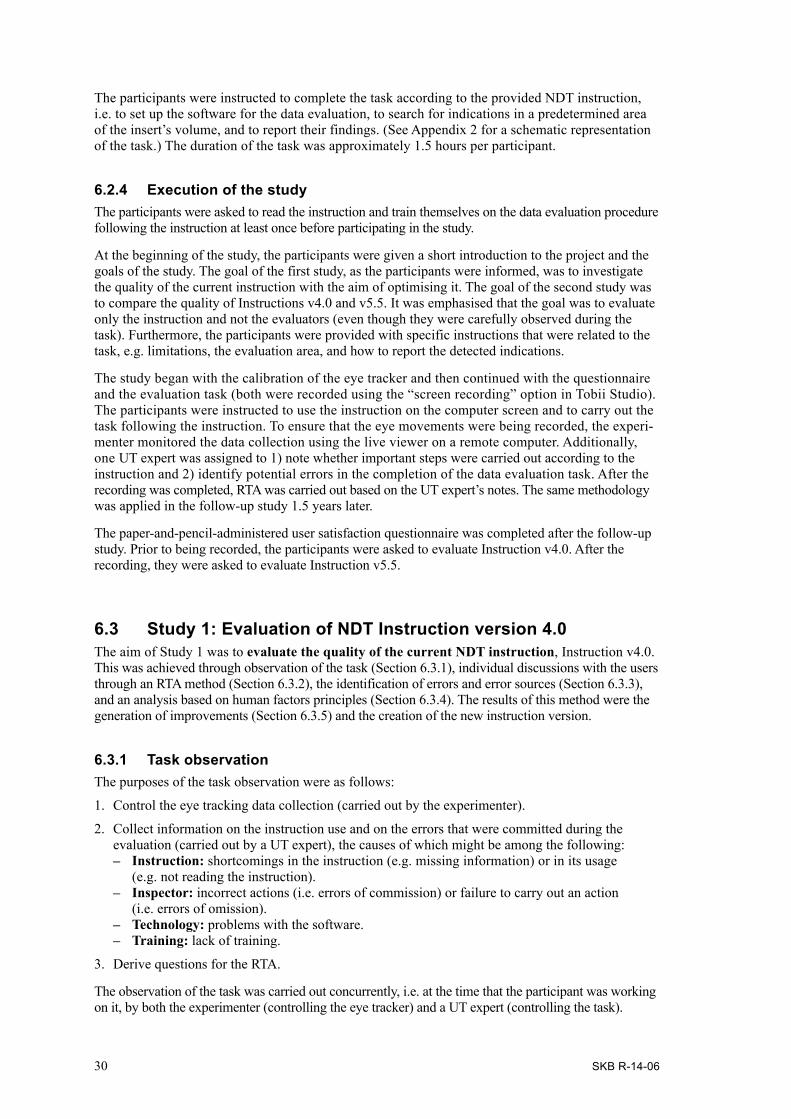
The participants were instructed to complete the task according to the provided NDT instruction, i.e. to set up the software for the data evaluation, to search for indications in a predetermined area of the insert’s volume, and to report their findings. (See Appendix 2 for a schematic representation of the task.) The duration of the task was approximately 1.5 hours per participant.
6.2.4 Execution of the studyThe participants were asked to read the instruction and train themselves on the data evaluation procedure following the instruction at least once before participating in the study.
At the beginning of the study, the participants were given a short introduction to the project and the goals of the study. The goal of the first study, as the participants were informed, was to investigate the quality of the current instruction with the aim of optimising it. The goal of the second study was to compare the quality of Instructions v4.0 and v5.5. It was emphasised that the goal was to evaluate only the instruction and not the evaluators (even though they were carefully observed during the task). Furthermore, the participants were provided with specific instructions that were related to the task, e.g. limitations, the evaluation area, and how to report the detected indications.
The study began with the calibration of the eye tracker and then continued with the questionnaire and the evaluation task (both were recorded using the “screen recording” option in Tobii Studio). The participants were instructed to use the instruction on the computer screen and to carry out the task following the instruction. To ensure that the eye movements were being recorded, the experi-menter monitored the data collection using the live viewer on a remote computer. Additionally, one UT expert was assigned to 1) note whether important steps were carried out according to the instruction and 2) identify potential errors in the completion of the data evaluation task. After the recording was completed, RTA was carried out based on the UT expert’s notes. The same methodology was applied in the follow-up study 1.5 years later.
The paper-and-pencil-administered user satisfaction questionnaire was completed after the follow-up study. Prior to being recorded, the participants were asked to evaluate Instruction v4.0. After the recording, they were asked to evaluate Instruction v5.5.
6.3 Study 1: Evaluation of NDT Instruction version 4.0The aim of Study 1 was to evaluate the quality of the current NDT instruction, Instruction v4.0. This was achieved through observation of the task (Section 6.3.1), individual discussions with the users through an RTA method (Section 6.3.2), the identification of errors and error sources (Section 6.3.3), and an analysis based on human factors principles (Section 6.3.4). The results of this method were the generation of improvements (Section 6.3.5) and the creation of the new instruction version.
6.3.1 Task observationThe purposes of the task observation were as follows:
1. Control the eye tracking data collection (carried out by the experimenter).
2. Collect information on the instruction use and on the errors that were committed during the evaluation (carried out by a UT expert), the causes of which might be among the following:– Instruction: shortcomings in the instruction (e.g. missing information) or in its usage
(e.g. not reading the instruction).– Inspector: incorrect actions (i.e. errors of commission) or failure to carry out an action
(i.e. errors of omission).– Technology: problems with the software.– Training: lack of training.
3. Derive questions for the RTA.
The observation of the task was carried out concurrently, i.e. at the time that the participant was working on it, by both the experimenter (controlling the eye tracker) and a UT expert (controlling the task).

SKB R-14-06 31
The participants varied in their use of the instruction and did not consistently follow it. The largest variation in instruction use was observed between the instruction writer (who seldom used the instruction) and one of the participants, which was not directly involved in the instruction develop-ment (who frequently used the instruction). This frequent use of the instruction by the participant was reflected in the correct adherence to the requirements that were written in the instruction. In con-trast, the instruction writer adhered the least. As he later stated during the RTA: “I thought I knew the instruction well, but I forgot to do some things”. During the discussion concerning his performance, the participant concluded that he would consult the instruction more diligently in the future.
Overall, the more experience that the participants had with the instruction, the less they followed it. This raises the question of whether experience with the instruction leads to overconfidence and, consequently, to an inappropriate use of the instruction. As expected, the less experienced participants consulted the instruction more frequently.
6.3.2 Discussion with the user (RTA)The aim of the individual discussions was to consult the users about how they used the instruction, how it could be improved, and how to increase their satisfaction with it. Moreover, the aim was to understand how the participants used the instruction and how this related to their performance in the data evaluation task.
All of the individual interviews were recorded with Tobii Studio in the RTA mode (screen recording + eye movements (from the initial study) + the verbalisations) and then transcribed (the complete transcripts of the conducted interviews remained confidential).
The majority of the collected information was related to the specific instruction or the evaluation of single indications. However, several of the identified problems with the instruction can be generalised (see Table 6-1).
The participants’ opinions about the need for improvement in the instruction were divided. Whereas two participants reported that it was well written, the other two, who participated in creating the instruction, reported that the instruction needed to be improved. The latter two participants became aware of the instruction’s shortcomings through performing the task while following the instruction, whereas they had been unaware of such shortcomings after writing or merely reading the instruction. All agreed that the instructions should be reviewed through action, not solely reading, in the future.
Table 6-1. Identified generalisable problems and suggestions for improvement.
Problem Example/explanation Suggestions for improvement
Information in the instruction is missing or unclear
Missing examples of special cases that deviate from the ordinary; lack of supporting images; lack of information on how to carry out the task
Clarify special cases with examples.Add images of defect indications to aid in detection and evaluation.Rewrite parts of the instruction to improve understanding.
Instruction relies on the user’s memory
The user is expected to remember to return to the original settings or perform mental arithmetic.
Introduce warnings. Avoid mental arithmetic – offer exact values.
Instruction is suitable only for experienced users
Previous experience with the data evaluation, the software, and the instruction determines how the instruction is used (together with personal preferences and personal beliefs that the task should be conducted differently1). Thus, the users are unequally experienced.
Include more details for less-experienced users.
1 The procedure for how to carry out the task remains under development. Some of the current participants are directly involved in this development.

32 SKB R-14-06
6.3.3 Identification of errors and error sources The next step in the evaluation of the quality of the instruction was to identify errors in the evaluation task that resulted from the shortcomings of the NDT instruction. The errors were analysed with respect to the error type (e.g. missing defect, sizing error) and the potential error source (e.g. instruction, inspector, software). The information on the error sources was based on the RTA.
The first step in the data analysis was to determine the most safety-relevant errors, i.e. the number of undetected indications (Figure 6-4) and sizing errors (Figure 6-5). Because the plan was to compare these data with those of the follow-up study, in which the number of evaluated indications differed, the results are shown as percentages (in terms of the number of committed errors in relation to the total number of analysed indications).
Figure 6‑5. The percentage of sizing errors per participant when working with the NDT Instruction v4.0.
Figure 6‑4. The percentage of missed indications per participant when working with the NDT Instruction v4.0.
0
2
4
6
8
10
12
14
16
18
20
x1 x2 x3 x4
perc
enta
ge o
f mis
sed
indi
catio
ns
participant
0
2
4
6
8
10
x1 x2 x3 x4
perc
enta
ge o
f siz
ing
erro
rs
participant

SKB R-14-06 33
According to the results, 7–18% of the indications were not detected by the participants. Of the detected indications, 6–8% were incorrectly sized; one participant made no sizing errors.
In addition to missing indications and making sizing errors, the following errors that were related to the instruction content were identified:
• Errors of commission (incorrect actions):– Incorrectly interpreting values from the edge distance measurements.– Incorrectly setting the gates in the axial direction in the edge distance measurements.– Incorrectly identifying clusters.– Incorrectly setting the contour around the indication.– Incorrectly interpreting indications near the channels.– Incorrectly interpreting indications outside the gate.– Incorrectly setting the gates during the evaluation of defects.– Using incorrect gain settings (due to the lack of an agreement about how to round values).– Using the wrong zoom.– Reading incorrect values (size vs. amplitude).
• Errors of omission (failure to act):– Not using other views (e.g. the D-scan).– Forgetting to reset the gate settings.– Forgetting to reset the gain settings.– Not including the whole indication (outside the gate).– Not waiting for the contour values to refresh.
The goal of this analysis was not only to identify potential errors in the completion of the task but also to identify potential error sources to avoid them in the future. Therefore, each of the listed errors was assigned to one or more of the following potential error sources: a) the instruction, b) the inspector, c) the training, and d) the technology (software). This categorisation was achieved based on the answers that were provided during the RTA and on the UT expert’s evaluation.
Figure 6-6 shows the frequency of errors according to the error source. (Note that more than one error source was assigned to each error.) As shown in this figure, the inspector and the instruction were the most frequently identified error sources.
Considering the errors committed and their sources, a number of suggestions to improve the instruction, to tailor the training, and to improve the software were made. (For a full list of identified errors, error sources, and preventive measures, see Appendix 3.)
Figure 6‑6. Frequency of errors according to the error source (NDT instruction v4.0).
9
10
6
1
InstructionInspectorTrainingTechnology
34 SKB R-14-06
Following the analysis of errors, those data that were collected with the eye tracker were qualitatively analysed. A detailed quantitative analysis was not possible due to the difficulty in interpreting the data of a task that is broad and long (approximately 1.5 h per participant). However, some insights could be achieved either through observation of the eye movements during the task or through visualisation of the participants’ fixations.
For example, eye tracking provided insights into the problematic areas in the instructions, i.e. the areas with which the participants experienced the greatest struggle, as determined by the participants’ extended reading times or frequent returns to the same areas. Furthermore, the areas that the partici‑pants did not read were easily identified. In general, this analysis allowed us to gain insight into how the participants used the instruction during the task and which problems they encountered.
Figure 6‑7 shows an example of how the analysis of participants’ fixations – i.e. points of gaze – can aid in identifying difficulties in instruction comprehension. The distribution of the fixations over the screen or their duration can provide information about various aspects of the tested product. For example, more overall fixations indicate a less efficient search (Goldberg and Kotval 1999), indicating that the information either is not in the expected location or cannot be easily found or understood. By contrast, fixations that are concentrated on a small area indicate a focused and efficient search (Cowen et al. 2002). According to Just and Carpenter (1976), longer fixation durations generally indicate difficulty in extracting information and, in the current case, may indicate problems in understanding how to carry out the task.
The example in Figure 6‑7 shows two participants with different behaviours in search of information to aid them in carrying out the same task. One participant was scattered (left), and the other was more focused (right). The RTA revealed that the participants struggled with the task because the information in the instruction was unclear and did not offer the participant clues about how to address exceptional cases, such as the presented case. This led to the conclusions that the instruction must be supplemented with additional images for exceptional cases and that the software must be redesigned (i.e. that the presentation of information did not correspond to the participants’ expectations).
Figure 6-7. Heat maps showing the fixation count (red areas indicate higher fixation count) of a participant with a scattered search pattern (i.e. who is struggling with the task and not understanding how to carry it out; left) in contrast to a participant engaging in a targeted search (right).

SKB R-14-06 35
6.3.4 Analysis of the NDT instruction following human factors principlesA human factors expert reviewed the instruction with respect to the following categories (with a detailed analysis available as an internal SKB document):
• Consistency – consistency in language, steps, terms, highlighting, etc.
• Terminology – use of foreign terms or terms that are unfamiliar to the entire NDT community, etc.
• Language – passive vs. active voice, ambiguity, clarity, use of negation, etc.
• Understanding – unclear language, incorrect use of English language, information not conveyed in a logical manner or order, etc.
• Highlighting information – consistency in highlighting; use of bold, italics, and underline; use of quotation marks; etc.
In this analysis, the recommendations from the PANI (Table 6-3) were followed. The results included a number of identified problems with respect to the above-mentioned categories and suggestions for improvement. This analysis refers only to the evaluated instruction and thus cannot be generalised to other instructions. However, the categories can be used as a guideline for general instruction writing.
6.3.5 Generation of improvementsThe instruction improvements were generated by taking the following into consideration:
a) Identified errors and causes of errors during the study.
b) Results of the individual discussions.
c) Suggestions from the human factors point of view.
d) Suggestions from the literature, namely, the PANI project (McGrath 2008).
Table 6-2 summarises the most relevant conclusions from steps a to c, for which the instruction was the main error source.
Suggestions from the PANI project included improvements to the length and structure, the content and presentation of information, the procedural steps, the procedure format, and record keeping, as well as general guidelines for procedure writing in terms of language (McGrath 2008, pp 30–35). These suggestions are listed in Table 6-3 and were followed in the creation of the new instruction (step d).
Table 6-2. Identified problems and suggested improvements based on the analysis of the instruction.
Step in the analysis Identified problems Suggested change
Identified errors and causes of errors during the study (see Appendix 3)
Information missing Add missing informationInformation unclear Clarify informationInformation not highlighted Highlight informationPoor definitions of terms Clarify and add the definitionsUnclear how to proceed Clarify the steps
Results of the individual discussions
Information missing Clarify the special casesInsufficient level of detail Include more detailsFigures missing Add images of defect indicationsUnclear how to proceed Rewrite parts in a logical sequence
Suggestions from the human factors point of view
Inconsistency (in language, steps, terms, highlighting, etc.)
Increase consistency
Terminology not well defined Clarify the definitions of termsUnclear language (e.g. ambiguity, frequent use of passive voice, use of negation)
Reduce ambiguity, avoid the use of passive voice, and avoid the use of negatives
Information not understood Clarify the steps and the order of stepsInformation not highlighted Highlight information
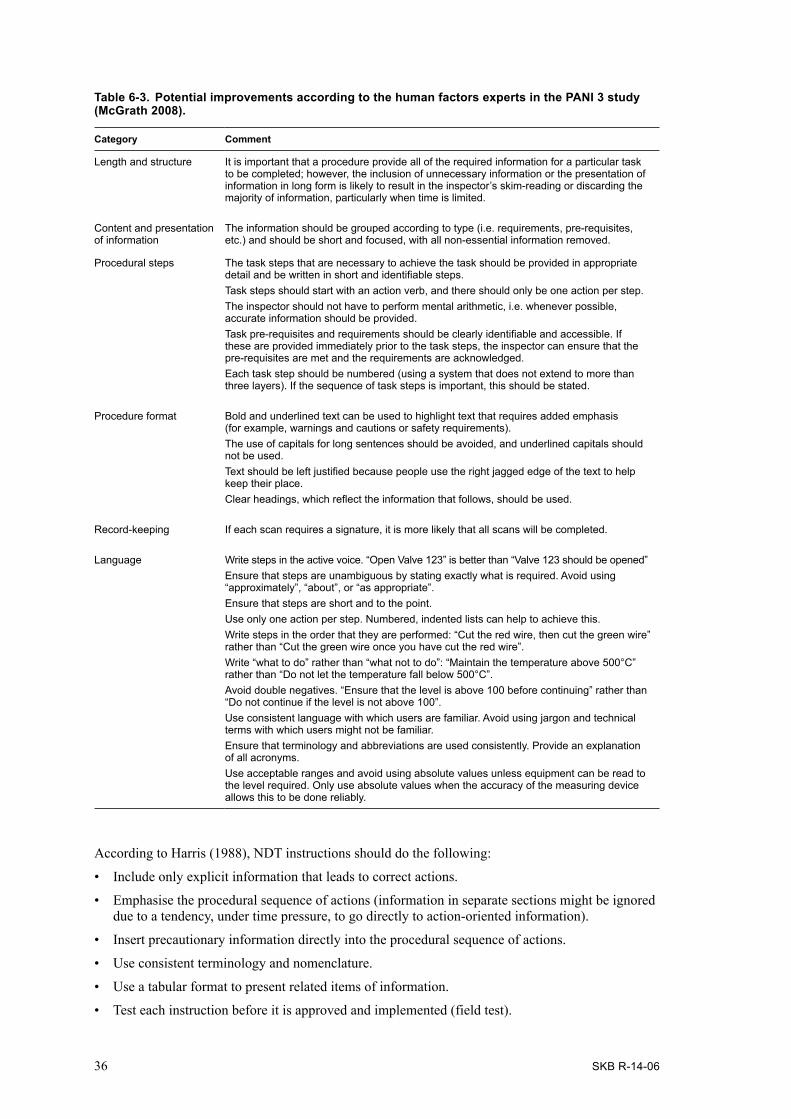
36 SKB R-14-06
Table 6-3. Potential improvements according to the human factors experts in the PANI 3 study (McGrath 2008).
Category Comment
Length and structure It is important that a procedure provide all of the required information for a particular task to be completed; however, the inclusion of unnecessary information or the presentation of information in long form is likely to result in the inspector’s skim-reading or discarding the majority of information, particularly when time is limited.
Content and presentation of information
The information should be grouped according to type (i.e. requirements, pre-requisites, etc.) and should be short and focused, with all non-essential information removed.
Procedural steps The task steps that are necessary to achieve the task should be provided in appropriate detail and be written in short and identifiable steps. Task steps should start with an action verb, and there should only be one action per step. The inspector should not have to perform mental arithmetic, i.e. whenever possible, accurate information should be provided.Task pre-requisites and requirements should be clearly identifiable and accessible. If these are provided immediately prior to the task steps, the inspector can ensure that the pre-requisites are met and the requirements are acknowledged.Each task step should be numbered (using a system that does not extend to more than three layers). If the sequence of task steps is important, this should be stated.
Procedure format Bold and underlined text can be used to highlight text that requires added emphasis (for example, warnings and cautions or safety requirements). The use of capitals for long sentences should be avoided, and underlined capitals should not be used. Text should be left justified because people use the right jagged edge of the text to help keep their place. Clear headings, which reflect the information that follows, should be used.
Record-keeping If each scan requires a signature, it is more likely that all scans will be completed.
Language Write steps in the active voice. “Open Valve 123” is better than “Valve 123 should be opened”Ensure that steps are unambiguous by stating exactly what is required. Avoid using “approximately”, “about”, or “as appropriate”.Ensure that steps are short and to the point.Use only one action per step. Numbered, indented lists can help to achieve this. Write steps in the order that they are performed: “Cut the red wire, then cut the green wire” rather than “Cut the green wire once you have cut the red wire”.Write “what to do” rather than “what not to do”: “Maintain the temperature above 500°C” rather than “Do not let the temperature fall below 500°C”.Avoid double negatives. “Ensure that the level is above 100 before continuing” rather than “Do not continue if the level is not above 100”.Use consistent language with which users are familiar. Avoid using jargon and technical terms with which users might not be familiar.Ensure that terminology and abbreviations are used consistently. Provide an explanation of all acronyms.Use acceptable ranges and avoid using absolute values unless equipment can be read to the level required. Only use absolute values when the accuracy of the measuring device allows this to be done reliably.
According to Harris (1988), NDT instructions should do the following:
• Include only explicit information that leads to correct actions.
• Emphasise the procedural sequence of actions (information in separate sections might be ignored due to a tendency, under time pressure, to go directly to action-oriented information).
• Insert precautionary information directly into the procedural sequence of actions.
• Use consistent terminology and nomenclature.
• Use a tabular format to present related items of information.
• Test each instruction before it is approved and implemented (field test).

SKB R-14-06 37
The combined findings from the eye tracking study and the theoretical considerations led to the creation of a new instruction. The recommendations for the improvement were related to the instruction content, instruction layout, presentation of information, highlighting, and writing style.
The main changes can be summarised as follows:
• Instruction layout and navigation: Rather than using a printed document, together with a computer-administered check list, the instruction is now completely created and intended for use in Microsoft Excel. The aim of this change was to reduce the complexity of use. The Excel document is organised into sheets, each of which represents a separate chapter. Furthermore, a table of contents and chapter subtitles were added. These changes were incorporated to promote easier and faster navigation through the instruction.
• Language: Instruction v4.0 was written in both the English and Swedish languages, whereas Instruction v5.5 was written only in English. During the first study, the participants, who were all Swedish, read only the Swedish part of the instruction. However, despite the advantages for the Swedish users, the dual-language instruction increased the number of pages, increased the complexity of navigating through the instruction, and raised the question of the quality of the English translation. The participants who were involved in writing the instruction stated that it was easier to write the document in English than to translate it, as was done in v4.0. They also reported that the English translation was of poorer quality than the original Swedish writing. This raises the issue of the quality of the translation, i.e. there is a risk that the translation does not convey exactly the same information as the original. English instructions are common practice in NDT due to the fluctuation of the working force from other countries. In addition, the final NDT instruction that will be used in the future will most likely be in English. Thus, the new instruction version was written only in English.
• Presentation of information: Instruction v4.0 was written in a narrative manner. From the human factors perspective, if a task is stepwise in nature (first “do this”; then, “do that”), it should be written in that manner and numbered. It is more difficult and requires more effort to search for the next step in an instruction that is written in a narrative manner than in an instruction in which the steps are clearly numbered. Thus, all actions were written in a stepwise manner with each step conveying only one action (the “one action per step” rule). Actions may be overlooked and skipped when multiple actions are included in one step. See Figure 6-8 for examples of the narrative and stepwise manner of information presentation. In addition, subtitles were added to visually distinguish different chunks of information, e.g. the setup, the detection, and the evaluation.
• Highlighting of information: Information that conveyed warnings, exceptions, or important notices was clearly highlighted and separated from the remainder of the text in the form of notes (Figure 6-9). In addition, information that should be easily accessible to the evaluator, such as reporting levels or amplitude gain, was emphasised with the use of bold text so that it could easily be found. Consistent formatting (e.g. number values such as the amplitude gain in bold, notes in italic) was employed to distinguish such information from the text, i.e. to make it easier to find and less likely to be overlooked.
• Writing style: The consistency in writing was increased. The reporting levels are situated at the beginning of each chapter and bulleted (rather than numbered) to signal equal importance (as opposed to numbering, which indicates order). Similar chapters, such as data evaluation at different depths, were written in a similar manner and in the same order, when possible. The instruction was written in the active voice as opposed to the passive voice. This change was made to clearly indicate who was to perform the task. The passive voice – e.g. this “should be done” – may lead to a misunderstanding of who is supposed to perform the task. Other changes in writing included the avoidance of unambiguous terms and negatives and the clarification of terminology.
The complete list of changes is presented in Table 6-4 (instruction format) and Table 6-5 (instruction content).

38 SKB R-14-06
Figure 6‑8. Examples of the narrative (left: Instruction v4.0) and stepwise (right; Instruction v5.5) man-ners of presenting information.
Use the layout “Analysis 45-110 mm”. Enter “SoftGain” according to the evaluation table. Set the gate in the axial direction to 150 mm from the start and evaluate in segments of maximum 60°. Search for indications in the B-scan. For PWR inserts the scan data shall be evaluated in the depth interval 45-11 mm, se figure 7 and 8. For PWR inserts, the same depth intervals shall be evaluated except for the volume between the channel tube. There the evaluation shall be done down to 105 mm depth, se figure 7.
1. Choose the layout “Analysis 45-110 mm.2. Adjus the soft gain to 24,5 dB3. Gate an interval on the axial axis (green) of maximum 150 mm.4. Zoom on the circumferential axis (blue) to an interval of maximum 60°.5. Search for indications in the B-scan, se figure 6-8 and figure 6-9.6. Scroll through the entire circumference and search for indications in the B-scan.7. Repeat step 3-6 for the rest of the scanned data in axial segments of 15 mm.
Note: The inserts shall be evaluated in the depth interval 45-110 mm, se figure 6-8.The exceptions is the volume between the channels in the BWR insert that shall beevaluated in the depth interval 45-105 mm, se figure 6-9.
Figure 6‑9. Examples of the presentation of notes: notes as a part of the text (left; Instruction v4.0) versus notes distinguished in space and format, in italics (right; Instruction v5.5).
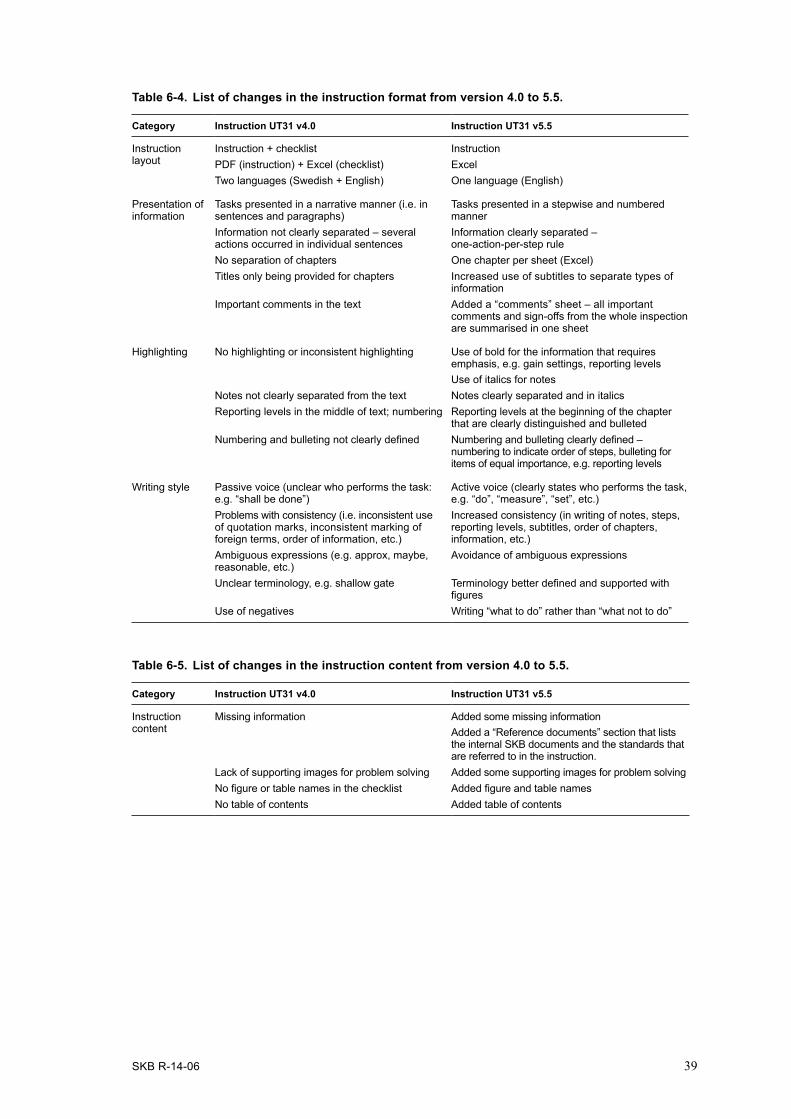
SKB R-14-06 39
Table 6-4. List of changes in the instruction format from version 4.0 to 5.5.
Category Instruction UT31 v4.0 Instruction UT31 v5.5
Instruction layout
Instruction + checklist Instruction PDF (instruction) + Excel (checklist) Excel Two languages (Swedish + English) One language (English)
Presentation of information
Tasks presented in a narrative manner (i.e. in sentences and paragraphs)
Tasks presented in a stepwise and numbered manner
Information not clearly separated – several actions occurred in individual sentences
Information clearly separated – one-action-per-step rule
No separation of chapters One chapter per sheet (Excel)Titles only being provided for chapters Increased use of subtitles to separate types of
informationImportant comments in the text Added a “comments” sheet – all important
comments and sign-offs from the whole inspection are summarised in one sheet
Highlighting No highlighting or inconsistent highlighting Use of bold for the information that requires emphasis, e.g. gain settings, reporting levelsUse of italics for notes
Notes not clearly separated from the text Notes clearly separated and in italicsReporting levels in the middle of text; numbering Reporting levels at the beginning of the chapter
that are clearly distinguished and bulletedNumbering and bulleting not clearly defined Numbering and bulleting clearly defined –
numbering to indicate order of steps, bulleting for items of equal importance, e.g. reporting levels
Writing style Passive voice (unclear who performs the task: e.g. “shall be done”)
Active voice (clearly states who performs the task, e.g. “do”, “measure”, “set”, etc.)
Problems with consistency (i.e. inconsistent use of quotation marks, inconsistent marking of foreign terms, order of information, etc.)
Increased consistency (in writing of notes, steps, reporting levels, subtitles, order of chapters, information, etc.)
Ambiguous expressions (e.g. approx, maybe, reasonable, etc.)
Avoidance of ambiguous expressions
Unclear terminology, e.g. shallow gate Terminology better defined and supported with figures
Use of negatives Writing “what to do” rather than “what not to do”
Table 6-5. List of changes in the instruction content from version 4.0 to 5.5.
Category Instruction UT31 v4.0 Instruction UT31 v5.5
Instruction content
Missing information Added some missing information Added a “Reference documents” section that lists the internal SKB documents and the standards that are referred to in the instruction.
Lack of supporting images for problem solving Added some supporting images for problem solving No figure or table names in the checklist Added figure and table namesNo table of contents Added table of contents

40 SKB R-14-06
6.4 Study 2 (follow-up): Evaluation of the NDT Instruction version 5.5
Whereas the aim of Study 1 was to evaluate the quality of the existing NDT instruction and determine how to improve it, the aim of Study 2 was to determine whether the instruction was improved. An additional aim was to further develop and improve the instruction.
In the follow-up study, the methodology described in Section 6.2 was used. Four participants were seated in front of the eye tracker and were asked to evaluate a set of data according to the new Instruction v5.5. To avoid the effect of memory, the evaluated data differed. However, the difficulty remained approximately the same. During the execution of the task, the participants were recorded with an eye tracker, and their performances were observed. After the data evaluation task was completed, the participants completed the user satisfaction questionnaire and participated in the RTA protocol.
The results are presented in separate sections, from observation to generation of improvements (Sections 6.4.1–6.4.5).
6.4.1 Task observationThe task observation demonstrated that the participants used the instruction more often than they did in the first study. This behaviour resulted in higher compliance with the instruction requirements, e.g. the settings, such as the gate, gain and zoom settings, were carried out more accurately after the instruction was consulted. This change in behaviour was likely due to the learning effect. Specifically, after the first study, the participants learned that some of the errors that they committed resulted from a lack of consulting the instruction.
6.4.2 Discussion with the user (RTA)During the RTA, the participants identified the following preferred characteristics of the new instruction:
• Easier to use.
• Easier to follow.
• More logical.
• Divided into more sections.
• Less text.
• Stepwise actions rather than descriptive actions.
• Sentences better separated.
• Numbering.
• Bulleting.
The following factors were identified as contributors to instruction use:
• Past experience (with the instruction, software, task).
• When encountering problems.
• After a long pause.
• When lacking training.
• When checking whether the decision was correct.
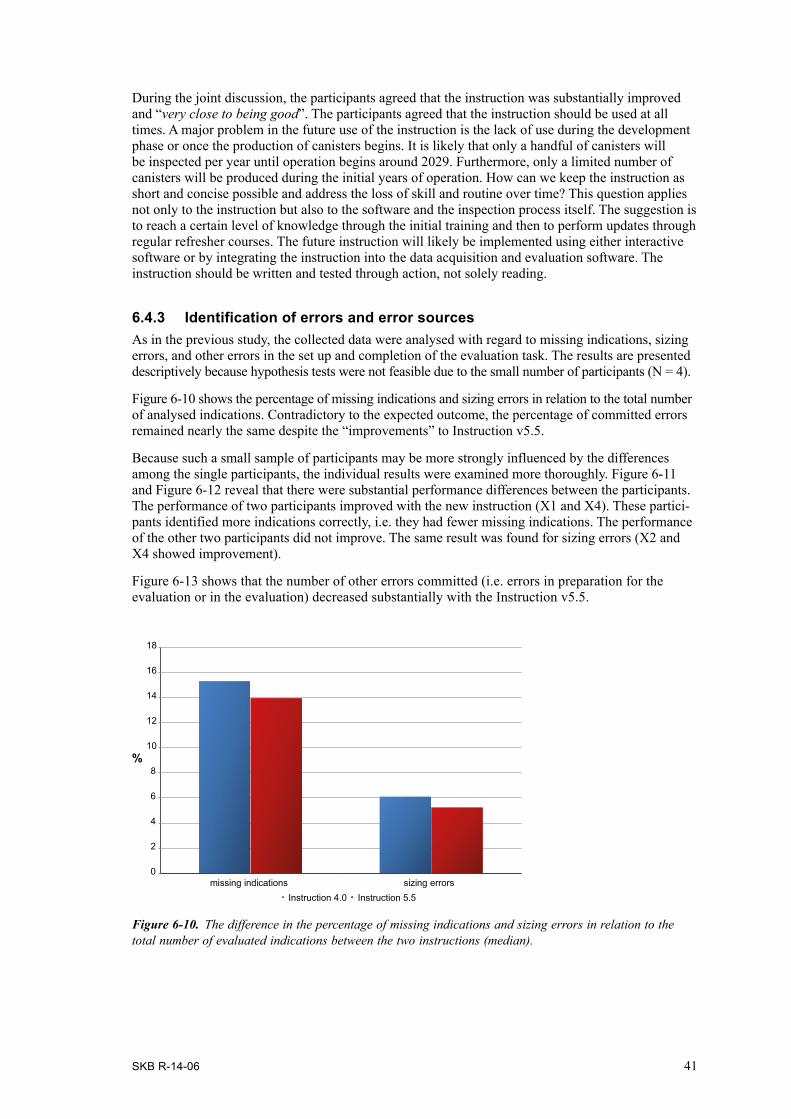
SKB R-14-06 41
During the joint discussion, the participants agreed that the instruction was substantially improved and “very close to being good”. The participants agreed that the instruction should be used at all times. A major problem in the future use of the instruction is the lack of use during the development phase or once the production of canisters begins. It is likely that only a handful of canisters will be inspected per year until operation begins around 2029. Furthermore, only a limited number of canisters will be produced during the initial years of operation. How can we keep the instruction as short and concise possible and address the loss of skill and routine over time? This question applies not only to the instruction but also to the software and the inspection process itself. The suggestion is to reach a certain level of knowledge through the initial training and then to perform updates through regular refresher courses. The future instruction will likely be implemented using either interactive software or by integrating the instruction into the data acquisition and evaluation software. The instruction should be written and tested through action, not solely reading.
6.4.3 Identification of errors and error sources As in the previous study, the collected data were analysed with regard to missing indications, sizing errors, and other errors in the set up and completion of the evaluation task. The results are presented descriptively because hypothesis tests were not feasible due to the small number of participants (N = 4).
Figure 6-10 shows the percentage of missing indications and sizing errors in relation to the total number of analysed indications. Contradictory to the expected outcome, the percentage of committed errors remained nearly the same despite the “improvements” to Instruction v5.5.
Because such a small sample of participants may be more strongly influenced by the differences among the single participants, the individual results were examined more thoroughly. Figure 6-11 and Figure 6-12 reveal that there were substantial performance differences between the participants. The performance of two participants improved with the new instruction (X1 and X4). These partici-pants identified more indications correctly, i.e. they had fewer missing indications. The performance of the other two participants did not improve. The same result was found for sizing errors (X2 and X4 showed improvement).
Figure 6-13 shows that the number of other errors committed (i.e. errors in preparation for the evaluation or in the evaluation) decreased substantially with the Instruction v5.5.
Figure 6‑10. The difference in the percentage of missing indications and sizing errors in relation to the total number of evaluated indications between the two instructions (median).
0
2
4
6
8
10
12
14
16
18
missing indications sizing errors
%
Instruction 4.0 Instruction 5.5

42 SKB R-14-06
Figure 6‑12. Percentage of sizing errors using the two different instructions, according to participant.
Figure 6‑11. Percentage of missing indications using the two different instructions, according to participant.
0
5
10
15
20
25
30
35
4.0 5.5 4.0 5.5 4.0 5.5 4.0 5.5x1 x2 x3 x4
% o
f mis
sing
indi
catio
ns
0
2
4
6
8
10
12
14
4.0 5.5 4.0 5.5 4.0 5.5 4.0 5.5x1 x2 x3 x4
% o
f siz
ing
erro
rs
Figure 6‑13. The frequency of other errors committed.
0
2
4
6
8
10
12
14
16
18
Instruction v4.0 Instruction v5.5
erro
r fre
quen
cy

SKB R-14-06 43
As shown in Table 6-6, nearly half of the errors recurred, indicating that the instruction was not sufficiently improved. Considering the error type, most of the omission errors did not recur. This result indicates that some of the changes, such as introducing reminders in the form of “notes” into the instruction to decrease the load on memory, explaining special cases, and improving the software, led to fewer errors.
The speculated sources of the errors (Figure 6-14) were assigned to the instruction, inspector, training, or technology. (Note that, again, one error could be assigned to several error sources.) The greatest number of errors was assigned to the instruction and to the inspector; however, there was a noteworthy decrease in the error frequency with NDT Instruction v5.5. For a detailed list of errors, error sources, and the suggested preventive measures, see Appendix 3.
In conclusion, the analysis of errors that were committed showed only a slight improvement from working with NDT Instruction v4.0 compared to Instruction v5.5. The likely reason for such a large number of recurring errors is that the instruction content was not fully updated. After all, the major contributor to effective UT performance is the accuracy of the information in the instruction.
The reasons for the incomplete update of the instruction content were as follows:
• The final decisions about how the instruction should be updated had not yet been reached.
• There was no clear consensus between the instruction writer and the experimenting team concerning which changes were necessary.– The instruction writer placed greater effort into the change in formatting (time consumed
by Excel) and into language.
• It was generally assumed that the formatting changes alone would contribute to a more successful use of the instruction and that this study would eventually lead to even more improvement suggestions regarding the content.
Because the last item was not entirely the case, we concluded that the instruction format could lead to an improved performance only if the instruction contained all of the relevant information.
Table 6-6. List of errors according to the error recurrence and error type.
Error type Error recurrenceNo Yes
Errors of commission
Incorrectly setting the gates in the axial direction in the edge distance measurement Incorrectly identifying clusters Using incorrect gain settings (rounding up) Reading incorrect values (e.g. size vs. amplitude)
Incorrectly interpreting values from the edge distance measurementIncorrectly setting the contour around the indicationIncorrectly interpreting indications near the channels Incorrectly interpreting indications outside the gate Incorrectly setting the gates during the evaluation of defects Using the wrong zoom
Errors of omission
Forgetting to reset the gate settings Forgetting to reset the gain settings Not including the whole indication (outside the gate) Not waiting for the contour values to refresh
Not using other views (e.g. the D-scan)

44 SKB R-14-06
6.4.4 Analysis of the NDT instruction following the human factors principlesBecause the format of the new instruction differed from that of Instruction v4.0 (mainly insofar as the tasks were written in a stepwise rather than a narrative manner), a repeated analysis following the human factors principles was conducted. The instruction was again critically examined with respect to consistency, terminology, language, understanding, highlighting of information, and order of information, and minor suggestions for improvement were made.
Some general observations included the following:
• Microsoft Office Excel is useful because of the incorporated formulas, which provide the inspector with direct feedback on the entered information. Second, it is a platform in which data can be manually entered by the inspector. Furthermore, it can automatically provide a report sheet that contains all of the relevant information needed to report the inspection results. However, Excel is not the best platform for reading. This topic should be further discussed.
• The use of quotation marks for the names of files, layouts, words (such as “contour box” and “soft gain”, “results sheet”, “not ok”, “indication table”, “indication data sheet”, etc.) can create confusion. A method of emphasising these distinct types of information should be identified, taking into consideration the recommendations of PANI (McGrath 2008, p 32):– “The use of bold and underline text can be used to highlight text where added emphasis is
required (for example, warnings and cautions or safety requirements).”– “The use of capitals for long sentences should be avoided[,] and underlined capitals should
not be used.”
6.4.5 Generation of improvementsAs a result of the second study, additional changes were suggested, and a new version (“Instruction v6.0”) was issued. Table 6-7 (instruction format) and Table 6-8 (instruction content) show a summary of the major changes from Instruction v4.0 to Instruction v5.5 to the final Instruction v6.0. Most of the changes in the Instruction v6.0 related to the instruction content.
Figure 6‑14. The difference between the two instructions in the frequency of errors according to the error source.
0
2
4
6
8
10
12
Instruction Inspector Training Technology
erro
r fre
quen
cy
error cause
Instruction 4.0 Instruction 5.5
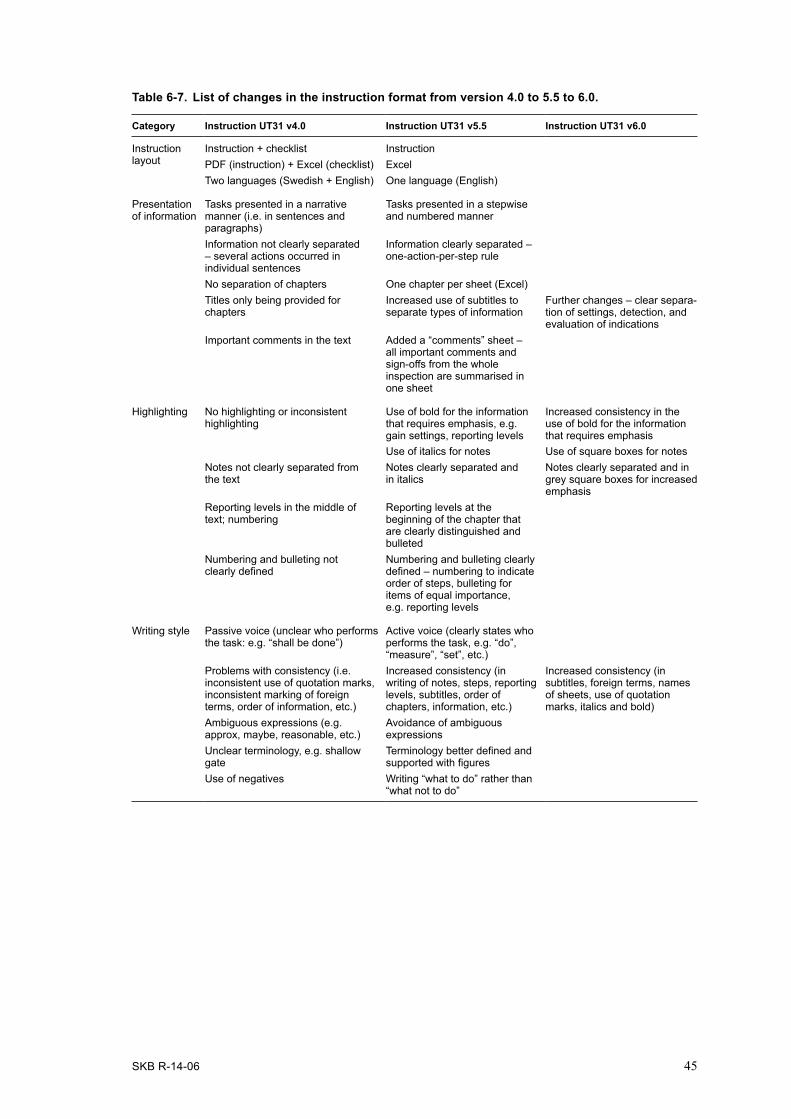
SKB R-14-06 45
Table 6-7. List of changes in the instruction format from version 4.0 to 5.5 to 6.0.
Category Instruction UT31 v4.0 Instruction UT31 v5.5 Instruction UT31 v6.0
Instruction layout
Instruction + checklist Instruction PDF (instruction) + Excel (checklist) Excel Two languages (Swedish + English) One language (English)
Presentation of information
Tasks presented in a narrative manner (i.e. in sentences and paragraphs)
Tasks presented in a stepwise and numbered manner
Information not clearly separated – several actions occurred in individual sentences
Information clearly separated – one-action-per-step rule
No separation of chapters One chapter per sheet (Excel)Titles only being provided for chapters
Increased use of subtitles to separate types of information
Further changes – clear separa-tion of settings, detection, and evaluation of indications
Important comments in the text Added a “comments” sheet – all important comments and sign-offs from the whole inspection are summarised in one sheet
Highlighting No highlighting or inconsistent highlighting
Use of bold for the information that requires emphasis, e.g. gain settings, reporting levelsUse of italics for notes
Increased consistency in the use of bold for the information that requires emphasis Use of square boxes for notes
Notes not clearly separated from the text
Notes clearly separated and in italics
Notes clearly separated and in grey square boxes for increased emphasis
Reporting levels in the middle of text; numbering
Reporting levels at the beginning of the chapter that are clearly distinguished and bulleted
Numbering and bulleting not clearly defined
Numbering and bulleting clearly defined – numbering to indicate order of steps, bulleting for items of equal importance, e.g. reporting levels
Writing style Passive voice (unclear who performs the task: e.g. “shall be done”)
Active voice (clearly states who performs the task, e.g. “do”, “measure”, “set”, etc.)
Problems with consistency (i.e. inconsistent use of quotation marks, inconsistent marking of foreign terms, order of information, etc.)
Increased consistency (in writing of notes, steps, reporting levels, subtitles, order of chapters, information, etc.)
Increased consistency (in subtitles, foreign terms, names of sheets, use of quotation marks, italics and bold)
Ambiguous expressions (e.g. approx, maybe, reasonable, etc.)
Avoidance of ambiguous expressions
Unclear terminology, e.g. shallow gate
Terminology better defined and supported with figures
Use of negatives Writing “what to do” rather than “what not to do”

46 SKB R-14-06
Table 6-8. List of changes in the instruction content from version 4.0 to 5.5 to 6.0.
Category Instruction UT31 v4.0 Instruction UT31 v5.5 Instruction UT31 v6.0
Instruction content
Missing information Added some missing information Added a “Reference documents” section that lists the internal SKB documents and the stand-ards that are referred to in the instruction
Instruction content fully updated, as a result of stud-ies 1 and 2Added more notesAdded an introduction to each chapter
Lack of supporting images for problem solving
Added some supporting images for problem solving
Added further supporting images for problem solving Added appendix “Example of indications” to the instruction
No figure and table names in the checklist
Added figure and table names Figure names no longer contain information that is relevant for the completion of the task
No table of contents Added a table of contents
Concerning the formatting properties, further efforts were invested into highlighting, particularly in terms of consistency in the writing and notes. The highlighted text was made even more distinctive by placing it into grey, square boxes, in addition to the use of italic font. Figure 6-15 shows how the highlighting of notes changed from the original Instruction v4.0 to Instruction v5.5 to Instruction v6.0.
Figure 6‑15. The evolution of presenting notes (in these illustrations, marked with an arrow): notes as a part of the text (up-left, Instruction v4.0); notes separated in space and format, i.e. italics (centre; Instruction v5.5,) and further emphasis of notes using grey, square boxes (down-right, Instruction v.6.0).

SKB R-14-06 47
6.5 User satisfactionFinally, the study participants were asked to evaluate their satisfaction with both instructions. In the case of Instruction v4.0, the participants were asked to rate the instruction and the checklist both separately and in combination. However, in the current study, only the results for the combination were taken into consideration and compared to the reported satisfaction with Instruction v5.5.
When examining all of the scores combined together, the participants reported higher satisfaction with the new instruction (Figure 6-16). However, of note, these results were based on scores from only 4 participants.
Figure 6-17 shows the median satisfaction scores on all individual items of the questionnaire. The participants reported higher satisfaction with Instruction v5.5 on the majority of the items and overall (the list item on the scale).
Figure 6‑16. Total satisfaction scores for all participants and both instructions [median].
0
1
2
3
4
5
instruction v4.0 instruction v5.5
satis
fact
ion
scor
e [m
edia
n]
Figure 6‑17. Participants’ satisfaction with single characteristics of the two instructions.
0 1 2 3 4 5 6Length
Amount of informationFiguresTables
NumberingBulletingFont size
Making good use of open spaceColour use
Page breaksLevel of detail
Quality of the informationInformation clarity
HeadersFigure namesTable names
Use of active/passive voiceSentence complexity
Meeting the needs of inexperienced usersSequence of information
User friendlinessInformation easy to find
Easy to readDistinction between steps
Highlighting of relevant informationOrganisation of chapters
Meeting your expectationsHow satisfied are you overall?
satisfaction score [median]
ques
tionn
aire
item
Instruction v4.0 Instruction v5.5

48 SKB R-14-06
Although no statistical tests were carried out, as shown, the difference was greater for some items (2 score points or more) than for other items (less than 1 score point or no difference). For the purposes of the current analysis, we investigated differences of a) ≥ 2 points and b) 1–2 points.
a) The largest improvement in satisfaction rating (with a difference of 2 points or more) in favour of Instruction v5.5 was observed for the following items: – Bulleting (used to indicate items of equal importance in no particular order – the opposite of
numbering, which illustrates items in a specific order).– Making good use of space.– Page breaks (in Instruction v5.5, the use of Excel and a separate sheet for each chapter
allowed easier navigation through the instruction, without necessary blanks).– Quality of the information.– Use of active vs. passive voice (in Instruction v5.5, the passive voice was avoided, indicating
clearly who performs an action or a task).– User friendliness.– Ease of reading.– Highlighting of relevant information, i.e. that which require emphasis (in Instruction v5.5,
such information is highlighted in bold or included as important notes).
b) The improvement of 1–2 points in user satisfaction, in favour of Instruction v5.5, was observed for the following items:– Amount of information.– Numbering (used to illustrate the order of steps that must be completed during the task).– Information clarity.– Sentence complexity (by presenting the information stepwise, the sentence complexity was
significantly reduced in Instruction v5.5).– Meeting the users’ expectations.– Distinguishing between steps (in Instruction v5.5, the steps are presented in a particular order,
with single actions separated into single steps).– Level of detail.– Organisation of chapters.– Table names.
A decrease in satisfaction–from Instruction v4.0 to Instruction v5.5 – was observed in colour use (1 point), font size, and figures (half a point), which contradicted the hypothesis. Because no major changes were carried out with respect to the use of colour and font (except unintentional changes, e.g. more colour might have been added with the addition of figures) and because more figures were added to the instruction (per the participants’ request), we assume that this difference stemmed from the effect that one result had on the median values. One participant reported difficulties with reading the instruction on the screen due to his near-sightedness and preferred to have the option to enlarge the font. Because the instruction was presented in a full-screen mode (for the purposes of achieving comparability for the eye tracking data), this option was not available. This problem resulted from the method that was applied in the current study. In the actual use of the instruction, either in Excel or as a printed document, this problem should not arise. In addition, the difference in the figures and font size was rather small (0.5 points with respect to the median). In line with all of the other items that exhibited differences of 0.5 or less, this difference was deemed unworthy of discussion.
This effect could also be due to the time between when the instruction was used and when the rating was made. The Instruction v4.0 satisfaction rating was carried out 1.5 years after the initial study and immediately before the second study. In contrast, the Instruction v5.5 satisfaction rating was carried out immediately after the data evaluation task. It is possible that satisfaction or dissatisfaction with a property of the instruction was amplified because the impressions were more salient immediately after the instruction was used.
In conclusion, based on the individual discussions with the participants and the user satisfaction ratings, the participants exhibited greater satisfaction with the new instruction, in terms of both content and formatting.

SKB R-14-06 49
6.6 Discussion The aim of these studies was to aid in the further development of the NDT instruction. The specific goals of the current studies were to evaluate the quality of the initial NDT instruction, to develop a method for investigating its quality, to provide suggestions for its improvement, and to verify the effect of these suggestions. This process resulted in a new NDT instruction with changes to its content and format.
In summary, some of the major changes to the instruction and the reasons for their implementation included the following:
• Layout: In terms of the instruction layout, “instruction” and “checklist” as two separate documents were merged into one instruction document. The aim of this change was to prevent the users from switching from one document to another and, thus, to reduce the complexity of use. This goal was achieved by converting the interface of the instruction from a word processing document into an Excel document. This change was made to profit from the statistics and programming that are offered by Excel, which allows the document to guide the inspectors during the task and permits its use as an automatic reporting sheet. This can be achieved by pre-programming the spreadsheet to extract all of the instruction information that is relevant to reporting (e.g. information about a component, preparation, calibration, and inspection). This method saves the inspector time and effort and prevents typing errors. The spreadsheets can also be pre-programmed to compare the data that the inspector types during his task with settings that are specified in the instruction. In this way, the inspectors are given direct feedback about whether a task is approved or, based on the sensitivity set by the individual calibrations, whether the required settings for the data evaluation can be calculated. When asked to comment on the new layout, the participants reacted positively. However, due to the use of the eye tracker and the possibility of comparing instruction pages to one another, the instruction was presented in a .pdf format. Thus, the participants had no actual experience with it. Excel formatting, as well as making the necessary changes, is a rather time-consuming process. Hence, Excel is viewed only as an interim solution in the development. It is likely that software with a more optimal user interface will be designed.
• Presentation of information: The tasks were written in a stepwise rather than a narrative manner to emphasise the procedural sequence of actions (i.e. information in separate sections might be ignored due to a tendency, under time pressure, to go directly to action-oriented information, as has been noted by Harris (1988)). When the tasks are numbered in a stepwise manner, the reader is instructed to follow the procedure in a specific order. All of the task steps should begin with an action verb (e.g. “do”, “measure”, “control”). Furthermore, to ensure that no actions are skipped, only one action should be listed per step (McGrath 2008, Trump and Stave 1988). All of the task steps in the new instructions were identified and numbered. The information that did not belong to the task steps was either described or bulleted (when the items were of equal importance and did not indicate an order, for example, the reporting levels).
• Highlighting of information: Highlighting information serves to emphasise it. For example, the use of bold text to emphasise values, such as reporting levels, causes the information to stand out. Consequently, retrieval of that information is faster and more efficient. Notes (containing excep-tions, warnings, or reminders, which are not a part of the task step) are also an important method of placing emphasis. Spiker (1997) found that the most prominent errors in following procedures are associated with failing to associate a warning statement with the task below it, failing to read critical information that is embedded in the note section, and failing to read the note section due to the presumption that it contains supplemental, rather than vital, information. Therefore, special attention must be given to how the notes convey the information as well as their location and clear distinction from the task steps. Kontogiannis (1999) suggests that borders and colours can be used to indicate the importance of notes and warnings and to capture the reader’s attention. Following this suggestion, the notes in the NDT instruction were placed in grey, square boxes.
• Writing style: If a procedure is confusing or inconsistent, the reader may find it difficult to under-stand and thus have a greater chance of making errors (Trump and Stave 1988). A number of studies have emphasised the importance of consistency (e.g. IAEA 1998). Therefore, substantial attention has been given to increasing the instruction’s consistency with regard to terminology, highlighting, the presentation of information, and writing in general. The frequent use of the passive voice, as observed in the initial instruction version, might lead to confusion concerning who should perform the task. Thus, the subsequent instruction versions were written in the active voice, especially in the case of the steps to be followed. Furthermore, each step began with a verb in the active voice.

50 SKB R-14-06
In general, the participants were very satisfied with the approach to the development of the instruction. Although both of the investigated instructions had been reviewed and approved, the act of carrying out the evaluation task by following the instruction led to the discovery of a number of ambiguities and problems of which the creators were unaware solely by reading the instruction. This led to the conclusion that the instruction should be reviewed through action, and not solely through reading. An additional advantage was the use of the RTA method. The think-aloud protocols, such as the RTA, are regarded as a particularly useful method during a product’s development, especially in its early stages (i.e. when many changes can be made) (Goldberg and Wichansky 2003, Nielsen 1993). The participants’ ability to view their eye movements while carrying out the task helped them to recall their thoughts. It also allowed them to express their problems and doubts and to gain some answers. The results of the RTA aided in identifying the sources of errors and potential preventive measures.
In addition to demonstrating the quality of the existing NDT procedures and instructions and how to apply the knowledge gained towards further development of the NDT instruction, the current studies introduced a new methodology into the NDT instruction’s development. The suggested method consisted of utilising eye tracking during the execution of the data evaluation task. The aim of this approach was to identify specific user-interface problems in the use of the NDT instruction. However, the analysis of the eye movement data (e.g. number of fixations, fixation duration, scan path) was not carried out to the fullest extent possible due to the complexity and the duration of the task (approxi-mately 1.5 h per participant). During long, non-directed tasks, it is difficult to assign eye-tracking data to a specific thought process. For example, if a participant focuses on one area frequently or for a long period of time in a directed short task, one might assume that this behaviour is due to the ambiguity of the task. When a task is long, it is difficult to determine whether such behaviour is due to the instruction or whether the person is “looking without seeing” and thinking about something other than the task. According to Jacob and Karn (2003), relating specific eye movement measures to specific cognitive processes is one of the challenges of using eye movements in usability testing. Although the eye tracking data were not thoroughly analysed in the current study, a number of problems were identified by observing and visualising the fixations. By combining this information with the users’ experiences while carrying out the task (collected in the form of a guided RTA), it was possible to identify specific usability issues and problems in the instruction.
To understand how inspectors employ the procedures in their actual working environment, one must combine various disciplines (e.g. human factors and cognitive ergonomics) with observational studies and empirical analyses (Kontogiannis 1999). By analysing the procedures and re-designing them according to a human factors perspective, the procedures might be optimised. As a consequence, the inspectors may show greater compliance with the procedure (Enkvist et al. 1999).
In conclusion, the current studies showed that although the existing instructions were written by qualified personnel, they required improvements. The instruction writer should consider not only the content itself but also how the content is conveyed (McGrath 2008, Herrin and Heuertz 1988). To meet this goal, the writer must consider the reader and his understanding of the written text. In the current studies, substantial attention was given to the information that was missing in the instruction. The next step is to identify whether the information is understandable to the user.
Although the instruction content plays the most important role, the instruction format should not be neglected. Given that the instruction or a procedure contains all of the relevant information, the instruction formatting can lead to more frequent, efficient, and satisfying use. However, the current study did not determine which formatting characteristics achieve these goals. Therefore, future investigation should examine the implications of the changes to identify which changes support instruction use.

SKB R-14-06 51
6.7 Limitations of the studyAlthough this study aided in the development of SKB’s instruction, a number of limitations must be mentioned. First, large variations in the success of the data evaluation task were observed across participants. The sample size (i.e. 4 participants) was very small. Thus, this study was qualitative, rather than quantitative, in nature. The error identification process might have been overly subjective insofar as it was based on the opinion of only one UT expert. The order in which these studies were carried out was determined by their development, i.e. Instruction v4.0 was available before Instruction v5.5. Thus, the participants were influenced by the order in which the instructions were tested. This order, coupled with the participants’ wish to satisfy the experimenter’s assumed expectations, may have biased the results. Two of the participants were closely involved in the creation of the instructions (i.e. one participant was the writer, and one was the reviewer), potentially resulting in additional bias. The above-mentioned biases might have also affected the satisfaction rating. To avoid these biases, participants should not be directly involved in creating the instruction. Additionally, to test which instruction is superior, different participants should evaluate the different instructions. In the case of a limited number of participants, the order in which the instructions are tested should be varied.
The inspection task might have been excessively lengthy and involved. On the one hand, the task resembled a real data evaluation situation. On the other hand, it limited the evaluation of the eye-tracking data. Therefore, the task should be divided into subtasks that are evaluated separately. Due to the time-consuming nature and the complexity of the task, the RTA was also incomplete. If the RTA were employed for the entire task, rather than for selected segments, additional problems in the use and understanding of the instruction might have been identified. Similar limitations were evident in the studied task, insofar as only the data evaluation chapter was examined. Although several general guidelines can be transferred to other chapters in the instruction, these chapters must be further developed and optimised.
Finally, although the applied methodology was nearly identical, the two studies differed to some extent. First, the evaluated data differed; this might have led to a difference in the identified problems. Second, the studies were carried out in a particular order (i.e. first, Instruction v4.0, and then Instruction v5.5). Third, the satisfaction rating for both instructions was carried out on the same day and might have been influenced by the recency of having used the respective instruction. Fourth, the participants became familiar with the eye tracker and the experimental method and thus might have felt more relaxed in the second study.
SKB R-14-06 53
7 Empirical study of the instruction content and the instruction format
7.1 IntroductionIn the previous chapter, the development of the NDT instruction was described. Substantial changes were made to the instruction content and format, resulting in the creation of a new instruction version, i.e. NDT Instruction v6.0. The goal of this development process was to optimise the instruction. However, did we achieve this goal? If so, which factors contributed to such improvement? Can these improvements be generalised to instruction/procedure writing?
Improvements in the instruction should be reflected in improved NDT performance, i.e. the data-evaluation performance. Because the instruction content of Instruction v5.5 was not fully updated before commencing the follow-up study, the hypothesised improvement of Instruction v5.5 over Instruction v4.0 was not observed. The results showed that some errors were avoided with the new instruction but that a large portion of the errors recurred.
Considering the small sample size, i.e. only 4 qualified participants, the same procedure could not be repeated without the participants potentially recalling the critical points in the task. Thus, a new approach, i.e. new participants and a new method, was needed.
Therefore, rather than examining NDT performance, we evaluated whether the information in the instruction was understood by the users (instruction content) and whether the new format supported a more efficient, effective, and satisfying use (instruction format). For this purpose, the current empirical study consisted of two parts: understanding and usability (hereafter referred to as the understanding study and the usability study, respectively). The aim was to further determine the factors that contribute to a high-quality NDT instruction.
7.2 Research questions In the course of developing the instruction, both how the information was conveyed to the user (e.g. steps, graphics, tables) and the information itself were altered in an attempt to increase the user’s understanding of the instruction. However, was this goal achieved? Is the information understandable? Did the changes make the content less understandable? New manuals should be tested before they are distributed to ensure that they will not be misunderstood or misinterpreted. The words that are used in the instruction should have the same meaning for every reader (CAA 2002). The goal of the understanding study was to identify the patterns in writing that help all users, regardless of their experience, to equally and correctly understand the written material. The underlying assumption was that if the information in the instruction is clearly understood, NDT performance should improve. An understanding of the written content cannot easily be generalised because it is related to the specific content. Therefore, this study was qualitative, with the aim of learning from the findings rather than quantifying them.
Furthermore, improvements in the instruction should be reflected in a more effective (i.e. accurate and correct), efficient (i.e. requiring less effort or time), and satisfying instruction use and consequent performance, as suggested by the usability concept (DIN EN ISO 9241-11:1999). This issue was investigated within the scope of the usability study.
The following changes were introduced:
• Highlighting – the use of bold text to emphasise numbers or reporting levels and the use of grey, square boxes to emphasise notes that the participants must read.
• Navigation – the use of (sub)titles for easier navigation through the instruction.
• Information presentation – the presentation of each task action as a single numbered step.

54 SKB R-14-06
However, did these changes lead to a more efficient and effective use of the instruction, i.e. could the information be extracted quickly and correctly, and were the users satisfied with the instruction? The goal of the usability study was to determine which factors contribute to a high-quality instruction.
7.3 MethodThe two studies were carried out jointly. In this section, the method by which both studies were conducted will be presented.
7.3.1 ParticipantsTwenty participants took part in the study. The sample consisted of 18 male and 2 female participants from five companies that were located in Sweden (SKB, Exova), Finland (Posiva, VTT), and Germany (BAM). Not all participants were NDT practitioners; several participants were researchers who were familiar with the project. The minimal requirements for participation included the following criteria:
• Experience with data evaluation.
• Experience working according to instructions/procedures.
• Proficiency in the English language.
In preparation for the study, the participants were familiarised with the instruction. Thus, the partici-pants were randomly assigned to one of the two groups. Prior to engaging in the study, one group read Instruction v4.0, and the other group read Instruction v6.0. This method was of importance for the understanding study, in which the participants were asked about the content of the specific instruction that they had read previously. In the usability study, the task was equally divided among all participants.
Figure 7-1 shows the qualifications and the experience of the participants and their distribution over the two experimental groups. Of the sampled participants, one did not have data evaluation experience. Because the participants needed such experience to understand the instruction, this participant was excluded from the understanding study (participant ID: 4.2). Two participants did not have experience with data evaluation according to an inspection procedure. Although they lacked this practical in-field experience, these participants had evaluated data according to a procedure for research purposes and were, therefore, qualified to participate in the study. Three of the participants took part in the NDT instruction development studies (two participants were assigned to the Instruction v.6.0 group). In addition, the participants were proficient in English; they evaluated their proficiency as intermediate (35%) or advanced (65%).
Although differences in the participants’ experience were observed between the two groups, suggesting an unbalanced design, the participants’ relevant experience (present experience with data evaluation (>10 times) and more than 1 year of experience in mechanised UT) was evenly distributed across the two groups.

SKB R-14-06 55
7.3.2 Experimental environmentThe joint study was designed using Tobii Studio 3.2.0 software and recorded with a Tobii T60 XL eye tracker. In Tobii Studio, a test is designed by adding the desired media (i.e. instructions, questionnaires, documents, images, screen recordings, etc.) on the timeline in the desired order. This approach enables easy, uninterrupted navigation through the experiment.
The understanding study consisted of three parts and the usability study consisted of one part. The 4 parts were presented to the participants consecutively, together with the experience and qualification questionnaire (see Appendix 1) and the instructions for individual aspects of the task.
In the understanding study, the participants were asked to answer a number of questions, either by choosing one of the multiple-choice answers on the screen or by writing down an answer on a sheet of paper. In the usability study, the participants were asked a question and then directed to a page where they were required to click the correct answer using a mouse. The order of the presentation of questions and corresponding instruction pages was randomised for each participant.
7.3.3 QuestionnairesExperience and qualifications questionnaire: A questionnaire was used to gather information about the participant sample, including experience and qualifications, for this study. The questions are presented in Appendix 1.
Figure 7‑1. The participants’ experience with UT, mechanised UT, general data evaluation and data evaluation according to an inspection procedure, for each participant group (Instructions v4.0 and 6.0).
0 2 4 6 8 10
< 1 year
1-5 years
5-10 years
> 10 years
no experience
< 1 year
1-10 years
> 10 years
I have neveranalysed data
I have done itonce or twice
< than 10 times
> than 10 times
yes
no
UT
expe
rienc
eM
echa
nise
d U
T ex
perie
nce
Dat
a ev
alua
tion
expe
rienc
eEx
perie
nce
with
proc
edur
es
frequency
Instruction v4.0 Instruction v6.0
56 SKB R-14-06
User satisfaction questionnaire: To investigate user satisfaction, the questionnaire that was created during the NDT instruction development was used (see Section 6.2.2 and Appendix 1). The participants were asked to rate their satisfaction with 28 items on a scale from 1 (not satisfied) to 6 (very satisfied).
7.3.4 Execution of the study One week before the joint study, the participants received one of the two instructions to read. They were asked to read the instruction at least once before the experiment and not to discuss the instruction with their colleagues, who might also be study participants.
The studies were carried out individually in a room that was adapted for eye-tracking experiments (with appropriate lighting, positioning, chairs, etc.). The experimenter remotely observed the data collection to ensure continuous eye-movement recording.
The participants were first offered an introduction to the study that was approximately 30 minutes in length. They were instructed that they were taking part in 2 studies, with the goal of determining how to improve the NDT instruction. Furthermore, they were assured anonymity and provided with an explanation of how to carry out the task.
The participants were then seated in front of the eye tracker, and the equipment was adjusted and calibrated. Over the course of the experiment, the participants were instructed on how to proceed with the task, both by instructions on the screen and by the experimenter, if needed. The experience and qualification questionnaire was also completed on the screen. The user satisfaction questionnaire (Appendix 1) was completed in a paper-and-pencil format after the recording was completed.
On average, the duration of the study was approximately 1 hour (range: 40 min to 1.5 h per participant).
7.4 Understanding study (instruction content)7.4.1 IntroductionThe term understanding, frequently also referred to as comprehension, is derived from cognitive psychology and is commonly associated with language, the understanding of words (e.g. Sternberg 2009, Bransford 1979), and learning (e.g. Kember 1996). As summarised by Sternberg (2009), the understanding of a text depends on the following factors:
• Access to the meaning of the words
• Deriving the meaning of the words from the key ideas in what we read
• Forming mental models (i.e. internal working models of the situation as the reader understands it)
• Extracting the key information from the text based on the context in which we read and in which we intend to use what we read.
The process of understanding is closely related to the concept of knowledge because the ability to understand results from a relationship between present inputs and activated knowledge (Bransford 1979). One of the most relevant factors in understanding is the use of an appropriate knowledge framework or context for the material (Bransford and Johnson 1972).
In one of the methods that is used to investigate understanding, participants read a passage (or have it read aloud to them) and are then asked to rate its comprehensibility and recall the information it contained. Bransford and Johnson (1973) showed higher free recall response rates with the availability of an appropriate knowledge context than without the knowledge context. Nyberg and Cleary (see Bransford and Johnson 1973) demonstrated that providing participants with cues for recollection in the form of key words further increased the difference between the groups.
In the current study, understanding referred to the use of knowledge context (all the participants had experience with data evaluation and in working according to instructions/procedures) and available selected information from the instruction for the purpose of understanding the instruction content.

SKB R-14-06 57
Apart from 3 participants who participated in the NDT instruction development, the participants did not have sufficient experience to answer the questions from their memory. Even the three experienced participants had not worked with the instruction in the previous year, prohibiting recall of the information from memory.
7.4.2 MethodPrior to the study’s commencement, the participants were randomly assigned to one of two groups: the old instruction (Instruction v4.0) group or the new instruction (Instruction v6.0) group and handed out their respective instructions to read. Although the participants were divided between the two groups, no assumptions were made concerning which instruction version provided the more easily understood content. Rather, the study questions and the participants’ answers were analysed as single events, with the aim of learning how to increase understanding.
To investigate understanding of the instruction, a number of questions that coincided with sections in the instruction were developed. The study was organised into three parts according to how the information was presented and how the participants were expected to recall it.
Understanding relies on intention, which distinguishes it from memorisation. When a person has the intention to understand, memorisation of the content is considered only a by-product (Kember 1996). Therefore, with the aim of activating intentionality, the participants were instructed to attempt to understand, rather than to memorise, the content that was presented to them. Following each assignment, they were asked to recall the information, either by selecting one of the offered alternatives or by free recall (i.e. writing their responses on pieces of paper).
In Part 1, the participants were asked a question and then were given the opportunity to find the answer in the instruction and to select an answer among several options (choosing one of 3 or 4 alternatives). There were 4 questions. In Part 2, the participants were asked to read a section of the instruction and then to choose one answer among 3 or 4 alternatives. There were 4 sections and 6 follow-up questions. In Part 3, the participants were asked a question and then were given the opportunity to find the answer in the instruction. Finally, they were asked to close the instruction and to write the answer on a piece of paper. (The three methods of asking questions and presenting the material were utilised to find the most appropriate method to investigate understanding in this application.) Figure 7-2 shows the participants’ assignments in each part of the study. For a full list of the questions and the answer options, see Appendix 4.
Figure 7‑2. The sequence of tasks in each study part.
The participant looks for the answer in the
instruction (the question is shown on the top of the
instruction)
The question is shown on the screen
The participant is given multiple choice answers to the question (no possibility to return to the instruction)
The question with multiple choice answers is shown on the screen (no possibility to return to the instruction)
One section of the instruction is shown to the participant (the participant is asked to understand and
visualise the process)
The participant is free to look for the answer in the instruction and asked to close it down after the
answer is found
The question is shown on the screen
The participant writes downhis/her answer on a sheet of
paper in front of him/her
Part 1Q1-4
Part 2Q5-10
Part 3Q11-14
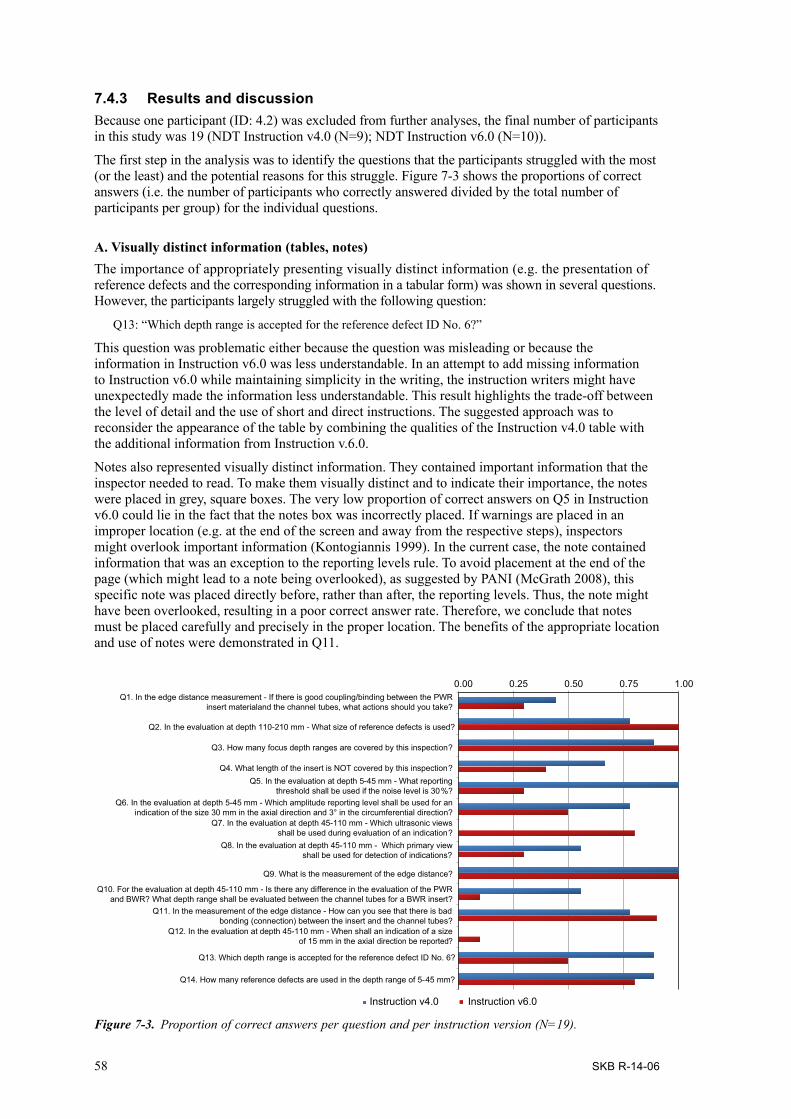
58 SKB R-14-06
7.4.3 Results and discussionBecause one participant (ID: 4.2) was excluded from further analyses, the final number of participants in this study was 19 (NDT Instruction v4.0 (N=9); NDT Instruction v6.0 (N=10)).
The first step in the analysis was to identify the questions that the participants struggled with the most (or the least) and the potential reasons for this struggle. Figure 7-3 shows the proportions of correct answers (i.e. the number of participants who correctly answered divided by the total number of participants per group) for the individual questions.
A. Visually distinct information (tables, notes) The importance of appropriately presenting visually distinct information (e.g. the presentation of reference defects and the corresponding information in a tabular form) was shown in several questions. However, the participants largely struggled with the following question:
Q13: “Which depth range is accepted for the reference defect ID No. 6?”
This question was problematic either because the question was misleading or because the information in Instruction v6.0 was less understandable. In an attempt to add missing information to Instruction v6.0 while maintaining simplicity in the writing, the instruction writers might have unexpectedly made the information less understandable. This result highlights the trade-off between the level of detail and the use of short and direct instructions. The suggested approach was to reconsider the appearance of the table by combining the qualities of the Instruction v4.0 table with the additional information from Instruction v.6.0.
Notes also represented visually distinct information. They contained important information that the inspector needed to read. To make them visually distinct and to indicate their importance, the notes were placed in grey, square boxes. The very low proportion of correct answers on Q5 in Instruction v6.0 could lie in the fact that the notes box was incorrectly placed. If warnings are placed in an improper location (e.g. at the end of the screen and away from the respective steps), inspectors might overlook important information (Kontogiannis 1999). In the current case, the note contained information that was an exception to the reporting levels rule. To avoid placement at the end of the page (which might lead to a note being overlooked), as suggested by PANI (McGrath 2008), this specific note was placed directly before, rather than after, the reporting levels. Thus, the note might have been overlooked, resulting in a poor correct answer rate. Therefore, we conclude that notes must be placed carefully and precisely in the proper location. The benefits of the appropriate location and use of notes were demonstrated in Q11.
Figure 7‑3. Proportion of correct answers per question and per instruction version (N=19).
0.00 0.25 0.50 0.75 1.00
Q2. In the evaluation at depth 110-210 mm - What size of reference defects is used?
Q3. How many focus depth ranges are covered by this inspection?
Q4. What length of the insert is NOT covered by this inspection?
Q9. What is the measurement of the edge distance?
Q13. Which depth range is accepted for the reference defect ID No. 6?
Q14. How many reference defects are used in the depth range of 5-45 mm?
Instruction v4.0 Instruction v6.0
Q1. In the edge distance measurement - If there is good coupling/binding between the PWR insert materialand the channel tubes, what actions should you take?
Q6. In the evaluation at depth 5-45 mm - Which amplitude reporting level shall be used for an indication of the size 30 mm in the axial direction and 3° in the circumferential direction?
Q7. In the evaluation at depth 45-110 mm - Which ultrasonic views shall be used during evaluation of an indication?
Q5. In the evaluation at depth 5-45 mm - What reporting threshold shall be used if the noise level is 30%?
Q8. In the evaluation at depth 45-110 mm - Which primary view shall be used for detection of indications?
Q10. For the evaluation at depth 45-110 mm - Is there any difference in the evaluation of the PWR and BWR? What depth range shall be evaluated between the channel tubes for a BWR insert?
Q11. In the measurement of the edge distance - How can you see that there is bad bonding (connection) between the insert and the channel tubes?
Q12. In the evaluation at depth 45-110 mm - When shall an indication of a size of 15 mm in the axial direction be reported?

SKB R-14-06 59
B. Logics and clarity in writing Two problems with logics and clarity in writing were identified. First, several questions referred to one important item in the instruction, i.e. the reporting levels (Q5, Q6, and Q12). The reporting levels inform the evaluator regarding how to filter information, i.e. which indications are critical and must be reported. Of note, only one participant answered Q12 correctly; he listed all of the relevant criteria for reporting the indications at the certain depth range. This low correct answer rate might be due to the order in which the reporting levels information was presented. Currently, the reporting levels are written from specific to general.
For example, the reporting levels at the depth range 45–110 mm read as follows:
The reporting levels that shall be applied are:• Indications larger than 10 mm in axial direction and 2° in circumferential direction shall be reported if
they have higher maximum amplitude than 40% FSH. • Indications with maximum amplitude higher than 80% FSH shall be reported regardless of size.
As one participant suggested, it might be more logical to display the general rule before the specific rule. The format of a general rule is as follows: “if condition A is satisfied, then all indications must be reported”. For example:
The reporting levels that shall be applied are:• Indications with maximum amplitude higher than 80% FSH shall be reported regardless of size.
This rule supersedes all other rules. If the condition is satisfied, the subsequent rule(s) can be overlooked. In contrast, the format of a specific rule is as follows: “if condition A is not satisfied, then only those satisfying conditions B and/or C should be reported”. For example:
The reporting levels that shall be applied are:• Indications with maximum amplitude higher than 80% FSH shall be reported regardless of size. • Indications with maximum amplitude higher than 40% FSH shall be reported if:
– larger than 10 mm in axial direction.– larger than 2° in circumferential direction.
Thereby, it should be considered whether conditions B and C must be equally satisfied, in which case they should be connected with the term “and”, or whether only one of them must be satisfied, in which case they should be connected with the term “or”.
The second issue with understanding was observed in Q10, in which the participants were asked to distinguish between the actions for two separate component types, i.e. two types of cast iron inserts.
Q10: “For the evaluation at depth 45–110 mm – Is there any difference in the evaluation of the PWR and BWR? What depth range shall be evaluated between the channel tubes for a BWR insert?” Alternatives: a) no difference, b) longer depth range for PWR, c) longer depth range for BWR. Correct answer: b) longer depth range for PWR.
In addition to the possibility that the participants found it difficult to remember all of the detailed information in the question, the presentation of the two contradicting items was potentially problematic. At the time of the study, the information in the two instructions was written as follows:
“For PWR inserts, the scan data shall be evaluated in the depth interval 45–110 mm, see figure 7 and 8. For BWR inserts, the same depth intervals shall be evaluated except for the volume between the channel tubes. There, the evaluation shall be done down to 105 mm depth, see figure 7.” (NDT instruction v4.0, p.15)
“Note: The insert shall be evaluated at the depth interval 45–110 mm, see figure 6-8 and 6-9. The exception is the volume between the channels in the BWR insert that shall be evaluated at the depth interval 45–105 mm, see figure 6–9.” (NDT instruction v6.0, p. 28)
Judging by the low proportion of correct answers, the difference between these contradictory elements was likely not clearly shown. Therefore, the differences in the instruction should be clearly presented, perhaps even in a tabular form or as a schematic, in which the values are listed one below the other.
60 SKB R-14-06
C. Cognitive demands (mental arithmetic)Q4 and Q14 required the participants to make a calculation according to the provided values. For example, in terms of Q4, NDT Instruction v4.0 states the following:
“[The] whole length (approximately 5 m) except for 59 mm in the bottom and in the top [...] is not covered due to the design of the used [probe] fixture [by the inspection]” (p.1).
In Instruction v6.0, this was simplified as follows:
“The inspection covers the whole axial length of the insert except 67 mm at each end” (p.7).
Q4 read as follows: “What length of the insert is NOT covered by this inspection?”
The correct answer to this question is 118 mm (v4.0) and 134 mm (v6.0). Although inspectors are not asked to calculate this specific information during an actual inspection, this example shows that mental arithmetic can lead to an error and, therefore, should be avoided. The low proportion of correct answers to Q4 supports this claim. The best way to ensure understanding is to develop steps that do not overtax the reader’s memory (Trump and Stave 1988).
D. Methodology The current study’s results concerning how well the instruction was understood may also be related to the understanding of the specific study questions, the suggested answer alternatives, or the study methodology. Specifically, it is possible that some of the questions were not understood, that the alternatives were overly similar (and, thus, became a test of the participants’ recollection skills rather than their understanding), and that parts of the study were inappropriate for the goals of this study.
In particular, Part 2’s methodology might not have been optimal. In Part 2, the participants were asked to read a section from the instruction and then to answer one or two questions. The participants reported that this was the most difficult task and that they struggled between understanding and memorising the instruction material despite their intention to understand it.
Additionally, the participants reported that the questions did not necessarily reflect the important information in the instruction; therefore, they were uncertain whether their answers were correct. This uncertainty especially applied to Q7 and Q8, as reflected in the low correct response rates observed for both instructions.
The third method (Part 3) – i.e. asking the participants to write down their answers rather than offering alternatives (via free recall) – was the most informative method used to investigate understanding.
Of note, the small number of participants was also problematic. The fact that only a handful of inspectors were sufficiently qualified to participate in the study remains one of the largest problems of human factors research in NDT in this specific application, i.e. the management of spent nuclear fuel. Of the 20 participants who possessed minimal knowledge and experience to participate, only 5 were sufficiently qualified for the study. These 5 participants had sufficient background knowledge regarding how to conduct the specific data evaluation task, had worked with the NDT instructions that were examined in this study, and had been trained on how to use them. The results support this theory insofar as the 5 experienced participants correctly answered larger proportions of questions than the other participants (Figure 7-4).
The instruction was developed for use while carrying out an inspection (acquisition/evaluation) task rather than to solely be read, as was tested in this experiment. Because only 5 participants had used the instruction in the intended manner, these results might be indicative of actual problems with understanding. The results demonstrated that the instruction concerning reporting levels caused problems even for the most experienced participants (Q12). When asked to write all of the reporting levels, the participants missed to recall at least one of the necessary conditions. This result supports the theory that attention must be given to how the reporting levels are conveyed to the user. The lack of correct answers to Q7 in Instruction v4.0 can be explained by the unclear information concerning which ultrasonic views are used during the evaluation of indications in this instruction. The low

SKB R-14-06 61
response rate to Q10 in Instruction v6.0 was previously addressed (i.e. the differences between the items were not clearly expressed). In conclusion, Figure 7-4 highlights issues related to the under-standing of participants who were appropriately experienced and trained for the task. The results of the remaining 14 participants indicate the problems in understanding that new users might encounter.
7.4.4 Limitations of the study In the previous section, some of the methodology issues were addressed. An additional limitation of this study is the amount and the relevance of the information that was investigated. First, the entire instruction was not examined (only the data evaluation part). Second, only information that was present in both instructions was examined due to the study’s goal of comparing the two instructions. Hence, valuable information that was added to the new instruction as a result of the instruction-development process was left uninvestigated.
This study indicates the importance of qualified and experienced participants. The participants’ experience varied, potentially affecting the results.
In addition, the study relied solely on understanding the written instruction and did not place such understanding in its proper context. Both of these items can be achieved if participants both answer the questions and carry out the tasks, which is the recommended approach for future studies. This method can be further supported by an interview with each user, with the aim of collecting the users’ individual experiences and opinions about the understanding of the instruction and utilising this information to generate improvements.
If feasible, a pilot study should be conducted to determine the best method for the examination and to evaluate the quality of the questions.
Despite the current study’s narrow scope, its limited number of experienced participants, and its questions, the study has provided some insights into the problems of understanding. Specifically, the written content was not equally understood by all of the participants, which raises an important issue about the design of the instructions.
The concept of understanding is not easy to measure. Although the current study unveiled some of the characteristics that contribute to a greater understanding of the two instructions, further knowledge into further contributing factors is needed. Future research should expand the scope of the investiga-tion from only data evaluation (investigated in this study) to other parts of the instruction.
Figure 7‑4. Proportion of correct answers per question and per instruction version for the five experienced participants only (Instruction v4.0: N=3; Instruction v6.0: N=2).
0.00 0.25 0.50 0.75 1.00
Q2. In the evaluation at depth 110-210 mm - What size of reference defects is used?
Q3. How many focus depth ranges are covered by this inspection?
Q4. What length of the insert is NOT covered by this inspection?
Q9. What is the measurement of the edge distance?
Q13. Which depth range is accepted for the reference defect ID No. 6?
Q14. How many reference defects are used in the depth range of 5-45 mm?
Instruction v4.0 Instruction v6.0
Q1. In the edge distance measurement - If there is good coupling/binding between the PWR insert material and the channel tubes, what actions should you take?
Q5. In the evaluation at depth 5-45 mm - What reporting threshold shall be used if the noise level is 30%?
Q6. In the evaluation at depth 5-45 mm - Which amplitude reporting level shall be used for an indication of the size 30 mm in the axial direction and 3° in the circumferential direction?
Q7. In the evaluation at depth 45-110 mm - Which ultrasonic views shall be used during evaluation of an indication?
Q8. In the evaluation at depth 45-110 mm - Which primary view shall be used for detection of indications?
Q10. For the evaluation at depth 45-110 mm - Is there any difference in the evaluation of the PWR and BWR? What depth range shall be evaluated between the channel tubes for a BWR insert?
Q11. In the measurement of the edge distance - How can you see that there is bad bonding (connection) between the insert and the channel tubes?
Q12. In the evaluation at depth 45-110 mm - When shall an indication of a size of 15 mm in the axial direction be reported?
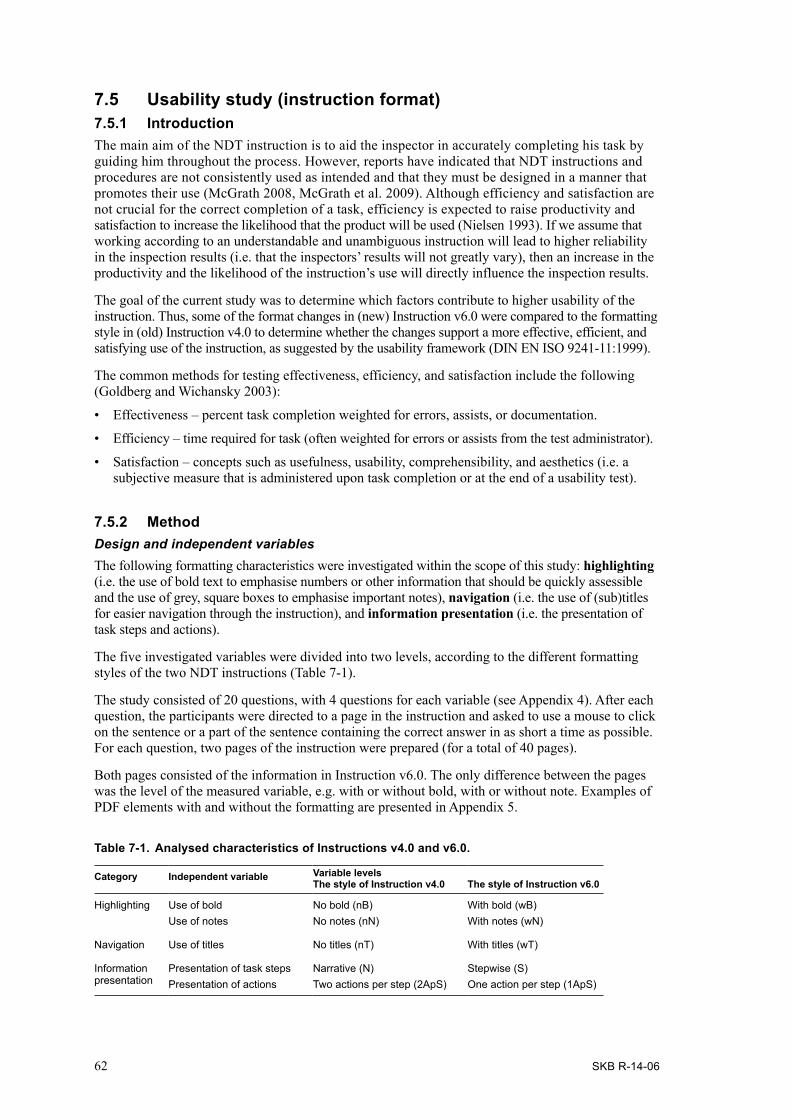
62 SKB R-14-06
7.5 Usability study (instruction format)7.5.1 IntroductionThe main aim of the NDT instruction is to aid the inspector in accurately completing his task by guiding him throughout the process. However, reports have indicated that NDT instructions and procedures are not consistently used as intended and that they must be designed in a manner that promotes their use (McGrath 2008, McGrath et al. 2009). Although efficiency and satisfaction are not crucial for the correct completion of a task, efficiency is expected to raise productivity and satisfaction to increase the likelihood that the product will be used (Nielsen 1993). If we assume that working according to an understandable and unambiguous instruction will lead to higher reliability in the inspection results (i.e. that the inspectors’ results will not greatly vary), then an increase in the productivity and the likelihood of the instruction’s use will directly influence the inspection results.
The goal of the current study was to determine which factors contribute to higher usability of the instruction. Thus, some of the format changes in (new) Instruction v6.0 were compared to the formatting style in (old) Instruction v4.0 to determine whether the changes support a more effective, efficient, and satisfying use of the instruction, as suggested by the usability framework (DIN EN ISO 9241-11:1999).
The common methods for testing effectiveness, efficiency, and satisfaction include the following (Goldberg and Wichansky 2003):
• Effectiveness – percent task completion weighted for errors, assists, or documentation.
• Efficiency – time required for task (often weighted for errors or assists from the test administrator).
• Satisfaction – concepts such as usefulness, usability, comprehensibility, and aesthetics (i.e. a subjective measure that is administered upon task completion or at the end of a usability test).
7.5.2 MethodDesign and independent variablesThe following formatting characteristics were investigated within the scope of this study: highlighting (i.e. the use of bold text to emphasise numbers or other information that should be quickly assessible and the use of grey, square boxes to emphasise important notes), navigation (i.e. the use of (sub)titles for easier navigation through the instruction), and information presentation (i.e. the presentation of task steps and actions).
The five investigated variables were divided into two levels, according to the different formatting styles of the two NDT instructions (Table 7-1).
The study consisted of 20 questions, with 4 questions for each variable (see Appendix 4). After each question, the participants were directed to a page in the instruction and asked to use a mouse to click on the sentence or a part of the sentence containing the correct answer in as short a time as possible. For each question, two pages of the instruction were prepared (for a total of 40 pages).
Both pages consisted of the information in Instruction v6.0. The only difference between the pages was the level of the measured variable, e.g. with or without bold, with or without note. Examples of PDF elements with and without the formatting are presented in Appendix 5.
Table 7-1. Analysed characteristics of Instructions v4.0 and v6.0.
Category Independent variable Variable levelsThe style of Instruction v4.0 The style of Instruction v6.0
Highlighting Use of bold No bold (nB) With bold (wB)Use of notes No notes (nN) With notes (wN)
Navigation Use of titles No titles (nT) With titles (wT)
Information presentation
Presentation of task steps Narrative (N) Stepwise (S)Presentation of actions Two actions per step (2ApS) One action per step (1ApS)

SKB R-14-06 63
In the previous study, the participants were divided into two groups according to the instruction version that they evaluated. To reduce the effect of participants’ familiarity with one or the other instruction format, the instruction pages were equally distributed across the participant sample. Thus, both groups received instruction pages with and without the formatting of NDT Instruction v6.0. In conclusion, each participant received 20 questions and 20 corresponding instruction pages, two with and two without formatting, per variable level (i.e. 2 with bold and 2 without bold).
To avoid confounding effects, i.e. to ensure that only the variable that was varied affected performance, some variables were held constant, and some were controlled. In the case of examining whether bold and notes would affect efficiency in the use of the instruction, the levels of both variables were varied, and all other variables were held constant. For example, when bold was varied, the following were held constant: no notes, with titles, stepwise, and one action per step. In the case of the other three variables, the other potential influencing factors were controlled, i.e. both levels were present (see Table 7-2). For example, when varying the levels of presentation of task steps (S vs. N), 8 images were created, with 4 written in stepwise and 4 written in narrative manner. Of the 4 in each level, 2 were with titles and 2 without titles, and 2 were described by one action per step and 2 by two actions per step. For further clarification and the combination of all variable levels, see Appendix 4.
Table 7-2. The experimental design.
Independent variable
Use of bold Use of notes
Use of titles Presentation of task steps
Presentation of actions
Use of bold nB nN wT S 1ApSwB
Use of notes nB nNwN
Use of titles nB nN nT S 1ApS2ApS
N 1ApS2ApS
wT S 1ApS2ApS
N 1ApS2ApS
Presentation of task steps
nB nN nT S 1ApS2ApS
wT 1ApS2ApS
nT N 1ApS2ApS
wT 1ApS2ApS
Presentation of actions
nB nN nT S 1ApSwT
nT NwT
nT S 2ApSwT
nT NwT
Colour legend: white – varied variable levels; blue – variables held constant; red – controlled variables.Abbreviations: wB – with bold; nB – no bold; wN – with notes; nN – no notes; wT – with titles, nT – no titles, S – stepwise; N – narrative; 1ApS – one action per step; 2ApS – two actions per step.

64 SKB R-14-06
Dependent variablesIn Tobii Studio, the correct answers are depicted as areas of interest (AOIs) through the selection of the area around the correct answer and then the filtering of only those data related to the AOI.
To establish the usability of the instruction according to the usability framework, the following measures were used:• Efficiency – time in seconds from the time the PDF element was presented until the first click is
made within an AOI (time to the first mouse click in Tobii Studio).– A shorter time to the first mouse click on AOI corresponds to higher efficiency.
• Effectiveness – the number of correctly identified AOIs, as measured by the number of mouse clicks on the AOI.– A higher proportion of correctly identified AOIs corresponds to higher effectiveness.
• Satisfaction – user satisfaction rating.– A higher result corresponds to higher satisfaction with the instruction.
Although the eye tracker provides information on eye fixations and eye movements, the selected measure of task success was a mouse click on the AOI. Time to the first fixation (defined as the time in seconds from the start of the page display until the participant first fixated on the AOI or an AOI group) indicates how quickly the participant sees the AOI. However, the measure time to the first mouse click is more informative because it includes the participants’ judgment about the correctness of the answer.
HypothesesIn general, it was hypothesised that the formatting style of Instruction v6.0 would lead to a more effective and efficient performance and to more satisfying use. The goals of the changes that were made in Instruction v.6.0 were to further distinguish the most important information from the other information by means of highlighting (bold, notes), to allow for easier navigation through the instruction and faster localisation of the information (titles), to clearly separate the task steps from one another (stepwise), and to employ the single task actions (1ApS). Therefore, we hypothesised that participants would require less time to identify the required information in the instruction (efficiency).
An additional goal was to ensure that no actions would be overlooked and skipped. Thus, we hypothesised that the likelihood of detecting the required task step would increase if each action were written in a separate step (effectiveness). There was no reason to assume that actions would be overlooked or skipped as a result of the highlighting, titles, or presentation of the task steps, which is why no hypotheses were made with respect to effectiveness. Rather, we hypothesised that these changes would affect the participants’ efficiency by making the actions more visually distinct.
Finally, we hypothesised that the participants would show higher satisfaction with the new instruction. A summary of the hypotheses is presented in Table 7-3.
Table 7-3. Hypotheses.
No. Hypothesis Efficiency (time)
Effectiveness (detection rate)
Satisfaction (rating)
1 The information will be identified faster when it is presented in bold text than when it is not in bold.
wB < nB
2 Notes will be identified faster when they are presented in grey rectangles than when they are not in grey rectangles.
wN < nN
3 The information will be identified faster when there are titles than when there are no titles.
wT < nT
4 When the information is presented in a stepwise manner, it will be identified faster than when it is written in a narrative manner.
S < N
5 Single actions will be identified faster if they are written according to the 1 action per step rule.
1ApS < 2ApS
6 If one step contains more than one action, the second (and all following) action(s) will not always be detected.
1ApS > 2ApS
7 The participants will be more satisfied with NDT Instruction v6.0.
v6.0 > v4.0
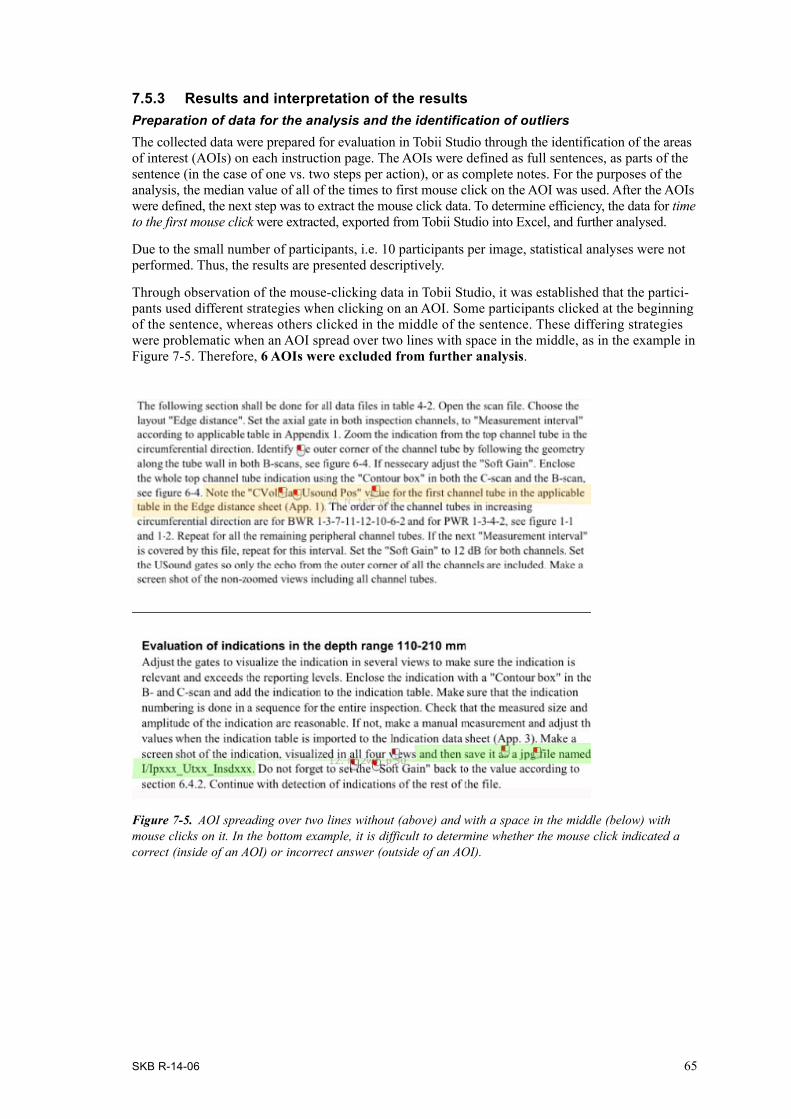
SKB R-14-06 65
7.5.3 Results and interpretation of the resultsPreparation of data for the analysis and the identification of outliersThe collected data were prepared for evaluation in Tobii Studio through the identification of the areas of interest (AOIs) on each instruction page. The AOIs were defined as full sentences, as parts of the sentence (in the case of one vs. two steps per action), or as complete notes. For the purposes of the analysis, the median value of all of the times to first mouse click on the AOI was used. After the AOIs were defined, the next step was to extract the mouse click data. To determine efficiency, the data for time to the first mouse click were extracted, exported from Tobii Studio into Excel, and further analysed.
Due to the small number of participants, i.e. 10 participants per image, statistical analyses were not performed. Thus, the results are presented descriptively.
Through observation of the mouse-clicking data in Tobii Studio, it was established that the partici-pants used different strategies when clicking on an AOI. Some participants clicked at the beginning of the sentence, whereas others clicked in the middle of the sentence. These differing strategies were problematic when an AOI spread over two lines with space in the middle, as in the example in Figure 7-5. Therefore, 6 AOIs were excluded from further analysis.
Figure 7‑5. AOI spreading over two lines without (above) and with a space in the middle (below) with mouse clicks on it. In the bottom example, it is difficult to determine whether the mouse click indicated a correct (inside of an AOI) or incorrect answer (outside of an AOI).

66 SKB R-14-06
In addition, contrary to expectations, not all AOIs were correctly identified (Figure 7-6; see Appendix 7 for the full set of data). This was especially evident for the presentation of task steps and actions, suggesting a problem for further data analysis.
In the cases of missing data, the following two approaches are used: the participant with missing data is deleted, or the missing data are replaced by a value. Because nearly all of the current study participants had some missing data, the second option was applied. The simplest solution is to replace the missing value with the mean or median value. Since the amount of collected data was rather small, the missing data were replaced with the median time to the first mouse click for each AOI. (A second possible option would have been to replace the missing values with each participant’s median time to take individual differences into consideration. However, the AOIs were distributed differently over the instruction pages (more time is needed to identify AOIs on the second half of the page than the AOIs on the first half); therefore, the time for each AOI differed.)
The participants identified 80% of the AOIs, ranging from 54% to 97% per condition (AOI group). AOIs with more than 50% of missing data were excluded from the analysis. This resulted in the exclusion of an additional four AOIs. (See Appendix 6 for a full list of AOIs, the outliers, and the reasons for their exclusion. Note that when one AOI is excluded, its pair AOI must be excluded for the purposes of time comparison.)
Some individual differences in the number of correctly identified AOIs were observed between the participants. Figure 7-7 shows that the number of participants who identified more than 90% of the correct answers is rather small (N=3). The majority of the participants identified 70–90% of AOIs, and one participant identified less than 50%. Because of the small number of identified AOIs, this participant was excluded from further analyses as an outlier.
Figure 7‑6. Proportion of missing data per AOI group.
0.0
0.1
0.2
0.3
0.4
0.5
0.6
nB wB nN wN nT wT N S 2ApS 1ApS
use of bold use of notes use of titles presentation of task steps
presentation of actions
prop
ortio
n of
mis
sing
dat
a
AOI group
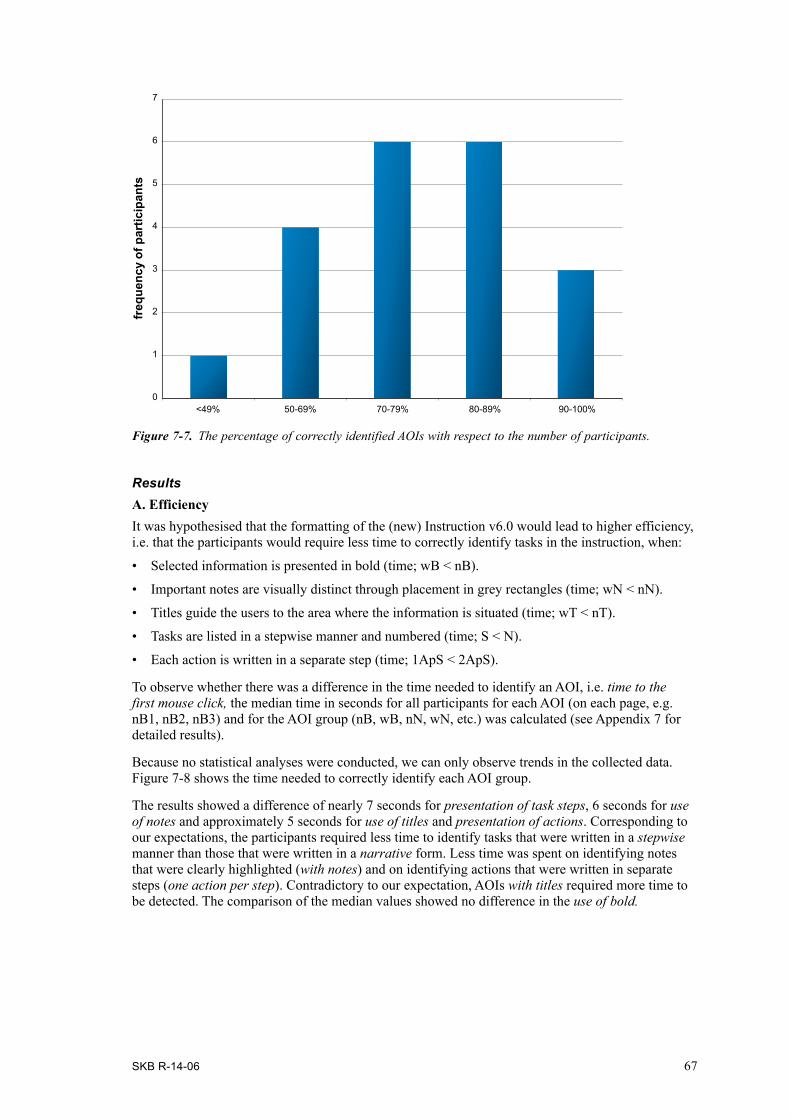
SKB R-14-06 67
ResultsA. EfficiencyIt was hypothesised that the formatting of the (new) Instruction v6.0 would lead to higher efficiency, i.e. that the participants would require less time to correctly identify tasks in the instruction, when:
• Selected information is presented in bold (time; wB < nB).
• Important notes are visually distinct through placement in grey rectangles (time; wN < nN).
• Titles guide the users to the area where the information is situated (time; wT < nT).
• Tasks are listed in a stepwise manner and numbered (time; S < N).
• Each action is written in a separate step (time; 1ApS < 2ApS).
To observe whether there was a difference in the time needed to identify an AOI, i.e. time to the first mouse click, the median time in seconds for all participants for each AOI (on each page, e.g. nB1, nB2, nB3) and for the AOI group (nB, wB, nN, wN, etc.) was calculated (see Appendix 7 for detailed results).
Because no statistical analyses were conducted, we can only observe trends in the collected data. Figure 7-8 shows the time needed to correctly identify each AOI group.
The results showed a difference of nearly 7 seconds for presentation of task steps, 6 seconds for use of notes and approximately 5 seconds for use of titles and presentation of actions. Corresponding to our expectations, the participants required less time to identify tasks that were written in a stepwise manner than those that were written in a narrative form. Less time was spent on identifying notes that were clearly highlighted (with notes) and on identifying actions that were written in separate steps (one action per step). Contradictory to our expectation, AOIs with titles required more time to be detected. The comparison of the median values showed no difference in the use of bold.
Figure 7‑7. The percentage of correctly identified AOIs with respect to the number of participants.
0
1
2
3
4
5
6
7
<49% 50-69% 70-79% 80-89% 90-100%
freq
uenc
y of
par
ticip
ants

68 SKB R-14-06
Considering the amount of data that was replaced (see the grey fields in Appendix 7), we controlled whether the manipulation of replacing the missing data had a major effect on the data. Figure 7-9 shows the median time to the first mouse click for each AOI group without replacement of the missing data.
According to the comparison of Figure 7-9 with Figure 7-8, the manipulation had an effect on the use of titles and presentation of task steps. The raw data showed no major differences in the use of titles, which contradicts the earlier result (when missing values were substituted). In the case of the presentation of task steps, the difference between stepwise and narrative processes increased (a difference of nearly 5 seconds can be observed between Figures 7-8 and 7-9). According to an examination of the raw data, this difference might have been caused by the large variation among the participants and by a difference in the number of replaced missing values. This difference indicates the problem caused by the large amount of missing data and the small number of participants.
Figure 7‑8. Median time to first mouse click for each AOI group (missing values were replaced with the median time for each AOI).
Figure 7‑9. Median time to first mouse click for each AOI group (raw data with missing values).
0
2
4
6
8
10
12
14
16
18
20
nB wB nN wN nT wT N S 2ApS 1ApS
use of bold use of notes use of titles presentation of task steps
presentation of actions
med
ian
time
to th
e fir
st m
ouse
clic
k [s
ec]
AOI group
0
2
4
6
8
10
12
14
16
18
20
22
24
26
nB wB nN wN nT wT N S 2ApS 1ApS
use of bold use of notes use of titles presentation of task steps
presentation of actions
med
ian
time
to th
e fir
st m
ouse
clic
k [s
ec]
AOI group

SKB R-14-06 69
B. EffectivenessIn the case of the presentation of actions, it was assumed that if one step were to consist of several actions, all of the actions might not be correctly identified, i.e. that the participant might overlook the fact that one step consists of several actions and might proceed to the next step. Figure 7-10 shows the proportion of correctly identified AOIs in cases of there being one and two actions per step. For this calculation, 6 AOIs were taken into consideration, including the AOIs that were excluded from the effi-ciency calculation, due to the small number of identified AOIs. The results showed a slight difference between the groups in favour of one action per step, indicating that the number of correctly identified actions increased when actions were clearly separated (1ApS). Although no assumptions can be made regarding whether this effect exists in the population (no statistical hypothesis tests were carried out), this result supports retaining the hypothesis.
C. SatisfactionFinally, the participants were asked to evaluate their satisfaction with the two instruction versions. This study was conducted together with the understanding study, in which the participants were assigned to one of two groups (i.e. one group read Instruction v4.0, and the other group read Instruction v6.0). Thus, 10 participants per instruction version completed the questionnaire.
The results (Figure 7-11) showed a tendency towards higher satisfaction with NDT Instruction v6.0; however, the score difference was less than 1 point.
When examining the individual items (Figure 7-12), the difference in satisfaction between the instruc-tions was not as large as that observed between Instructions v4.0 and v5.5 during the NDT development.
Figure 7‑10. The proportion of correctly identified AOIs in cases of one (1ApS) and two actions per step (2ApS).
0.62
0.71
0.0
0.1
0.2
0.3
0.4
0.5
0.6
0.7
0.8
2ApS 1ApSpresentation of actions
prop
ortio
n of
cor
rect
ly id
entif
ied
AO
Is
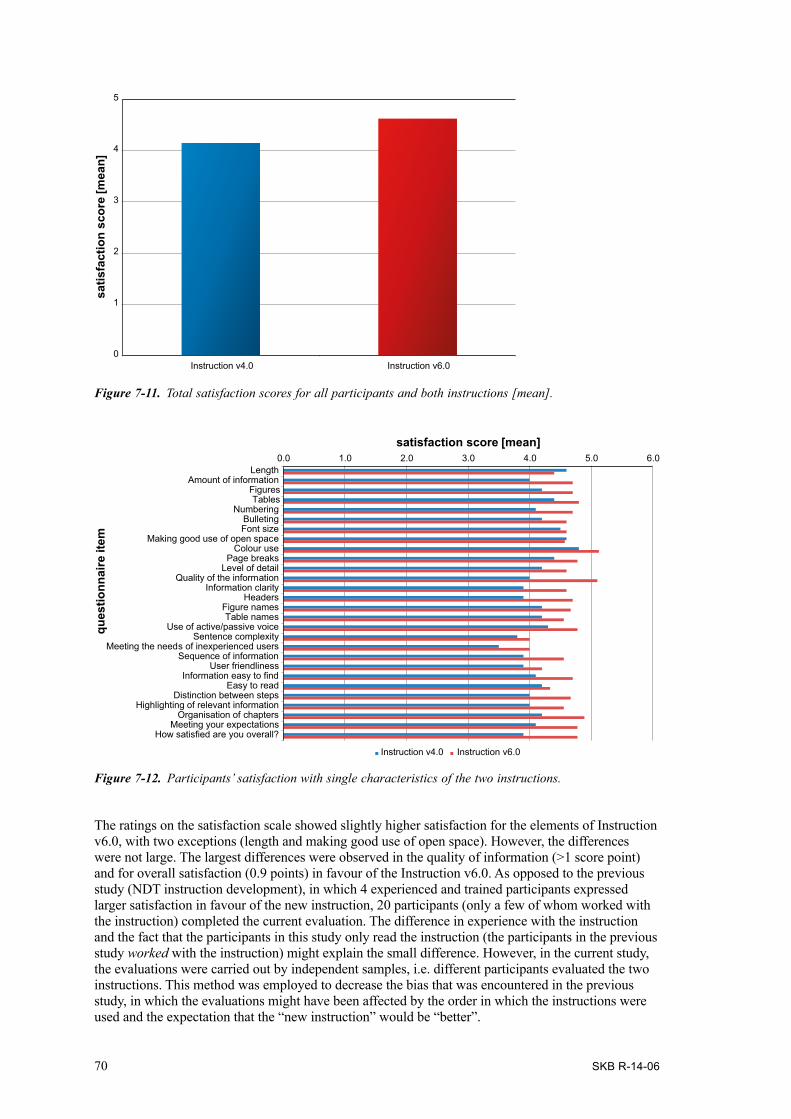
70 SKB R-14-06
Figure 7‑12. Participants’ satisfaction with single characteristics of the two instructions.
Figure 7‑11. Total satisfaction scores for all participants and both instructions [mean].
0
1
2
3
4
5
Instruction v4.0 Instruction v6.0
satis
fact
ion
scor
e [m
ean]
0.0 1.0 2.0 3.0 4.0 5.0 6.0Length
Amount of informationFiguresTables
NumberingBulletingFont size
Making good use of open spaceColour use
Page breaksLevel of detail
Quality of the informationInformation clarity
HeadersFigure namesTable names
Use of active/passive voiceSentence complexity
Meeting the needs of inexperienced usersSequence of information
User friendlinessInformation easy to find
Easy to readDistinction between steps
Highlighting of relevant informationOrganisation of chapters
Meeting your expectationsHow satisfied are you overall?
satisfaction score [mean]
ques
tionn
aire
item
Instruction v4.0 Instruction v6.0
The ratings on the satisfaction scale showed slightly higher satisfaction for the elements of Instruction v6.0, with two exceptions (length and making good use of open space). However, the differences were not large. The largest differences were observed in the quality of information (>1 score point) and for overall satisfaction (0.9 points) in favour of the Instruction v6.0. As opposed to the previous study (NDT instruction development), in which 4 experienced and trained participants expressed larger satisfaction in favour of the new instruction, 20 participants (only a few of whom worked with the instruction) completed the current evaluation. The difference in experience with the instruction and the fact that the participants in this study only read the instruction (the participants in the previous study worked with the instruction) might explain the small difference. However, in the current study, the evaluations were carried out by independent samples, i.e. different participants evaluated the two instructions. This method was employed to decrease the bias that was encountered in the previous study, in which the evaluations might have been affected by the order in which the instructions were used and the expectation that the “new instruction” would be “better”.
SKB R-14-06 71
7.5.4 Discussion The goal of this study was to determine whether the selected formatting changes that were intro-duced in NDT Instruction v6.0, compared to NDT Instruction v4.0, support the higher usability of the instruction, as defined through efficiency, effectiveness, and user satisfaction.
In conclusion, the findings confirmed the expectations and the suggestions from the literature to some extent. The data strongly indicate that the use of notes, the presentation of the data in a stepwise manner, and the use of one action per step (rather than two actions per step) led to higher efficiency. The results also showed a slight difference between the conditions in that the one action per step was more often identified correctly. This result goes in a direction supportive of the study’s hypotheses.
Some explanations might be offered for why some of the hypotheses were not confirmed. For exam-ple, the use of bold text may not have had a sizable impact on efficiency because the information that was in bold was also emphasised through other means. Most of the bold values were part of the reporting levels, which were visually distinct from the remainder of the text (by having a separate chapter, using bulleting for different reporting levels, and using titles and subtitles to guide the user to the section). Therefore, it is noteworthy to consider whether additional benefit can be obtained from further highlighting or whether other information should be highlighted.
The use of titles hasn’t affected the efficiency, as expected. The reasons for this result might lie in the methodology and in the titles themselves. First, each question began by pointing the participant to a specific chapter, subchapter, or section (e.g. “In the detection of indications...”, “When evaluating an indication...”). The aim of this phrasing was to guide the participant to the subchapters “Detection of indications...” or “Evaluation of indications...” (see examples in Appendix 4), respectively, in line with the formatting of Instruction v6.0. However, following the experiment, the majority of the participants reported that they were not aware of those guidelines in the questions. This lack of awareness might be attributed to the fact that the questions were too long for the participants to remember; thus, the participants likely focused on the question itself. To avoid this issue in the future, the question should be presented on the screen during the entire task to decrease the load on the participants’ memory.
The second issue with the titles is that some of them appear on several levels in the structure. For example, the word evaluation is used to depict the name of the data evaluation chapter to distinguish it from the chapters that address data acquisition. However, it is also used to name the subchapters that address the evaluation of data at different depths and for the actual evaluation of the identified indications. Multiple uses of this term may have led to confusion and thus affected efficiency. An instruction or a procedure writer must keep this effect in mind. Titles and subtitles should be clearly distinguishable to support efficient navigation through the text. Using clear categorisation that requires little user interpretation concerning how the product is used is a good practice in the development of procedures (IAEA 1998).
Of note, in the current study, the participants were asked to find answers to questions (typically in the form of “Which step comes before/after this one?”). This simple paradigm cannot be used to explain all effects that can occur during rather complex situations. In the case of establishing differences between different information-presentation strategies (stepwise vs. narrative and one vs. two actions per step), the effects might have been even stronger if the experimental situation had been more similar to the operational situation (as reported by de Brito 1998). The differences could be strengthened by the properties of real situations, such as parallel tasks, time pressure, and interruptions, which can lead to difficulties in following the steps.
The user satisfaction rating showed only a minor favouring of Instruction v6.0. This difference was smaller than the difference between Instruction v4.0 and v5.5 during the NDT instruction development, for which the scale was developed. In the first study, the participants evaluated both instructions after they had used them. In contrast, in the current study, the participants only read the instruction and, therefore, could not perform a comparative assessment. An additional issue is that, during the instruction development stage, the same participants evaluated the instructions in a specific order (i.e. first Instruction v4.0 and then Instruction v5.5). The current study included a greater number of participants (N=20, in comparison to N=4), and the participant samples were inde-pendent of one another (i.e. different participants completed the questionnaire for each instruction version). Additionally, the participants were not biased by their experience with the other instruction.

72 SKB R-14-06
Apparently, both approaches have their advantages and disadvantages – i.e. the first study profiting from the experience with the instruction and, the second study from the independence. Because the instruction’s primary use is to guide the inspector in carrying out the task, future usability investiga-tions should take this into consideration and inquire about satisfaction only after the instruction is properly used, not merely read. The instructions should, however, be evaluated by independent participants. If this is not possible, the order in which the instructions are evaluated should be varied.
A significant limitation of the current study is that all AOIs were not correctly identified by all of the participants. Therefore, a number of AOIs were excluded from the analysis. Because the questions did not require problem solving (but, rather, pinpointing steps before or after a certain action, pinpointing number values or notes), an assumption about the difficulty of the questions cannot be supported. However, the participants commented that the questions were difficult to remember. This difficulty might have caused them not to pinpoint an AOI or to pinpoint an incorrect AOI. We assume, therefore, that a number of unidentified AOIs might be the result of forgetting the question, inaccurately pinpointing, responding to similarities among the task steps, or responding to time pressure (with the participants having been instructed to pinpoint the task in the shortest possible time).
In addition to excluding outliers based on the small number of correctly identified AOIs, AOIs were excluded due to their spread over two lines in the text. Because the participants were not instructed on exactly where an AOI (sentence or a note) needed to be clicked, it was difficult to interpret mouse clicks that were localised near the AOI. In addition, the instruction pages were shown in a PDF in full screen mode, without the possibility of zooming in on the page. Therefore, exact clicking on an AOI was difficult because the letters and the distances between steps were rather small, especially in cases where the experimental instruction was not clear or the participants were near-sighted. Thus, participants should be instructed to be both fast and accurate when clicking on an AOI (preferably at the beginning of the sentence); the spatial distance between the sentences should be sufficient.
This suggests both problems in the experiment design and the importance of a full-scale pilot study, which was not carried out due to the limited number of potential participants. With a pilot study, this problem could have been identified and avoided.
Although the current study was labelled as a usability study, the whole usability experience was not examined. First, not all measures were directed at the same quality of the product. Whereas efficiency was measured for all variables, effectiveness focused only on the presentation of actions. This difference occurs frequently in usability studies because effectiveness is often difficult to meas-ure in a robust manner (Frøkjær et al. 2000). In contrast to the usability framework (DIN EN ISO 9241-11:1999), which suggests that all usability traits should be tested together, Frøkjær et al. (2000) showed that the usability measures are weakly correlated with each other and should be considered as independent aspects of usability.
Second, the satisfaction scale from the previous study was used. This scale focused on all of the changes that were made to the instruction rather than on the changes that were tested in this study. The participants should have been directly asked about their satisfaction with the highlighting, navigation, and presentation of information. This was an obvious oversight in the design, which occurred mostly due to the desire to compare the satisfaction with Instruction v6.0 to satisfaction with the older versions (Instructions v4.0 and v5.5).
Third, factors other than those that were measured might influence the usability of the instruction. In addition, the usability framework, suggested by the DIN EN ISO 9241-11:1999, is not the only approach to usability. For example, Nielsen (1993) suggested the consideration of efficiency of use, learnability, memorability, errors, and satisfaction. Schneidermann (1992) suggested the examination of speed of performance, time to learn, retention over time, rate of errors by users, and subjective satisfaction. Although those approaches bear resemblance, some include or exclude various factors and suggest the use of different measures. Future efforts to investigate a broader scope of factors that influence the user’s experience can be achieved through the use of less complex methods, such as observation, interviews with the users, and questionnaires, as suggested by Nielsen (1993).

SKB R-14-06 73
In conclusion, this study suggested a new approach for measuring the usability of NDT inspection instructions and procedures. The factors that contribute to a high-quality instruction can be established through the measurement of efficiency, effectiveness, and satisfaction. Although often neglected, the users’ satisfaction with the product is of high importance because it supports the product’s frequent use. If the inspector is satisfied with the instruction and can successfully extract the needed information without extra effort and with ease, he is more likely to use it properly. Future efforts are needed to validate the current findings with a larger number of participants and to examine the impact of other influencing factors, such as other types of highlighting, understanding of tables and figures, reporting levels, level of detail, and the organisation of information, on usability.
7.5.5 Limitations of the studyIn validating the results of the current study, the following methodological issues must be overcome:
• A small number of qualified participants.
• An insufficient number of supporting images for each variable level (i.e. too few AOIs).
• Outliers (i.e. an additional decrease in the number of AOIs per variable).
• The lack of a proper full-scale pilot study.
• Overly long questions (high memory load).
• Insufficient task instruction (participants should be instructed to value accuracy and time).
• The lack of instruction on exactly where to click on the AOI.
• An overly narrow distance between sentences (causing problems for accurate mouse clicks).
• The differences in participant conditions (the participants who had previously read Instruction v6.0 held an advantage over the other participants because the experimental task consisted only of information from the new instruction, but with the formatting changed to depict the style of the old instruction. Therefore, the time that was needed to identify the information in the instruction might have been longer for participants who previously read Instruction v4.0).

SKB R-14-06 75
8 Conclusions and outlook
Four studies were conducted with the aim of developing and optimising the NDT instructions. The goals of the studies were to indicate that NDT instructions and procedures can be improved and to develop a method for achieving such improvements. For this purpose, human factors principles and a user-centred approach were employed in the development of a selected NDT instruction. This was achieved by examining the quality of the instructions from the user’s perspective and by implementing the usability perspective into the design. The goal was to develop an instruction that included all relevant information and that was usable and thus was used. The key was to identify factors that contributed to such an instruction.
The main conclusions can be summarised as follows:
• The instructions and the procedure can be improved by applying human factors principles to the design. The most important step in the development of the instructions or the procedure is to consider the user and to develop the instructions together with the users.
• The review of the instruction should be carried out through action, not solely through reading. Some problems can only be identified when an instruction is used, especially in complex cases.
• Both the instruction content and instruction format play an important role in producing reliable instructions. The instruction content aids in the understanding of the task and, consequently, in the correct execution of the inspection task. The instruction format determines the efficiency and frequency of the instruction’s use and, thus, affects satisfaction.
• The instruction content is the greatest contributor to the successful completion of an evaluation task. Attention must be given to missing information and to understanding the information.
• Understanding of the information can be affected by the information order, information organisation, logics, clarity in writing, and cognitive demands. Future research must investigate additional factors that affect understanding and develop a method for the investigation of understanding.
• The frequency of use of the instruction is affected by the users’ experience with the instruction and the task, especially by recent experience.
• Efficiency can be improved by highlighting the notes and by presenting the task steps in a stepwise manner, with only one action per step. Appropriately highlighting notes that contain warnings, exceptions, or reminders and placing them at the correct position assures that they will be read and identified with ease rather than overlooked. The presentation of the information in a stepwise manner, with one action per step, allows the user to more easily follow the steps that must be carried out to save time and effort.
The advantages and disadvantages of the applied method are as follows:
• Iterating the same steps until the expected quality is achieved is a good method for the develop-ment of NDT instructions and procedures. Such iteration relies on applying a method with the aim of determining the shortcomings in the instruction, generating possible improvements, and then reapplying the same method until the number of problems and possible preventive measures decrease to an acceptable level.
• The use of eye tracking to identify problems in the use of the instruction is beneficial in determining the error sources, especially when combined with verbal interviews in the form of the RTA method.
• The main shortcomings were observed in the methodology. A number of lessons were learned and were followed by suggestions for improvement.

76 SKB R-14-06
Outlook:
• The current study has raised many questions concerning how the quality of an instruction can be investigated and improved. Future efforts should determine the factors that affect the under-standing of the written content and the factors that improve the usability of the instruction. Future attempts should identify new potential error sources and means of preventing them as well as other factors that improve the performance in the inspection task and the users’ experience.
• The current approach towards the development of the NDT instruction has demonstrated advantages in identifying problems in the use of the instruction/procedure and in the information that is missing and overlooked during the review process. Future efforts should develop methods for identifying problems in the instructions and the required procedures through observation of users while carrying out the task, through discussions with users about usability issues or through the development of checklists and guidelines for procedure writers. Such efforts should lead to the identification and rectification of the understanding and usability issues.

SKB R-14-06 77
Acknowledgements
The authors would like to thank all of the study participants for their time, effort, and valuable insights. Our special gratitude goes to Dr. Babette Fahlbruch for sharing her expertise, providing methodological guidance, and facilitating productive discussions, which had a substantial impact on this work.

SKB R-14-06 79
References
SKB’s (Svensk Kärnbränslehantering AB) publications can be found at www.skb.se/publications.References to SKB’s unpublished documents are listed separately at the end of the reference list.Unpublished documents will be submitted upon request to [email protected].
Bainbridge L, 1987. Ironies of automation. In Rasmussen J, Duncan K, Leplat J (eds). New technology and human error. Chichester: Wiley, 271–283.
Bento J-P, 2002. Procedures as a contributing factor to events in the Swedish nuclear power plants: analysis of a database with licensee event reports 1995–1999. SKI Report 02:63, Statens kärnkraftinspekton (Swedish Nuclear Power Inspectorate).
Bertovic M, Gaal M, Müller C, Fahlbruch B, 2009. Investigating human factors in manual ultrasonic testing: testing the human factor model. In 4th European-American Workshop on Reliability of NDE, Berlin, 24–26 June 2009. Available at: http://www.ndt.net/article/reliability2009/Inhalt/th4a3.pdf.
Bertovic M, Gaal M, Müller C, Fahlbruch B, 2011. Investigating human factors in manual ultrasonic testing: testing the human factors model. Insight 53, 673–676.
Bertovic M, Fahlbruch B, Müller C, 2013. Human factors perspective on the reliability of NDT in nuclear applications. Materials Testing 55, 243–253.
Bransford J, 1979. Human cognition: learning, understanding and remembering. Belmont, CA: Wadsworth.
Bransford J D, Johnson M K, 1972. Contextual prerequisites for understanding: some investigations of comprehension and recall. Journal of Verbal Learning and Verbal Behavior 11, 717–726.
Bransford J D, Johnson M K, 1973. Considerations of some problems of comprehension. In Chase W G (ed). Visual information processing. New York: Academic Press, 383–438.
CAA, 2002. Human factors in aircraft maintenance and inspection. Report CAP 718. Norwich: UK Civil Aviation Authority.
Cowen L, Ball L J, Delin J, 2002. An eye movement analysis of web page usability. In Faulkner X, Finlay J, Detienne F (eds). People and Computers XVI – Memorable yet invisible: Proceedings of HCI 2002. London: Springer, 317–335.
de Brito G, 1998. Study of the use of Airbus flight-deck procedures and perspectives for operational documentation. In Boy G, Graeber C, Robert J M (eds). Proceedings of International Conference on Human Computer Interaction in Aeronautics (HCI-Aero’98), Montreal, Canada, 27–29 May 1998, 195–201.
de Brito G, 2002. Towards a model for the study of written procedure following in dynamic environments. Reliability Engineering & System Safety 75, 233–244.
Dekker S, 2002. The field guide to human error investigations, Aldershot: Ashgate.
DIN EN ISO 9241-11:1999. Ergonomic requirements for office work with visual display terminals (VDTs) – Part 11: Guidance on Usability. Berlin: DIN Deutsches Institut für Normung e.V.
DIN EN ISO 9241-210:2011. Ergonomics of human-system interaction – Part 210: Human-centred design for interactive systems (ISO 9241-210:2010) English translation of DIN EN ISO 9241-210:2011-01. Berlin: DIN Deutsches Institut für Normung e.V.
DIN EN ISO 9712:2012. Non-destructive testing – Qualification and certification of NDT personnel (ISO 9712:2012). English version EN ISO 9712:2012,English translation of DIN EN ISO 9712:2012-12. Berlin: DIN Deutsches Institut für Normung e.V.

80 SKB R-14-06
Enkvist J, Edland A, Svenson O, 1999. Human factors aspects of non-destructive testing in the nuclear power context: a review of research in the field. SKI Report 99:8, Statens kärnkraftinspekton (Swedish Nuclear Power Inspectorate).
Fahlbruch B, 2009. Integrating human factors in safety and reliability approaches. In 4th European-American Workshop on Reliability of NDE, Berlin, 24–26 June 2009. Available at: http://www.ndt.net/article/reliability2009/Inhalt/th4a1.pdf.
Fahlbruch B, Wilpert B, 1997. Event analysis as problem solving process. In Hale A R, Wilpert B, Freitag M (eds). After the event: from accident to organisational learning. Oxford: Pergamon, 113–130.
Frøkjær E, Hertzum M, Hornbæk K, 2000. Measuring usability: are effectiveness, efficiency, and satisfaction really correlated? In Proceedings of the SIGCHI conference on Human factors in computing systems (CHI ’00), The Hague, Netherlands, 1–6 April 2000. New York: ACM Press, 345–352.
Gaal M, Bertovic M, Zickler S, Fahlbruch B, Spokoiny V, Schombach D, Just T, Cramer H-J, 2009. Untersuchungen zum Einfluss menschlicher Faktoren auf das Ergebnis von zerstörungsfreien Prüfungen, Möglichkeiten zur Minimierung dieses Einflusses und Bewertung der Prüfergebnisse [Study of the influence of human factors on the outcome of non-destructive testing, ways to minimize ist influence, and evaluation of test results]. Salzgitter: Bundesamt für Strahlenschutz. (In German.)
Goldberg J H, Kotval X P, 1999. Computer interface evaluation using eye movements: methods and constructs. International Journal of Industrial Ergonomics 24, 631–645.
Goldberg J H, Wichansky A, 2003. Eye tracking in usability evaluation: a practitioner’s guide. In Hyönä J, Radach R, Deubel H (eds). The mind’s eye: cognitive and applied aspects of eye movement research. Amsterdam: Elsevier, 493–516.
Harris D, 1988. Human performance in nondestructive inspections and functional tests. EPRI NP-6052, Electric Power Research Institute, Palo Alto, California.
Herrin J L, Heuertz S W, 1988. Improving maintenance procedures – one utility’s perspective. In Conference Record for 1988 IEEE Fourth Conference on Human Factors and Power Plants, Monterey, California, 5–9 June 1988. New York : Institute of Electrical and Electronic Engineers, 373–377.
Holmqvist K, Nyström M, Andersson R, Dewhurst R, Jarodzka H, van de Weijer J, 2011. Eye tracking: a comprehensive guide to methods and measures: Oxford: Oxford University Press.
Hyrskykari A, Ovaska S, Majaranta P, Räihä K-J, Lehtinen M, 2008. Gaze path stimulation in retrospective think-aloud. Journal of Eye Movement Research 2, 1–18.
HSE, 1999. Reducing error and influencing behaviour. 2nd ed. Sudbury: HSE Books.
IAEA, 1998. Good practices with respect to the development and use of nuclear power plant procedures. IAEA-TECDOC-1058, International Atomic Energy Agency.
Jacob R J K, Karn K S, 2003. Eye tracking in human–computer interaction and usability research: ready to deliver the promises (Commentary on Section 4). In Hyönä J, Radach R, Deubel H (eds). The mind’s eye: cognitive and applied aspects of eye movement research. Amsterdam: Elsevier, 573–605.
Just M A, Carpenter P A, 1976. Eye fixations and cognitive processes. Cognitive Psychology 8, 441–480.
Kember D, 1996. The intention to both memorise and understand: another approach to learning? Higher Education 31, 341–354.
Kontogiannis T, 1999. Applying information technology to the presentation of emergency operating procedures: implications for usability criteria. Behaviour & Information Technology 18, 261–276.
Kwahk J, Han S H, 2002. A methodology for evaluating the usability of audiovisual consumer electronic products. Applied Ergonomics 33, 419–431.
La Porte T, 1996. High reliability organizations: unlikely, demanding and at risk. Journal of Contingencies and Crisis Management 4, 60–71.

SKB R-14-06 81
Manzey D, 2012. Systemgestaltung und Automatisierung [System design and automation]. In Badke-Schaub P, Hofinger G, Lauche K (eds). Human factors. Psychologie sicheren Handelns in Risikobranchen. 2. Aufl. Berlin: Springer, 333–352. (In German.)
McCallum M, Morgan J, Wieringa D R, Kinghorn R A, Kantowitz B H, 1994. Procedures Software Tool (PST) requirements analysis and functional description: joint EPRI–CRIEPI human factor studies. EPRI TR-103247, Electric Power Research Institute, Palo Alto, California.
McGrath B, 2008. Programme for the Assessment of NDT in Industry, PANI 3. Research Report RR617, Health and Safety Executive, UK.
McGrath B, Wheeler J, Bainbridge H, 2009. PANI and the role of the written NDT procedure. In 4th European-American Workshop on Reliability of NDE, Berlin, 24–26 June 2009. Available at: http://www.ndt.net/article/reliability2009/Inhalt/th5a1.pdf
Mosier K L, Skitka L J, 1996. Human decision makers and automated decision aids: made for each other? In Parasuraman R, Mouloua M (eds). Automation and human performance: theory and applications. Mahwah, NJ: Lawrence Erlbaum, 201–220.
Müller C, Bertovic M, Pavlovic M, Kanzler D, Rosenthal M, Pitkänen J, Ronneteg U, 2009. Progress in evaluating the reliability of NDE systems – paradigm shift. In 4th European-American Workshop on Reliability of NDE, Berlin, 24–26 June 2009. Available at: http://www.ndt.net/article/reliability2009/Inhalt/we1a2.pdf
Nielsen J, 1993. Usability engineering. Boston: AP Professional.
Nockemann C, Fortunko C, 1997. Summary of the workshop. In Proceedings of the European-American Workshop: Determination of Reliability and Validation Methods on NDE, Berlin, 18–20 June 1997, Berlin: DGZfP e.V., 11–17.
Parasuraman R, Riley V, 1997. Humans and automation: use, misuse, disuse, abuse. Human Factors: The Journal of the Human Factors and Ergonomics Society 39, 230–253.
Pavlovic M, Takahashi K, Müller C, Boehm R, Ronneteg U, 2008. NDT reliability – Final report. Reliability in non-destructive testing (NDT) of the canister components. SKB R-08-129 Svensk Kärnbränslehantering AB.
Poole A, Ball L J, 2005. Eye tracking in human-computer interaction and usability research: current status and future prospects. In Ghaoui C (ed). Encyclopedia of human computer interaction. Hershey, PA: Idea Group, 211–219.
Reason J T, 1997. Managing the risks of organizational accidents. Aldershot: Ashgate.
Schneiderman B, 1992. Designing the user interface: strategies for effective human–computer interaction. 2nd ed. Reading, MA: Addison-Wesley.
SKB, 2013. RD&D Programme 2013. Programme for research, development and demonstration of methods for the management and disposal of nuclear waste. SKB TR-13-18, Svensk Kärnbränslehantering AB.
Spiker A, 1997. A process for measuring the usability of plant procedures. In Gertman D I, Schurman D L, Blackman H S (eds). Proceedings of the 1997 IEEE Sixth Conference on Human Factors and Power Plants: global perspectives of human factors in power generation. Orlando, Florida, 8–13 June 1997. New York : Institute of Electrical and Electronic Engineers, 10/1–10/5.
Stephens H M, 2000. NDE reliability – human factors – basic considerations. In Proceedings of the 15th World Conference on Non-Destructive Testing, Rome, 15–21 October 2000. Available at: http://www.ndt.net/article/wcndt00/papers/idn736/idn736.htm
Sternberg R J, 2009. Cognitive psychology. 5th ed. Belmont, CA: Thomson/Wadsworth.
Trump T R, Stave A M, 1988. Why “what” isn’t “how”: a new approach to procedure writing (nuclear power stations). In Conference Record for 1988 IEEE Fourth Conference on Human Factors and Power Plants, Monterey, California, 5–9 June 1988. New York : Institute of Electrical and Electronic Engineers, 378–383.
Wickens C D, Lee J, Liu Y D, Gordon Becker S E, 2004. An introduction to human factors engineering. 2nd ed. Upper Saddle River, NJ: Prentice Hall.

82 SKB R-14-06
Zülch G, Stowasser S, 2000. Usability evaluation of user interfaces with the computer-aided evaluation tool PROKUS. MMI-Interaktiv 3, 1–17.
Unpublished documents.
SKBdoc id, version Title Issuer, year
1427252 ver 1.0 Identifying and managing risks in mechanised NDT: a human factors study SKB, 2014
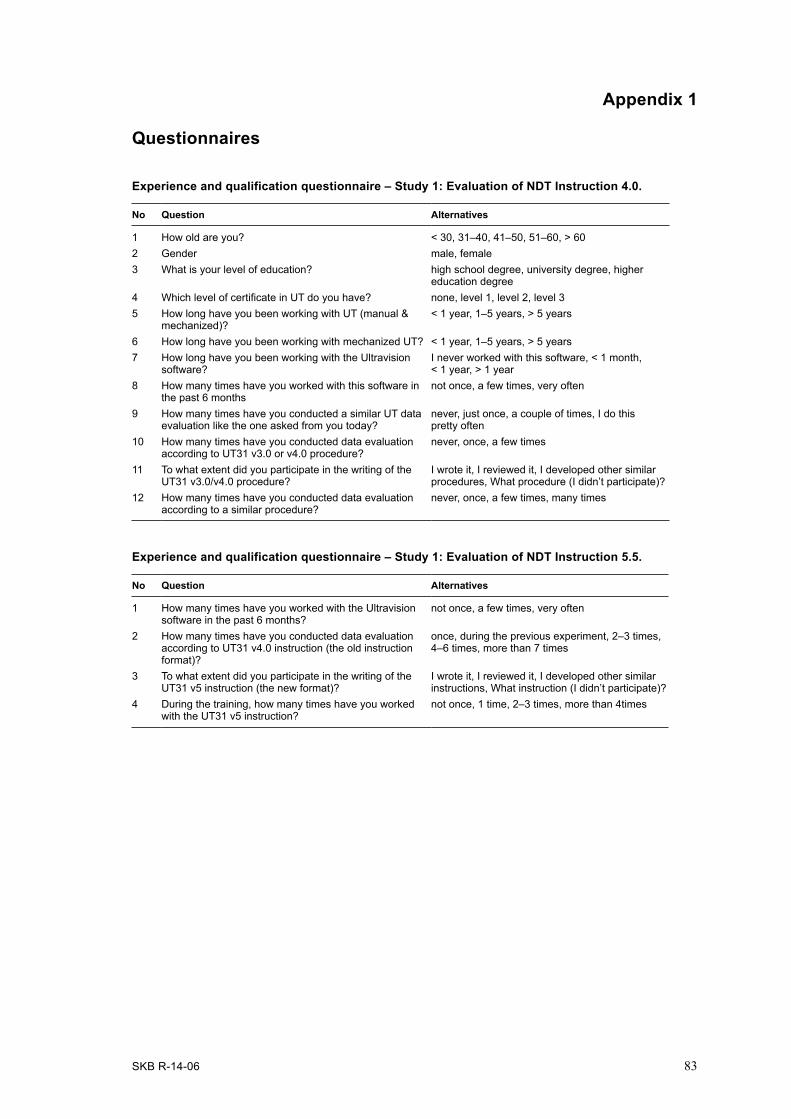
SKB R-14-06 83
Appendix 1
Questionnaires
Experience and qualification questionnaire – Study 1: Evaluation of NDT Instruction 4.0.
No Question Alternatives
1 How old are you? < 30, 31–40, 41–50, 51–60, > 602 Gender male, female3 What is your level of education? high school degree, university degree, higher
education degree4 Which level of certificate in UT do you have? none, level 1, level 2, level 35 How long have you been working with UT (manual &
mechanized)?< 1 year, 1–5 years, > 5 years
6 How long have you been working with mechanized UT? < 1 year, 1–5 years, > 5 years7 How long have you been working with the Ultravision
software?I never worked with this software, < 1 month, < 1 year, > 1 year
8 How many times have you worked with this software in the past 6 months
not once, a few times, very often
9 How many times have you conducted a similar UT data evaluation like the one asked from you today?
never, just once, a couple of times, I do this pretty often
10 How many times have you conducted data evaluation according to UT31 v3.0 or v4.0 procedure?
never, once, a few times
11 To what extent did you participate in the writing of the UT31 v3.0/v4.0 procedure?
I wrote it, I reviewed it, I developed other similar procedures, What procedure (I didn’t participate)?
12 How many times have you conducted data evaluation according to a similar procedure?
never, once, a few times, many times
Experience and qualification questionnaire – Study 1: Evaluation of NDT Instruction 5.5.
No Question Alternatives
1 How many times have you worked with the Ultravision software in the past 6 months?
not once, a few times, very often
2 How many times have you conducted data evaluation according to UT31 v4.0 instruction (the old instruction format)?
once, during the previous experiment, 2–3 times, 4–6 times, more than 7 times
3 To what extent did you participate in the writing of the UT31 v5 instruction (the new format)?
I wrote it, I reviewed it, I developed other similar instructions, What instruction (I didn’t participate)?
4 During the training, how many times have you worked with the UT31 v5 instruction?
not once, 1 time, 2–3 times, more than 4times

84 SKB R-14-06
Experience and qualification questionnaire – Empirical study (understanding and usability).
No Question Alternatives
1 How old are you? < 30 years old, 30–49 years old, > 50 years old2 Gender male, female3 What level of qualification in UT do you have? level 1, level 2, level 3, I have no qualification4 How many years have you been working with UT? I have no experience, < 1 year, 1–5 years, 5–10 years,
> 10 years5 How much experience do you have with
mechanised UT?no experience, < 1 year, 1–10 years, > 10 years
6 How much experience do you have with data evaluation?
I have never analysed data, I have done it once or twice, < than 10 times, > than 10 times
7 Have you ever analysed data according to an inspection procedure?
yes, no
8 Have you ever analysed data according to this or a similar procedure?
yes, no
9 Have you participated in our previous studies on the inspection procedure/instruction?
yes, no
10 What is your primary language? English, Swedish, German, Finnish, other11 How proficient are you in the English language? Beginner, Intermediate, Advanced
User satisfaction questionnaire (used in all three studies).
not satisfied very satisfied
Length 1 2 3 4 5 6Level of detail 1 2 3 4 5 6Amount of information 1 2 3 4 5 6Quality of the information 1 2 3 4 5 6User friendliness 1 2 3 4 5 6Finding information 1 2 3 4 5 6Information clarity 1 2 3 4 5 6Figures 1 2 3 4 5 6Tables 1 2 3 4 5 6Headers 1 2 3 4 5 6Figure names 1 2 3 4 5 6Table names 1 2 3 4 5 6Numbering 1 2 3 4 5 6Bulleting 1 2 3 4 5 6Font size 1 2 3 4 5 6Making good use of open space 1 2 3 4 5 6Colour use 1 2 3 4 5 6Easy to read 1 2 3 4 5 6Page breaks 1 2 3 4 5 6Distinction between steps 1 2 3 4 5 6Use of active/passive voice 1 2 3 4 5 6Sentence complexity 1 2 3 4 5 6Highlighting of information 1 2 3 4 5 6Meeting the needs of inexperienced users 1 2 3 4 5 6Sequence of information 1 2 3 4 5 6Organisation of chapters 1 2 3 4 5 6Meeting your expectations 1 2 3 4 5 6
How satisfied are you overall with the instruction? 1 2 3 4 5 6
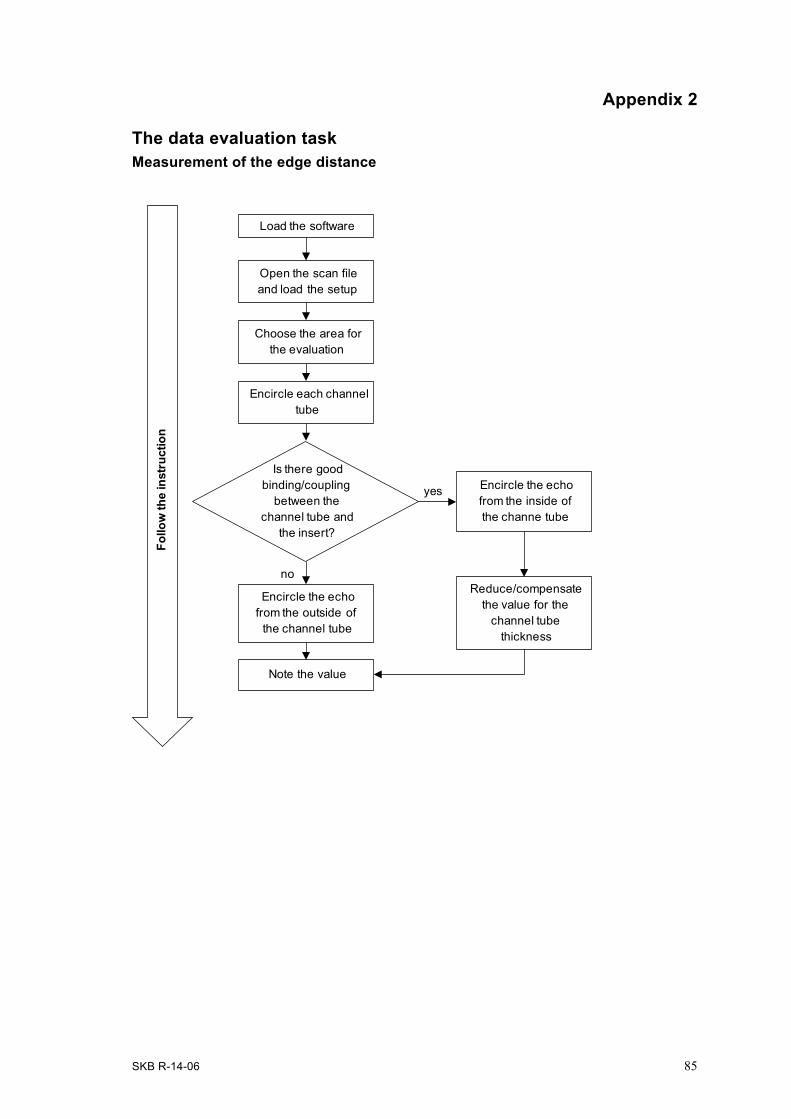
SKB R-14-06 85
Appendix 2
The data evaluation taskMeasurement of the edge distance
Note the value
Reduce/compensate the value for the
channel tube thickness
Encircle the echo from the inside of the channe tube
Encircle the echo from the outside of
the channel tube
Encircle each channel tube
Choose the area for the evaluation
Open the scan file and load the setup
Load the software
Follo
w th
e in
stru
ctio
n
Is there good binding/coupling
between the channel tube and
the insert?
no
yes
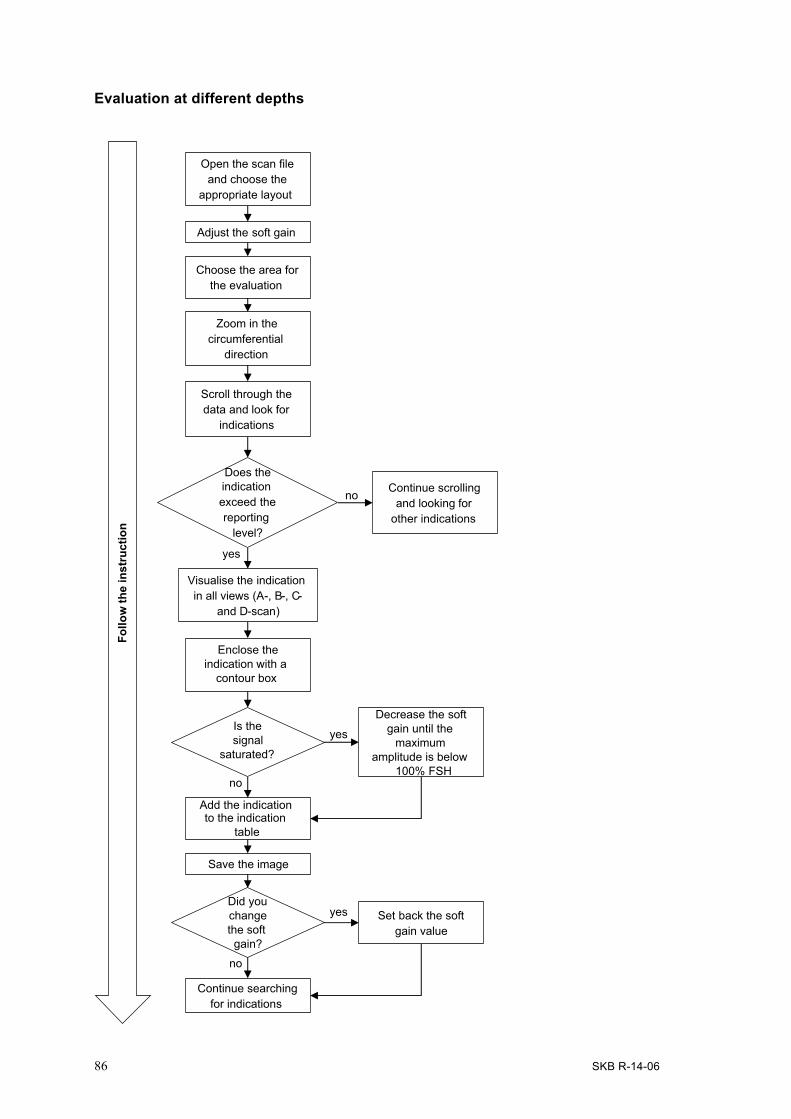
86 SKB R-14-06
Evaluation at different depthsFo
llow
the
inst
ruct
ion
Open the scan file and choose the
appropriate layout
Enclose the indication with a
contour box
Continue scrolling and looking for
other indications
Visualise the indication in all views (A-, B-, C-
and D-scan)
Scroll through the data and look for
indications
Zoom in the circumferential
direction
Adjust the soft gain
Choose the area for the evaluation
Does the indication exceed the reporting
level?
no
yes
Is the signal
saturated?
Continue searching for indications
Add the indication to the indication
table
Decrease the soft gain until the
maximum amplitude is below
100% FSH no
yes
Save the image
Did you change the soft gain?
no
yes Set back the soft gain value

SKB R-14-06 87
Appendix 3
NDT instruction development – analysis of data
Errors, causes of errors, and preventive measures identified during the NDT instruction develop-ment – Study 1: Evaluation of NDT Instruction v4.0.
No. Error Cause Comment Preventive measure
1 Incorrectly interpreting values from the edge distance measure-ments;
Instruction, training
Lack of information in the instruction. The inspectors have not been trained on how to evaluate devia-tions from “normal” results
Show various examples in the instruction (placing these in the Appendix to maintain the short length of the instruction). Include “all” cases in the training.
2 Incorrectly setting the gates in the axial direction in the edge distance measurements
Instruction, training, false expectation
Lack of information in the instruction. Insufficient trainingExpectation that the software updates both channels
Update the instruction Part of the trainingSoftware improvement (software should update automatically)
3 Incorrectly setting the gates in the axial direc-tion at different depths1
Not following the instruction
This error typically does not occur because no specific evaluation area is pre-defined.
Highlight the evaluation area in the instruction (part of the PANI3).
4 Incorrectly identifying clusters
Instruction, training
The identification of clusters is one of the most difficult tasks in this evalu-ation. The definition of clusters is insufficient in the instruction, and the training did not focus on this matter.
Extend the instruction with more clear definitions of clusters and include several examples (add to the Appendix).Part of the training
5 Using incorrect gain settings (due to the lack of an agreement about how to round values)
Instruction, software
It is not clear how the gain settings should be rounded if the values in the Excel table cannot be entered in the software.
Clarify in the instruction how the round up should be done and include this calculation in the Excel sheet.Determine if it is possible to enter more accurate gain values in the software.
6 Using the wrong zoom Not following the instruction
The inspectors zoomed a larger area than was specified in the instruction.
Training and clarifications in the instruction – it should be explained in the instruction WHY a specific zoom is necessary
7 Not viewing the D-scan Instruction, training
It is not stated that the inspector should view the D-scan during the evaluation. It is stated that the print screens should visualise the indica-tions in the D-scan.
Update the instruction Part of the training
8 Incorrectly setting the gates during the evalua-tion of defects
Not following the instruction
Due to incorrect gate settings, a larger amount of data was shown in the B-scan, which resulted in a more difficult evaluation and the risk of misinterpreted indications.
Highlight the gate settings in the instruction.Part of the training
9 Forgetting to reset the gate settings
Inspector Inspector mistake of forgetting to reset gate settings after the visuali-sation of indications.
Training. Awareness of the inspectorHighlight in the instruction
10 Not including the whole indication (outside the gate)
Instruction, inspector
If the whole indication is not included in the gate, this leads to missing data in the B- or D-scan. This can lead to incorrect results.
Update the instruction Part of the training
11 Incorrectly setting the contour around the indication
Instruction, inspector
If the contour does not cover the whole indication or is set too large, missing or incorrect indication values can be recorded.
Update the instruction Part of the training
12 Incorrectly interpreting indications near the channels
Instruction, training
The area near the channel tubes is difficult to evaluate, and the criteria are not clear.
Update the instruction with exam-ples of indications; add examples of what it IS and what it NOT an indication into the Appendix).

88 SKB R-14-06
No. Error Cause Comment Preventive measure
13 Not waiting for the con-tour values to refresh
Inspector, training
The inspector is unaware of whether the values from the indication are updated.
Training. Awareness of the inspectorHighlight in the instructionSoftware improvement (introduce a sand-clock that indicates the values that are being updated)
14 Reading incorrect val-ues (size vs. amplitude) – 2 errors
Inspector The inspector has made a mistake in reading the wrong values.
Training. Awareness of the inspectorHighlight the need to consider both amplitude and size in the instruction
15 Missing defects2 Inspector The inspector can miss the detection of indications. This might be due to incorrect gate settings, incorrect contour, incorrect gain settings, lapses, etc.
Training. Awareness of the inspector
16 Sizing errors3 Inspector The inspector can size indications incorrectly. This might be due to incorrect gate settings, an incorrect contour, incorrect gain settings, lapses, etc.
Training. Awareness of the inspector
17 Incorrectly interpreting indications outside the gate
Instruction, training
Inspectors reported indications with high amplitude outside of the inspection range. The instruction is not clear concerning how this case should be handled. However, this is a “positive” error.
Update the instruction Part of the training
1 This would not happen in reality; thus, it should be excluded from any further evaluation.2 Could be an error or an effect/consequence of a previous error.3 See above.

SKB R-14-06 89
Errors, causes of errors and preventive measures identified during the NDT instruction develop-ment – Study 2 (follow-up): Evaluation of NDT Instruction v5.5.
No. Error Re- occurrence
Cause Comment Preventive measure
1 Incorrectly setting the gates in the axial direction in the edge distance measurements
Yes InstructionTraining
Misinterpreted the echoes from the channel tubes
Instruction (NOT CHANGED)Training
2 Incorrectly setting the gates in the axial direction in the edge distance measurements
No Indicated more clearly in the instruction
3 Incorrectly identifying clusters
No Training
4 Using incorrect gain settings (due to the lack of an agreement about how to round values)
No Included in the instruc-tion
5 Using the wrong zoom Yes Inspector It is highlighted in the instruction, but one inspector had a problem with it. Stress, tiredness, experimental situation might have led to confusion.
Optimise working conditions (e.g. avoid placing the inspectors outside their daily routine)
6 Not using other views Yes InstructionTraining
Instruction tells the inspector to use the other views only to do a good screen capture, not to use it during evaluation. The participants were instructed to use tall views in the training before, but perhaps they did not understand/it was not sufficiently explained WHY it is useful.
Add to instructionTraining – create training material based on the instruction that can be used during the training that includes more hints and notes and reasons WHY some tasks are necessary, than in the final instruction to be used during the evaluation
7 Incorrectly setting the gates during the evalua-tion of defects
Yes InspectorSoftware training
The inspector mistyped values for the gates (lapse). He was not aware of being in the wrong area (had to be told); his error is due to inexperience
Training
8 Forgetting to reset the gate settings
No Awareness
9 Forgetting to reset the gain settings
No Awareness
10 Not including the whole indication (outside the gate)
No Awareness
11 Incorrectly setting the con-tour around the indication
Yes (but to a lesser degree)
InstructionInspector
Carelessness of the inspec-tor, not stated clearly in the instruction
Add to the instructionEmphasise during training
12 Not waiting for the contour values to refresh
No Awareness
13 Reading the wrong values (size vs. amplitude) 2 errors
No NA
14 Missing defects1 Yes Inspector Not examining the whole inspection area; incorrect zooming; incorrect interpre-tation
Training in the evaluationOptimal working conditions
15 Incorrect sizing of defects Yes Inspector Not reducing the gain (saturated signal). This part was in the Instruction v.4 but was not in the new Instruction v.5.Incorrect set up of the contour box
Training in the evaluationAdd to the instruction how to deal with the saturated signals
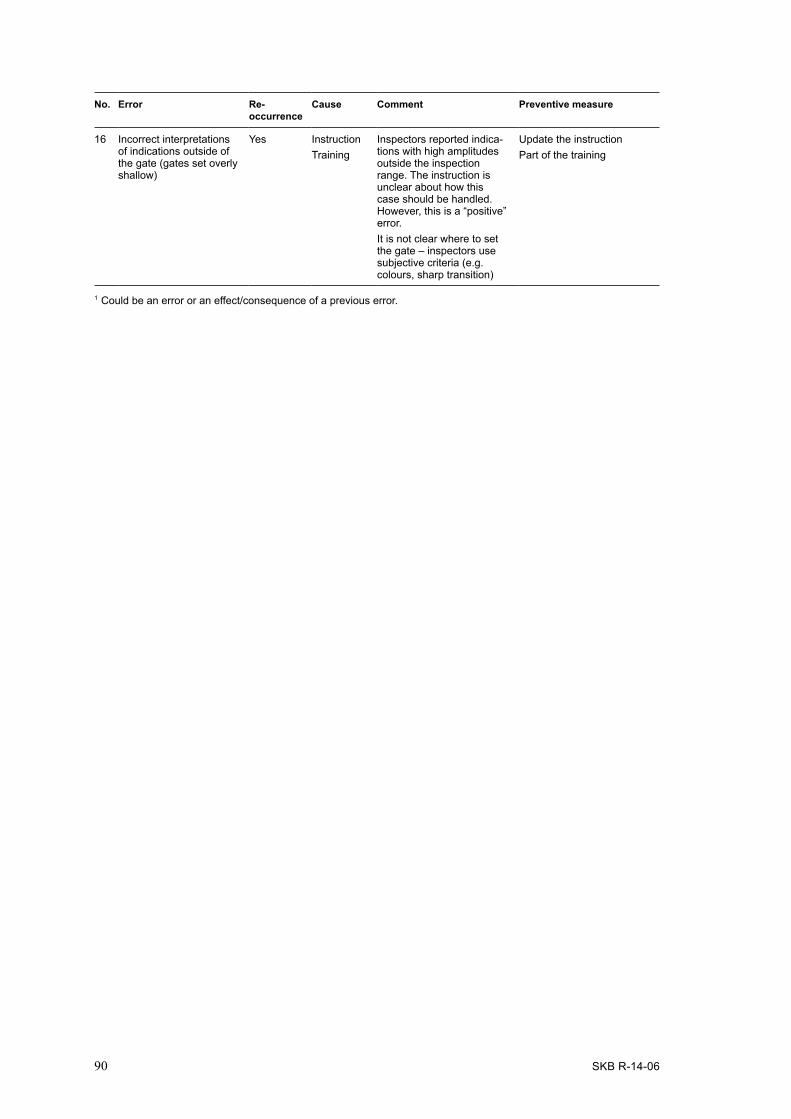
90 SKB R-14-06
No. Error Re- occurrence
Cause Comment Preventive measure
16 Incorrect interpretations of indications outside of the gate (gates set overly shallow)
Yes InstructionTraining
Inspectors reported indica-tions with high amplitudes outside the inspection range. The instruction is unclear about how this case should be handled. However, this is a “positive” error.It is not clear where to set the gate – inspectors use subjective criteria (e.g. colours, sharp transition)
Update the instruction Part of the training
1 Could be an error or an effect/consequence of a previous error.

SKB R-14-06 91
Appendix 4
Empirical study – tools
Questions in the understanding study (correct answers are marked in green).
Part Q Question Instruction v6.0 Instruction v4.0Alternatives Alternatives
1 1 In the edge distance measurement: If there is good coupling/binding between the PWR insert material and the channel tubes, what actions should you take?
Reduce value by 12.5 mm, Increase by 12.5 mm, Reduce for 10 mm, Increase by 10 mm, No action needed
Reduce value by 12.5 mm, Increase by 12.5 mm, Reduce for 10 mm, Increase by 10 mm, no action needed
2 In the evaluation at a depth of 110–210 mm: What size of reference defects is used?
SDH (side drilled hole) 2 mm, SDH 4 mm, FBH (flat bottom hole) 2 mm, FBH 4 mm
SDH (side drilled hole) 2 mm, SDH 4 mm, FBH (flat bottom hole) 2 mm, FBH 4 mm
3 How many focus depth ranges are covered by this inspection?
1, 2, 3, 4 1, 2, 3, 4
4 What length of the insert is NOT covered by this inspection?
67 mm, 134 mm, The whole length of the insert is covered
59 mm, 118 mm, The whole length of the insert is covered
2 5 What reporting threshold shall be used if the noise level is 30%?
> 50% FSH (full screen height), > 80% FSH, SNR >2, It is not possible to evaluate
> 50% FSH (full screen height), > 80% FSH, SNR >2, It is not possible to evaluate
6 Which amplitude reporting level shall be used for an indication of the size 30 mm in the axial direction and 3° in the circumferential direction?
> 50% FSH, > 80% FSH, SNR > 2
> 50% FSH, > 80% FSH, SNR > 2
7 Which ultrasonic views shall be used during evaluation of an indication?
It is not clear in the instruction, Evaluate in B-scan, Evaluate in several views
It is not clear in the instruction, Evaluate in B-scan, Evaluate in several views
8 Which primary view shall be used for the detection of indications?
It is not clear in the instruction, A-scan, B-scan, C-scan, D-scan
It is not clear in the instruction, A-scan, B-scan, C-scan, D-scan
9 What is the measurement of the edge distance?
Thickness from the cast iron surface to the channel tubes, Material thickness with the channel tubes, Distance between two channel tubes
Thickness from the cast iron surface to the channel tubes, Material thickness with the channel tubes, Distance between two channel tubes
10 Is there any difference in the evaluation of the PWR and BWR? What depth range shall be evaluated between the channel tubes for a BWR insert?
No difference, Longer depth range for PWR, Longer depth range for BWR
No difference, Longer depth range for PWR, Longer depth range for BWR

92 SKB R-14-06
Questions in the understanding study (correct answers are marked in green).
Part Q Question Answer Information in Instruction v6.0 Information in Instruction v4.0
3 11 In the measurement of the edge distance – How can you see that there is bad bonding (connection) between the insert and the channel tubes?
There is a clear echo from the outside of the channel tube.
If there is good ultrasonic coupling between the channel tube and the insert, no clear echo from the outside of the channel tube will be received
If there is good binding between the channel tube and the insert, no echo from the outside of the channel tube will be achieved. In this case, the echo from the inside of the channel tube shall be used instead, as shown in Figure 5 and this shall be noted in the evalua-tion table.
12 In the evaluation at depth 45–110 mm – When shall an indication of a size of 15 mm in the axial direction be reported?
If the amplitude is above 80% or if the size is larger than 2° in circumferential direction and have an amplitude above 40%
The reporting levels that shall be applied are:• Indications larger than 10 mm in axial direction and 2° in circumferential direction shall be reported if they have higher maximum amplitude than 40% FSH.• Indications with maximum amplitude higher than 80% FSH shall be reported regard-less of size.
The reporting levels are: 1. Indications greater than 10 mm in the axial direction and greater than 2° in the circumferential direction. These shall be reported if they have greater amplitude than the 40% FSH. If the indication is a cluster it shall be marked as “Merged” under “State” in the indication table. 2. Indications with amplitude greater than 80% FSH shall be reported regardless of size. If the indication is judged as a cluster it shall be marked as “Merged” under “State” in the indication table. Otherwise it shall be marked as a “Flaw”.
13 Which depth range is accepted for the reference defect ID No. 6?
±1.5 mm or 98.5–101.5 mm
14 How many reference defects are used in the depth range of 5–45 mm?
4
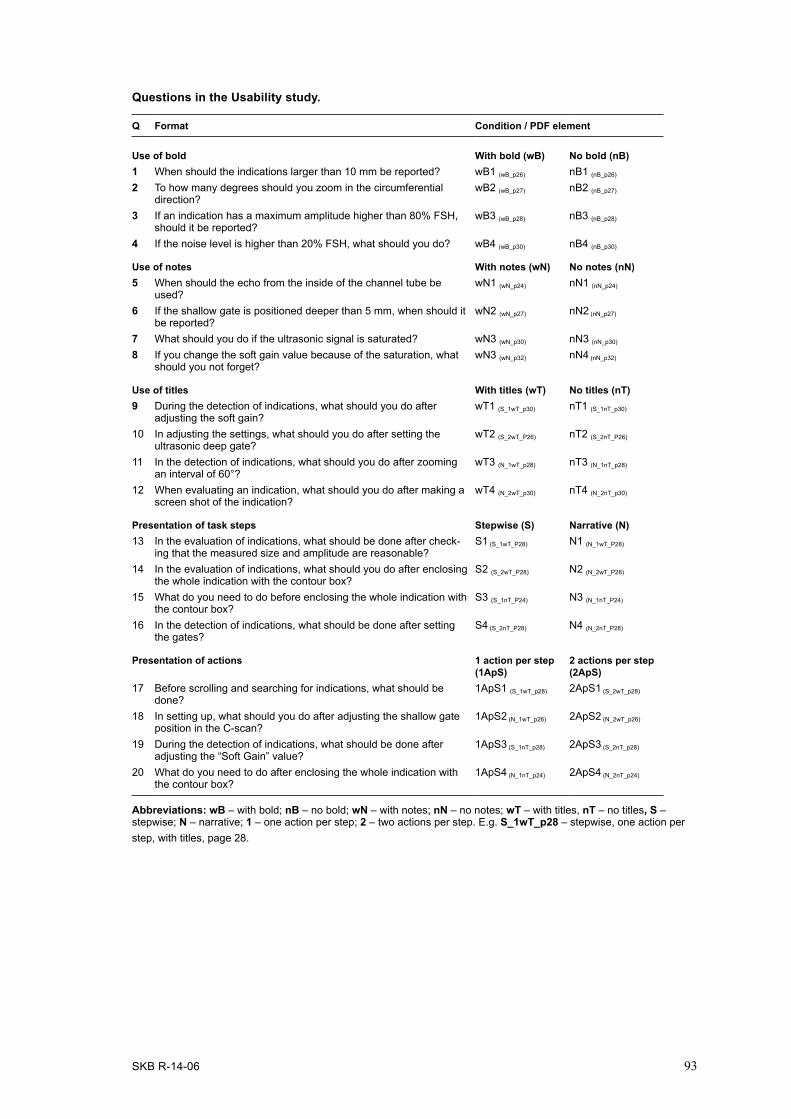
SKB R-14-06 93
Questions in the Usability study.
Q Format Condition / PDF element
Use of bold With bold (wB) No bold (nB)1 When should the indications larger than 10 mm be reported? wB1 (wB_p26) nB1 (nB_p26)
2 To how many degrees should you zoom in the circumferential direction?
wB2 (wB_p27) nB2 (nB_p27)
3 If an indication has a maximum amplitude higher than 80% FSH, should it be reported?
wB3 (wB_p28) nB3 (nB_p28)
4 If the noise level is higher than 20% FSH, what should you do? wB4 (wB_p30) nB4 (nB_p30)
Use of notes With notes (wN) No notes (nN)5 When should the echo from the inside of the channel tube be
used? wN1 (wN_p24) nN1 (nN_p24)
6 If the shallow gate is positioned deeper than 5 mm, when should it be reported?
wN2 (wN_p27) nN2 (nN_p27)
7 What should you do if the ultrasonic signal is saturated? wN3 (wN_p30) nN3 (nN_p30)
8 If you change the soft gain value because of the saturation, what should you not forget?
wN3 (wN_p32) nN4 (nN_p32)
Use of titles With titles (wT) No titles (nT)9 During the detection of indications, what should you do after
adjusting the soft gain? wT1 (S_1wT_p30) nT1 (S_1nT_p30)
10 In adjusting the settings, what should you do after setting the ultrasonic deep gate?
wT2 (S_2wT_P26) nT2 (S_2nT_P26)
11 In the detection of indications, what should you do after zooming an interval of 60°?
wT3 (N_1wT_p28) nT3 (N_1nT_p28)
12 When evaluating an indication, what should you do after making a screen shot of the indication?
wT4 (N_2wT_p30) nT4 (N_2nT_p30)
Presentation of task steps Stepwise (S) Narrative (N)13 In the evaluation of indications, what should be done after check-
ing that the measured size and amplitude are reasonable? S1 (S_1wT_P28) N1 (N_1wT_P28)
14 In the evaluation of indications, what should you do after enclosing the whole indication with the contour box?
S2 (S_2wT_P28) N2 (N_2wT_P28)
15 What do you need to do before enclosing the whole indication with the contour box?
S3 (S_1nT_P24) N3 (N_1nT_P24)
16 In the detection of indications, what should be done after setting the gates?
S4 (S_2nT_P28) N4 (N_2nT_P28)
Presentation of actions 1 action per step (1ApS)
2 actions per step (2ApS)
17 Before scrolling and searching for indications, what should be done?
1ApS1 (S_1wT_p28) 2ApS1 (S_2wT_p28)
18 In setting up, what should you do after adjusting the shallow gate position in the C-scan?
1ApS2 (N_1wT_p26) 2ApS2 (N_2wT_p26)
19 During the detection of indications, what should be done after adjusting the “Soft Gain” value?
1ApS3 (S_1nT_p28) 2ApS3 (S_2nT_p28)
20 What do you need to do after enclosing the whole indication with the contour box?
1ApS4 (N_1nT_p24) 2ApS4 (N_2nT_p24)
Abbreviations: wB – with bold; nB – no bold; wN – with notes; nN – no notes; wT – with titles, nT – no titles, S – stepwise; N – narrative; 1 – one action per step; 2 – two actions per step. E.g. S_1wT_p28 – stepwise, one action per step, with titles, page 28.

SK
B R
-14-06 95
Appendix 5
Usability study – examples of imagesExamples of pages with and without formatting in the style of Instruction v6.0 (changes are either zoomed in or indicated with an arrow).
No bold (nB) With bold (wB)1217826 Ultrasonic inspection of cast iron insert, UT31 Internal information 6.0 Approved Page 26
6.4 Evaluation in the depth range 5-45 mm
6.4.1 Reporting levels in the depth range 5-45 mm
The reporting levels that shall be applied are:
6.4.2 Settings in the depth range depth 5-45 mm
3. Adjust the "Soft Gain" to: 23,0 dB4. Set the ultrasonic deep gate in the C-scan at the depth of 20 mm, see figure 6-6.
Figure 6-6. Ultrasonic gate settings in the C-scan.
2. Choose the layout "Analysis 5-45 mm".
In this section the depth range 5-45 mm is evaluated. As the appearance of the surface echo strongly varies due to the surface structure, the noise level in this region may exceed the acceptable level. A gate will be placed in radial direction to exclude the surface echo. If the noise level in the surface region is high, the section from 5 mm to the shallow gate position shall be evaluated by specific settings, see last point in section 6.4.1.
5. Adjust the shallow gate position in the C-scan so that a "95 percentil" value just below 30% is achieved.6. Note the shallow ultrasonic gate position in the Comments sheet (App. 5).7. Set the ultrasonic deep gate in the C-scan to the position 45 mm depth.
Note: If the noise level is greater than 25% FSH, a special detection level is applied. In this case a SNR above 2 shall be used and this shall be noted in the Comments sheet (App. 5).
• Indications larger than 10 mm in axial direction and 2° in circumferential direction shall be reported if they have higher maximum amplitude than 50% FSH. • Indications with maximum amplitude higher than 80% FSH shall be reported regardless of size. • If the shallow ultrasonic gate is positioned deeper than 5 mm in section 6.4.2 due to high noise level, the reporting level in the area between 5 mm and the shallow gate is a SNR equal to 2.
1. Open the first scan file according table 4-2.
The reporting levels are based on the amplitude level recorded from the 2 mm side drilled holes but if the noise level exceed the acceptable level, the reporting level is based on the SNR. Sizing of indications is done by using the 6 dB drop method.
1217826 Ultrasonic inspection of cast iron insert, UT31 Internal information 6.0 Approved Page 26
6.4 Evaluation in the depth range 5-45 mm
6.4.1 Reporting levels in the depth range 5-45 mm
The reporting levels that shall be applied are:
6.4.2 Settings in the depth range depth 5-45 mm
3. Adjust the "Soft Gain" to: 23,0 dB4. Set the ultrasonic deep gate in the C-scan at the depth of 20 mm, see figure 6-6.
Figure 6-6. Ultrasonic gate settings in the C-scan.
2. Choose the layout "Analysis 5-45 mm".
In this section the depth range 5-45 mm is evaluated. As the appearance of the surface echo strongly varies due to the surface structure, the noise level in this region may exceed the acceptable level. A gate will be placed in radial direction to exclude the surface echo. If the noise level in the surface region is high, the section from 5 mm to the shallow gate position shall be evaluated by specific settings, see last point in section 6.4.1.
5. Adjust the shallow gate position in the C-scan so that a "95 percentil" value just below 30% is achieved.6. Note the shallow ultrasonic gate position in the Comments sheet (App. 5).7. Set the ultrasonic deep gate in the C-scan to the position 45 mm depth.
Note: If the noise level is greater than 25% FSH, a special detection level is applied. In this case a SNR above 2 shall be used and this shall be noted in the Comments sheet (App. 5).
• Indications larger than 10 mm in axial direction and 2° in circumferential direction shall be reported if they have higher maximum amplitude than 50% FSH.• Indications with maximum amplitude higher than 80% FSH shall be reported regardless of size. • If the shallow ultrasonic gate is positioned deeper than 5 mm in section 6.4.2 due to high noise level, the reporting level in the area between 5 mm and the shallow gate is a SNR equal to 2.
1. Open the first scan file according table 4-2.
The reporting levels are based on the amplitude level recorded from the 2 mm side drilled holes but if the noise level exceed the acceptable level, the reporting level is based on the SNR. Sizing of indications is done by using the 6 dB drop method.
llow gate is a
26
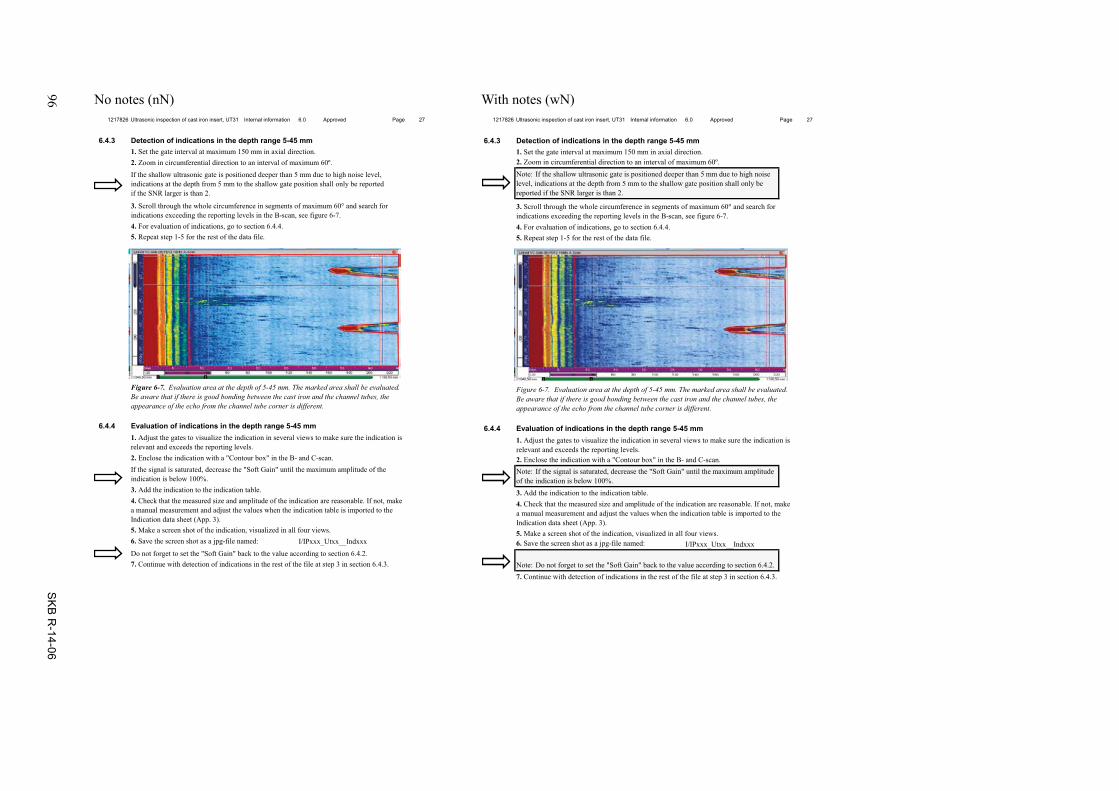
96 S
KB
R-14-06
No notes (nN) With notes (wN)1217826 Ultrasonic inspection of cast iron insert, UT31 Internal information 6.0 Approved Page 27
6.4.3 Detection of indications in the depth range 5-45 mm
6.4.4 Evaluation of indications in the depth range 5-45 mm
5. Make a screen shot of the indication, visualized in all four views.6. Save the screen shot as a jpg-file named: I/IPxxx_Utxx__Indxxx
7. Continue with detection of indications in the rest of the file at step 3 in section 6.4.3.
1. Set the gate interval at maximum 150 mm in axial direction.2. Zoom in circumferential direction to an interval of maximum 60º.Note: If the shallow ultrasonic gate is positioned deeper than 5 mm due to high noise level, indications at the depth from 5 mm to the shallow gate position shall only be reported if the SNR larger is than 2.
3. Scroll through the whole circumference in segments of maximum 60° and search for indications exceeding the reporting levels in the B-scan, see figure 6-7.4. For evaluation of indications, go to section 6.4.4.5. Repeat step 1-5 for the rest of the data file.
Figure 6-7. Evaluation area at the depth of 5-45 mm. The marked area shall be evaluated. Be aware that if there is good bonding between the cast iron and the channel tubes, the appearance of the echo from the channel tube corner is different.
1. Adjust the gates to visualize the indication in several views to make sure the indication is relevant and exceeds the reporting levels.2. Enclose the indication with a "Contour box" in the B- and C-scan.Note: If the signal is saturated, decrease the "Soft Gain" until the maximum amplitude of the indication is below 100%.
4. Check that the measured size and amplitude of the indication are reasonable. If not, make a manual measurement and adjust the values when the indication table is imported to the Indication data sheet (App. 3).
Note: Do not forget to set the "Soft Gain" back to the value according to section 6.4.2.
3. Add the indication to the indication table.
1217826 Ultrasonic inspection of cast iron insert, UT31 Internal information 6.0 Approved Page 27
6.4.3 Detection of indications in the depth range 5-45 mm
6.4.4 Evaluation of indications in the depth range 5-45 mm
5. Make a screen shot of the indication, visualized in all four views.6. Save the screen shot as a jpg-file named: I/IPxxx_Utxx__Indxxx
7. Continue with detection of indications in the rest of the file at step 3 in section 6.4.3.
4. Check that the measured size and amplitude of the indication are reasonable. If not, make a manual measurement and adjust the values when the indication table is imported to the Indication data sheet (App. 3).
Do not forget to set the "Soft Gain" back to the value according to section 6.4.2.
3. Add the indication to the indication table.
5. Repeat step 1-5 for the rest of the data file.
Figure 6-7. Evaluation area at the depth of 5-45 mm. The marked area shall be evaluated. Be aware that if there is good bonding between the cast iron and the channel tubes, the appearance of the echo from the channel tube corner is different.
1. Adjust the gates to visualize the indication in several views to make sure the indication is relevant and exceeds the reporting levels.2. Enclose the indication with a "Contour box" in the B- and C-scan.If the signal is saturated, decrease the "Soft Gain" until the maximum amplitude of the indication is below 100%.
1. Set the gate interval at maximum 150 mm in axial direction.2. Zoom in circumferential direction to an interval of maximum 60º.If the shallow ultrasonic gate is positioned deeper than 5 mm due to high noise level, indications at the depth from 5 mm to the shallow gate position shall only be reported if the SNR larger is than 2.
3. Scroll through the whole circumference in segments of maximum 60° and search for indications exceeding the reporting levels in the B-scan, see figure 6-7.4. For evaluation of indications, go to section 6.4.4.

SK
B R
-14-06 97
No (sub) titles (nT) With (sub) titles (wT)1217826 Ultrasonic inspection of cast iron insert, UT31 Internal information 6.0 Approved Page 28
6.5 Evaluation in the depth range 45-110 mm
6.5.1 Reporting levels in the depth range 45-110 mm
The reporting levels that shall be applied are:
6.5.2 Detection of indications in the depth range 45-110 mm
6.5.3 Evaluation of indications in the depth range 45-110 mm
In this section, the depth range 45-110 mm is evaluated. In the BWR insert, support plates may give indications regularly in axial direction around the depth of 100 mm.
The reporting levels are based on the amplitude level recorded from the 2 mm side drilled holes. Sizing of indications is done by using the 6 dB drop method. If the noise level is higher than 20% FSH, discuss with the system responsible if the volume is possible to be evaluated and which reporting level that shall be used.
• Indications larger than 10 mm in axial direction and 2° in circumferential direction shall be reported if they have higher maximum amplitude than 40% FSH.
The insert shall be evaluated at the depth interval 45-110 mm, see figure 6-8 and 6-9. The exception is the volume between the channels in the BWR insert that shall be evaluated at the depth interval 45-105 mm, see figure 6-9.
Choose the layout "Analysis 45-110 mm". Adjust the "Soft Gain" to: 24 dB. Set the gate interval at maximum 150 mm in the axial direction. Zoom an interval in the circumferential direction of maximum 60º. Scroll through the whole circumference in segments of maximum 60° and search for indications exceeding the reporting levels in the B-scan, see figure 6-8 and 6-9. For evaluation of indications, go to section 6.5.3. Repeat for the rest of the data file.
• Indications with maximum amplitude higher than 80% FSH shall be reported regardless of size.
Adjust the gates to visualize the indication in several views to make sure the indication is relevant and exceeds the reporting levels. Enclose the indication with a "Contour box" in the B- and C-scan. Add the indication to the indication table. Check that the measured size and amplitude of the indication are reasonable. If not, make a manual measurement and adjust the values when the indication table is imported to the Indication data sheet (App. 3). Make a screen shot of the indication, visualized in all four views. Save the screen shot as a jpg-file named: I/Ipxxx_Utxx_Indxxx. Do not forget to set the "Soft Gain" back to the value according to section 6.5.2. Continue with detection of indications of the rest of the file in section 6.5.2.
1217826 Ultrasonic inspection of cast iron insert, UT31 Internal information 6.0 Approved Page 28
6.5 Evaluation in the depth range 45-110 mm
The reporting levels that shall be applied are:
Adjust the gates to visualize the indication in several views to make sure the indication is relevant and exceeds the reporting levels. Enclose the indication with a "Contour box" in the B- and C-scan. Add the indication to the indication table. Check that the measured size and amplitude of the indication are reasonable. If not, make a manual measurement and adjust the values when the indication table is imported to the Indication data sheet (App. 3). Make a screen shot of the indication, visualized in all four views. Save the screen shot as a jpg-file named: I/Ipxxx_Utxx_Indxxx. Do not forget to set back the "Soft Gain". Continue with detection of indications of the rest of the file.
In this section, the depth range 45-110 mm is evaluated. In the BWR insert, support plates may give indications regularly in axial direction around the depth of 100 mm.
The reporting levels are based on the amplitude level recorded from the 2 mm side drilled holes. Sizing of indications is done by using the 6 dB drop method. If the noise level is higher than 20% FSH, discuss with the system responsible if the volume is possible to be evaluated and which reporting level that shall be used.
• Indications larger than 10 mm in axial direction and 2° in circumferential direction shall be reported if they have higher maximum amplitude than 40% FSH.
The insert shall be evaluated at the depth interval 45-110 mm, see figure 6-8 and 6-9. The exception is the volume between the channels in the BWR insert that shall be evaluated at the depth interval 45-105 mm, see figure 6-9.
Choose the layout "Analysis 45-110 mm". Adjust the "Soft Gain" to: 24 dB. Set the gate interval at maximum 150 mm in the axial direction. Zoom an interval in the circumferential direction of maximum 60º. Scroll through the whole circumference in segments of maximum 60° and search for indications exceeding the reporting levels in the B-scan, see figure 6-8 and 6-9. Repeat for the rest of the data file.
• Indications with maximum amplitude higher than 80% FSH shall be reported regardless of size.
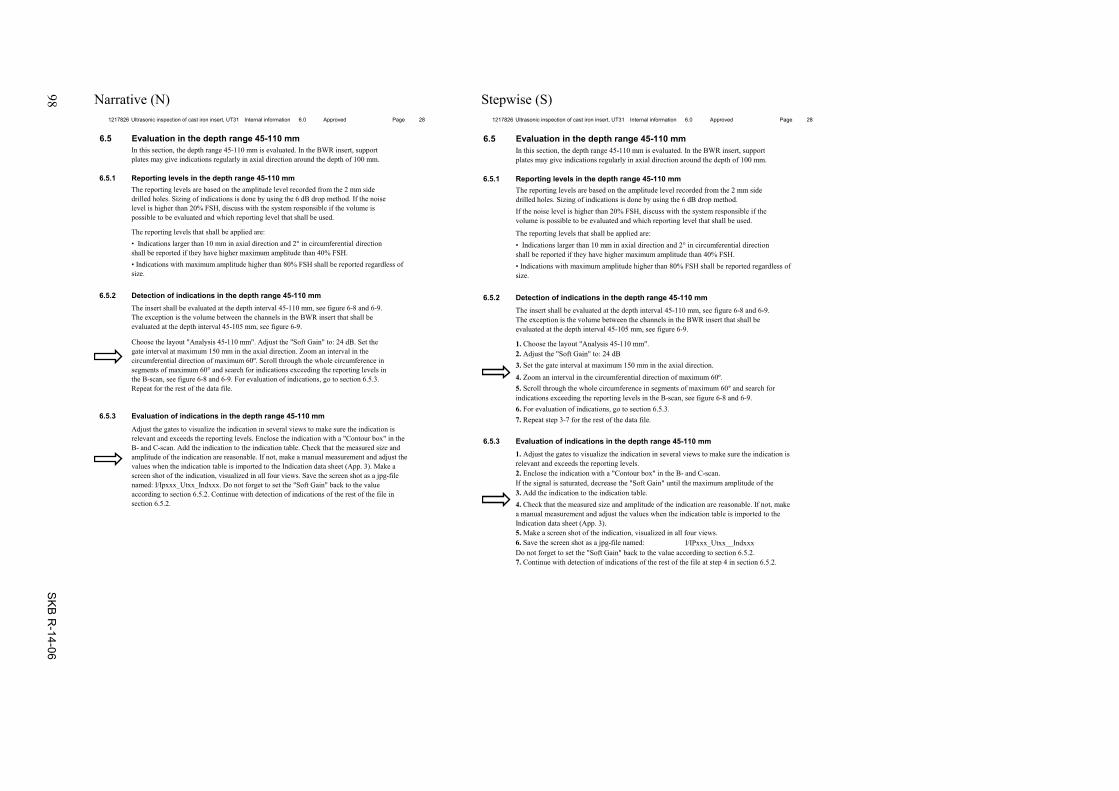
98 S
KB
R-14-06
Narrative (N) Stepwise (S)1217826 Ultrasonic inspection of cast iron insert, UT31 Internal information 6.0 Approved Page 28
6.5 Evaluation in the depth range 45-110 mm
6.5.1 Reporting levels in the depth range 45-110 mm
The reporting levels that shall be applied are:
6.5.2 Detection of indications in the depth range 45-110 mm
2. Adjust the "Soft Gain" to: 24 dB
6.5.3 Evaluation of indications in the depth range 45-110 mm
5. Make a screen shot of the indication, visualized in all four views.6. Save the screen shot as a jpg-file named: I/IPxxx_Utxx__Indxxx
7. Continue with detection of indications of the rest of the file at step 4 in section 6.5.2.
7. Repeat step 3-7 for the rest of the data file.
1. Adjust the gates to visualize the indication in several views to make sure the indication is relevant and exceeds the reporting levels.2. Enclose the indication with a "Contour box" in the B- and C-scan.If the signal is saturated, decrease the "Soft Gain" until the maximum amplitude of the 3. Add the indication to the indication table. 4. Check that the measured size and amplitude of the indication are reasonable. If not, make a manual measurement and adjust the values when the indication table is imported to the Indication data sheet (App. 3).
Do not forget to set the "Soft Gain" back to the value according to section 6.5.2.
4. Zoom an interval in the circumferential direction of maximum 60º.
• Indications with maximum amplitude higher than 80% FSH shall be reported regardless of size.
5. Scroll through the whole circumference in segments of maximum 60° and search for indications exceeding the reporting levels in the B-scan, see figure 6-8 and 6-9.6. For evaluation of indications, go to section 6.5.3.
If the noise level is higher than 20% FSH, discuss with the system responsible if the volume is possible to be evaluated and which reporting level that shall be used.
• Indications larger than 10 mm in axial direction and 2° in circumferential direction shall be reported if they have higher maximum amplitude than 40% FSH.
The insert shall be evaluated at the depth interval 45-110 mm, see figure 6-8 and 6-9. The exception is the volume between the channels in the BWR insert that shall be evaluated at the depth interval 45-105 mm, see figure 6-9.
1. Choose the layout "Analysis 45-110 mm".
3. Set the gate interval at maximum 150 mm in the axial direction.
In this section, the depth range 45-110 mm is evaluated. In the BWR insert, support plates may give indications regularly in axial direction around the depth of 100 mm.
The reporting levels are based on the amplitude level recorded from the 2 mm side drilled holes. Sizing of indications is done by using the 6 dB drop method.
1217826 Ultrasonic inspection of cast iron insert, UT31 Internal information 6.0 Approved Page 28
6.5 Evaluation in the depth range 45-110 mm
6.5.1 Reporting levels in the depth range 45-110 mm
The reporting levels that shall be applied are:
6.5.2 Detection of indications in the depth range 45-110 mm
6.5.3 Evaluation of indications in the depth range 45-110 mm
In this section, the depth range 45-110 mm is evaluated. In the BWR insert, support plates may give indications regularly in axial direction around the depth of 100 mm.
The reporting levels are based on the amplitude level recorded from the 2 mm side drilled holes. Sizing of indications is done by using the 6 dB drop method. If the noise level is higher than 20% FSH, discuss with the system responsible if the volume is possible to be evaluated and which reporting level that shall be used.
• Indications larger than 10 mm in axial direction and 2° in circumferential direction shall be reported if they have higher maximum amplitude than 40% FSH.
The insert shall be evaluated at the depth interval 45-110 mm, see figure 6-8 and 6-9. The exception is the volume between the channels in the BWR insert that shall be evaluated at the depth interval 45-105 mm, see figure 6-9.
Choose the layout "Analysis 45-110 mm". Adjust the "Soft Gain" to: 24 dB. Set the gate interval at maximum 150 mm in the axial direction. Zoom an interval in the circumferential direction of maximum 60º. Scroll through the whole circumference in segments of maximum 60° and search for indications exceeding the reporting levels in the B-scan, see figure 6-8 and 6-9. For evaluation of indications, go to section 6.5.3. Repeat for the rest of the data file.
• Indications with maximum amplitude higher than 80% FSH shall be reported regardless of size.
Adjust the gates to visualize the indication in several views to make sure the indication is relevant and exceeds the reporting levels. Enclose the indication with a "Contour box" in the B- and C-scan. Add the indication to the indication table. Check that the measured size and amplitude of the indication are reasonable. If not, make a manual measurement and adjust the values when the indication table is imported to the Indication data sheet (App. 3). Make a screen shot of the indication, visualized in all four views. Save the screen shot as a jpg-file named: I/Ipxxx_Utxx_Indxxx. Do not forget to set the "Soft Gain" back to the value according to section 6.5.2. Continue with detection of indications of the rest of the file in section 6.5.2.
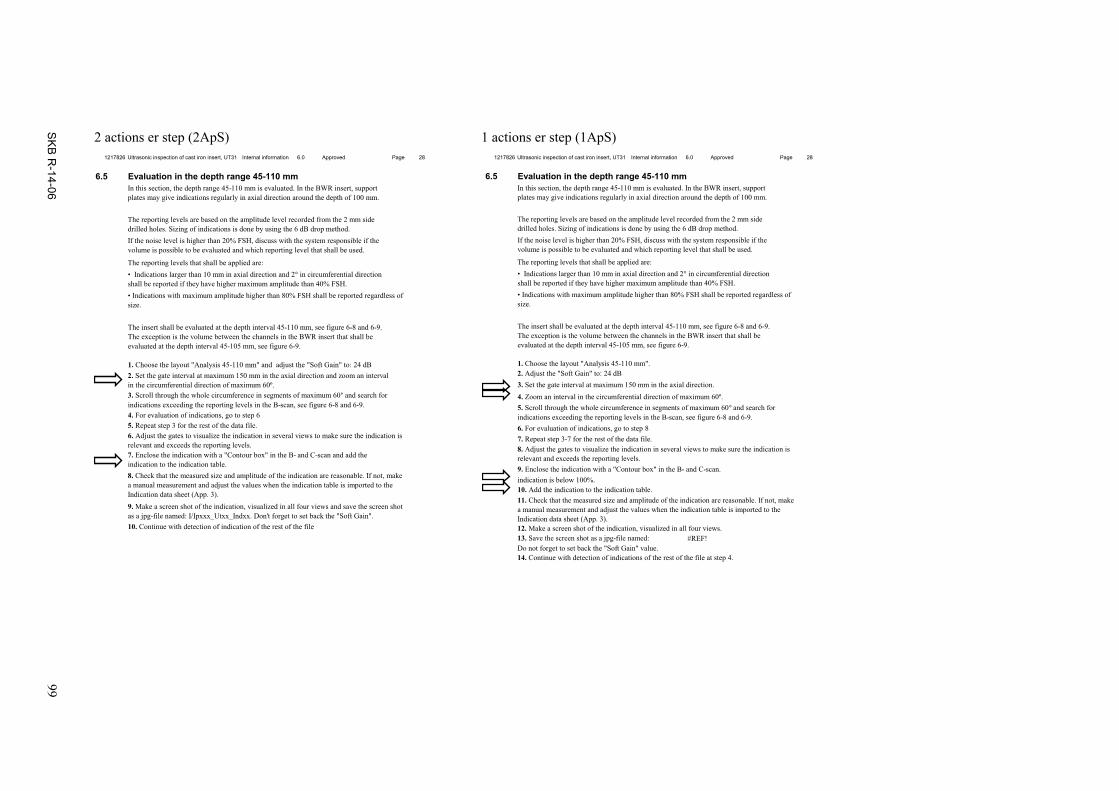
SK
B R
-14-06 99
2 actions er step (2ApS) 1 actions er step (1ApS)1217826 Ultrasonic inspection of cast iron insert, UT31 Internal information 6.0 Approved Page 28
6.5 Evaluation in the depth range 45-110 mm
The reporting levels that shall be applied are:
2. Adjust the "Soft Gain" to: 24 dB
12. Make a screen shot of the indication, visualized in all four views.13. Save the screen shot as a jpg-file named: #REF!
14. Continue with detection of indications of the rest of the file at step 4.
In this section, the depth range 45-110 mm is evaluated. In the BWR insert, support plates may give indications regularly in axial direction around the depth of 100 mm.
The reporting levels are based on the amplitude level recorded from the 2 mm side drilled holes. Sizing of indications is done by using the 6 dB drop method.
11. Check that the measured size and amplitude of the indication are reasonable. If not, make a manual measurement and adjust the values when the indication table is imported to the Indication data sheet (App. 3).
Do not forget to set back the "Soft Gain" value.
8. Adjust the gates to visualize the indication in several views to make sure the indication is relevant and exceeds the reporting levels.9. Enclose the indication with a "Contour box" in the B- and C-scan.indication is below 100%.10. Add the indication to the indication table.
7. Repeat step 3-7 for the rest of the data file.
4. Zoom an interval in the circumferential direction of maximum 60º.
• Indications with maximum amplitude higher than 80% FSH shall be reported regardless of size.
5. Scroll through the whole circumference in segments of maximum 60° and search for indications exceeding the reporting levels in the B-scan, see figure 6-8 and 6-9.6. For evaluation of indications, go to step 8
If the noise level is higher than 20% FSH, discuss with the system responsible if the volume is possible to be evaluated and which reporting level that shall be used.
• Indications larger than 10 mm in axial direction and 2° in circumferential direction shall be reported if they have higher maximum amplitude than 40% FSH.
The insert shall be evaluated at the depth interval 45-110 mm, see figure 6-8 and 6-9. The exception is the volume between the channels in the BWR insert that shall be evaluated at the depth interval 45-105 mm, see figure 6-9.
1. Choose the layout "Analysis 45-110 mm".
3. Set the gate interval at maximum 150 mm in the axial direction.
1217826 Ultrasonic inspection of cast iron insert, UT31 Internal information 6.0 Approved Page 28
6.5 Evaluation in the depth range 45-110 mm
The reporting levels that shall be applied are:
In this section, the depth range 45-110 mm is evaluated. In the BWR insert, support plates may give indications regularly in axial direction around the depth of 100 mm.
The reporting levels are based on the amplitude level recorded from the 2 mm side drilled holes. Sizing of indications is done by using the 6 dB drop method.
2. Set the gate interval at maximum 150 mm in the axial direction and zoom an interval in the circumferential direction of maximum 60º.
5. Repeat step 3 for the rest of the data file.
7. Enclose the indication with a "Contour box" in the B- and C-scan and add the indication to the indication table. 8. Check that the measured size and amplitude of the indication are reasonable. If not, make a manual measurement and adjust the values when the indication table is imported to the Indication data sheet (App. 3).9. Make a screen shot of the indication, visualized in all four views and save the screen shot as a jpg-file named: I/Ipxxx_Utxx_Indxx. Don't forget to set back the "Soft Gain".10. Continue with detection of indication of the rest of the file
6. Adjust the gates to visualize the indication in several views to make sure the indication is relevant and exceeds the reporting levels.
3. Scroll through the whole circumference in segments of maximum 60° and search for indications exceeding the reporting levels in the B-scan, see figure 6-8 and 6-9.4. For evaluation of indications, go to step 6
• Indications with maximum amplitude higher than 80% FSH shall be reported regardless of size.
If the noise level is higher than 20% FSH, discuss with the system responsible if the volume is possible to be evaluated and which reporting level that shall be used.
• Indications larger than 10 mm in axial direction and 2° in circumferential direction shall be reported if they have higher maximum amplitude than 40% FSH.
The insert shall be evaluated at the depth interval 45-110 mm, see figure 6-8 and 6-9. The exception is the volume between the channels in the BWR insert that shall be evaluated at the depth interval 45-105 mm, see figure 6-9.
1. Choose the layout "Analysis 45-110 mm" and adjust the "Soft Gain" to: 24 dB

SKB R-14-06 101
Appendix 6
Usability study – outliers
Variable AOI Reason for exclusion
Use of bold nB1 wB1 nB2 wB2 nB3 wB3 nB4 wB4
Use of notes nN1 wN1 nN2 wN2 nN3 wN3 nN4 wN4
Use of titles nT1 wT1 nT2 wT2 nT3 wT3 nT4 wT4 AOI spreading over two lines
Presentation of task steps
N1 S1 N2 S2 less than 50% data pointsN3 S3 N4 S4 AOI spreading over two lines
Presentation of actions
2ApS1 1ApS1
2ApS2 1ApS2 AOI spreading over two lines
2ApS3 1ApS3
2ApS4 1ApS41 less than 50% data points
1 1ApS4 and 2ApS4 were, however, included in the effectiveness analysis. The number of correctly identified AOIs was defined as the measure of effectiveness.
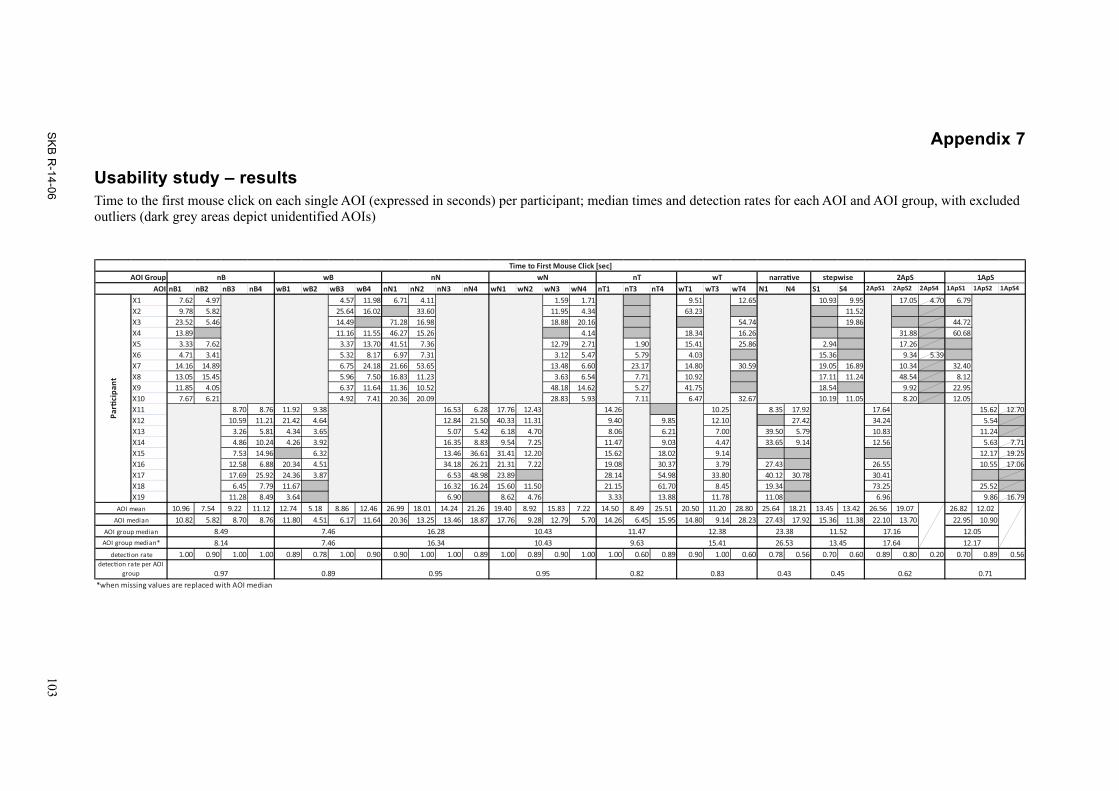
SK
B R
-14-06 103
Appendix 7
Usability study – resultsTime to the first mouse click on each single AOI (expressed in seconds) per participant; median times and detection rates for each AOI and AOI group, with excluded outliers (dark grey areas depict unidentified AOIs)
nB1 nB2 nB3 nB4 wB1 wB2 wB3 wB4 nN1 nN2 nN3 nN4 wN1 wN2 wN3 wN4 nT1 nT3 nT4 wT1 wT3 wT4 N1 N4 S1 S4 2ApS1 2ApS2 2ApS4 1ApS1 1ApS2 1ApS4
X1 7.62 4.97 4.57 11.98 6.71 4.11 1.59 1.71 9.51 12.65 10.93 9.95 17.05 4.70 6.79X2 9.78 5.82 25.64 16.02 33.60 11.95 4.34 63.23 11.52X3 23.52 5.46 14.49 71.28 16.98 18.88 20.16 54.74 19.86 44.72X4 13.89 11.16 11.55 46.27 15.26 4.14 18.34 16.26 31.88 60.68X5 3.33 7.62 3.37 13.70 41.51 7.36 12.79 2.71 1.90 15.41 25.86 2.94 17.26X6 4.71 3.41 5.32 8.17 6.97 7.31 3.12 5.47 5.79 4.03 15.36 9.34 5.39X7 14.16 14.89 6.75 24.18 21.66 53.65 13.48 6.60 23.17 14.80 30.59 19.05 16.89 10.34 32.40X8 13.05 15.45 5.96 7.50 16.83 11.23 3.63 6.54 7.71 10.92 17.11 11.24 48.54 8.12X9 11.85 4.05 6.37 11.64 11.36 10.52 48.18 14.62 5.27 41.75 18.54 9.92 22.95X10 7.67 6.21 4.92 7.41 20.36 20.09 28.83 5.93 7.11 6.47 32.67 10.19 11.05 8.20 12.05X11 8.70 8.76 11.92 9.38 16.53 6.28 17.76 12.43 14.26 10.25 8.35 17.92 17.64 15.62 12.70X12 10.59 11.21 21.42 4.64 12.84 21.50 40.33 11.31 9.40 9.85 12.10 27.42 34.24 5.54X13 3.26 5.81 4.34 3.65 5.07 5.42 6.18 4.70 8.06 6.21 7.00 39.50 5.79 10.83 11.24X14 4.86 10.24 4.26 3.92 16.35 8.83 9.54 7.25 11.47 9.03 4.47 33.65 9.14 12.56 5.63 7.71X15 7.53 14.96 6.32 13.46 36.61 31.41 12.20 15.62 18.02 9.14 12.17 19.25X16 12.58 6.88 20.34 4.51 34.18 26.21 21.31 7.22 19.08 30.37 3.79 27.43 26.55 10.55 17.06X17 17.69 25.92 24.36 3.87 6.53 48.98 23.89 28.14 54.98 33.80 40.12 30.78 30.41X18 6.45 7.79 11.67 16.32 16.24 15.60 11.50 21.15 61.70 8.45 19.34 73.25 25.52X19 11.28 8.49 3.64 6.90 8.62 4.76 3.33 13.88 11.78 11.08 6.96 9.86 16.79
10.96 7.54 9.22 11.12 12.74 5.18 8.86 12.46 26.99 18.01 14.24 21.26 19.40 8.92 15.83 7.22 14.50 8.49 25.51 20.50 11.20 28.80 25.64 18.21 13.45 13.42 26.56 19.07 26.82 12.0210.82 5.82 8.70 8.76 11.80 4.51 6.17 11.64 20.36 13.25 13.46 18.87 17.76 9.28 12.79 5.70 14.26 6.45 15.95 14.80 9.14 28.23 27.43 17.92 15.36 11.38 22.10 13.70 22.95 10.90
1.00 0.90 1.00 1.00 0.89 0.78 1.00 0.90 0.90 1.00 1.00 0.89 1.00 0.89 0.90 1.00 1.00 0.60 0.89 0.90 1.00 0.60 0.78 0.56 0.70 0.60 0.89 0.80 0.20 0.70 0.89 0.56
0.45 0.62 0.71
26.53 13.45 17.64 12.17
*when missing values are replaced with AOI median
detec�on rate per AOI group 0.97 0.89 0.95 0.95
11.52 17.16 12.05AOI group median* 8.14 7.46 16.34 10.43 9.63 15.41
7.46 16.28 10.43 11.47 12.38 23.38
0.82 0.83 0.43
AOI
Par�
cipa
nt
AOI mean
AOI median
AOI group median 8.49
detec�on rate
Time to First Mouse Click [sec]AOI Group nB wB nN wN nT wT narra�ve stepwise 2ApS 1ApS