used rapid positioning method is GPS RTK, which can · GPS carrier phase observations under the...
7
Trans. Nonferrous Met. Soc. China 21(2011) s499-s505 Precise point positioning and its application in mining deformation monitoring XU Changhui 1, 2 , WANG Jinling 2 , GAO Jingxiang 1 , WANG Jian 1 , HU Hong 1 1. School of Environment and Spatial Information, China University of Mining and Technology, Xuzhou 22116, China; 2. School of Surveying and Spatial Information Systems, University of New South Wales, Sydney 2052, Australia Received 19 June 2011; accepted 10 November 2011 Abstract: Precise point positioning (PPP)based deformation monitoring scheme is presented for the use in mining deformation monitoring. Within the solutions of daily observation, outliers are detected and removed to avoid any potential misinterpretation of the results and then the deformation can be extracted by the coordinate differences between the two consecutive solutions. Meanwhile, because of the special location of a rover station in mining areas, the satellite geometry may be insufficient for a reasonable PPP solution, and the multipath impact an also be significant. Therefore, it is necessary to predict the satellite geometry before any daily observation. To evaluate the ability of extracting the deformation using the PPPbased method, various quality measures were introduced. The results of three datasets of the same station show that the precision of deformation monitored by PPP can reach up to cm level and even mm level. Key words: precise point positioning; deformation monitoring; outlier identification; geometry; multipath 1 Introduction Deformation monitoring is an important issue in many industry applications due to human life and production safety concerns. For example, rock deformation and landslide because of coal mining may lead to ground subsidence, resulting in the stoppage of the mining production, and the deformation of buildings may be a human safety concern. To predict and prevent these hazards, it is necessary to monitor the deformation by proper geometric surveying methods such as theodolite, leveling and GPS. Nowadays, GPS is the most common method for deformation monitoring because of its high efficiency, high precision and convenience in operations. Relative GPS positioning based on baseline mode is able to achieve the precision of mm level using hourly GPS carrier phase observations under the beginning operation environment, and thus, it is widely used for establishing geodetic control networks [1]. Based on the same concept, rapid relative GPS positioning is used for daily observation of mining subsidence and its data processing strategy is investigated [2]. The commonly used rapid positioning method is GPS RTK, which can be used for various deformations monitoring such as deformation monitoring of mining area, subsidence of mining area, regional deformation monitoring of open pit mine [3−5]. Although RTK is convenient and feasible under some conditions, it requires the distance between the reference station and a rover station less than 10 km, or much shorter, if such RTK operations are close to the equatorial regions. At the same time, the rover station cannot receive the signals of the reference station under some situations due to the limitations of communication equipment/methods. So, continuously operating reference stations (CORS) or network RTK is developed instead of RTK [6], which satisfies the most requirements of deformation monitoring in a mining area, but it is not practical for the complex terrains, such as mountain areas, because it is difficult to set up the reference stations. Thus, PPP has the advantages for these situations because it has no range limitation and needs only one rover receiver. 2 Precise point positioning After the end of selective availability (SA), Foundation item: Projects (40904004, 41074010) supported by the National Natural Science Foundation of China; Project (BK2009099) supported by the Natural Science Fund of Jiangsu Province, China; Project supported by the Priority Academic Program Development of Jiangsu Higher Education Institutions, China; Projects (200802901516, 200802900501) supported by the Ph.D. Programs Foundation of Ministry of Education of China; Project supported by the Qing Lan Project of Jiangsu Province, China Corresponding author: XU Changhui; Tel: +610425426468; Email: [email protected]
Transcript of used rapid positioning method is GPS RTK, which can · GPS carrier phase observations under the...

Trans. Nonferrous Met. Soc. China 21(2011) s499-s505
Precise point positioning and its application in mining deformation monitoring
XU Changhui 1, 2 , WANG Jinling 2 , GAO Jingxiang 1 , WANG Jian 1 , HU Hong 1
1. School of Environment and Spatial Information, China University of Mining and Technology, Xuzhou 22116, China; 2. School of Surveying and Spatial Information Systems, University of New South Wales, Sydney 2052, Australia
Received 19 June 2011; accepted 10 November 2011
Abstract: Precise point positioning (PPP)based deformation monitoring scheme is presented for the use in mining deformation monitoring. Within the solutions of daily observation, outliers are detected and removed to avoid any potential misinterpretation of the results and then the deformation can be extracted by the coordinate differences between the two consecutive solutions. Meanwhile, because of the special location of a rover station in mining areas, the satellite geometry may be insufficient for a reasonable PPP solution, and the multipath impact an also be significant. Therefore, it is necessary to predict the satellite geometry before any daily observation. To evaluate the ability of extracting the deformation using the PPPbased method, various quality measures were introduced. The results of three datasets of the same station show that the precision of deformation monitored by PPP can reach up to cm level and even mm level. Key words: precise point positioning; deformation monitoring; outlier identification; geometry; multipath
1 Introduction
Deformation monitoring is an important issue in many industry applications due to human life and production safety concerns. For example, rock deformation and landslide because of coal mining may lead to ground subsidence, resulting in the stoppage of the mining production, and the deformation of buildings may be a human safety concern. To predict and prevent these hazards, it is necessary to monitor the deformation by proper geometric surveying methods such as theodolite, leveling and GPS. Nowadays, GPS is the most common method for deformation monitoring because of its high efficiency, high precision and convenience in operations.
Relative GPS positioning based on baseline mode is able to achieve the precision of mm level using hourly GPS carrier phase observations under the beginning operation environment, and thus, it is widely used for establishing geodetic control networks [1]. Based on the same concept, rapid relative GPS positioning is used for daily observation of mining subsidence and its data processing strategy is investigated [2]. The commonly
used rapid positioning method is GPS RTK, which can be used for various deformations monitoring such as deformation monitoring of mining area, subsidence of mining area, regional deformation monitoring of open pit mine [3−5]. Although RTK is convenient and feasible under some conditions, it requires the distance between the reference station and a rover station less than 10 km, or much shorter, if such RTK operations are close to the equatorial regions. At the same time, the rover station cannot receive the signals of the reference station under some situations due to the limitations of communication equipment/methods. So, continuously operating reference stations (CORS) or network RTK is developed instead of RTK [6], which satisfies the most requirements of deformation monitoring in a mining area, but it is not practical for the complex terrains, such as mountain areas, because it is difficult to set up the reference stations. Thus, PPP has the advantages for these situations because it has no range limitation and needs only one rover receiver.
2 Precise point positioning
After the end of selective availability (SA),
Foundation item: Projects (40904004, 41074010) supported by the National Natural Science Foundation of China; Project (BK2009099) supported by the Natural Science Fund of Jiangsu Province, China; Project supported by the Priority Academic Program Development of Jiangsu Higher Education Institutions, China; Projects (200802901516, 200802900501) supported by the Ph.D. Programs Foundation of Ministry of Education of China; Project supported by the Qing Lan Project of Jiangsu Province, China
Corresponding author: XU Changhui; Tel: +610425426468; Email: [email protected]
XU Changhui, et al/Trans. Nonferrous Met. Soc. China 21(2011) s499−s505 s500
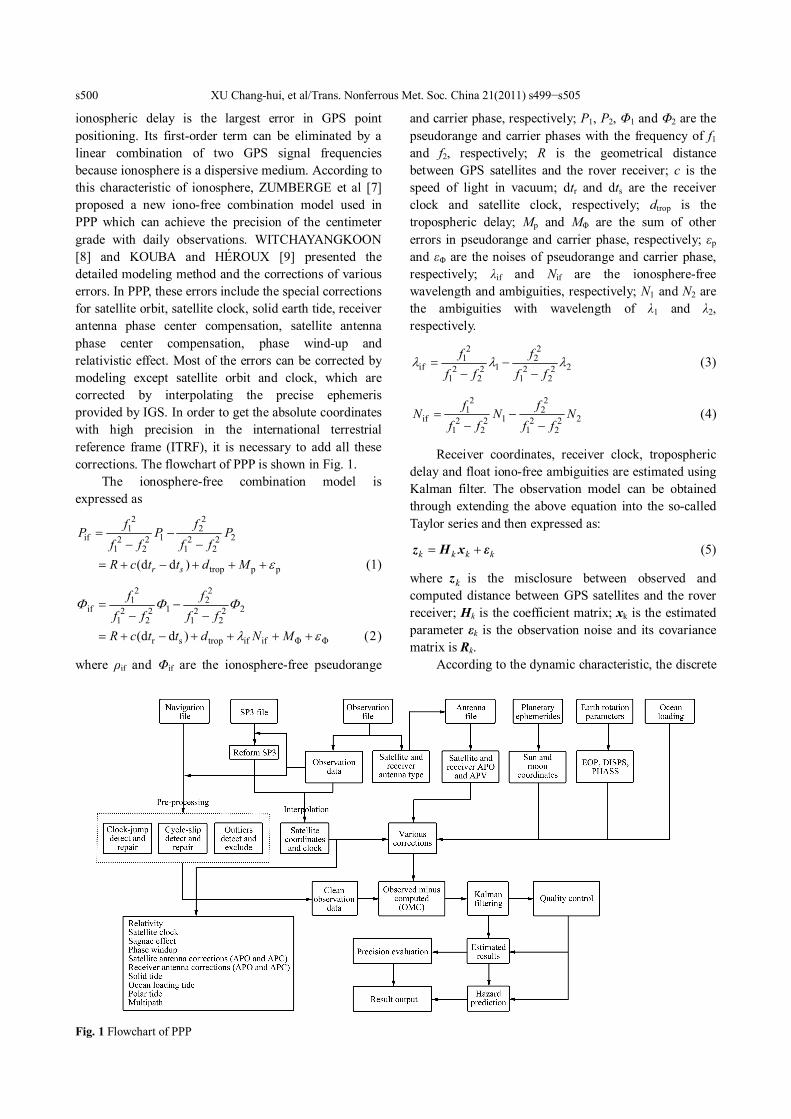
ionospheric delay is the largest error in GPS point positioning. Its firstorder term can be eliminated by a linear combination of two GPS signal frequencies because ionosphere is a dispersive medium. According to this characteristic of ionosphere, ZUMBERGE et al [7] proposed a new ionofree combination model used in PPP which can achieve the precision of the centimeter grade with daily observations. WITCHAYANGKOON [8] and KOUBA and HÉROUX [9] presented the detailed modeling method and the corrections of various errors. In PPP, these errors include the special corrections for satellite orbit, satellite clock, solid earth tide, receiver antenna phase center compensation, satellite antenna phase center compensation, phase windup and relativistic effect. Most of the errors can be corrected by modeling except satellite orbit and clock, which are corrected by interpolating the precise ephemeris provided by IGS. In order to get the absolute coordinates with high precision in the international terrestrial reference frame (ITRF), it is necessary to add all these corrections. The flowchart of PPP is shown in Fig. 1.
The ionospherefree combination model is expressed as
2 2 1 2
if 1 2 2 2 2 2 1 2 1 2
f f P P P f f f f
= − − −
trop p p (d d ) r s R c t t d M = + − + + + ε (1)
2 2 1 2
if 1 2 2 2 2 2 1 2 1 2
f f f f f f
= − − −
Φ Φ Φ
r s trop if if Φ Φ (d d ) R c t t d N M = + − + + + + λ ε (2)
where ρif and Φif are the ionospherefree pseudorange
and carrier phase, respectively; P1, P2, Φ1 and Φ2 are the pseudorange and carrier phases with the frequency of f1 and f2, respectively; R is the geometrical distance between GPS satellites and the rover receiver; c is the speed of light in vacuum; dtr and dts are the receiver clock and satellite clock, respectively; dtrop is the tropospheric delay; Mp and MΦ are the sum of other errors in pseudorange and carrier phase, respectively; εp and εΦ are the noises of pseudorange and carrier phase, respectively; λif and Nif are the ionospherefree wavelength and ambiguities, respectively; N1 and N2 are the ambiguities with wavelength of λ1 and λ2, respectively.
2 2 1 2
if 1 2 2 2 2 2 1 2 1 2
f f f f f f
λ λ λ = − − −
(3)
2 2 1 2
if 1 2 2 2 2 2 1 2 1 2
f f N N N f f f f
= − − −
(4)
Receiver coordinates, receiver clock, tropospheric delay and float ionofree ambiguities are estimated using Kalman filter. The observation model can be obtained through extending the above equation into the socalled Taylor series and then expressed as:
k k k k = + z H x ε (5)
where k z is the misclosure between observed and computed distance between GPS satellites and the rover receiver; Hk is the coefficient matrix; xk is the estimated parameter εk is the observation noise and its covariance matrix is Rk.
According to the dynamic characteristic, the discrete
Fig. 1 Flowchart of PPP

XU Changhui, et al/Trans. Nonferrous Met. Soc. China 21(2011) s499−s505 s501
linear dynamic model can be expressed as 1 k k k k − = + x Φ x τ (6)
where Φk is the transition matrix; τk is the process noise, and its the covariance matrix is Qk.
The Kalman estimation equations are [10−12] T
1 k k k k k −
− = + P Φ P Φ Q (7)
1 k k k −
− = x Φ x (8)
T T 1 ( ) k k k k k k k − − − = + K P H H P H R (9)
k k k k − = + x x K d (10)
T T ( ) ( ) k k k k k k k k k − = − − + P I K H P I K H K R K (11)
k k k k − = − d z H x (12)
T k k k k k
− = + d Q R H P H (13)
where Kk is the grain matrix; xk is the state estimates including receiver coordinates, receiver clocks, tropospheric delay and ambiguities; Pk is the covariance matrix of xk and k d Q is the covariance matrix of innovation.
2.1 Outlier identification To correctly extract the deformation, the model is
assumed as a linear model with no outliers. However, the observations may be contaminated by outliers due to various reasons, such as cycle slips in carrier phase observations. If the outliers are not excluded, the monitoring results may be misinterpreted. Although the ground deformation can be appropriately predicted, the practical deformation of each point is unpredicted and the size is uncertain. Therefore, outliers must be identified and excluded because the biases resulting from outliers may be considered deformation.
Most outlier detection methods are based on the residuals from the least squares or the predicted residuals of Kalman filter, which partially reflect the outliers. Under some conditions, the largest residual term does not indicate the location of an outlier. According to the mean shift model, the statistic based on the estimated outlier can be constructed and used for correlated and uncorrelated observations. Instead of the predicted residuals, the Kalman filter residuals are more efficient for outlier identification. So the statistic test is [11, 13]
T 1
T 1 0
k
k
i k i
i i
w −
− = d
d
e Q d
e Q e σ (14)
where ei is a vector which is equal to 1 for the ith element and equal to 0 for the others; σ0 is the priori standard deviation. This procedure is designed to detect
single outlier, and a multiple outlier detection procedure is discussed in Ref. [14].
2.2 Effects of outliers on state estimates The effects of outliers on the state estimates are
essentially dependent on the redundancy and geometry of the observation system. External reliability describes the effects of undetectable outliers on estimator. It is defined as [11, 15]
T 1 0 T 1
( ) k
k
x k k i i i
s σ δ − −
− ∇ = d
d
P H Q e e Q e
(15)
where δ(s) is the noncentrality parameter which depends on the given false alarm rate and the detectability.
3 Schemes for deformation monitoring
The deformation can be calculated by the difference between the two periods of the same points.
1 d i i− = − X X X (16)
where Xi=[xi yi zi] is the 3D coordinates of the point, dX=[dx dy dz] is the deformation in three directions.
Deformation includes horizontal deformation and vertical subsidence. Normally, vertical subsidence analysis is almost always based on the normal height system, while the height obtained by PPP is the geodetic height system. To obtain the normal height of daily observation, it is necessary to establish regional height anomaly model through fitting the geodetic height and the normal height of common points, and then the normal height of daily observations can be calculated. Finally, vertical subsidence can be obtained through Eq. (16). The whole scheme is shown in Fig. 2.
Before the monitoring points are observed by GPS,
Fig. 2 Vertical subsidence monitoring based on PPP

XU Changhui, et al/Trans. Nonferrous Met. Soc. China 21(2011) s499−s505 s502
it is necessary to predict/select good dilution of precision/geometry to ensure that PPP solutions can achieve a sufficient accuracy. Meanwhile, multipath is considered the random noise in PPP. However, it should be corrected in some areas such as mountain areas. The monitoring stations may be located at the bottom of the valley where the slope and the vegetation on the slope reflect the signals from satellites into the receiver. The interference of reflected signals against the direct signals results in the biases in the PPP solutions. Moreover, although the multipath of each carrier can be considered random noise, the multipath of ionofree combination may become significant.
The precision of the positioning solutions can be evaluated through a given confidence level. Under the given confidence level, various indexes are introduced to evaluate the ability of deformation identification and the solution precision. Because the deformation includes vertical, horizontal and threedimensional deformation, various quality measures such as horizontal root mean square (HRMS), vertical RMS (VRMS), circle error
probability (CEP), spherical error probable (SEP) and horizontal error ellipse (HEE) are used.
4 Results and discussion
Three periods of one hour data from the BJFS station provided by the International GNSS Services (IGS) were collected for deformation analysis. The time of the collected data was the March 7th of 2008, 2009 and 2010, respectively. Due to the effects of elevation on the precision of the observations, elevationdependent weighting is used. The interval of data is 30 s and their satellite position and clock are interpolated using the IGS precise ephemeris with precise orbit at 15 min interval and precise satellite at 30 s interval. All the other errors are corrected by modeling. The elevation mask angle is set to 15° and there are 8 or 9 available satellites (Figs. 3(a) and (b)).
The data collected in 2010 was used as an example for multipath analysis. The multipath of P code in L1 and L2 carriers are both less than 3 m (Figs. 4(a) and (b)) and
Fig. 3 Skyplots of satellites in 2008 (a) and 2010 (b)
Fig. 4Multipath of P code in L1 (a) and L2 (b) carriers

XU Changhui, et al/Trans. Nonferrous Met. Soc. China 21(2011) s499−s505 s503
the amplitude of innovation or residuals of Kalman filter is about 3 m (Fig. 5). The multipath of both carriers is less than the amplitude of innovation or residuals and can be considered random noise. However, the linear combination of the multipath is individually up to 8 m and about 4 m some times (Fig. 6). If it is considered random noise, the estimated states are significantly biased. Moreover, the interference of the reflected signals may be more serious in some harsh environment.
The w test is used for outlier identification. If the largest w test statistic is larger than the critical value, the observation is considered a contaminated observation.
Fig. 5 Residual (a) and innovation (b) of pseudorange
Fig. 6Multipath of ionofree combination
The critical value can be calculated by the given confidence level. For example, the value is 3.29 at the confidence level of 99.9% (Fig. 7). With the convergence of the solution, the effects of the estimated outliers are convergent to mm level after the convergence. The solution is reconverged during the convergent periods and remains the same after the convergence if the number of satellites increases (Fig. 8).
The convergence time is between 10 and 30 min and the precision reaches up to cm level compared with the ground truth value from the scripps orbit and
Fig. 7 w test for observations
Fig. 8 External reliability
Table 1 Ability of deformation identification (Unit: cm) CEP SEP HEE
Year HRMS VRMS 50% 99% 50% 99% Major Minor
2008 1.8 0.3 2.1 5.3 1.4 3.1 2.5 0.5
2009 1.5 1.4 1.5 3.8 1.7 3.7 2.5 0.5
2010 0.8 0.3 1.0 2.5 0.7 1.6 1.2 0.5

XU Changhui, et al/Trans. Nonferrous Met. Soc. China 21(2011) s499−s505 s504
Fig. 9 Estimated coordinate for 2008 (a), 2009 (b) and 2010(c) dataset
permanent array center SOPAC (Fig. 9), so the epoches after half an hour were used for evaluating the ability of deformation monitoring. If PPP is used for vertical monitoring, the vertical RMS is below 2 cm, so is the horizontal RMS (Table 1). RMS describes the fluctuation of estimator in terms of the mean value. The minimum detectable deformation is 2 cm for both horizontal and vertical direction in statistic. To find the direction and its value with the second minimum detectable deformation, HEE is introduced. The second minimum detectable deformation is 2.5 cm and its direction is the semimajor axis of the ellipse given in Fig. 10. Similarly, the smallest ones are 0.5 cm and its direction is the semiminor axis of the ellipse. CEP and SEP give the probability of the horizontal and the threedimensional error, respectively. At the conference level of 99%, the radii of the circle are about 5 and 4 cm in horizontal and threedimensional directions, respectively.
The coordinates from the SOPAC are considered the ground truth value and the computed coordinates are compared with such true values. There are some biases between them (Fig. 9). Although there are biases in the y direction and z direction, the difference between the two different periods is the same as the true deformation in the y and z directions (Table 2). However, because the biases in the x direction change with time, there are biases between the estimated and true deformation.
Fig. 10 Horizontal Error Ellipse
Table 2 Comparison of estimated and true difference from SOPAC between two years (Unit: m) x y z
Year Estimated SOPAC Estimated SOPAC Estimated SOPAC
2009−2008 −0.017 −0.031 −0.005 −0.006 −0.006 −0.007
2010−2009 −0.010 −0.031 −0.006 −0.006 −0.011 −0.007
2010−2008 −0.027 −0.062 −0.011 −0.011 −0.017 −0.013

XU Changhui, et al/Trans. Nonferrous Met. Soc. China 21(2011) s499−s505 s505
5 Conclusions
1) It is necessary to select the observation time before daily observation to ensure the satellite geometry and choose the environment as good as possible due to the special location of the rover station in mining areas. Meanwhile, multipath should be considered when PPP is used for mining deformation monitoring.
2) The outlier detection procedure ensures that there is no effect of an outlier on the solution and the effects of the undetectable bias are at mm level after convergence.
3) Various quality measures show that the precision of deformation monitoring can reach up to cm level and even mm level when PPP is used.
References
[1] LV Weicai, CHENG Shiguang, YANG Haisheng, LIU Daping. Application of GPS technology to build a minsubsidence observation station [J]. Journal of China University of Mining and Technology, 2008, 18(3): 377−380. (in Chinese)
[2] HAN Baomin, OU Jikun, CHAI Yanju, LU Xiushan. Method for processing data observed from GPS for subsidence surveying in mining area [J]. The Chinese Journal of Nonferrous Metals, 2002, 12(5): 1035−1039.
[3] GAO J X, HU H. Advanced GNSS technology of mining deformation monitoring [J]. Procedia Earth and Planetary Science, 2009, 1(1): 1081−1088.
[4] ZAHGN Anbing, ZHANG Zhaojiang, GAO Jingxiang, LIU Xinxia. Feasibility study on mining surface subsidence
highprecision monitoring using GPS [J]. Journal of China Coal Society, 2009, 34(10): 1322−1327. (in Chinese)
[5] KIM D D, LANGLEY R B, BOND J, CHRZANOWSKI A. Local deformation monitoring using GPS in an open pit mine: Initial study [J]. GPS Solutions, 2003, 7(3): 176−185.
[6] YUAN Weiqiang. Construction of CORS net of Fujian province [J]. Geospatial Information, 2010, 8(5): 44−46, 49. (in Chinese)
[7] ZUMBERGE J F, HEFLIN M B, JEFFERSON D C, WATKINS M M, WEBB F H. Precise point positioning for the efficient and robust analysis of GPS data from large networks [J]. Journal of Geophysical Research, 1997, 102(B3): 5005−5017.
[8] WITCHAYANGKOON B. Elements of GPS precise point positioning [D]. Orono: University of Maine, 2000.
[9] KOUBA J, HÉROUX P. Precise point positioning using IGS orbit and clock products [J]. GPS Solutions, 2001, 5(2): 12−28.
[10] XU Changhui, GAO Jingxiang, WANG Jian. Robust Kalman filtering of GNSS/INS integrated system [J]. Journal of China University of Mining and Technology, 2010, 39(5): 146−151. (in Chinese)
[11] WANG J, STEWART M P, TSAKIRI M. On quality control in hydrographic GPS surveying [C]// Proc 3th Australasian Hydrographic Symposium. Fremantle, Australia, 1997: 136−141.
[12] HEWITSON S, WANG J. Extended receiver autonomous integrity monitoring (eRAIM) for GNSS/INS integration [J]. Journal of Surveying Engineering, 2010, 136(1): 13−22.
[13] BAARDA W. A testing procedure for use in geodetic networks [J]. Netherlands Geodetic Commission, New Series, 1968, 2(5): 27−55.
[14] KNIGHT N L, WANG J, RIZOS C. Generalised measures of reliability for multiple outliers [J]. Journal of Geodesy, 2010, 84(10): 625−635.
[15] HEWITSON S, WANG J. GNSS receiver autonomous integrity monitoring (RAIM) with a dynamic model [J]. Journal of Navigation, 2007, 60(2): 247−263.
(Edited by FANG Jinghua)