Use of Visual Distress Survey and Deflection Data for ... · Use of Visual Distress Survey and...
35
1 Use of Visual Distress Survey and Deflection Data for Rehabilitation Decisions in Idaho Presented By: Deb Mishra, Ph.D., P.E. Assistant Professor Dept. of Civil Engineering Boise State University Graduate Research Assistant: Md. Fazle Rabbi Grad. Research Assistant Dept. of Civil Engineering Boise State University Use of Visual Distress Survey Data and Deflection Basin Parameters for Network-Level Pavement Rehabilitation Decisions in Idaho Author: Deb Mishra, Ph.D., P.E. Assistant Professor Dept. of Civil Engineering Boise State University 2 96 th Annual Meeting of the Transportation Research Board Co-Author: Md. Fazle Rabbi Grad. Research Assistant Dept. of Civil Engineering Boise State University Co-Author: John Arambarri, PE, Materials Engineer, District 3 ITD Co-Author: Dan Harelson, PE, Engineering Manager, District 5 ITD Initial Version of Paper Presented at the 96 th Annual Meeting of the Transportation Research Board 57th Idaho Asphalt Conference, October 26, 2017 1
Transcript of Use of Visual Distress Survey and Deflection Data for ... · Use of Visual Distress Survey and...

1
Use of Visual Distress Survey and Deflection Data for Rehabilitation Decisions in Idaho
Presented By:Deb Mishra, Ph.D., P.E.Assistant Professor Dept. of Civil Engineering Boise State University
Graduate Research Assistant:Md. Fazle RabbiGrad. Research Assistant Dept. of Civil Engineering Boise State University
Use of Visual Distress Survey Data and Deflection Basin Parameters for Network-Level Pavement Rehabilitation
Decisions in Idaho
Author:Deb Mishra, Ph.D., P.E.Assistant Professor Dept. of Civil Engineering Boise State University
2
96th Annual Meeting of the Transportation Research Board
Co-Author:Md. Fazle RabbiGrad. Research Assistant Dept. of Civil Engineering Boise State University
Co-Author:John Arambarri, PE, Materials Engineer, District 3 ITD
Co-Author:Dan Harelson, PE, Engineering Manager, District 5ITD
Initial Version of Paper Presented at the 96th Annual Meeting of the Transportation Research Board
57th Idaho Asphalt Conference, October 26, 2017
1

3
Project Background and Scope
Total length of I-15 In Idaho= 190 milsReplacing around 44 miles
Project No
Limits Project Length Start End Start End Length
1 Arimo Interchange McCammon Interchange 39.8 47.5 7.72 Baseline Bonneville 106.7 111.9 5.23 Chubbuck Milepost 76.01 72.6 76.01 3.44 Lava Bed crosover Baseline road 100.4 106.7 6.3
5 McCommonInterchange South 5th Pocatello 47.5 66.8 19.3
6 Milepost 76.01 Burns Road 76.01 81.9 5.97 South Blackfoot west Blackfoot 89.3 92.5 3.28 Sand Road Blackfoot 85.6 89.3 3.79 West Blackfoot Lava Beds 92.5 100.4 7.9
“Over the year the transportation department has routinely repaired the pavement but even with this routine maintenance the pavement has reached the end of its life; it’s time to invest in a new surface”.
-Dan Harelson, ITD project manager
Several sections Several sections were initially selected were initifor Full
initiulul -
ally seltianitillll--Depth for Fuulll Depth DD
Reclamation Reclamation(CRABS); In
onInIn-nnn--Depth (CRABS); IInn Depth DD
Analysis of Structural Analysis of Structural Condition can lead to Condition can leamore educated more educadecisions
4
Projects: (District -3)1. US-95 Payette NCL to Weiser River Bridge
• MP 70.28 to 81.52
2. SH-55 Pride Lane to Middleton Road
• MP 7.1 to MP 15.6
3. I-84, Sand Hollow to Caldwell
• MP 17 to MP 26
Projects: (District -5)1. I-15, Sand Road to South Blackfoot
• MP 85.6 to MP 89.3
Pavement Sections Analyzed
Thank you John n Arambarrirri!
57th Idaho Asphalt Conference, October 26, 2017
2

5
Objective and Motivation
1. Recurrent Pavement Distresses
2. Unprecedented Construction and
Maintenance Costs
3. Frequent Traffic Interruption
4. Increased in User Costs
Full Reconstruction?or
Partial Reconstruction?or
Rehabilitation?or
Successive Maintenance Approach??
color.ngmnexpo.comhttps://www.fhwa.dot.gov/publications/transporter/96aug/index.cfm
en.wikipedia.orgwww.qespavements.com
What is the Probable Solution????
6
Functional vs. Structural Pavement EvaluationPavement Evaluation
Functional Evaluation
Present Serviceability
Index
Pavement Roughness
Index
Skid Resistance
Structural Evaluation
Destructive Testing
Flexible Pavement
Coring/Bitumen Extraction
Rigid Pavements
Crushing Strength,
flexural strength
Non-Destructive Testing
Static Creep Deflection
Method
Steady State Deflections
Wave propagation
Method
Impulsive loading
Surface and Subgrade Assessment for Design and Evaluation purpose
Surface Assessment Maintenance
Purpose
X Comparatively ExpensiveX Time ConsumingX Labor-Intensive X Traffic InterruptionX Discontinuous AssessmentX Damage to pavements
Cost EfficientNoninvasiveRapidLimited Traffic Obstruction
Impulsive loading
Impulse Loading
57th Idaho Asphalt Conference, October 26, 2017
3

7
FWD (Impulse Loading Devices)
FWD measures surface deflections by an impact loading to simulate a vehicular moving load.
The system applies controlled loading and measures deflections.
Falling Weight t Deflectometerr (FWD) is widely used to measure pavement surface deflections
Advantages:
Comparatively Fast
Economical
8
FWD Data
Basin Parameters
Analysis Sloping Surface
South Africa Suggested
Threshold values
USASuggested
Threshold values
Subgrade Modulus Analysis
Back Calculated Layer Modulus
Value
Iterative Process
Closed From Process
FWD Data Assessment Process
57th Idaho Asphalt Conference, October 26, 2017
4

9
Backcalculation – A Challenge
Very powerful concept – needs good understanding of the procedure
Pavement layer thicknesses – Important Input
Not something that DOTs do on a daily basis
Is it possible to utilize FWD data at a network level without going ssible to utilize FWD datathrough detailed back
datackck-
at a network level withoa atakk--calculation approaches?
10
Deflection Basin Shape – Relevant Inferences
Not a replacement for Not a replacembackcalculation
ment for cemnn ! Just a tool kcalculationn Just a !
to help engineers
Ref: Horak, E. (2008), “Benchmarking the Structural Condition of Flexible Pavements with Deflection Bowl Parameters”
57th Idaho Asphalt Conference, October 26, 2017
5

11
0 300
300 600
Surface Curvatutre Index (SCI)(also known as Base Layer Index, BLI)
Middle Layer Index (MLI)(also known as Base Damage Index, BDI)
Lower Layer Index (LLI)(also known as Base Cu
SCI D D
MLI D D
600 900
rvature Index, BCI)LLI D D
Deflection Basin Parameters Used in the US
Ref: Horak, E. (2008), “Benchmarking the Structural Condition of Flexible Pavements with Deflection Bowl Parameters”
Shape of the deflection basin is Shape of the deflection basin is governed by structural condition of verned by structural condition
individual pavement layers
Different Countries; Different Names
12Ref: Horak, E., Emery, S., & Maina, J. Review of Falling Weight Deflectometer Deflection Benchmark Analysis on Roads and Airfields. In Proc. 11th Conf. on Asphalt Pavements for Southern Africa.
Parameter Formula Structural indicator
Maximum Deflection Do as measured ALL Layers
Radius of Curvature(RoC)
Surface and Base Layer
Base Layer Index(BLI) Base Layer
Middle Layer Index (MLI)
Subbase/Subgrade Layer
Lower Layer Index (LLI)
Subbase/Subgrade Layer
Deflection Bowl Parameters - South African Practice
2
00
200
2 1
200 mm (for FWD)
LRoCDD
DL
0 300BLI D D
300 600MLI D D
600 900MLI D D
57th Idaho Asphalt Conference, October 26, 2017
6

13Ref: Horak, E., Emery, S., & Maina, J. Review of Falling Weight Deflectometer Deflection Benchmark Analysis on Roads and Airfields. In Proc. 11th Conf. on Asphalt Pavements for Southern Africa.
Base TypeStructural Condition
Rating
Deflection Bowl Parameters (700 kPa)
Do (μm) RoC (m) BLI (μm) MLI (μm) LLI (μm)
Granular Base
Sound < 625 > 90 < 250 < 115 < 65
Warning 625 to 925 42-90 250-475 115-225 65-120
Severe > 925 < 42 > 475 > 225 > 120
Parameter Formula Structural indicator
Maximum Deflection Do as measured ALL Layers
Radius of Curvature
(RoC)
RoC= ( )L= 200mm (FWD)
Surface and Base Layer
Base Layer Index(BLI)
BLI=Do - D300 Base Layer
Middle Layer Index (MLI)
MLI=D300 - D600Subbase/
Subgrade Layer
Lower Layer Index (LLI)
LLI=D600-D900
Subbase/Subgrade Layer
Deflection Bowl Parameters and Thresholds
Need to use consistent FWD load levels
Idaho Uses a Load Level of 12 kips for FWD ad Level of Testing
14Ref: Chang C, D. Saenz , S. Nazarian, I. N. Abdallah, A. Wimsatt, T. Freeman, and E. G. Fernando (2014) “TxDOT Guidelines to Assign PMIS Treatment Levels” (Table)
Deflection Basin Parameters Range Remarks
SCI / BLI (mils)
< 4.00 Very Good Asphalt Layer4.00 - 6.00 Good Asphalt Layer6.00 - 8.00 Fair Asphalt Layer
8.00 - 10.00 Poor Asphalt Layer> 10.00 Very Poor Asphalt Layer
MLI (mils)
< 2.00 Very Good Base Layer2.00 - 3.00 Good Base Layer3.00 - 4.00 Fair Base Layer4.00 - 5.00 Poor Base Layer
> 5.00 Very Poor Base Layer
W60 (mils)
< 1.00 Very Good Subgrade Layer1.00 - 1.14 Good Subgrade Layer1.40 - 1.80 Fair Subgrade Layer1.80 - 2.20 Poor Subgrade Layer
> 2.20 Very Poor Subgrade Layer
Deflection Bowl Parameters & Thresholds
57th Idaho Asphalt Conference, October 26, 2017
7

15
Structural Evaluation of I-15, I-84, SH-55 & US-95 Sections using Deflection Basin Parameters
Different Pavement Sections Considered
16
1. US-95 Payette NCL to Weiser River Bridge
• MP 70.28 to 81.52
• FWD data collected in 2011
2. SH-55 Pride Lane to Middleton Road
• MP 7.1 to MP 15.6
• FWD data collected on 29 June 2016
3. I-84, Sand Hollow to Caldwell
• MP 17 to MP 26
• FWD data collected on 14 October 2015
4. I-15, Sand Road to South Blackfoot
• MP 85.6 to MP 89.3
• FWD data collected on 15 June 2011
Normalized to “12000” 0” lbbb Load
57th Idaho Asphalt Conference, October 26, 2017
8

17
Functional Condition Assessment
18
I-84
Condition Assessment Based on Rutting and International Roughness Index (IRI)
Rutting Index Category Rut Depth (in.)Excellent < 0.25Good 0.25-.037Fair 0.38-0.50Poor >0.50
Classification Based on IRI
IRIRange
Criteria ClassificationIRI Good
Fair / AcceptableIRI >170 Poor / Not Acceptable
http://pathweb.pathwayservices.com/idaho/) (edited)
SH-55
I-15
Ref: http://pathweb.pathwayservices.com/idaho/) (edited)
US-95 Identifying the “source” of the problem is Identifying the source of the problem is important for the selection of suitable rtant for the selection of sui
rehabilitation measures
57th Idaho Asphalt Conference, October 26, 2017
9

19
Condition: Cracking Index
Pavement Condition Functional ClassInterstate and Arterials
Good CI > 3.0FairPoor
Very Poor CI < 2.0Condition: Roughness Index
Pavement Condition Functional ClassInterstate and Arterials
Good RI > 3.0FairPoor
Very Poor RI < 2.0Condition: Rutting
Pavement Condition Functional ClassInterstate and Arterials
Good 0.00” – 0.24”Fair 0.25” – 0.49”Poor 0.50” – 0.74”
Very PoorCondition: IRI (inch/mile)
Pavement Condition Functional ClassInterstate and Arterials
Excellent <60Good 60-99Fair 100-139Poor 140-199
Very Poor
Threshold Values used to Classify Pavements Based on Distress Extent and severity
Distress Type Distress Severity / MagnitudePavement
SectionI-15 I-84 US-95 SH-55
Value Rating Value Rating Value Rating Value RatingCracking Index 2.6 Fair 3.8 Good 2.2 Poor 1.6 Poor
International Roughness
Index (IRI, in/mi)< 95 Good
56(avg.)
Excellent90.5
(avg.)Good
156 (avg.)
Poor
Roughness Index (RI)
3.40 Good 3.95 Good 3.33 Good 2.51 Fair
Average Rut Depth (inch)
0.43” Fair 0.24” Good 0.46” Fair 0.24” Good
*The data was taken from ITD’s visual distress survey database.IRI values for the I-84, US-95, and SH-55 segments were extracted from reports prepared by ITD. IRI values for the I-15 segment are extracted from the visual distress survey database
20
Pavement Layer Profiles of US-95, SH-55 & I-15
I-84SH-55
US-95
Pavement Layer Profiles
(a) I-84 (Ground Penetrating Radar)
(b)US-95 (Boring logs )
(c) SH-55 (Boring logs )
57th Idaho Asphalt Conference, October 26, 2017
10

21
Inferences based on Deflection Basin – Zone 1
Inferences based on Shape of nferences based on Shape oStress Dissipation Curve
22Ref: Levi, G. (2016), Horak, E., Emery, S., & Maina, J. Review of Falling Weight Deflectometer Deflection Benchmark Analysis on Roads and Airfields. In Proc. 11th Conf. on Asphalt Pavements for Southern Africa.
Base TypeStructural Condition
Rating
Deflection Bowl
ParameterDo (μm)
Granular Base
Sound < 625Warning 625-925Severe > 925
Deflection under the Load
I-15
Central Deflection as an Indicator of Overall Pavement
Structural Condition
Pavement Assessment Based on Deflection Bowl Parameters
57th Idaho Asphalt Conference, October 26, 2017
11

23Ref: Levi, G. (2016), Horak, E., Emery, S., & Maina, J. Review of Falling Weight Deflectometer Deflection Benchmark Analysis on Roads and Airfields. In Proc. 11th Conf. on Asphalt Pavements for Southern Africa.
Base TypeStructural Condition
Rating
Deflection Bowl
ParameterDo (μm)
Granular BaseSound < 625
Warning 625-925Severe > 925
Deflection under the Load
(a) I-15 (b) I-84
(c) US-95 (d) SH-55
Central Deflection as an Indicator of Overall Pavement
Structural Condition
Pavement Assessment Based on Deflection Bowl Parameters
24Ref: Chang C, D. Saenz , S. Nazarian, I. N. Abdallah, A. Wimsatt, T. Freeman, and E. G. Fernando (2014) “Txdot Guidelines to Assign PMIS Treatment Levels” (Table)
SCI (BLI) Remarks
< 4.00 Very Good Asphalt Layer4.00 -- 6.00 Good Asphalt Layer6.00 -- 8.00 Fair Asphalt Layer
8.00 -- 10.00 Poor Asphalt Layer> 10.00 Very Poor Asphalt Layer
Pavement Assessment Based on Deflection Bowl Parameters
Structural Condition Indicator for HMA Layer
Surface Curvature Index
I-15
57th Idaho Asphalt Conference, October 26, 2017
12

25Ref: Chang C, D. Saenz , S. Nazarian, I. N. Abdallah, A. Wimsatt, T. Freeman, and E. G. Fernando (2014) “Txdot Guidelines to Assign PMIS Treatment Levels” (Table)
SCI / BLI (mils) Inference
< 4.00 Very Good Asphalt Layer
4.00 -- 6.00 Good Asphalt Layer6.00 -- 8.00 Fair Asphalt Layer
8.00 -- 10.00 Poor Asphalt Layer
> 10.00 Very Poor Asphalt Layer
Pavement Assessment Based on Deflection Bowl Parameters
Surface Curvature Index
(a) I-15 (b) I-84
(c) US-95 (d) SH-55
Structural Condition Indicator for HMA Layer
26Ref: Horak, E., Emery, S., & Maina, J. Review of Falling Weight Deflectometer Deflection Benchmark Analysis on Roads and Airfields. In Proc. 11th Conf. on Asphalt Pavements for Southern Africa.
Base TypeStructural Condition
Rating
Deflection Bowl
ParameterBLI (μm)
Granular Base
Sound < 250Warning 250 - 475Severe > 475
Pavement Assessment Based on Deflection Bowl Parameters
Base Layer Index
I-15
Numerically equivalent to SCI
However, used to Assess Base Layer Condition
57th Idaho Asphalt Conference, October 26, 2017
13

27Ref: Horak, E., Emery, S., & Maina, J. Review of Falling Weight Deflectometer Deflection Benchmark Analysis on Roads and Airfields. In Proc. 11th Conf. on Asphalt Pavements for Southern Africa.
Base Condition Indicator
Base Layer Index
(a) I-15 (b) I-84
(c) US-95 (d) SH-55
Pavement Assessment Based on Deflection Bowl Parameters
Base TypeStructural Condition
Rating
Deflection Bowl
ParameterBLI (μm)
Granular Base
Sound < 250Warning 250 - 475Severe > 475
28
Inferences based on Deflection Basin – Zone 2
Inferences based on Shape of nferences based on Shape oStress Dissipation Curve
57th Idaho Asphalt Conference, October 26, 2017
14
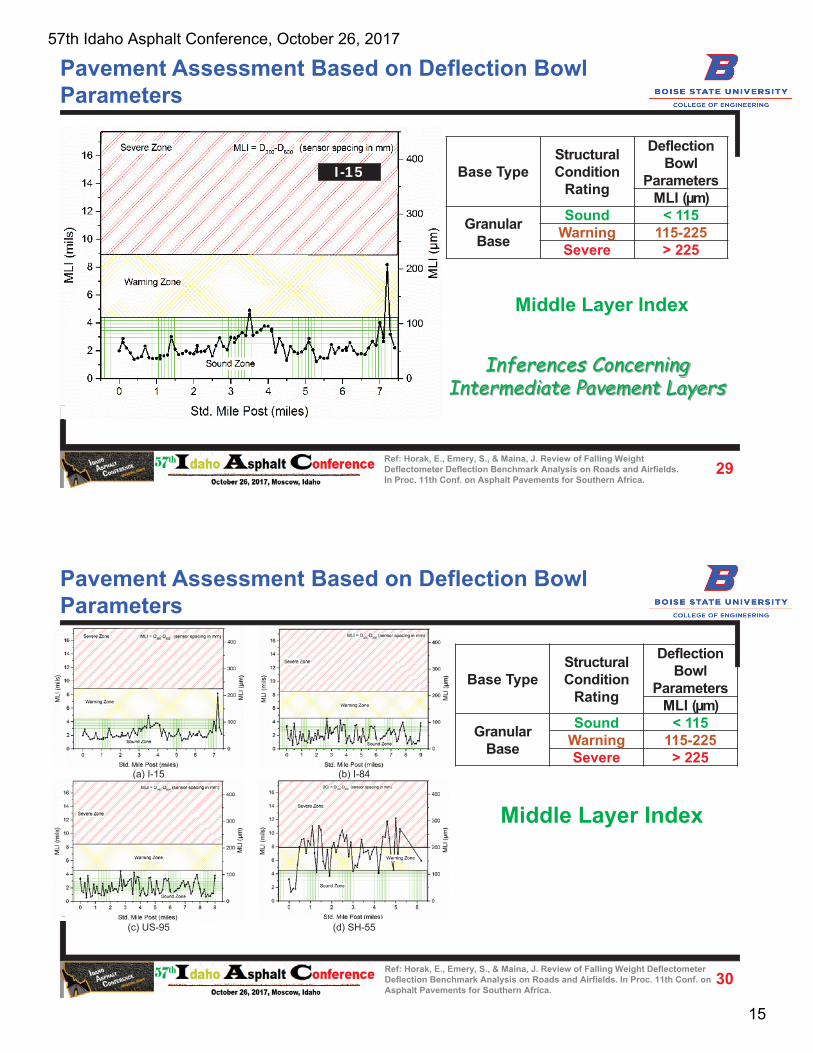
29Ref: Horak, E., Emery, S., & Maina, J. Review of Falling Weight Deflectometer Deflection Benchmark Analysis on Roads and Airfields. In Proc. 11th Conf. on Asphalt Pavements for Southern Africa.
Base TypeStructural Condition
Rating
Deflection Bowl
ParametersMLI (μm)
Granular Base
Sound < 115Warning 115-225Severe > 225
Middle Layer Index
I-15
Inferences Concerning Inferences Concerning Intermediate Pavement Layers
Pavement Assessment Based on Deflection Bowl Parameters
30Ref: Horak, E., Emery, S., & Maina, J. Review of Falling Weight Deflectometer Deflection Benchmark Analysis on Roads and Airfields. In Proc. 11th Conf. on Asphalt Pavements for Southern Africa.
Middle Layer Index
(a) I-15 (b) I-84
(c) US-95 (d) SH-55
Base TypeStructural Condition
Rating
Deflection Bowl
ParametersMLI (μm)
Granular Base
Sound < 115Warning 115-225Severe > 225
Pavement Assessment Based on Deflection Bowl Parameters
57th Idaho Asphalt Conference, October 26, 2017
15

31
Inferences based on Deflection Basin – Zone 3
Inferences based on Shape of nferences based on Shape oStress Dissipation Curve
32Ref: Chang C, D. Saenz , S. Nazarian, I. N. Abdallah, A. Wimsatt, T. Freeman, and E. G. Fernando (2014) “Txdot Guidelines to Assign PMIS Treatment Levels” (Table)
BCI / LLI (mils) Inference< 2.0 Very Good Base Layer
2.0 -- 3.0 Good Base Layer3.0 -- 4.0 Fair Base Layer4.0 -- 5.0 Poor Base Layer
> 5.0 Very Poor Base Layer
Base Curvature Index
I-15
Pavement Assessment Based on Deflection Bowl Parameters
Inferences Concerning Lower rences Concerning LPavement Layers
57th Idaho Asphalt Conference, October 26, 2017
16

33Ref: Chang C, D. Saenz , S. Nazarian, I. N. Abdallah, A. Wimsatt, T. Freeman, and E. G. Fernando (2014) “Txdot Guidelines to Assign PMIS Treatment Levels” (Table)http://pathweb.pathwayservices.com/idaho/) (Picture )
Base Curvature Index(a) I-15 (b) I-84
(c) US-95 (d) SH-55
Base/Subgrade Condition Indicator
Pavement Assessment Based on Deflection Bowl Parameters
BCI / LLI (mils) Inference< 2.0 Very Good Base Layer
2.0 -- 3.0 Good Base Layer3.0 -- 4.0 Fair Base Layer4.0 -- 5.0 Poor Base Layer
> 5.0 Very Poor Base Layer
34Ref: Horak, E., Emery, S., & Maina, J. Review of Falling Weight Deflectometer Deflection Benchmark Analysis on Roads and Airfields. In Proc. 11th Conf. on Asphalt Pavements for Southern Africa.
Base TypeStructural Condition
Rating
Deflection Bowl
ParameterLLI (μm)
Granular Base
Sound < 65Warning 65 – 120Severe > 120
Subgrade Condition Indicator
Lower Layer Index
I-15
Pavement Assessment Based on Deflection Bowl Parameters
57th Idaho Asphalt Conference, October 26, 2017
17

35Ref: Horak, E., Emery, S., & Maina, J. Review of Falling Weight Deflectometer Deflection Benchmark Analysis on Roads and Airfields. In Proc. 11th Conf. on Asphalt Pavements for Southern Africa.
Subgrade Condition Indicator
Lower Layer Index
(a) I-15 (b) I-84
(c) US-95 (d) SH-55
Pavement Assessment Based on Deflection Bowl Parameters
Base TypeStructural Condition
Rating
Deflection Bowl
ParameterLLI (μm)
Granular Base
Sound < 65Warning 65 – 120Severe > 120
36
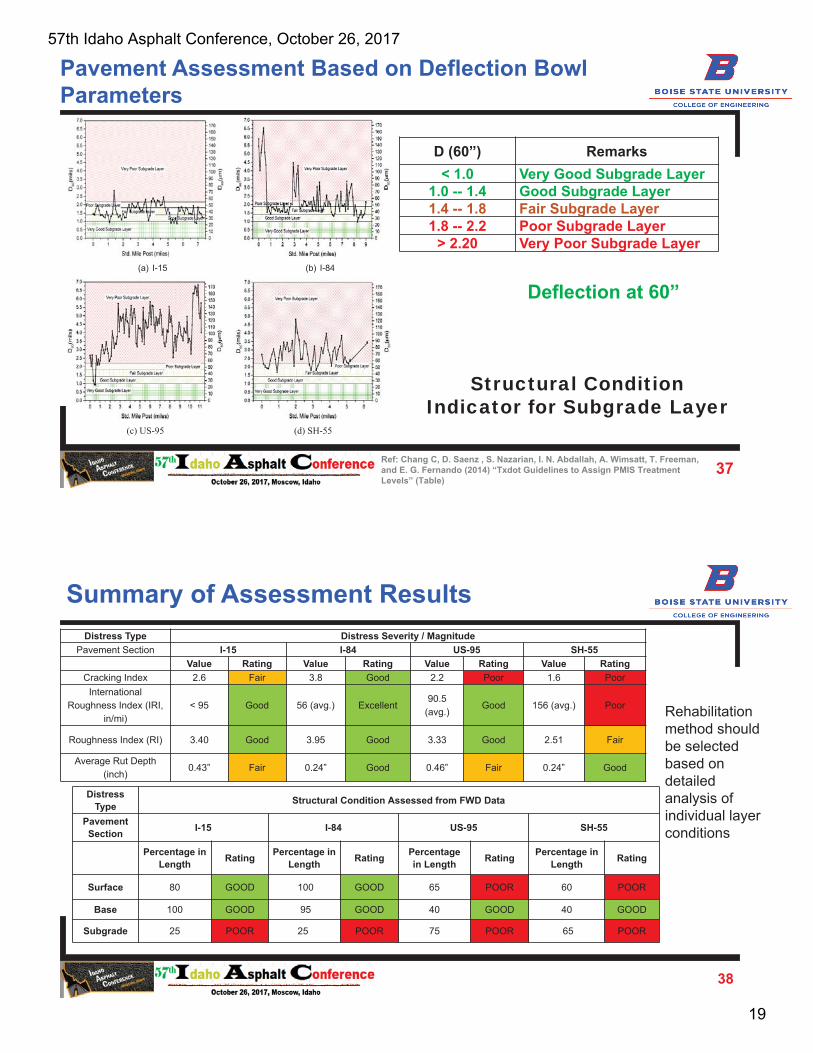
D (60”) Remarks< 1.0 Very Good Subgrade Layer
1.0 -- 1.4 Good Subgrade Layer1.4 -- 1.8 Fair Subgrade Layer1.8 -- 2.2 Poor Subgrade Layer
> 2.20 Very Poor Subgrade Layer
Deflection at 60”
Ref: Chang C, D. Saenz , S. Nazarian, I. N. Abdallah, A. Wimsatt, T. Freeman, and E. G. Fernando (2014) “Txdot Guidelines to Assign PMIS Treatment Levels” (Table)
I-15
Structural Condition Indicator for Subgrade Layer
Pavement Assessment Based on Deflection Bowl Parameters
57th Idaho Asphalt Conference, October 26, 2017
18
37
D (60”) Remarks< 1.0 Very Good Subgrade Layer
1.0 -- 1.4 Good Subgrade Layer1.4 -- 1.8 Fair Subgrade Layer1.8 -- 2.2 Poor Subgrade Layer
> 2.20 Very Poor Subgrade Layer
Deflection at 60”(a) I-15 (b) I-84
(c) US-95 (d) SH-55
Ref: Chang C, D. Saenz , S. Nazarian, I. N. Abdallah, A. Wimsatt, T. Freeman, and E. G. Fernando (2014) “Txdot Guidelines to Assign PMIS Treatment Levels” (Table)
Structural Condition Indicator for Subgrade Layer
Pavement Assessment Based on Deflection Bowl Parameters
38
Summary of Assessment Results
Rehabilitation method should be selected based on detailed analysis of individual layer conditions
Distress Type Distress Severity / MagnitudePavement Section I-15 I-84 US-95 SH-55
Value Rating Value Rating Value Rating Value RatingCracking Index 2.6 Fair 3.8 Good 2.2 Poor 1.6 Poor
International Roughness Index (IRI,
in/mi)< 95 Good 56 (avg.) Excellent
90.5 (avg.)
Good 156 (avg.) Poor
Roughness Index (RI) 3.40 Good 3.95 Good 3.33 Good 2.51 Fair
Average Rut Depth (inch)
0.43” Fair 0.24” Good 0.46” Fair 0.24” Good
Distress Type Structural Condition Assessed from FWD Data
Pavement Section I-15 I-84 US-95 SH-55
Percentage in Length Rating Percentage in
Length Rating Percentage in Length Rating Percentage in
Length Rating
Surface 80 GOOD 100 GOOD 65 POOR 60 POOR
Base 100 GOOD 95 GOOD 40 GOOD 40 GOOD
Subgrade 25 POOR 25 POOR 75 POOR 65 POOR
57th Idaho Asphalt Conference, October 26, 2017
19

39
Layer I-15 I-84 US-95 SH-55
Surface
Base
Subgrade
Summary of Assessment Results
40
Research Outcome
57th Idaho Asphalt Conference, October 26, 2017
20
41
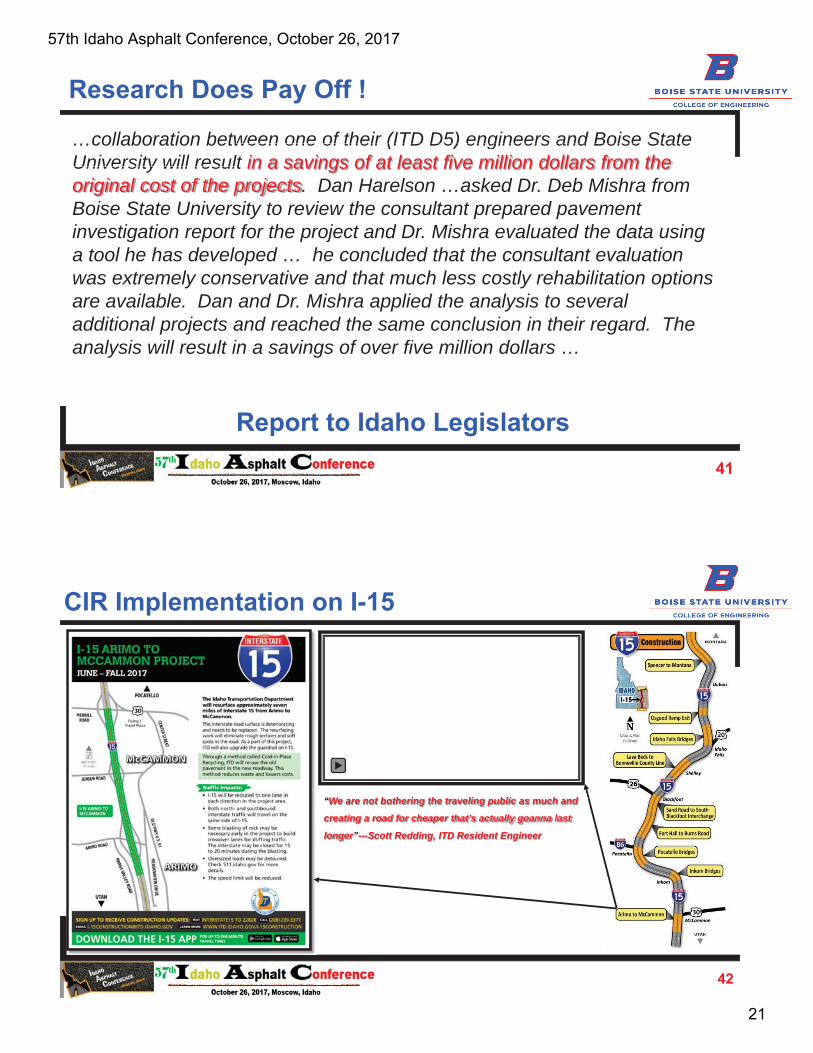
…collaboration between one of their (ITD D5) engineers and Boise State University will result
ween one of their (ITD D5) engineers and Boise Statelt in a savings of at least five million dollars from the University will resullt in a savi
original cost of the projects. Dan Harelson …asked Dr. Deb Mishra from Boise State University to review the consultant prepared pavement investigation report for the project and Dr. Mishra evaluated the data using a tool he has developed … he concluded that the consultant evaluation was extremely conservative and that much less costly rehabilitation options are available. Dan and Dr. Mishra applied the analysis to several additional projects and reached the same conclusion in their regard. The analysis will result in a savings of over five million dollars …
Research Does Pay Off !
Report to Idaho Legislators
42
CIR Implementation on I-15
““We are not bothering the traveling public as much and
creating a road for cheapeperr that’s actually goanna last
longerer”r”------Scott Redding, ITD Resident Engineer
57th Idaho Asphalt Conference, October 26, 2017
21

43
Developing a Tool for “Quick” Implementation
44
MATLAB Tool for Rapid Analysis of FWD Data
Ability to determine percentage of roadway in
different structural conditions
57th Idaho Asphalt Conference, October 26, 2017
22

45
Network-Level Application of FWD Data[Structural Number, Layer Modulus, Service Life ]
Remaining Service Life(RL)
Solve the Equation Iteratively to Determine Ep
46
0.24R
r
PMd r
Normalized FWD Data
2
0 2
3
11
111.5
1p
pR
R
Da
d P aEEDM
a M
30.0045eff pSN D E
pE
10
10 18 0 10 10
5.19
log4.2 1.5log 9.36 log ( 1) 0.20 2.32 log 8.0710940.40
1
R R
PSI
W Z S SN M
SN
ESALs Experienced by the Existing Road
1.5
100 1 pNRL
N
Structural Number & Remaining Life Calculations
57th Idaho Asphalt Conference, October 26, 2017
23

47
0.00
1.00
2.00
3.00
4.00
5.00
6.00
0.00 1.00 2.00 3.00 4.00 5.00 6.00 7.00 8.00
Stru
ctur
al N
umbe
r
Mile Post (mile)
Structural Number (SN)-(I-15)
0.00
1.00
2.00
3.00
4.00
5.00
6.00
7.00
0.00 2.00 4.00 6.00 8.00 10.00
Stru
ctur
al N
umbe
r
Mile Post (mile)
Structural Number (SN)-(I-84)
0.00
1.00
2.00
3.00
4.00
5.00
6.00
0.00 1.00 2.00 3.00 4.00 5.00 6.00 7.00
Stru
ctur
al N
umbe
r
Mile Post (mile)
Structural Number (SN)-(SH-55)
0.00
1.00
2.00
3.00
4.00
5.00
6.00
7.00
0.0 2.0 4.0 6.0 8.0 10.0 12.0
Stru
ctur
al N
umbe
r
Mile Post (mile)
Structural Number (SN)-(US-95)
Sample Representation of Network-Level Pavement Condition
48
Excel Tool for Network-Level Sneff Calculations
57th Idaho Asphalt Conference, October 26, 2017
24

49
Mechanistic Validation of Deflection Basin Parameters using Finite Element Modeling
50
Pavement Modeling Purpose:
To determine the pavement responses like
stresses, strains, and deflections due to the
application of load.
The common structural models:
Layered Elastic Models (All layers)
Visco-Elastic Modeling. (HMA layer)
Stress-Dependent Modulus (Base and
Subgrade layers)
Ref: http://elibrary.bharathuniv.ac.in/NPTEL/105101087/Transportation%20Engg%201/20-Ltexhtml/nptel_ceTEI_L20.pdf
Numerical Modeling
Adequacy of DBP
Layer Modulus
Shape of DBP
Viscoelastic Materials Behaviors
Stress-Dependent Materials
To avoid the complexity of HMA layer viscoelasticity and Base/Subgrade stress
dependency, Linear Elastic Modeling approach was taken.
Numerical Pavement Modeling
57th Idaho Asphalt Conference, October 26, 2017
25

51
Layered elastic model:Computation of stresses, strains, and deflections at any point in a pavements are relatively simple.
For the modeling only pavement layer configuration, elastic modulus and Poisson’s Ratio values are required.
Layered elastic models assumption:Pavement structural layer is homogeneous, isotropic, and linearly elastic
The layer will rebound to its original form once the load is removed.
Ref: http://elibrary.bharathuniv.ac.in/NPTEL/105101087/Transportation%20Engg%201/20-Ltexhtml/nptel_ceTEI_L20.pdf
Numerical Modeling
Adequacy of DBP
Layer Modulus
Shape of DB
Viscoelastic Materials Behaviors
Stress-Dependent Materials
To avoid the complexity of HMA layer viscoelasticity and Base/Subgrade stress
dependency, Linear Elastic Modeling approach was taken.
Numerical Pavement Modeling
52
Wheel Load
Subgrade Support
LAYERED ELASTIC METHOD
SURFACE ES, S, h
BASE EB, B, hB
SUBBASE ESB, SB hSBB (Optional Layer)
SUBGRADE ESG, SG hSG
Back-calculation
*Modulus (MR )
Modulus (MR )
Modulus (MR )
Modulus (MR )
E = Elastic Modulush = thickness
= Poisson’s Ratio
FWD Model Input Parameters
Flexible Pavement Typical Layer Input Parameters
Ref: Rodney N. Joel,(2008), Civil Engineer / Airfield Pavement Airport Engineering Division, Presented to: 2008 Eastern Region Airport Conference( Picture Modified )
57th Idaho Asphalt Conference, October 26, 2017
26
53
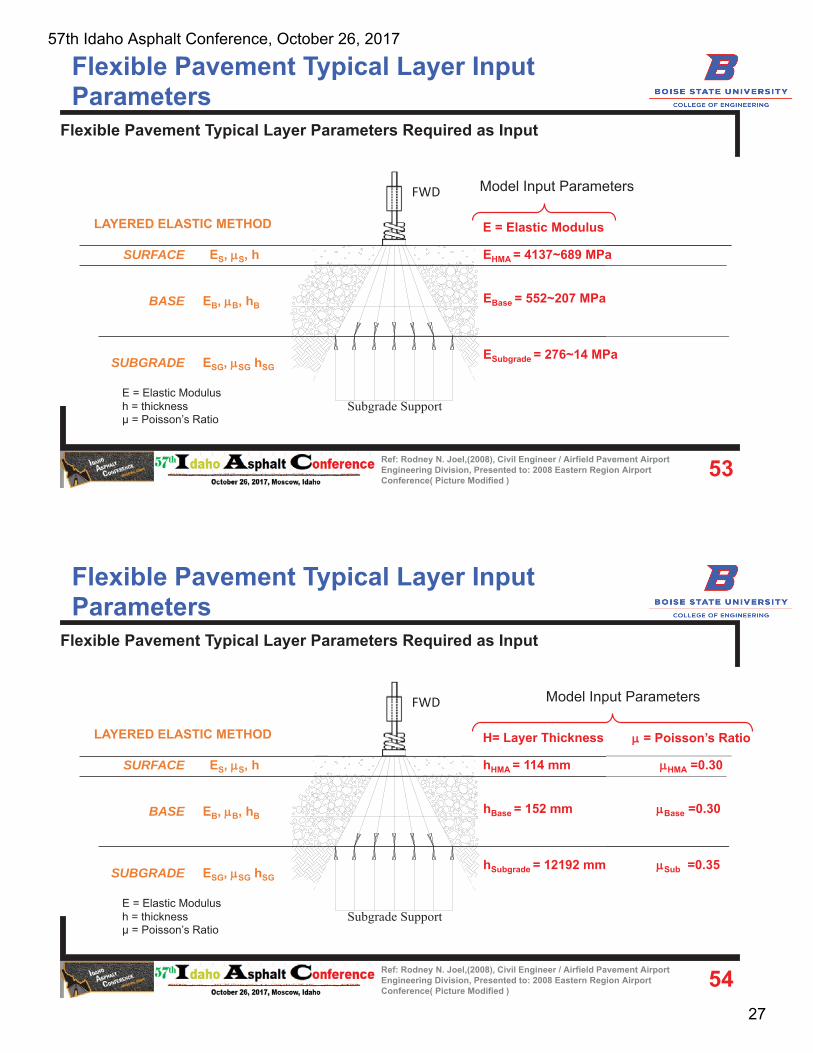
Flexible Pavement Typical Layer Parameters Required as Input
Wheel Load
Subgrade Support
LAYERED ELASTIC METHOD
SURFACE ES, S, h
BASE EB, B, hB
SUBGRADE ESG, SG hSG
E = Elastic Modulush = thickness
= Poisson’s Ratio
FWD
E = Elastic Modulus
EHMA = 4137~689 MPa
EBase = 552~207 MPa
ESubgrade = 276~14 MPa
Model Input Parameters
Ref: Rodney N. Joel,(2008), Civil Engineer / Airfield Pavement Airport Engineering Division, Presented to: 2008 Eastern Region Airport Conference( Picture Modified )
Flexible Pavement Typical Layer Input Parameters
54
Flexible Pavement Typical Layer Parameters Required as Input
Wheel Load
Subgrade Support
LAYERED ELASTIC METHOD
SURFACE ES, S, h
BASE EB, B, hB
SUBGRADE ESG, SG hSG
E = Elastic Modulush = thickness
= Poisson’s Ratio
FWD
H= Layer Thickness
hHMA = 114 mm HMA =0.30
hBase = 152 mm Base =0.30
hSubgrade = 12192 mm Sub =0.35
= Poisson’s Ratio
Model Input Parameters
Ref: Rodney N. Joel,(2008), Civil Engineer / Airfield Pavement Airport Engineering Division, Presented to: 2008 Eastern Region Airport Conference( Picture Modified )
Flexible Pavement Typical Layer Input Parameters
57th Idaho Asphalt Conference, October 26, 2017
27

55
Details of the Numerical Model
The discretized (approximate) model
The idealized modelThe physical structure
HMA
Base
Subgrade
Model Dimensions
Length 26.0 m (85.3 ft.)
Width 18.0 m (59.0 ft.)
Depth 12.7 m (41.5 ft.)
Advantages of 3-D ModelProvides the complete stress and displacement fields for the analyzed domainNot limited to linear elastic analysis
Disadvantages of 3D-FEM Require long computation timesSignificant Pre-processing and post-processing requirements.Solution is mesh-dependent.
In theory, the solution can always be improved by refining the 3D mesh.Improvement comes at the expense of time.
Ref: Rodney N. Joel,(2008), Civil Engineer / Airfield Pavement Airport Engineering Division, Presented to: 2008 Eastern Region Airport Conference
56
HMA Layer Modulus
Base Layer Modulus
Subgrade Layer Modulus
ABAQUSUU -USSSS Generated ABAQUUUUSSSS eneratedeeGeGABAQUUUUSSSSSSSSSSSSSSSSSSSSSSSSSSSSSSSSSSSSSSSSSSSSS------------- enerated eeGeGDeflection Basin
KENLAYER KENLAYER Generated Generated
Deflection Basin
Model Optimization
57th Idaho Asphalt Conference, October 26, 2017
28

57
Observation:
Variation of SCI and MLI Significant
Variation of LLI insignificant (~0)
Effect are more prominent near the loading area.
Sensitivity Analysis Using the Control Pavement Section
LayerElastic Modulus (MPa)
PI (%)SCI/BLI ( m) MLI/BDI ( m) LLI/BCI ( m) SCI
( m)MLI ( m)
LLI( m)
Min. Max. Control Max. Min. Max. Min. Max. Min. PD (%) PD (%) PD (%)
HMA 689 4137 2758 +500 170 112 210 176 86 85 -34 -16 -1
Base 34 414 276 +1118 422 242 349 177 162 105 -43 -49 -35
Subgrade 17 138 69 +712 360 238 377 139 297 61 -34 -63 -79
**PI= Percentage Increase from minimum to maximum, PD= Percentage Decrease from maximum to minimum
58
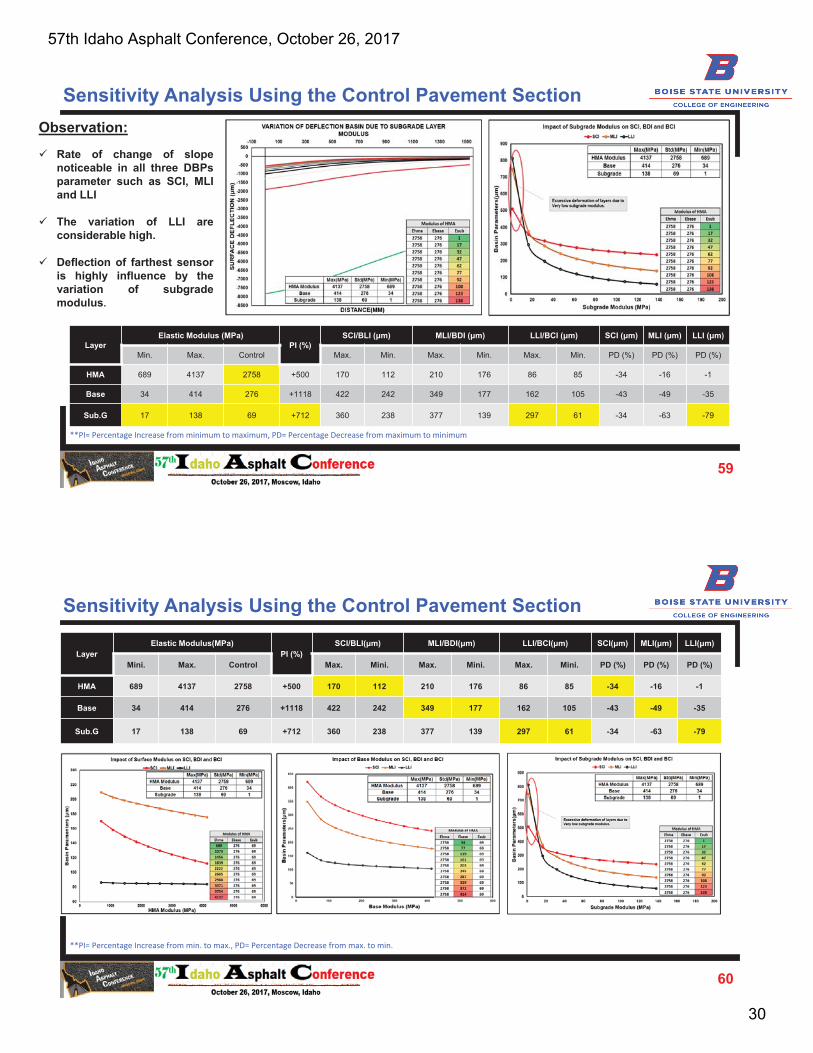
Observation:
Rate of change of slope noticable in SCI, MLI and LLI
SCI and MLI are highly influenced by changes in Base Modulus
LayerElastic Modulus (MPa)
PI (%)SCI/BLI ( m) MLI/BDI ( m) LLI/BCI ( m) SCI ( m) MLI ( m) LLI ( m)
Min. Max. Control Max. Min. Max. Min. Max. Min. PD (%) PD (%) PD (%)
HMA 689 4137 2758 +500 170 112 210 176 86 85 -34 -16 -1
Base 34 414 276 +1118 422 242 349 177 162 105 -43 -49 -35
Subgrade 17 138 69 +712 360 238 377 139 297 61 -34 -63 -79
**PI= Percentage Increase from min. to max., PD= Percentage Decrease from max. to min.
Sensitivity Analysis Using the Control Pavement Section
57th Idaho Asphalt Conference, October 26, 2017
29
59
Observation: Rate of change of slopenoticeable in all three DBPsparameter such as SCI, MLIand LLI
The variation of LLI areconsiderable high.
Deflection of farthest sensoris highly influence by thevariation of subgrademodulus.
LayerElastic Modulus (MPa)
PI (%)SCI/BLI ( m) MLI/BDI ( m) LLI/BCI ( m) SCI ( m) MLI ( m) LLI ( m)
Min. Max. Control Max. Min. Max. Min. Max. Min. PD (%) PD (%) PD (%)
HMA 689 4137 2758 +500 170 112 210 176 86 85 -34 -16 -1
Base 34 414 276 +1118 422 242 349 177 162 105 -43 -49 -35
Sub.G 17 138 69 +712 360 238 377 139 297 61 -34 -63 -79
**PI= Percentage Increase from minimum to maximum, PD= Percentage Decrease from maximum to minimum
Sensitivity Analysis Using the Control Pavement Section
60
LayerElastic Modulus(MPa)
PI (%)SCI/BLI( m) MLI/BDI( m) LLI/BCI( m) SCI( m) MLI( m) LLI( m)
Mini. Max. Control Max. Mini. Max. Mini. Max. Mini. PD (%) PD (%) PD (%)
HMA 689 4137 2758 +500 170 112 210 176 86 85 -34 -16 -1
Base 34 414 276 +1118 422 242 349 177 162 105 -43 -49 -35
Sub.G 17 138 69 +712 360 238 377 139 297 61 -34 -63 -79
**PI= Percentage Increase from min. to max., PD= Percentage Decrease from max. to min.
Sensitivity Analysis Using the Control Pavement Section
57th Idaho Asphalt Conference, October 26, 2017
30

61
LayerElastic Modulus(MPa)
PI (%)SCI/BLI( m) MLI/BDI( m) LLI/BCI( m) SCI( m) MLI( m) LLI( m)
Mini. Max. Control Max. Mini. Max. Mini. Max. Mini. PD (%) PD (%) PD (%)
HMA 689 4137 2758 +500 170 112 210 176 86 85 -34 -16 -1
Base 34 414 276 +1118 422 242 349 177 162 105 -43 -49 -35
Sub.G 17 138 69 +712 360 238 377 139 297 61 -34 -63 -79
**PI= Percentage Increase from minimum to maximum, PD= Percentage Decrease from maximum to minimum
Sensitivity Analysis Using the Control Pavement Section
Modulus variation between 100-600 ksi not capturing full SCI thresholds
62
Current Research Tasks
Incorporation of viscoelastic behavior of
HMA layer
Preparation of a synthetic database of
different pavement scenario and it’s effect
of DBPs.
Investigate the effect of crack and layer
thickness on DBPs
of crack and layer
Soft spot
57th Idaho Asphalt Conference, October 26, 2017
31
63
Moving Forward …
64
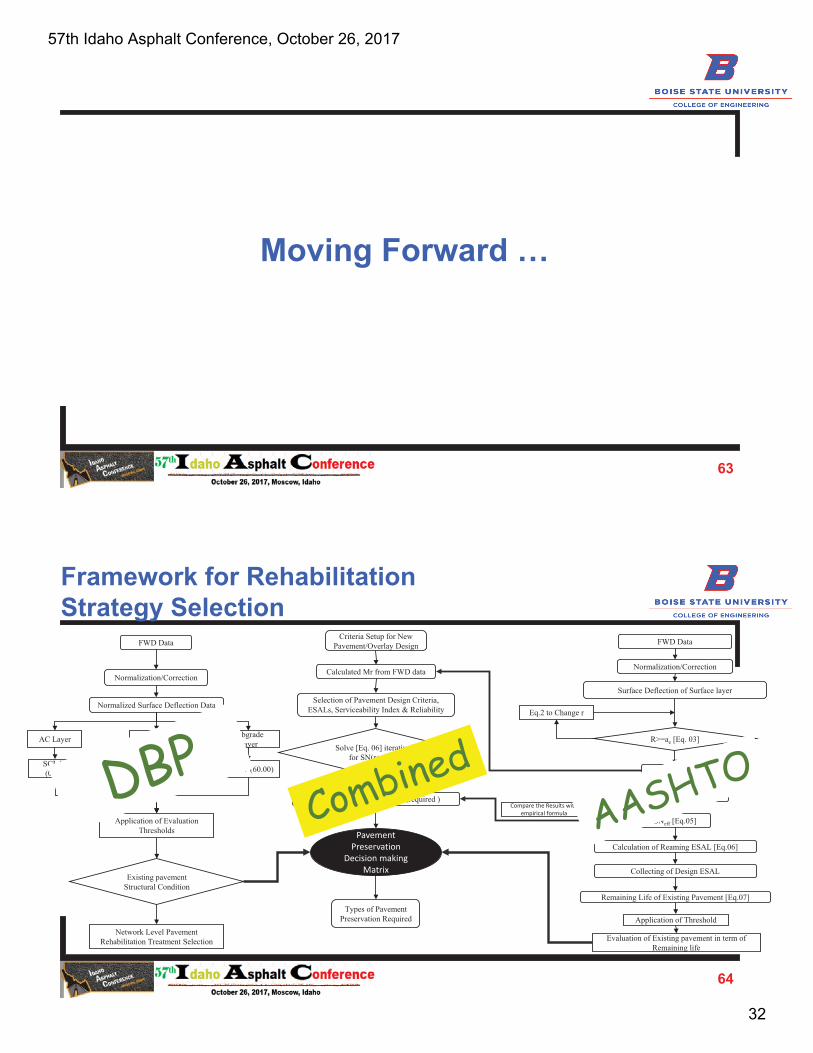
Framework for Rehabilitation Strategy Selection
Pavement Preservation
Decision making Matrix
FWD Data
Ep [Eq.04]
MR [Eq. 01]
Normalization/Correction
R>=ae [Eq. 03]
Surface Deflection of Surface layer
Eq.2 to Change r
SNeff [Eq.05]
Calculation of Reaming ESAL [Eq.06]
Collecting of Design ESAL
Remaining Life of Existing Pavement [Eq.07]
Application of Threshold
Evaluation of Existing pavement in term of Remaining life
Criteria Setup for New Pavement/Overlay Design
SN(for Rehab.)= SN(eff)-SN(required )
Calculated Mr from FWD data
Solve [Eq. 06] iteratively for SN(required)
Selection of Pavement Design Criteria, ESALs, Serviceability Index & Reliability
Types of Pavement Preservation Required
FWD Data
Normalization/Correction
Existing pavement Structural Condition
Normalized Surface Deflection Data
AC Layer Base Layer Subgrade Layer
SCI, W (0.00) BDI, MLI BCI, W (60.00)
Application of Evaluation Thresholds
Network Level Pavement Rehabilitation Treatment Selection
Compare the Results with empirical formula
57th Idaho Asphalt Conference, October 26, 2017
32

65
Framework for Rehabilitation Strategy SelectionThis framework not only follows
AASHTO-1993 guidelines, but also
considers DBP evaluation along with the
existing functional evaluation function
process.
Final results are presented as percent
layer condition, SN and RL, which depict
a complete picture of existing pavement
conditions, and will assist engineers in
selecting the best rehabilitation
strategies.
66
Futures Research Direction
Collaborate with ITD to gather as much data as possible concerning
pavement layer depths (from cores) and corresponding FWD data.
This will facilitate the validation of the DBP approach for different
pavement depths
Possible modification of DBP thresholds
The FWD Data Analysis Tool (currently under development) will be
available for use by ITD districts for rapid assessment of network-level
pavement structural condition
57th Idaho Asphalt Conference, October 26, 2017
33
67
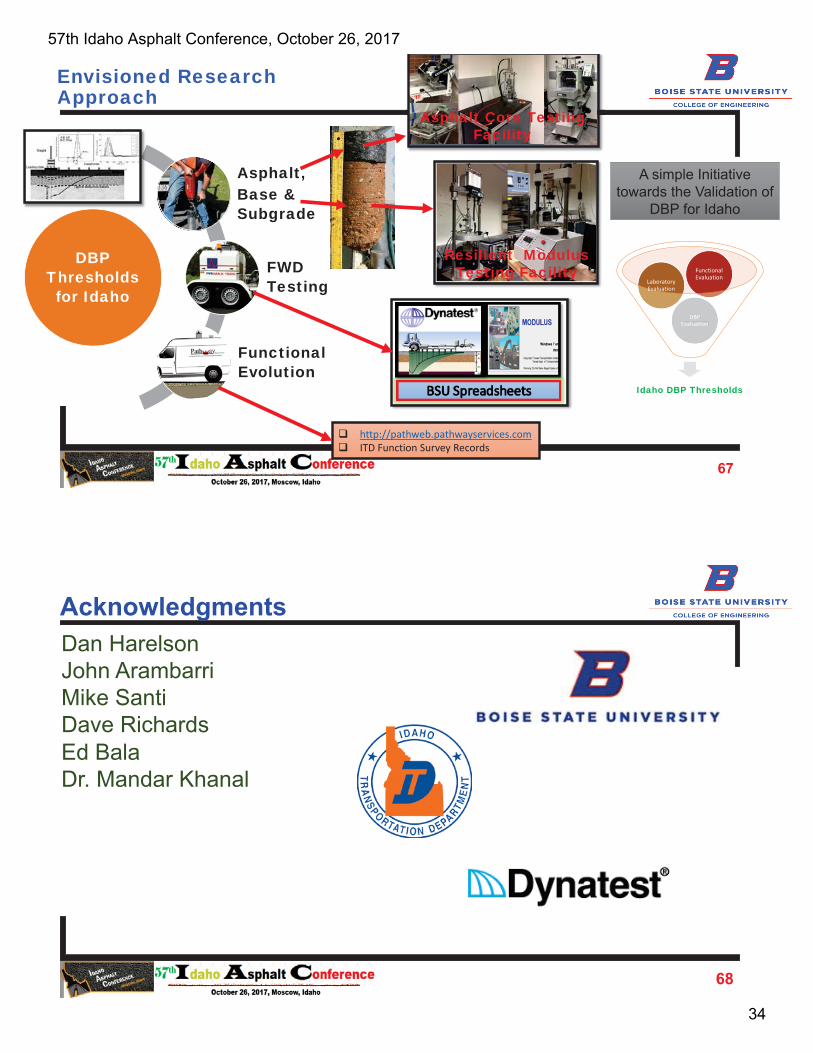
DBP Thresholds for Idaho
Asphalt, Base & Subgrade
FWD Testing
Functional Evolution
http://pathweb.pathwayservices.comITD Function Survey Records
A simple Initiative towards the Validation of
DBP for Idaho
Envisioned Research Approach
Resilient Modulus Testing Facility
Asphalt Core Testing Facility
Idaho DBP Thresholds
DBP Evaluation
Laboratory Evaluation
Functional Evaluation
DBP Evaluation
Eval
68
AcknowledgmentsDan HarelsonJohn ArambarriMike SantiDave RichardsEd BalaDr. Mandar Khanal
57th Idaho Asphalt Conference, October 26, 2017
34

Thank YouDeb Mishra, Ph.D., P.E.
Assistant ProfessorDepartment of Civil Engineering
Boise State University; ERB 3137Tel: (208) 426-3710
Email: [email protected]
Thanks to all organizers and sponsors agencies
57th Idaho Asphalt Conference, October 26, 2017
35