Use of Satellites to Examine Cyanobacteria in California’s ... · 5/9/2016 · Use of Satellites...
33
Use of Satellites to Examine Cyanobacteria in California’s Large Waterbodies Randy Turner San Francisco Estuary Institute
Transcript of Use of Satellites to Examine Cyanobacteria in California’s ... · 5/9/2016 · Use of Satellites...
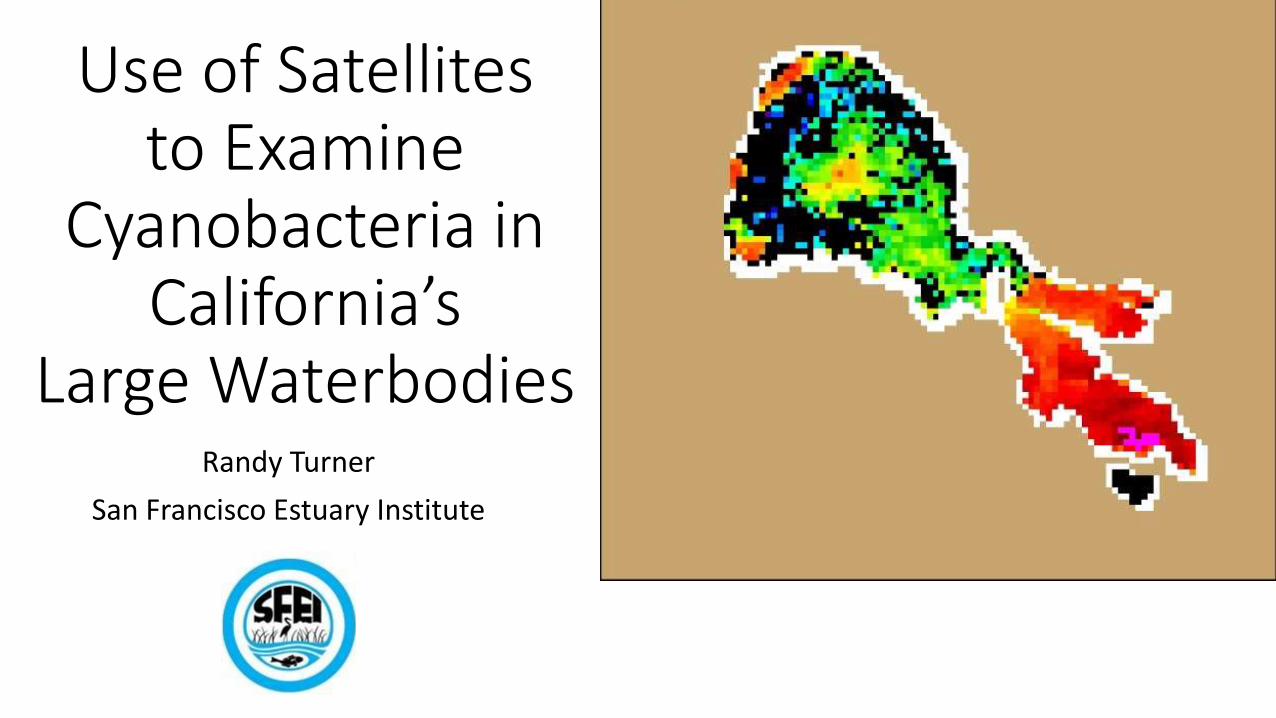
Use of Satellites to Examine
Cyanobacteria in California’s
Large WaterbodiesRandy Turner
San Francisco Estuary Institute
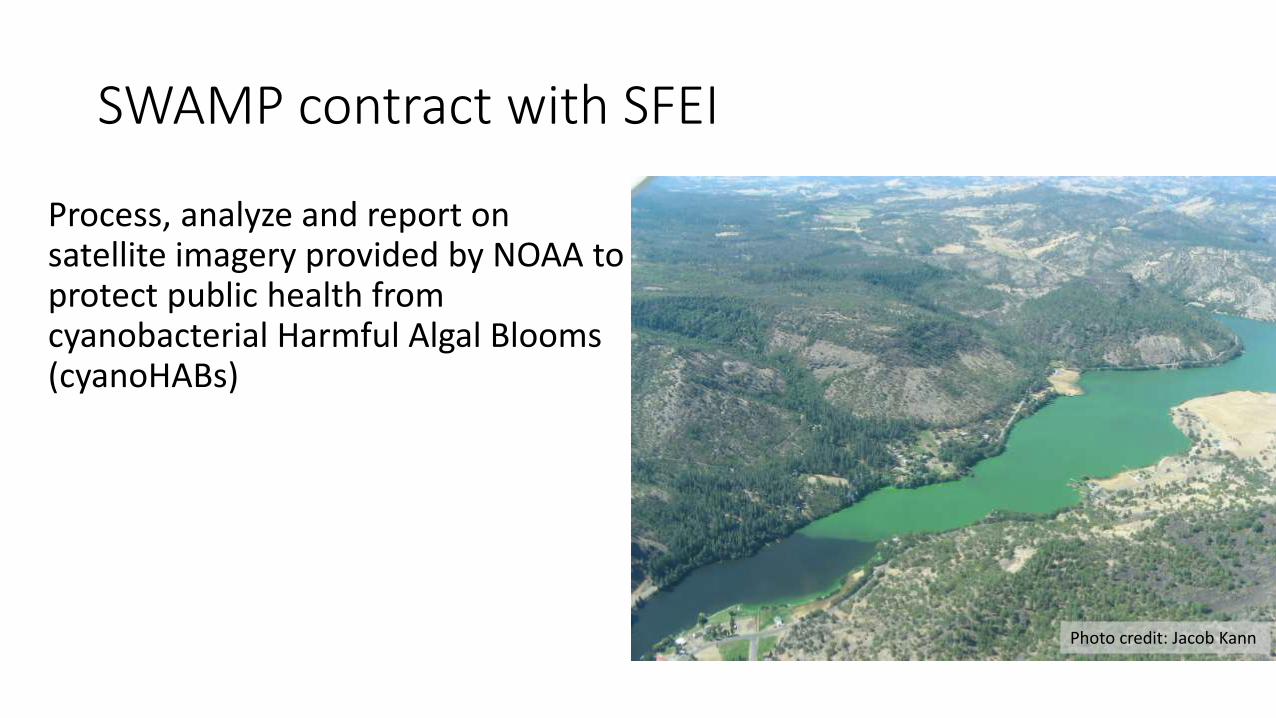
SWAMP contract with SFEI
Process, analyze and report on satellite imagery provided by NOAA to protect public health from cyanobacterial Harmful Algal Blooms (cyanoHABs)
Photo credit: Jacob Kann

Contract with SWAMP
• Develop infrastructure for processing satellite imagery
• Historic Data• Analyze data from MERIS satellite (2002-2012)• Status and Trends report on cyanoHABs in large lakes
• New Data• Analyze data from OLCI on Sentinel-3 satellite (launched 2/16)
• Reporting• Create web portal for viewing imagery and related data• Inform waterbody managers when bloom conditions occur• Issue regular bulletins and newsletters to public
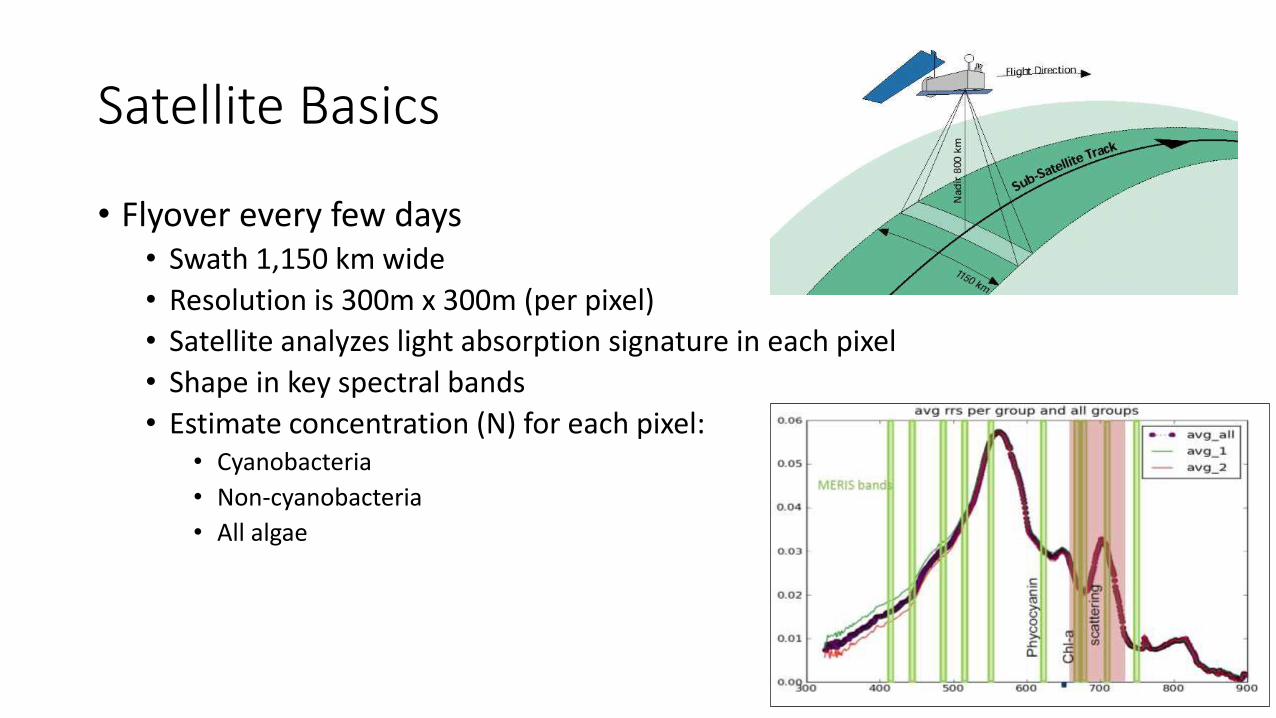
Satellite Basics
• Flyover every few days• Swath 1,150 km wide
• Resolution is 300m x 300m (per pixel)
• Satellite analyzes light absorption signature in each pixel
• Shape in key spectral bands
• Estimate concentration (N) for each pixel:• Cyanobacteria
• Non-cyanobacteria
• All algae

Satellite Basics
• Each pixel assigned a value of N (1-249)
• Wind, clouds, etc. impact blooms
• Generate 10 day max composite 249
1
Data Processing
6/30/2009 7/2/2009 7/4/2009
7/6/2009
7/5/2009
7/9/20097/8/2009
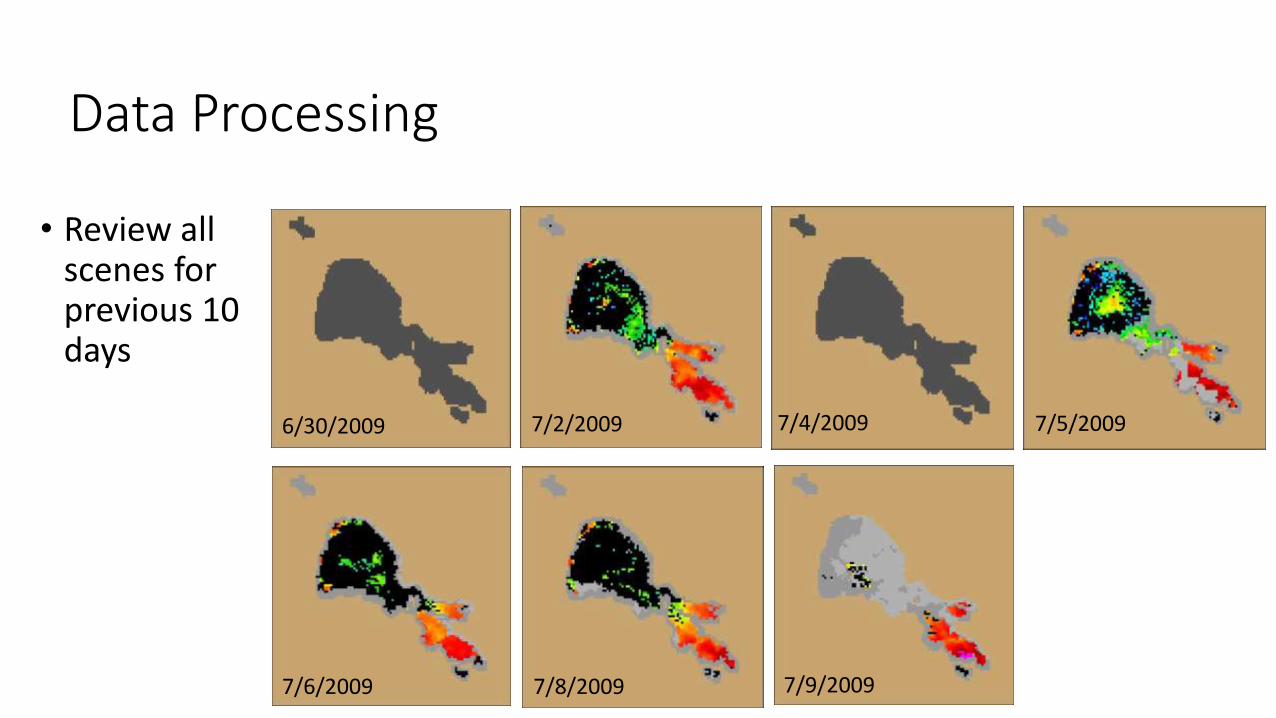
• Review all scenes for previous 10 days

Data Processing
6/30/2009 7/2/2009 7/4/2009
7/6/2009
7/5/2009
7/9/20097/8/2009
• Review all scenes for previous 10 days
• Determine maximum value for each pixel location
Data Processing
6/30/2009 7/2/2009 7/4/2009
7/6/2009
7/5/2009
10 Day Max Composite7/9/20097/8/2009
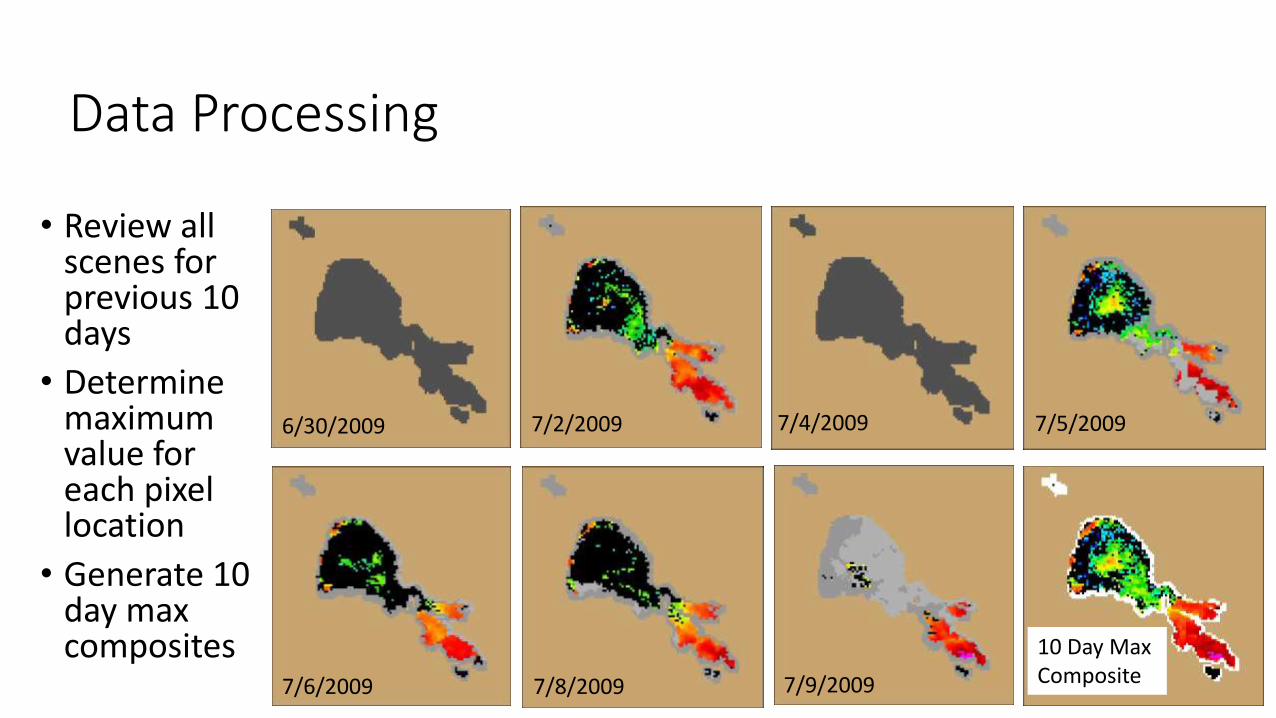
• Review all scenes for previous 10 days
• Determine maximum value for each pixel location
• Generate 10 day max composites
Generate Statistics
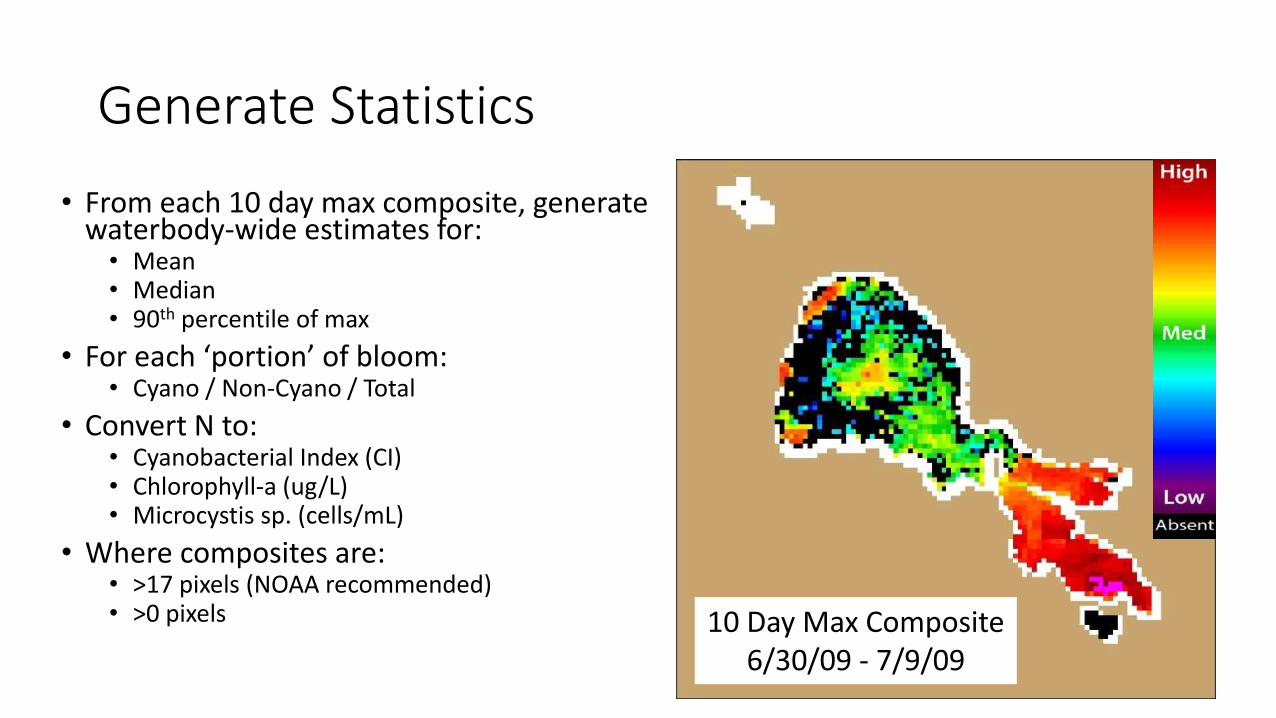
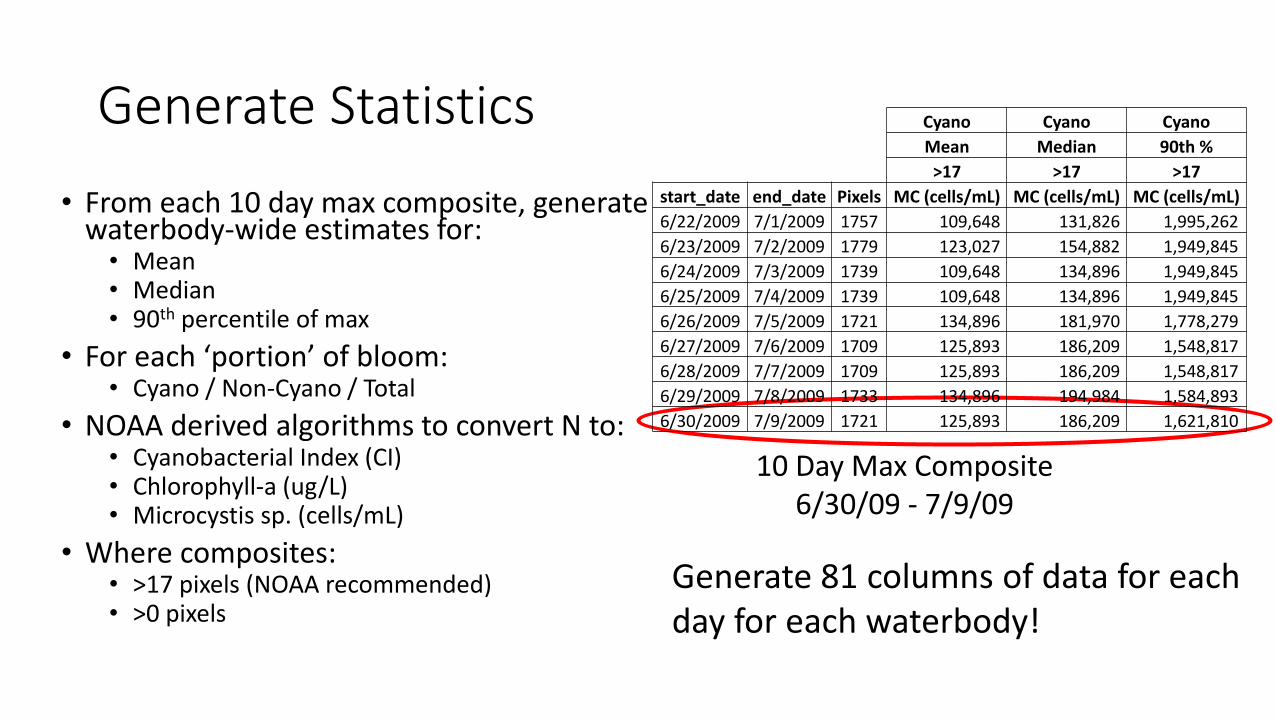
• From each 10 day max composite, generatewaterbody-wide estimates for:• Mean• Median• 90th percentile of max
• For each ‘portion’ of bloom:• Cyano / Non-Cyano / Total
• Convert N to:• Cyanobacterial Index (CI) • Chlorophyll-a (ug/L)• Microcystis sp. (cells/mL)
• Where composites are:• >17 pixels (NOAA recommended)• >0 pixels 10 Day Max Composite
6/30/09 - 7/9/09
Generate Statistics
• From each 10 day max composite, generate waterbody-wide estimates for:• Mean• Median• 90th percentile of max
• For each ‘portion’ of bloom:• Cyano / Non-Cyano / Total
• NOAA derived algorithms to convert N to:• Cyanobacterial Index (CI) • Chlorophyll-a (ug/L)• Microcystis sp. (cells/mL)
• Where composites:• >17 pixels (NOAA recommended)• >0 pixels
10 Day Max Composite6/30/09 - 7/9/09
Generate 81 columns of data for each day for each waterbody!
Cyano Cyano Cyano
Mean Median 90th %
>17 >17 >17
start_date end_date Pixels MC (cells/mL) MC (cells/mL) MC (cells/mL)
6/22/2009 7/1/2009 1757 109,648 131,826 1,995,262
6/23/2009 7/2/2009 1779 123,027 154,882 1,949,845
6/24/2009 7/3/2009 1739 109,648 134,896 1,949,845
6/25/2009 7/4/2009 1739 109,648 134,896 1,949,845
6/26/2009 7/5/2009 1721 134,896 181,970 1,778,279
6/27/2009 7/6/2009 1709 125,893 186,209 1,548,817
6/28/2009 7/7/2009 1709 125,893 186,209 1,548,817
6/29/2009 7/8/2009 1733 134,896 194,984 1,584,893
6/30/2009 7/9/2009 1721 125,893 186,209 1,621,810
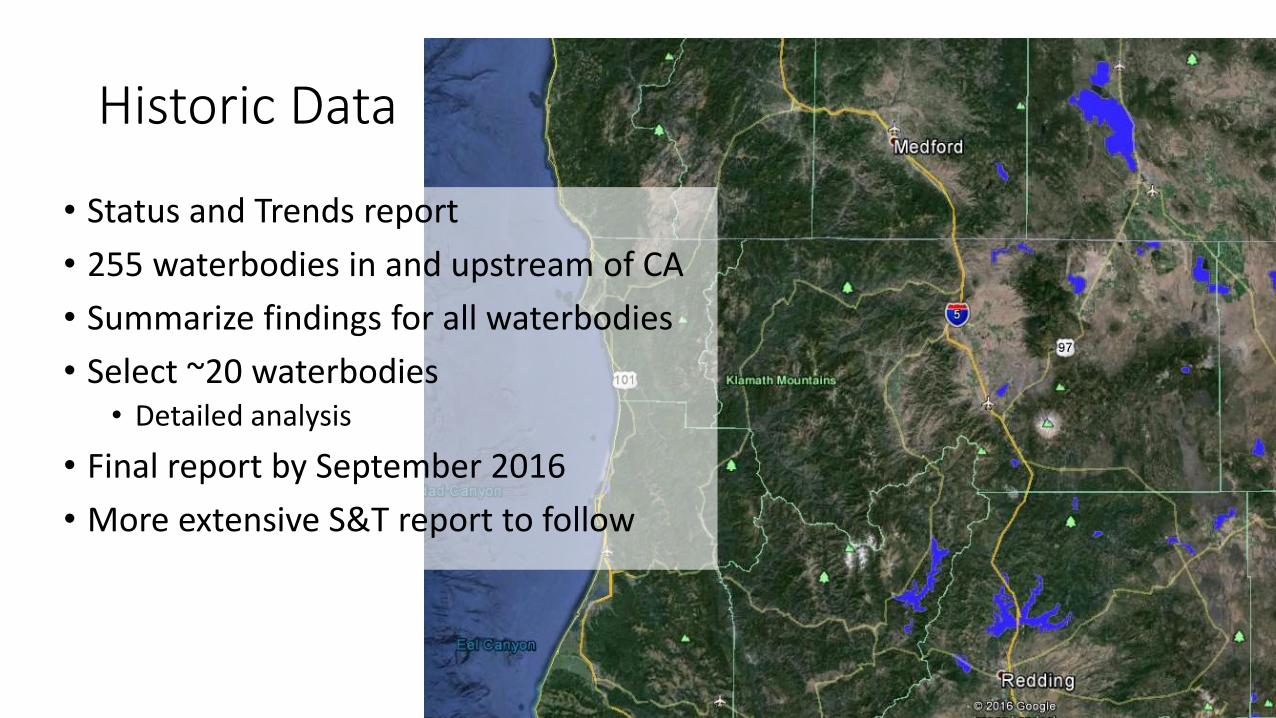
Historic Data
• Status and Trends report
• 255 waterbodies in and upstream of CA
• Summarize findings for all waterbodies
• Select ~20 waterbodies• Detailed analysis
• Final report by September 2016
• More extensive S&T report to follow

Waterbodies in RB2 with MERIS Coverage

Future Data
• OLCI/Sentinel-3 satellite
• Download and analyze new data regularly
• Communicate data to guide event response monitoring by:• Waterbody managers• County public health officials• Regional Board/SWAMP
• Publish:• Bi-weekly bulletins• Quarterly newsletter• Web maps and data
10 Day Max Composite6/30/09 - 7/9/09
Need contact information

Interactive Maps for MyWaterQuality Portal
• DRAFT mock-ups of what interactive maps may look like
• Posted Waterbody map
• Satellite Data map

Water Board Region 2______
Anderson Lake
Broad Slough
Calaveras Reservoir
Carquinesz Strait
Central Bay
Laguna Lake
Lake Curry
Lake del Valle
Lake Hennessey
Lower South Bay
Napa River island slough complex
New York Slough
Nicasio Reservoir
Quarry Lakes
Richardson Bay
Sacramento River
San Antonio Reservoir
San Joaquin River
San Pablo BaySouth Bay
Suisun BayUpper Crystal Springs Reservoir
Water Board Region 3_________
San Felipe Lake
Hernandez Reservoir
Lake San Antonio
Nacimiento Reservoir
Whale Rock Reservoir
Soda Lake
Lopez Lake
Lake Cachuma
Find By Location
Waterbody Status
Danger
Warning
Alert
Partial Closure*
*
*
*
HAB Warning Status
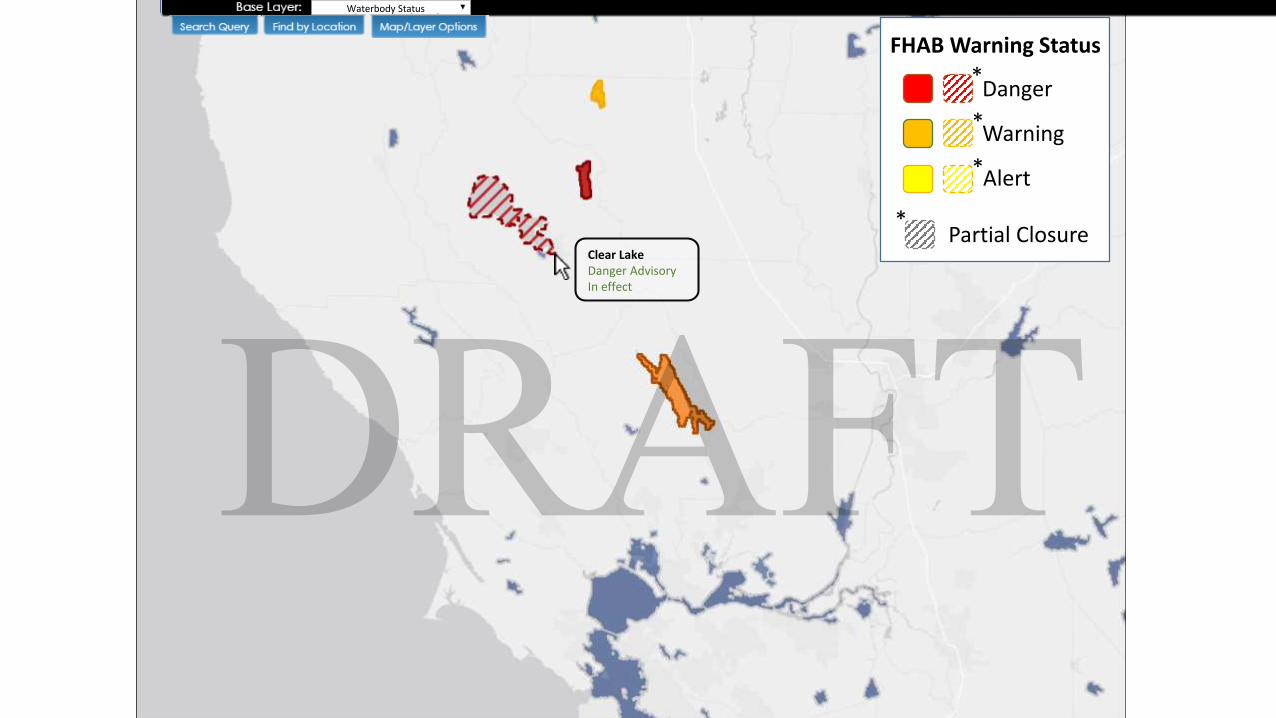
Clear Lake Danger AdvisoryIn effect
Waterbody Status
Danger
Warning
Alert
Partial Closure*
*
*
*
FHAB Warning Status
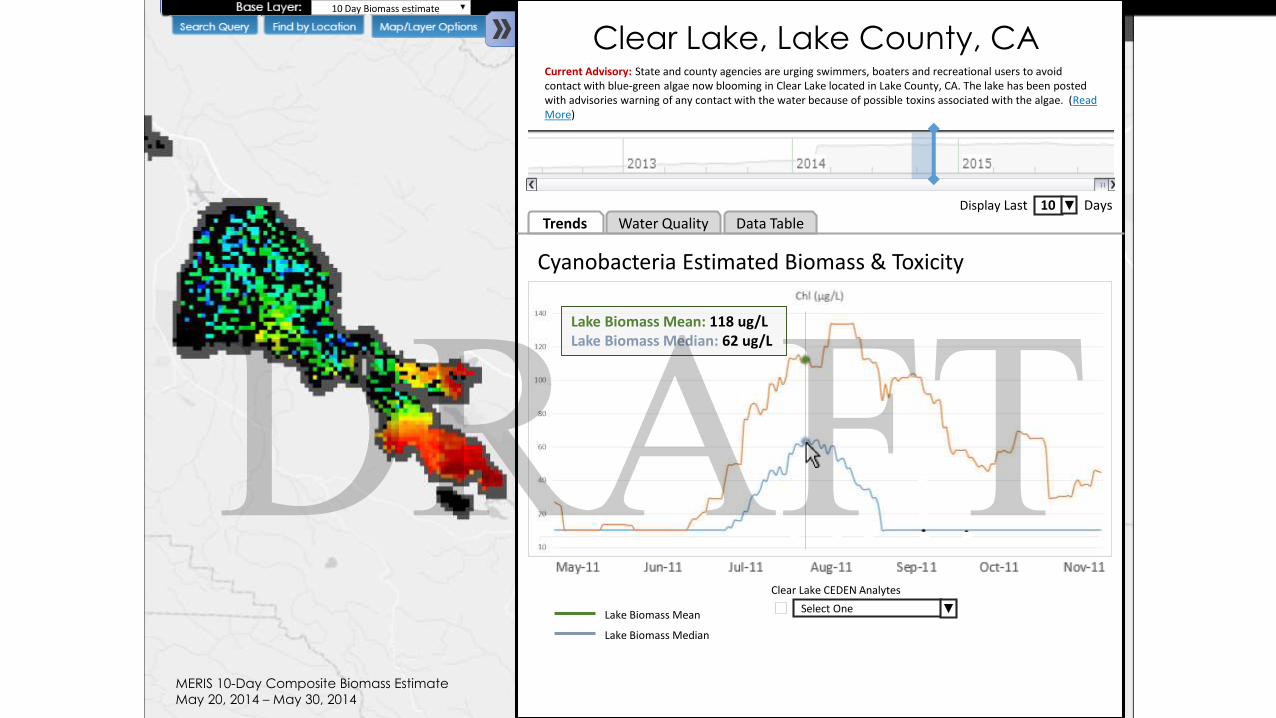
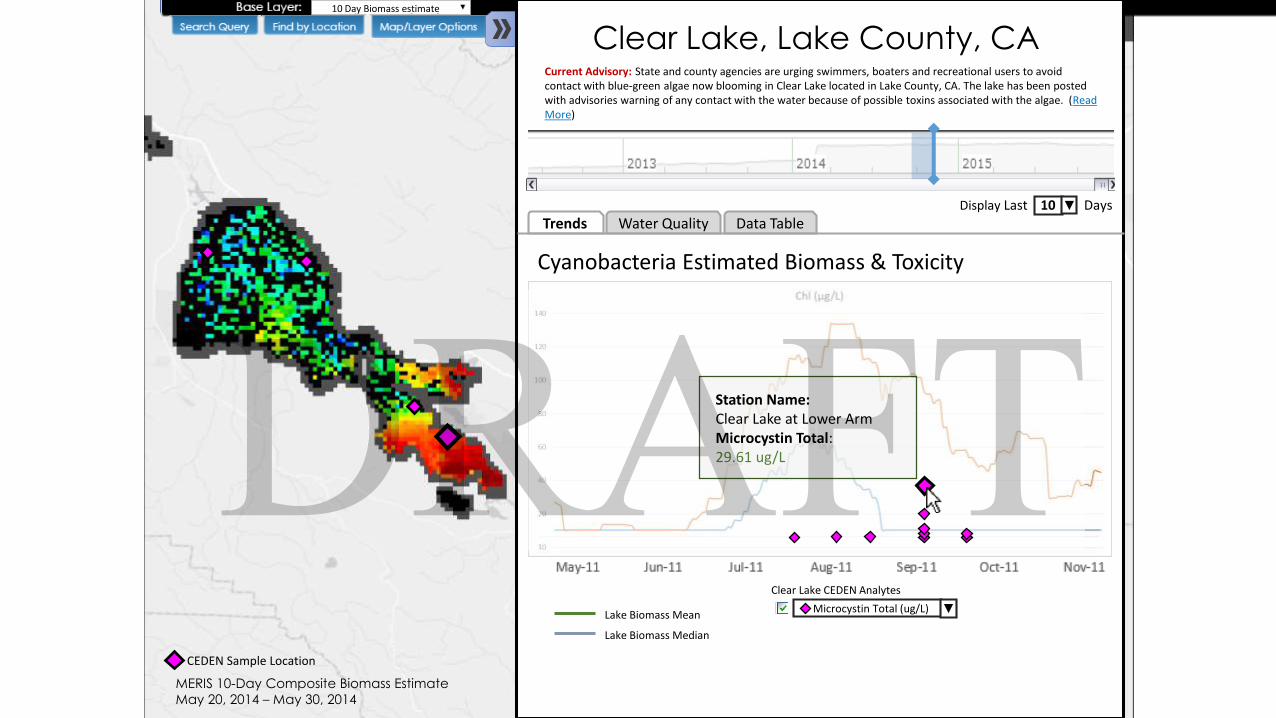
Clear Lake, Lake County, CA
Display Last 10 Days▼
Current Advisory: State and county agencies are urging swimmers, boaters and recreational users to avoid contact with blue-green algae now blooming in Clear Lake located in Lake County, CA. The lake has been posted with advisories warning of any contact with the water because of possible toxins associated with the algae. (Read More)
Trends Water Quality Data Table
Cyanobacteria Estimated Biomass & Toxicity
MERIS 10-Day Composite Biomass Estimate
May 20, 2014 – May 30, 2014
Lake Biomass Mean
Lake Biomass Median
10 Day Biomass estimate
▼
Clear Lake CEDEN Analytes
Select One
Lake Biomass Mean: 118 ug/LLake Biomass Median: 62 ug/L
Clear Lake, Lake County, CA
Display Last 10 Days▼
Trends Water Quality Data Table
Cyanobacteria Estimated Biomass & Toxicity
MERIS 10-Day Composite Biomass Estimate
May 20, 2014 – May 30, 2014
CEDEN Sample Location
10 Day Biomass estimate
sd
Station Name:Clear Lake at Lower ArmMicrocystin Total:29.61 ug/L
Current Advisory: State and county agencies are urging swimmers, boaters and recreational users to avoid contact with blue-green algae now blooming in Clear Lake located in Lake County, CA. The lake has been posted with advisories warning of any contact with the water because of possible toxins associated with the algae. (Read More)
Lake Biomass Mean
Lake Biomass Median
▼
Clear Lake CEDEN Analytes
Microcystin Total (ug/L)

for
Clear Lake, Lake County, CA
Trends Water Quality Data Table
MERIS Analysis Data
Download Table
MERIS 10-Day Composite Biomass Estimate
May 20, 2014 – May 30, 2014
10 Day Biomass estimate
Current Advisory: State and county agencies are urging swimmers, boaters and recreational users to avoid contact with blue-green algae now blooming in Clear Lake located in Lake County, CA. The lake has been posted with advisories warning of any contact with the water because of possible toxins associated with the algae. (Read More)
Select Data for Waterbody
MERIS Analysis Data
CEDEN Data
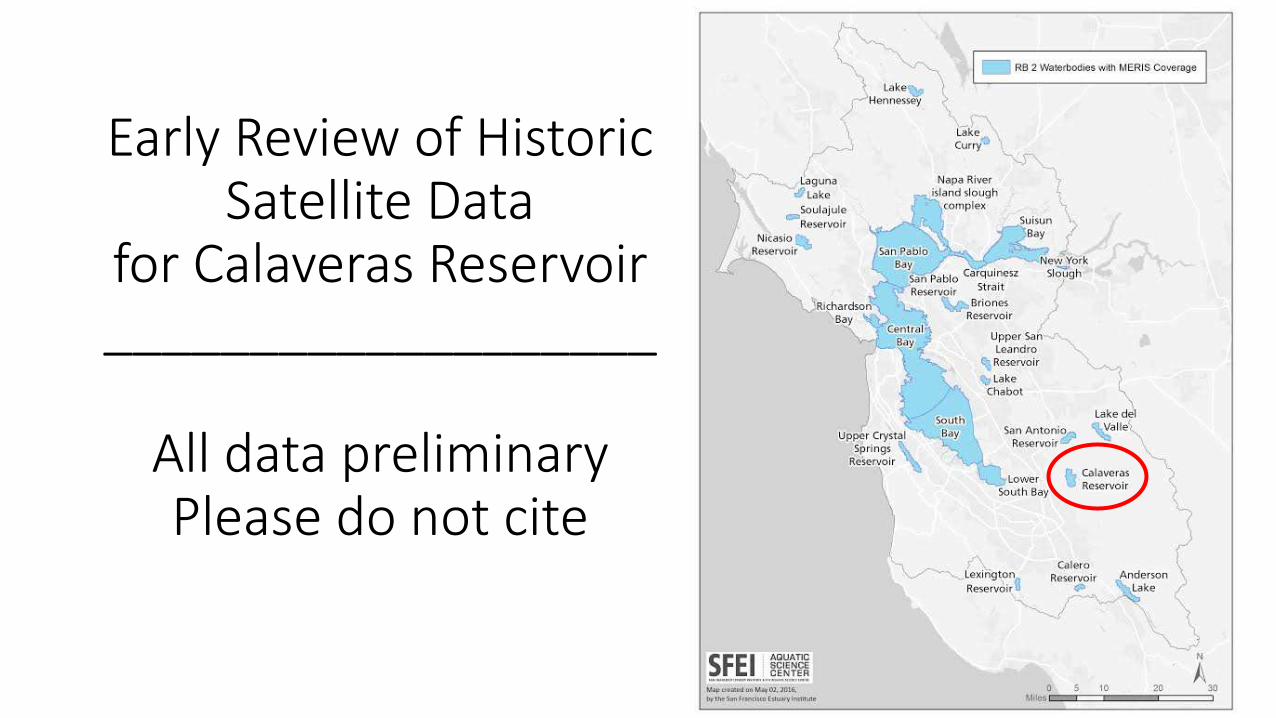
Early Review of Historic Satellite Data
for Calaveras Reservoir___________________
All data preliminary Please do not cite

2,146
1,057
401
Daily Pixel Counts >18 pixels=Green, 1 to 17 pixels=Yellow, No Data=Red
Calaveras Reservoir Lake Chabot
356
3,248
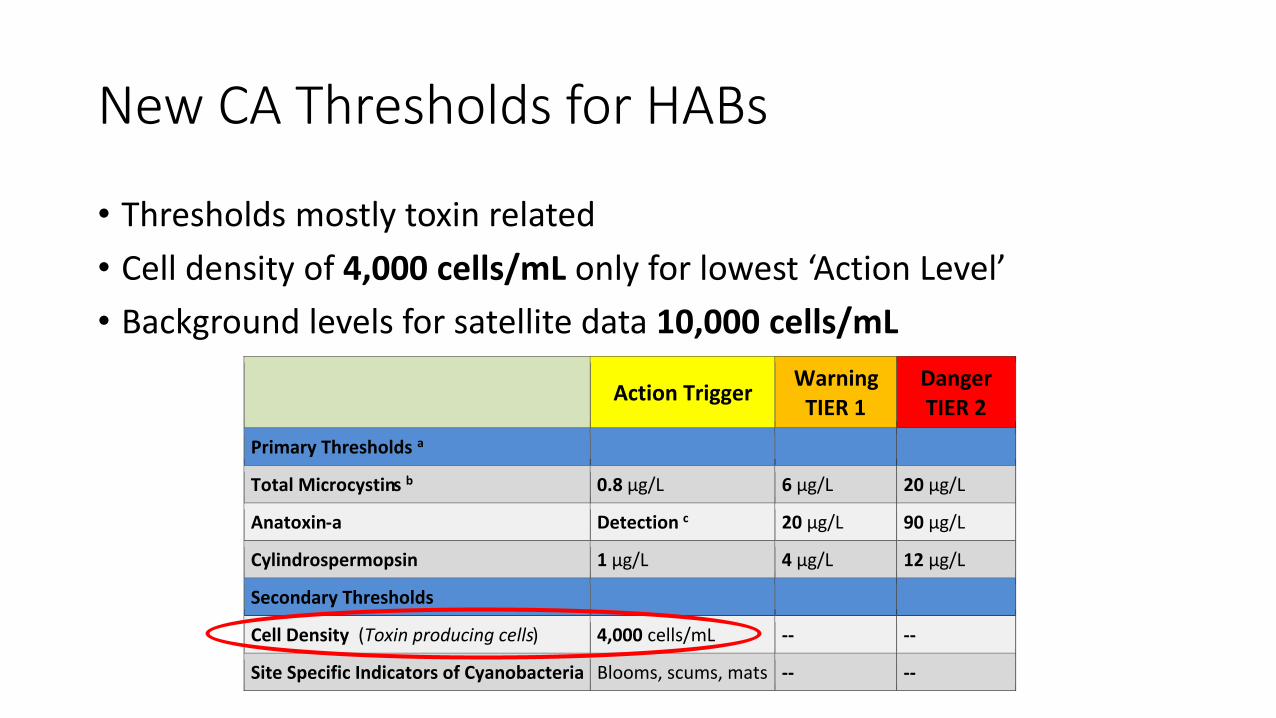
New CA Thresholds for HABs
• Thresholds mostly toxin related
• Cell density of 4,000 cells/mL only for lowest ‘Action Level’
• Background levels for satellite data 10,000 cells/mL
Action Trigger Warning
TIER 1 Danger TIER 2
Primary Thresholds a
Total Microcystins b 0.8 µg/L 6 µg/L 20 µg/L
Anatoxin-a Detection c 20 µg/L 90 µg/L
Cylindrospermopsin 1 µg/L 4 µg/L 12 µg/L
Secondary Thresholds
Cell Density (Toxin producing cells) 4,000 cells/mL -- --
Site Specific Indicators of Cyanobacteria Blooms, scums, mats -- --

0
100,000
200,000
300,000
400,000
500,000
600,000
700,000
800,000
900,000
Esti
mat
ed C
ell C
on
cen
trat
ion
(ce
lls/m
L)
Mean cyanobacteria cell concentration, estimated in Microcystis cells/mL for Calaveras Reservoir, CA, 2002-2012
Mean

0
100,000
200,000
300,000
400,000
500,000
600,000
700,000
800,000
900,000
Esti
mat
ed C
ell C
on
cen
trat
ion
(ce
lls/m
L)
Mean and 90% percentile of max value for cyanobacteria cell concentration, estimated in Microcystis cells/mL, for Calaveras Reservoir, CA, 2002-2012
90th Percentile Mean
0
100,000
200,000
300,000
400,000
500,000
600,000
700,000
Esti
mat
ed C
ell C
on
cen
trat
ion
(ce
lls/m
L)
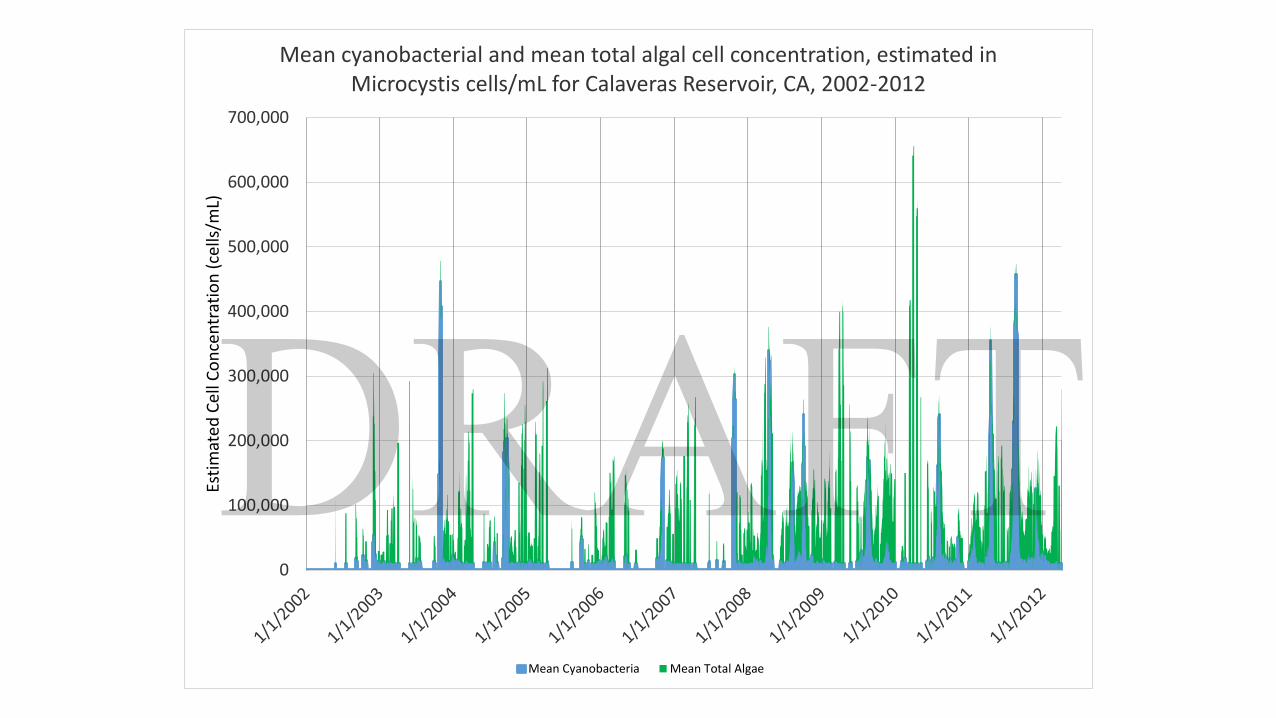
Mean cyanobacterial and mean total algal cell concentration, estimated in Microcystis cells/mL for Calaveras Reservoir, CA, 2002-2012
Mean Cyanobacteria Mean Total Algae
-
100,000
200,000
300,000
400,000
500,000
600,000
700,000
800,000
900,000
1-Jan 1-Feb 1-Mar 1-Apr 1-May 1-Jun 1-Jul 1-Aug 1-Sep 1-Oct 1-Nov 1-Dec
Esti
mat
ed C
ell C
on
cen
trat
ion
(ce
lls/m
L)
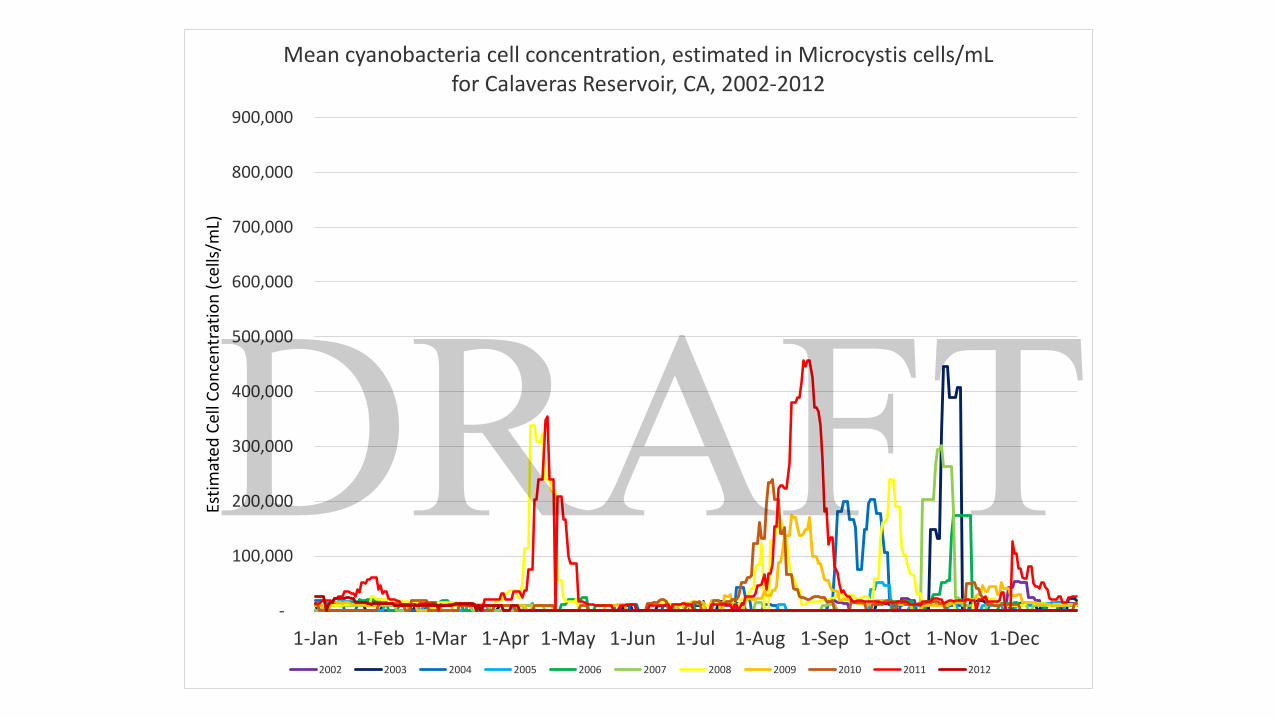
Mean cyanobacteria cell concentration, estimated in Microcystis cells/mL for Calaveras Reservoir, CA, 2002-2012
2002 2003 2004 2005 2006 2007 2008 2009 2010 2011 2012

-
100,000
200,000
300,000
400,000
500,000
600,000
700,000
800,000
900,000
1-Jan 1-Feb 1-Mar 1-Apr 1-May 1-Jun 1-Jul 1-Aug 1-Sep 1-Oct 1-Nov 1-Dec
Esti
mat
ed C
ell C
on
cen
trat
ion
(ce
lls/m
L)
Daily minimum, average, and maximum of mean cell concentration, estimated in Microcystis cells/mL for Calaveras Reservoir, CA, 2002-2012
Min Avg Max
-
100,000
200,000
300,000
400,000
500,000
600,000
700,000
800,000
900,000
1-Jan 1-Feb 1-Mar 1-Apr 1-May 1-Jun 1-Jul 1-Aug 1-Sep 1-Oct 1-Nov 1-Dec
Esti
mat
ed C
ell C
on
cen
trat
ion
(ce
lls/m
L)
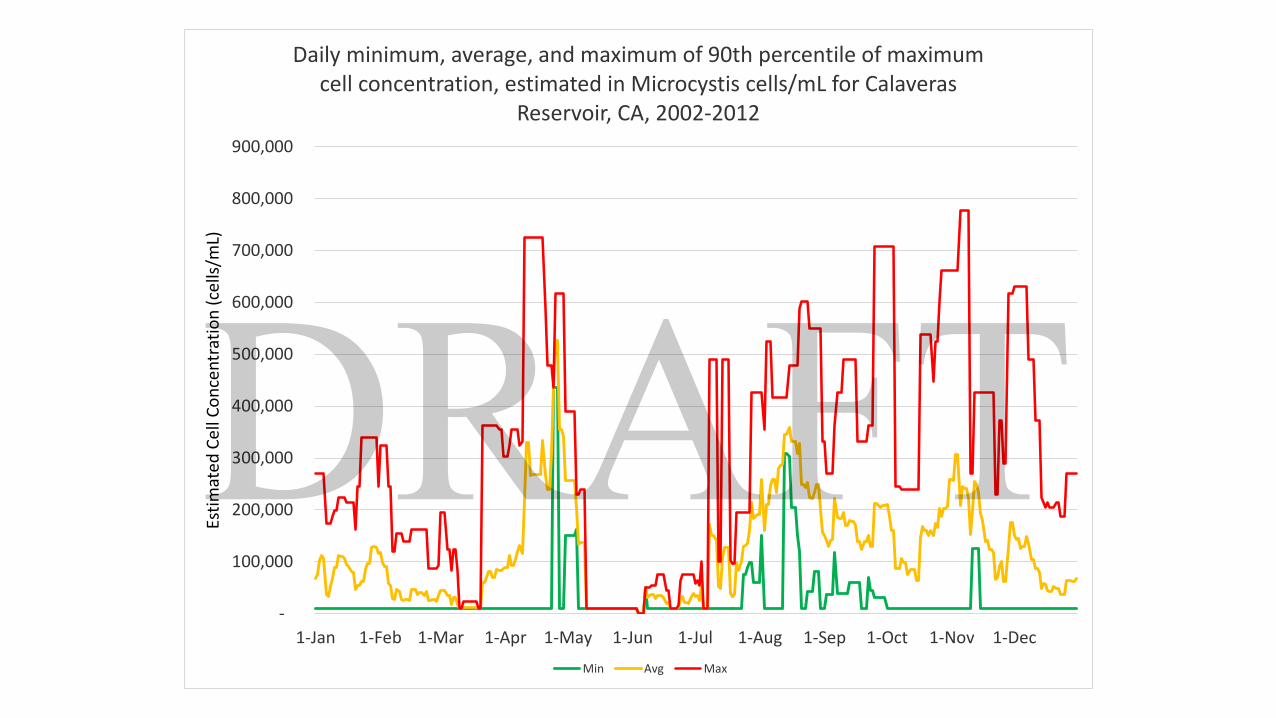
Daily minimum, average, and maximum of 90th percentile of maximum cell concentration, estimated in Microcystis cells/mL for Calaveras
Reservoir, CA, 2002-2012
Min Avg Max
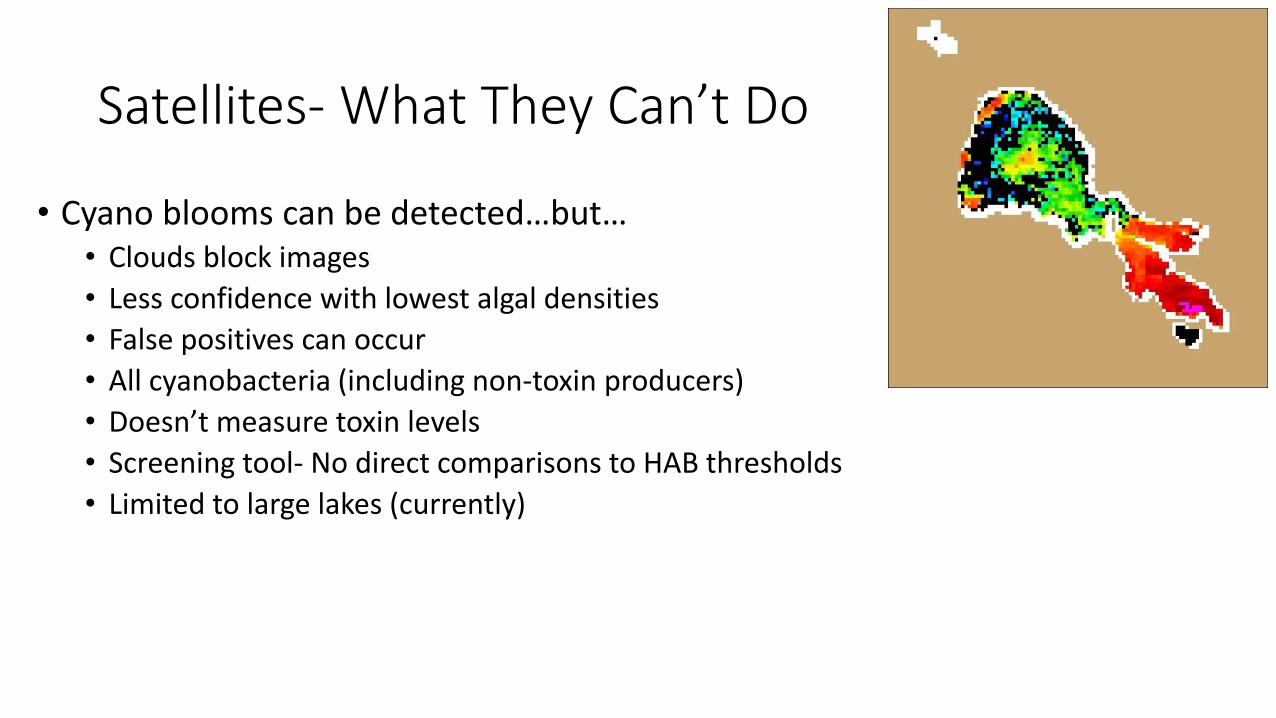
Satellites- What They Can’t Do
• Cyano blooms can be detected…but…• Clouds block images
• Less confidence with lowest algal densities
• False positives can occur
• All cyanobacteria (including non-toxin producers)
• Doesn’t measure toxin levels
• Screening tool- No direct comparisons to HAB thresholds
• Limited to large lakes (currently)
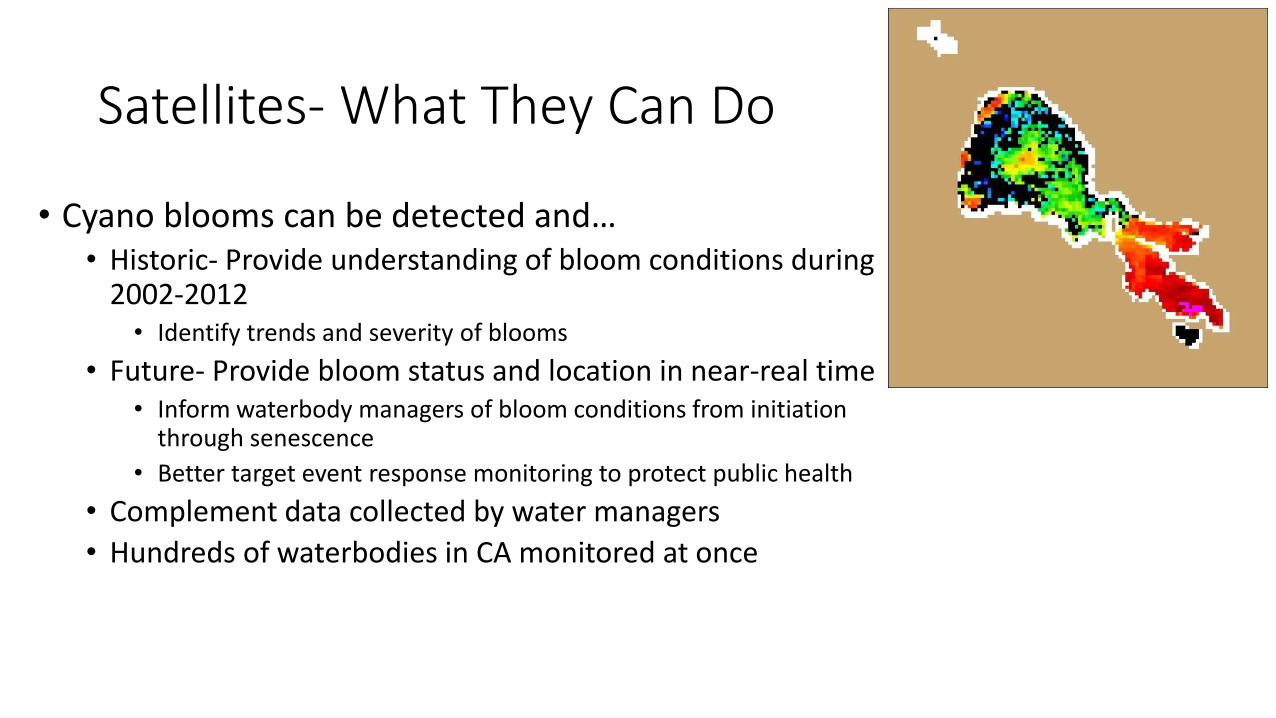
Satellites- What They Can Do
• Cyano blooms can be detected and…• Historic- Provide understanding of bloom conditions during
2002-2012• Identify trends and severity of blooms
• Future- Provide bloom status and location in near-real time• Inform waterbody managers of bloom conditions from initiation
through senescence
• Better target event response monitoring to protect public health
• Complement data collected by water managers
• Hundreds of waterbodies in CA monitored at once

Further Research Needed
• Satellite data will be available to public
• Compare to:• Water quality
• Weather
• Inflow/lake levels
• Geology
• Etc.

NOVA Satellite Episode
• ‘Earth From Space’ • Great intro to how much we can learn from satellites

Questions?
Randy Turner
San Francisco Estuary Institute
707-499-5521