use of glutamic acid containing, aqueous-organic mobile phase
20
ACTA CHROMATOGRAPHICA, NO. 17, 2006 USE OF A GLUTAMIC ACID-CONTAINING AQUEOUS–ORGANIC MOBILE PHASE FOR ON-PLATE SEPARATION, DETECTION, AND IDENTIFICATION OF CATIONIC AND NON-IONIC SURFACTANTS BY THIN-LAYER CHROMATOGRAPHY A. Mohammad and H. Shahab Analytical Research Laboratory, Department of Applied Chemistry, Faculty of Engineering and Technology, Aligarh Muslim University, Aligarh-202002, India SUMMARY A new thin-layer chromatographic system comprising silica gel G as stationary-phase and a three-component mobile phase, 0.1 M glutamic acid–methanol–acetone, 1:1:1 (v/v), has been found to be highly suitable for separation and identification of cationic and non-ionic surfactants. The experimental conditions were optimized to achieve differential migration of the surfactants. In addition to achieving separation of some important cationic and non-ionic surfactants on laboratory-prepared silica gel layers and on silica gel HPTLC plates, tetradecyltrimethylammonium bromide (TTAB) has been successfully separated from Triton X-100 (TX-100) in the presence of heavy metal cations. The method has been used for identi- fication of TTAB and TX-100 in saline water, river water, and domestic waste water. Limits of detection were determined for TTAB and TX-100. TLC coupled with spectrophotometry was used for quantitative estimation of TTAB after preliminary separation from TX-100. The effects on separation of TTAB from TX-100 of sample pH, polarity of the alcohol in the mobile phase, nature of the amino acid in the mobile phase, and the presence of alumina, kieselguhr, or cellulose in the silica layer have also been examined. INTRODUCTION Analysis of surfactants is important because of their industrial, com- mercial, and medicinal importance. Surfactants are amphiphilic substances, - 272 -
Transcript of use of glutamic acid containing, aqueous-organic mobile phase
ACTA CHROMATOGRAPHICA, NO. 17, 2006
USE OF A GLUTAMIC ACID-CONTAINING AQUEOUS–ORGANIC MOBILE PHASE
FOR ON-PLATE SEPARATION, DETECTION, AND IDENTIFICATION OF CATIONIC
AND NON-IONIC SURFACTANTS BY THIN-LAYER CHROMATOGRAPHY
A. Mohammad and H. Shahab Analytical Research Laboratory, Department of Applied Chemistry, Faculty of Engineering and Technology, Aligarh Muslim University, Aligarh-202002, India SUMMARY A new thin-layer chromatographic system comprising silica gel G as stationary-phase and a three-component mobile phase, 0.1 M glutamic acid–methanol–acetone, 1:1:1 (v/v), has been found to be highly suitable for separation and identification of cationic and non-ionic surfactants. The experimental conditions were optimized to achieve differential migration of the surfactants. In addition to achieving separation of some important cationic and non-ionic surfactants on laboratory-prepared silica gel layers and on silica gel HPTLC plates, tetradecyltrimethylammonium bromide (TTAB) has been successfully separated from Triton X-100 (TX-100) in the presence of heavy metal cations. The method has been used for identi-fication of TTAB and TX-100 in saline water, river water, and domestic waste water. Limits of detection were determined for TTAB and TX-100. TLC coupled with spectrophotometry was used for quantitative estimation of TTAB after preliminary separation from TX-100. The effects on separation of TTAB from TX-100 of sample pH, polarity of the alcohol in the mobile phase, nature of the amino acid in the mobile phase, and the presence of alumina, kieselguhr, or cellulose in the silica layer have also been examined. INTRODUCTION Analysis of surfactants is important because of their industrial, com-mercial, and medicinal importance. Surfactants are amphiphilic substances,
- 272 -
owing to the presence of polar and non-polar moieties in the same mo-lecule, which have a wide range of applications, for example as cleaning, wetting, and emulsifying agents in a variety of industrial and domestic set-tings. Because most commercial surfactant-containing products are mixtu-res of several components, special methods of separation are required for their identification. It has been reported [1] that the emulsifying and dis-persing power of a detergent can be improved by addition of a non-ionic surfactant. It is, therefore, not surprising that several analytical techniques, for example ion-exchange [2,3], reversed-phase or normal-phase high-per-formance liquid chromatography [4–7], indirect tensammetry [8], gas chro-matography [9–13], capillary zone and capillary electrophoresis [14–17], micellar electrokinetic chromatography [18], foam chromatography [19,20], and thin-layer chromatography [21–27], have been used for qualitative se-paration and identification of surfactants. Conductometry [28,29], spectro-photometry [30–36], volumetry [37], colorimetry [38], polarography [39, 40], potentiometry [41,42], gravimetry [43], and flow-injection techniques [44–48] have been used for quantitative determination of surfactants in different formulations. Fourier-transform infrared spectroscopy (FTIR) [49–52] and electrophoretic NMR [53] methods have also been established. Among these techniques, thin-layer chromatography (TLC) with its inherent advantages of a wider choice of stationary and mobile phases, flexible detection procedures, and ease of implementation remains popular among workers interested in developing less capital-intensive analytical methods for rapid routine analysis of complex mixtures of organic and in-organic substances [54,55]. In TLC, separation depends on interactions of the stationary and mobile phases with the analyte. Silica gel [25,56–59] has been the most frequently used stationary phase for separation of surfactants, followed by alumina [60], kieselguhr [61], cellulose, and other adsorbents [62,63]. Surveys of the literature on the TLC of surfactants covering the period 1960–2003 [20–26,55–58] indicate that most studies have been per-formed on non-ionic and cationic surfactants, followed by the investiga-tion of anionic and amphoteric surfactants. Most workers have used either mixed organic or aqueous–organic mobile phases containing alcohols (e.g. methanol, ethanol, or butanol) as one of the components [64–66]. Acetone, in combination with CHCl3 or aqueous NaOH (1.0 M), has also been used [67]. No work has been reported on the use of mobile phases containing amino acids (either as aqueous solutions or combined with acetone or alcohol) for TLC analysis of surfactants, however.
- 273 -
During our systematic studies on the use of surfactant-mediated mobile phases for analysis of inorganic mixtures we realized that mobile phases containing amino acids [68] in combination with surfactants have much separation potential. Well resolved spots of Au3+, Ag+, and Cu2+ from their mixtures were obtained on silica gel layers developed with 0.01 M so-dium dodecyl sulphate–0.01 M L-tryptophan, 1:9 (v/v), and 0.01 M sodium dodecyl sulphate–0.01 M L-histidine, 1:9 (v/v). It was, therefore, thought worthwhile to use the analytical potential of amino acids in combination with methanol and acetone for TLC analysis of surfactants. As a result te-tradecyltrimethylammonium bromide (TTAB) has been successfully sepa-rated from Triton X-100 (TX-100) on silica layers by use of a mixture of 0.1 M glutamic acid, methanol, and acetone as mobile phase. EXPERIMENTAL All experiments were performed at 30°C. Chemicals, Reagents, and Solutions
Silica gel G, methanol, and propanol were obtained from Merck, India, and silica gel 60F254 HPTLC plates from Merck, Germany. Kiesel-guhr cellulose, glutamic acid, aspartic acid, DL-aminobutyric acid, amino-acetic acid, and methionine were obtained from CDH, India. Ethanol was from Changshu Yangyuan Chemical, China, butanol was from Sarabhai Chemicals, India, and acetone was from Qualigens, India. All chemicals were of analytical-reagent grade. The surfactants studied were Triton-X100 (TX-100), Brij-35 (BJ-35), Tween20 (TW-20), Cween20 (CW20), Cween40 (CW40), Cween60 (CW60), cetylpyridinium chloride (CPC), cetyltrimethylammonium bro-mide (CTAB), tetradecyltrimethylammonium bromide (TTAB), hexadecyl-trimethylammonium chloride (HDTAC), dodecyltrimethylammonium bro-mide (DTAB), and N-lauryolsarcosine sodium salt (LSN). Solutions (1%, or 1 g per 100 mL) of the surfactants were prepared in methanol. Chromatography
The stationary and mobile phases used are listed in Tables I and II, respectively.
- 274 -
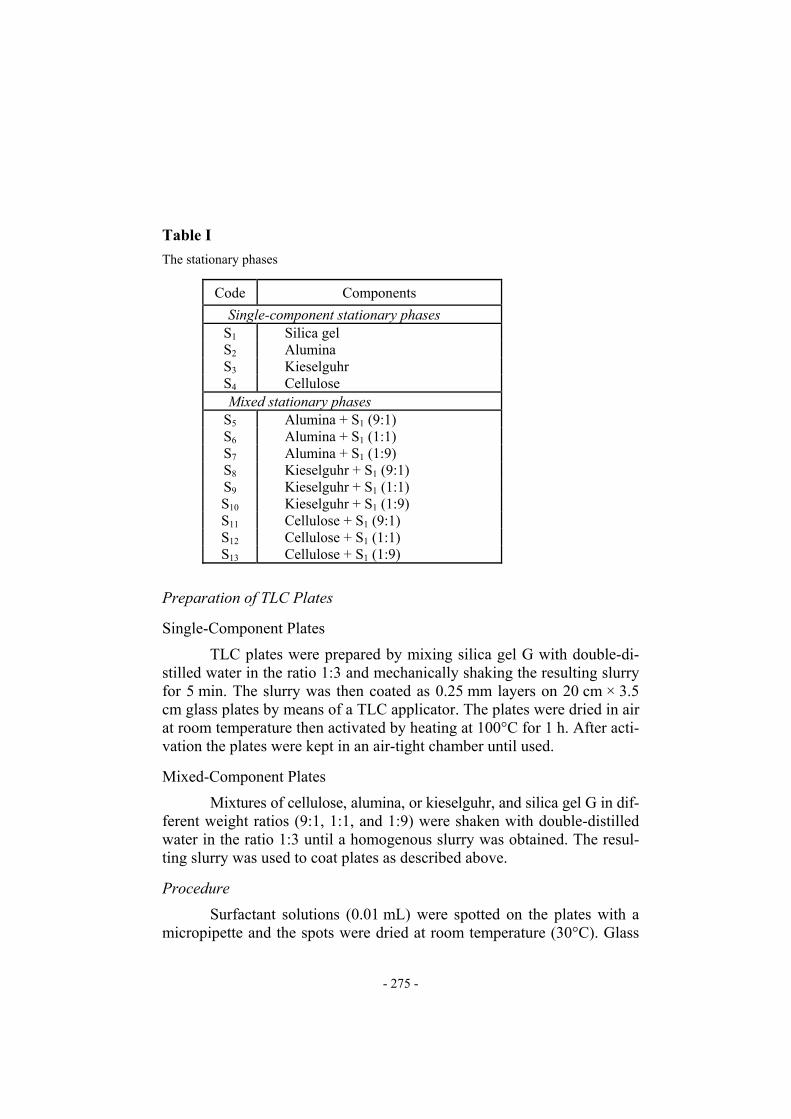
Table I
The stationary phases
Code Components Single-component stationary phases
S1 Silica gel S2 Alumina S3 Kieselguhr S4 Cellulose
Mixed stationary phases S5 Alumina + S1 (9:1) S6 Alumina + S1 (1:1) S7 Alumina + S1 (1:9) S8 Kieselguhr + S1 (9:1) S9 Kieselguhr + S1 (1:1) S10 Kieselguhr + S1 (1:9) S11 Cellulose + S1 (9:1) S12 Cellulose + S1 (1:1) S13 Cellulose + S1 (1:9)
Preparation of TLC Plates Single-Component Plates
TLC plates were prepared by mixing silica gel G with double-di-stilled water in the ratio 1:3 and mechanically shaking the resulting slurry for 5 min. The slurry was then coated as 0.25 mm layers on 20 cm × 3.5 cm glass plates by means of a TLC applicator. The plates were dried in air at room temperature then activated by heating at 100°C for 1 h. After acti-vation the plates were kept in an air-tight chamber until used. Mixed-Component Plates
Mixtures of cellulose, alumina, or kieselguhr, and silica gel G in dif-ferent weight ratios (9:1, 1:1, and 1:9) were shaken with double-distilled water in the ratio 1:3 until a homogenous slurry was obtained. The resul-ting slurry was used to coat plates as described above. Procedure
Surfactant solutions (0.01 mL) were spotted on the plates with a micropipette and the spots were dried at room temperature (30°C). Glass
- 275 -
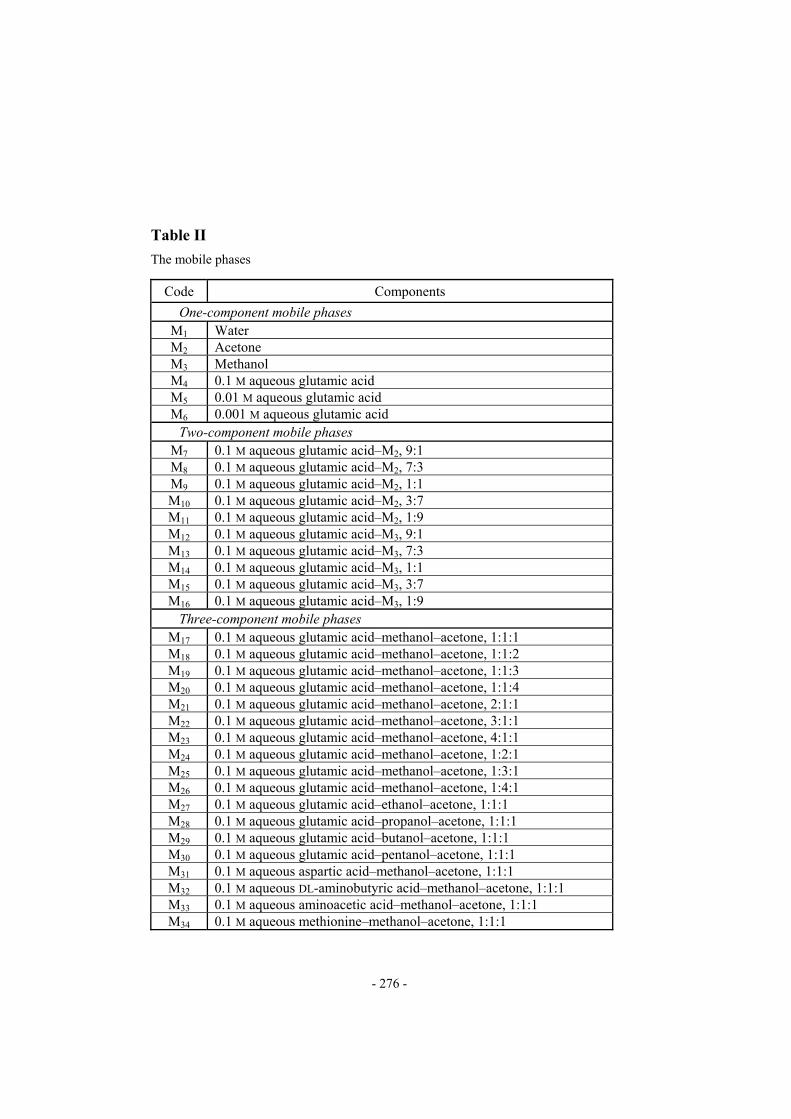
Table II
The mobile phases
Code Components One-component mobile phases
M1 Water M2 Acetone M3 Methanol M4 0.1 M aqueous glutamic acid M5 0.01 M aqueous glutamic acid M6 0.001 M aqueous glutamic acid
Two-component mobile phases M7 0.1 M aqueous glutamic acid–M2, 9:1 M8 0.1 M aqueous glutamic acid–M2, 7:3 M9 0.1 M aqueous glutamic acid–M2, 1:1 M10 0.1 M aqueous glutamic acid–M2, 3:7 M11 0.1 M aqueous glutamic acid–M2, 1:9 M12 0.1 M aqueous glutamic acid–M3, 9:1 M13 0.1 M aqueous glutamic acid–M3, 7:3 M14 0.1 M aqueous glutamic acid–M3, 1:1 M15 0.1 M aqueous glutamic acid–M3, 3:7 M16 0.1 M aqueous glutamic acid–M3, 1:9
Three-component mobile phases M17 0.1 M aqueous glutamic acid–methanol–acetone, 1:1:1 M18 0.1 M aqueous glutamic acid–methanol–acetone, 1:1:2 M19 0.1 M aqueous glutamic acid–methanol–acetone, 1:1:3 M20 0.1 M aqueous glutamic acid–methanol–acetone, 1:1:4 M21 0.1 M aqueous glutamic acid–methanol–acetone, 2:1:1 M22 0.1 M aqueous glutamic acid–methanol–acetone, 3:1:1 M23 0.1 M aqueous glutamic acid–methanol–acetone, 4:1:1 M24 0.1 M aqueous glutamic acid–methanol–acetone, 1:2:1 M25 0.1 M aqueous glutamic acid–methanol–acetone, 1:3:1 M26 0.1 M aqueous glutamic acid–methanol–acetone, 1:4:1 M27 0.1 M aqueous glutamic acid–ethanol–acetone, 1:1:1 M28 0.1 M aqueous glutamic acid–propanol–acetone, 1:1:1 M29 0.1 M aqueous glutamic acid–butanol–acetone, 1:1:1 M30 0.1 M aqueous glutamic acid–pentanol–acetone, 1:1:1 M31 0.1 M aqueous aspartic acid–methanol–acetone, 1:1:1 M32 0.1 M aqueous DL-aminobutyric acid–methanol–acetone, 1:1:1 M33 0.1 M aqueous aminoacetic acid–methanol–acetone, 1:1:1 M34 0.1 M aqueous methionine–methanol–acetone, 1:1:1
- 276 -
jars (24 cm × 6 cm) containing the mobile phase were covered with lids and left for 10 min, for saturation, before introducing the plates for develop-ment. Plates were developed by the ascending technique. Development dis-tances were 10 cm for TLC and 5 cm for HPTLC. Development times were 10–15 min for TLC and 5–10 min for HPTLC, depending on mobile-phase composition. No deterioration of the silica layers (e.g. crumbling and de-tachment) occurred as a result of the effect of water in the mobile phases. After development the plates were dried and the surfactant spots were de-tected by use of Dragendorff reagent or iodine vapour. Dragendorff reagent was prepared by mixing two solutions. Solution A was prepared from two solutions: (a) a solution of bismuth subnitrate (BiONO3.H2O; 1.7 g) in acetic acid (20 mL), diluted to 100 mL with wa-ter; and (b) a solution of potassium iodide (65 g) in water (200 mL). These solutions were transferred to a 1-L flask, acetic acid (200 mL) was added, and the solution was diluted to one litre with water. Solution B was prepa-red by dissolving barium chloride dihydrate (BaCl2.2H2O; 290 g) in water (1 L). Solutions A and B were mixed in the ratio 2:1. A glass sprayer was used to apply the reagent to the plates. For separation of mixtures, equal volumes of the surfactants were mixed and 0.01 mL of the mixture was applied to a TLC plate coated with S1. The plate was then developed with mobile phase M17, the spots were detected, and RF values of the spots of the separated surfactants were calculated. To investigate the effect of the nature (or polarity) of alcohols on the separation of TX-100 from TTAB by M17, methanol was replaced with ethanol, propanol, butanol, and pentanol and the resulting mobile phases (M27–M30) were used to examine the separation of Tx-100 and TTAB on silica gel (S1). Similarly, to examine the effect of use of different amino acids, glutamic acid in M17 was substituted by 0.1 M aspartic acid, butyric acid, aminoacetic acid, or methionine and the chromatography of TTAB and TX-100 was performed on silica gel with the resulting mobile phases M31–M34. To study the effect of the nature of the stationary phase on the mutual separation of TTAB and TX-100 the compounds were separated on different one-component and two-component adsorbents (Table II) with M17 as mobile phase. To investigate separation of the surfactants at different pH, sample pH was adjusted to the required value by addition of borate or phosphate buffer solutions of different pH.
- 277 -
For separation of microgram quantities of TX-100 from milligram quantities of TTAB, TLC plates were first spotted several times with 0.01 mL TX-100 solution (100 µg). After complete drying of the spot 0.01 mL of a series of standard solutions of TTAB containing 0.1−0.7 mg per 0.01 mL was spotted at the same positions on the TLC plate. Another TLC pla-te was first spotted several times with 0.01 mL of TTAB solution (100 µg) and then, at the same positions on the plate, with 0.01 mL of standard so-lutions containing 0.1–0.2 mg TX-100. The spots were dried, the plates were developed with M17, the separated spots of TTAB and TX-100 were visualized, and RF values were calculated. To study the effect of the presence of cations (as impurities) on the separation of the surfactants, 0.01 mL each of the standard test solutions of surfactants (TX-100 and TTAB) were spotted on TLC plates (S1) follo-wed by spotting of 0.01 mL of the cations. The plates were developed with M17, the spots were detected, and RF values of the separated surfactants were calculated. Limits of detection of TX-100 and TTAB were determined by spot-ting different amounts of the surfactants on silica gel HPTLC plates. The plates were developed with M17. and the spots were detected. The method was repeated with successive reduction of the amounts of TTAB and TX-100 until no spot was detected. The smallest amount of surfactant that could be detected on the TLC plates was taken as the limit of detection. Spectrophotometric Determination of TTAB
Sample solutions (0.01 mL) containing 50–350 µg TTAB were trea-ted with 1.0 mL 0.01% methylene blue and the volume was diluted to 10 mL with double-distilled water. After thorough mixing the solution was left for l0 min for complete colour development. The absorption spectrum of this solution against a blank over the range 440–700 nm showed absorban-ce was maximum at 670 nm (λmax). The absorbance of the developed colour was measured at 670 nm, against a blank, using a 1 cm cell, and a calibra-tion plot was obtained. Aliquots (0.01 mL) of TTAB from a series of standard solutions (0.5–3.5%) containing 50–350 µg TTAB were spotted on TLC plates. When the spots were completely dry 50 µg Tx-100 was spotted at the same posi-tions and the plates were dried again at room temperature. The dried pla-tes were developed with M17. A pilot plate was also run simultaneously for location of the position of TTAB. After development the region containing TTAB on the pilot plate was detected. The corresponding region on the
- 278 -

working plates (undetected spots) was marked and the adsorbent in this area was scraped into a clean beaker and the TTAB was extracted with approximately 15 mL 1.0 M aq. H2SO4, followed by washing of the adsor-bent to ensure complete removal of the TTAB. The extract was filtered and the filtrate was placed on water bath for complete removal of H2SO4. The residue obtained was dissolved in demineralized double-distilled water, aqueous methylene blue (0.01%, 1 mL) was added, and the total volume was diluted to 10 mL with double-distilled water. The absorbance spectrum of this solution was measured at 670 nm, against a blank, using 1 cm cells, and a recovery curve was constructed. This recovery curve was used to determine recovery of TTAB after separation from TX-100 on silica gel plates using M17 as mobile phase. RESULTS AND DISCUSSION The results obtained from the experiments described above are summarized in Tables III–VII and Figs 1–4. Chromatography of twelve surfactants (cationic and non-ionic) was performed on silica gel TLC pla-tes using thirty four mobile phases containing one, two, or three-compo-nents. From the data listed in Table III, several trends are apparent.
1. All the surfactants remain near the point of application (RF = 0.01) on silica gel layers developed with water (M1) and 0.001–0.1 M aq. gluta-mic acid (M4–M6). In contrast, all surfactants migrate with high mobi-lity (RF values 0.92–0.95) if pure acetone (M2) is used as mobile phase. Tailing spots (RL − RT > 0.3, where RL and RT are the RF values of the leading and trailing ends of the spots) were obtained for all the sur-factants when pure methanol (M3) was used as mobile phase.
2. With two-component mobile phases (M7–M16) containing glutamic acid (0.1 M) and acetone or methanol the mobility of the surfactants increa-ses with increasing concentration (or volume ratio) of acetone or me-thanol. The mobile phase containing 90% methanol (M16) produces tailed spots whereas that containing 10% methanol (M12) produces highly compact spots which stay at the point of application. HDTAC, DTAB, and LSN could not be detected on silica gel layers developed with mobile phases M8–M11.
3. The three component mobile phase 0.1 M aqueous glutamic acid–ace-tone–methanol, 1:1:1 (v/v) (M17) was found to enable optimum sepa-ration of non-ionic surfactants from cationic surfactants and other non-ionic surfactants.
- 279 -
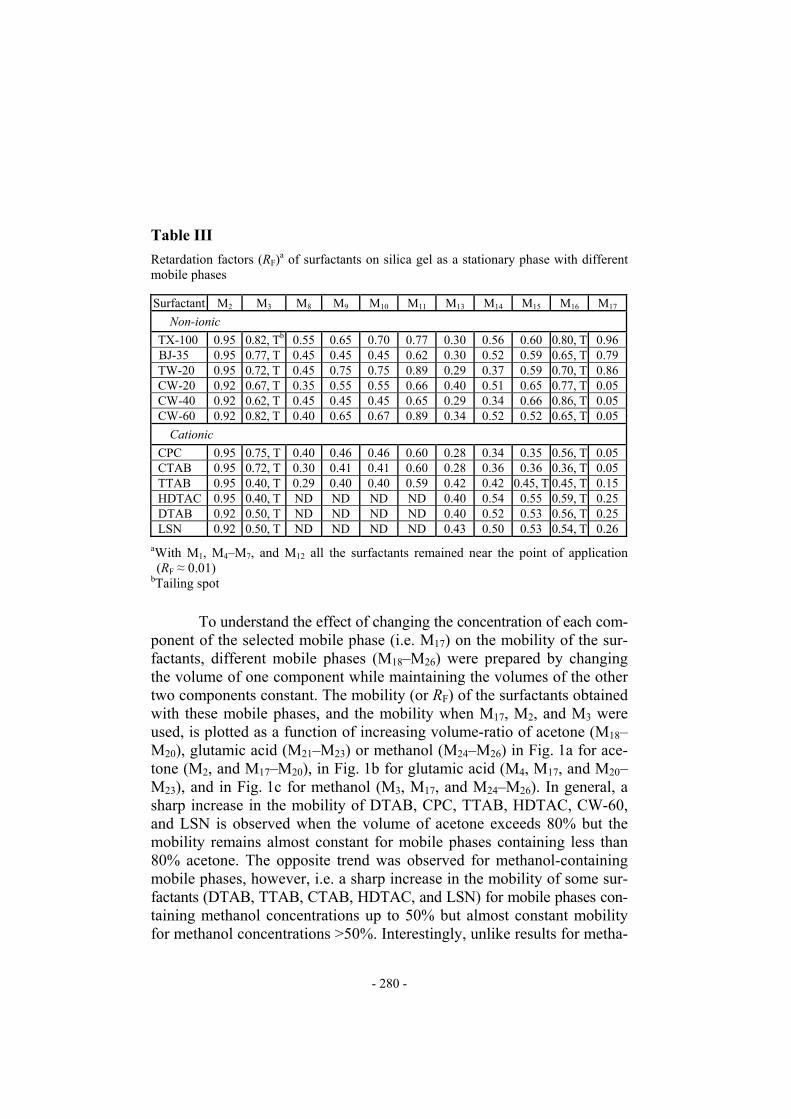
Table III
Retardation factors (RF)a of surfactants on silica gel as a stationary phase with different mobile phases Surfactant M2 M3 M8 M9 M10 M11 M13 M14 M15 M16 M17
Non-ionic TX-100 0.95 0.82, Tb 0.55 0.65 0.70 0.77 0.30 0.56 0.60 0.80, T 0.96 BJ-35 0.95 0.77, T 0.45 0.45 0.45 0.62 0.30 0.52 0.59 0.65, T 0.79 TW-20 0.95 0.72, T 0.45 0.75 0.75 0.89 0.29 0.37 0.59 0.70, T 0.86 CW-20 0.92 0.67, T 0.35 0.55 0.55 0.66 0.40 0.51 0.65 0.77, T 0.05 CW-40 0.92 0.62, T 0.45 0.45 0.45 0.65 0.29 0.34 0.66 0.86, T 0.05 CW-60 0.92 0.82, T 0.40 0.65 0.67 0.89 0.34 0.52 0.52 0.65, T 0.05
Cationic CPC 0.95 0.75, T 0.40 0.46 0.46 0.60 0.28 0.34 0.35 0.56, T 0.05 CTAB 0.95 0.72, T 0.30 0.41 0.41 0.60 0.28 0.36 0.36 0.36, T 0.05 TTAB 0.95 0.40, T 0.29 0.40 0.40 0.59 0.42 0.42 0.45, T 0.45, T 0.15 HDTAC 0.95 0.40, T ND ND ND ND 0.40 0.54 0.55 0.59, T 0.25 DTAB 0.92 0.50, T ND ND ND ND 0.40 0.52 0.53 0.56, T 0.25 LSN 0.92 0.50, T ND ND ND ND 0.43 0.50 0.53 0.54, T 0.26
aWith M1, M4–M7, and M12 all the surfactants remained near the point of application (RF ≈ 0.01)
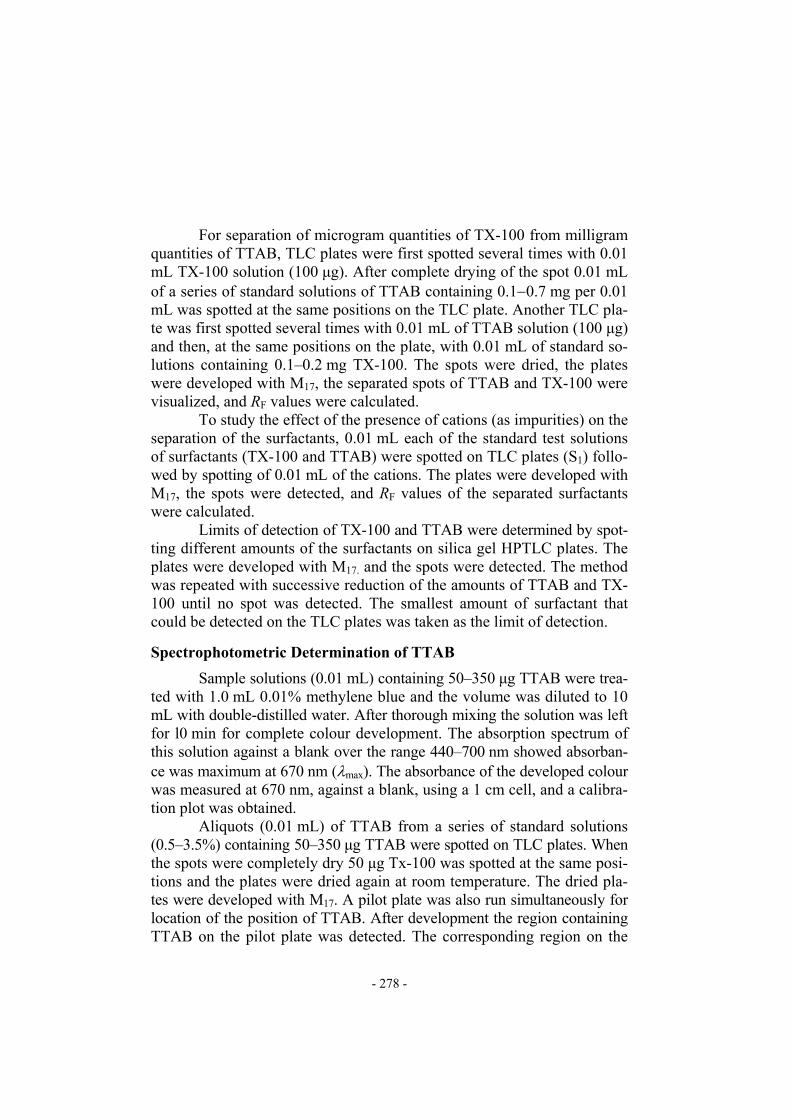
bTailing spot To understand the effect of changing the concentration of each com-ponent of the selected mobile phase (i.e. M17) on the mobility of the sur-factants, different mobile phases (M18–M26) were prepared by changing the volume of one component while maintaining the volumes of the other two components constant. The mobility (or RF) of the surfactants obtained with these mobile phases, and the mobility when M17, M2, and M3 were used, is plotted as a function of increasing volume-ratio of acetone (M18–M20), glutamic acid (M21–M23) or methanol (M24–M26) in Fig. 1a for ace-tone (M2, and M17–M20), in Fig. 1b for glutamic acid (M4, M17, and M20–M23), and in Fig. 1c for methanol (M3, M17, and M24–M26). In general, a sharp increase in the mobility of DTAB, CPC, TTAB, HDTAC, CW-60, and LSN is observed when the volume of acetone exceeds 80% but the mobility remains almost constant for mobile phases containing less than 80% acetone. The opposite trend was observed for methanol-containing mobile phases, however, i.e. a sharp increase in the mobility of some sur-factants (DTAB, TTAB, CTAB, HDTAC, and LSN) for mobile phases con-taining methanol concentrations up to 50% but almost constant mobility for methanol concentrations >50%. Interestingly, unlike results for metha-
- 280 -

nol-containing mobile phases, a decrease in the mobility of a few surfac-tants (TX-100 TW-20, CW-20, BJ-35, HDTAC, and LSN) was observed with increasing concentration of glutamic acid whereas the others (DTAB, CPC, TTAB, CW-40, and CW-60) remained at the point of application. Tailing spots were obtained for LSN, DTAB, CPC, TTAB, HDTAC, and CTAB chromatographed with M18–M20, for CPC and CW-40 chromatogra-phed with M24–M26, and for CTAB, LSN, BJ-35, CW-60, CW-20, DTAB, and TTAB chromatographed with pure methanol (M3). The surfactants CW-60 and CW-40 produced double spots when chromatographed with M18-M20 and CW-60 produced double spots when chromatographed with M24–M26. From these observations it is clear that the mobility of the surfac-tants is affected by the concentration (or volume ratio) of each mobile pha-se component, i.e. acetone, methanol, and glutamic acid. (a)
R F v
alue
Volume ratio of acetone Fig. 1
Mobility of the surfactants on silica layers developed with mixed aqueous glutamic acid (0.1 M)–methanol–acetone mobile phases containing: (a) different amounts of acetone but the same proportions of the other components
- 281 -
(b)
R F v
alue
Volume ratio of acetone (c)
R F v
alue
Volume ratio of acetone Fig. 1 (continued)
Mobility of the surfactants on silica layers developed with mixed aqueous glutamic acid (0.1 M)–methanol–acetone mobile phases containing: (b) different amounts of glutamic acid but the same proportions of the other components and (c) different amounts of me-thanol but the same proportions of the other components
- 282 -

Effect of the Nature of the Alcohol
To understand the effect of the nature of the alcohol on the separa-tion of TTAB from TX-100, methanol in M17 was substituted with ethanol (M27), propanol (M28), butanol (M29), or pentanol (M30). The results obtai-ned from use of these solvents to separate TTAB and TX-100 are presen-ted in Figs. 2a and 2b. It is evident from these figures that the methanol-containing mobile phase M17 results in the best separation of TTAB from TX-100. It is also clear that the mobility of TTAB depends on the nature of the added alcohol and increases with increasing carbon-chain length (or decreasing polarity) of the alcohol. The mobility of TX-100 is unaffected, however.
Fig. 2
Effect on the separation of TX-100 and TTAB on silica layers of the identity of the alcohol (a, b) and amino acid (c) used in the mobile phase
Effect of the Nature of the Amino Acid
To examine the effect of the nature of the amino acid on the sepa-ration, glutamic acid in M17 was substituted with aspartic acid (M31), DL-aminobutyric acid (M32), aminoacetic acid (M33), and methionine (M34)
- 283 -
and the resulting mobile phases were used for separation of TTAB from TX-100. Use of these amino acids instead of glutamic acid had deleterious effects on the separation (Fig. 2c), confirming the best separation is achieved only with the glutamic acid-containing mobile phase (M17). Effect of the Nature of the Adsorbent Layer
To establish the effectiveness of silica gel G mutual separation of TTAB from TX-100 was examined on different layers prepared from alu-mina, cellulose, kieselguhr, and cellulose both alone and in mixtures with silica gel in different ratios (9:1, 1:1, and 1:9, w/w). The results obtained for separation of TTAB from TX-100 on such layers developed with M17 are shown in Fig. 3. It is evident from this figure that separation of TTAB from TX-100 is not possible on cellulose (S4), alumina (S2), and kieselguhr (S3) layers whereas very good separation is achieved on silica gel (S1). The separation efficiency of silica gel decreases with increasing amounts of ad-ded alumina, cellulose, or kieselguhr. When chromatographed as a mixtu-re, TTAB and TX-100 produce tailed spots on layers S3, S4, S8, and S9 and co-migrate on S2, S5, S6, S11, and S12. Among the adsorbent layers tested, separation of TTAB from TX-100 was achieved on S1, S7, S10, and S13, with separation performance in the order S1 > S7 > S10 > S13 (Fig. 3). So-me important separations achieved on silica gel plates with M17 as mobile phase are listed in Table IV.
Fig. 3
Separation of TTAB from TX-100 on layers of different composition
- 284 -
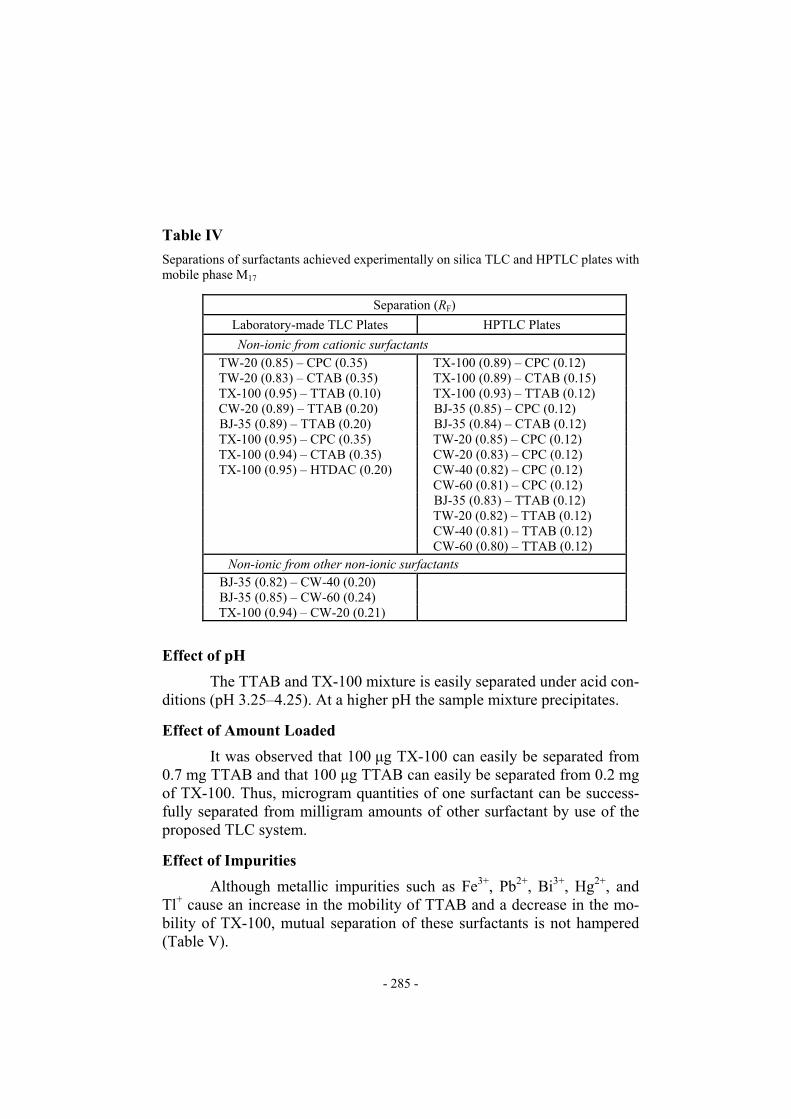
Table IV
Separations of surfactants achieved experimentally on silica TLC and HPTLC plates with mobile phase M17
Separation (RF) Laboratory-made TLC Plates HPTLC Plates
Non-ionic from cationic surfactants TW-20 (0.85) – CPC (0.35) TX-100 (0.89) – CPC (0.12) TW-20 (0.83) – CTAB (0.35) TX-100 (0.89) – CTAB (0.15) TX-100 (0.95) – TTAB (0.10) TX-100 (0.93) – TTAB (0.12) CW-20 (0.89) – TTAB (0.20) BJ-35 (0.85) – CPC (0.12) BJ-35 (0.89) – TTAB (0.20) BJ-35 (0.84) – CTAB (0.12) TX-100 (0.95) – CPC (0.35) TW-20 (0.85) – CPC (0.12) TX-100 (0.94) – CTAB (0.35) CW-20 (0.83) – CPC (0.12) TX-100 (0.95) – HTDAC (0.20) CW-40 (0.82) – CPC (0.12) CW-60 (0.81) – CPC (0.12) BJ-35 (0.83) – TTAB (0.12) TW-20 (0.82) – TTAB (0.12) CW-40 (0.81) – TTAB (0.12) CW-60 (0.80) – TTAB (0.12)
Non-ionic from other non-ionic surfactants BJ-35 (0.82) – CW-40 (0.20) BJ-35 (0.85) – CW-60 (0.24) TX-100 (0.94) – CW-20 (0.21)
Effect of pH
The TTAB and TX-100 mixture is easily separated under acid con-ditions (pH 3.25–4.25). At a higher pH the sample mixture precipitates. Effect of Amount Loaded
It was observed that 100 µg TX-100 can easily be separated from 0.7 mg TTAB and that 100 µg TTAB can easily be separated from 0.2 mg of TX-100. Thus, microgram quantities of one surfactant can be success-fully separated from milligram amounts of other surfactant by use of the proposed TLC system. Effect of Impurities
Although metallic impurities such as Fe3+, Pb2+, Bi3+, Hg2+, and Tl+ cause an increase in the mobility of TTAB and a decrease in the mo-bility of TX-100, mutual separation of these surfactants is not hampered (Table V).
- 285 -

Table V
Separation of TTAB from TX-100 on silica layers with M17 as mobile phase in the pre-sence of metal cations as impurities
RF of separated spots Metal cation
TTAB (cationic) TX-100 (non-ionic) Fe3+ 0.20, Ta 0.76 Cu2+ 0.42 0.56 Pb2+ 0.20, T 0.92 Bi3+ 0.26, T 0.92 Zn2+ 0.25 0.56 Hg2+ 0.36 0.89 Ag+ 0.24, T 0.75 Tl+ 0.26 0.70 VO2
+ 0.25 0.56 UO2
2+ 0.35 0.65 Without impurity 0.10 0.95
aTailing spot
Limits of Detection
The smallest detectable amounts of TX-100 and TTAB on silica gel HPTLC plates developed with M17 were 0.05 and 0.03 µg, respectively. The proposed method can therefore be used for sensitive detection of both surfactants.
Quantitative Determination
The calibration plot (Fig. 4) obtained by plotting absorbance (A) against the amount (C) of TTAB shows the relationship between response and amount is linear up to 350 µg TTAB. The linear dependence of absor-bance on the concentration of TTAB is well described by the equation A = a + bC, with R2 = 0.9980. TTAB was also determined spectrophotometrically by use of 0.01% methylene blue as chromogenic reagent. When optical density measured at 670 nm was plotted against amount (µg) of TTAB the linear recovery plot obtained was described by the equation A = x + yC, with R2 = 0.9996. Recovery of TTAB from the plate was in the range 98 to 99.5% with ma-ximum error of 2% (Table VI).
- 286 -

Fig. 4
Calibration plot (a) and recovery plot (b) for quantitative determination of TTAB Table VI
Spectrophotometric determination of TTAB after separation from TX-100
Sample Amount loaded, x (µg)
Amount recovered, y
(µg)
Error (%),
100×
−
xyx
Relative recovery (%),
×
−
− 100100x
yx
1 50.0 49.0 2.00 98.0 2 100.0 98.1 1.90 98.1 3 150.0 148.0 1.30 98.7 4 200.0 199.0 0.50 99.5 5 250.0 248.0 0.80 99.2 6 300.0 298.0 0.60 99.4 7 350.0 348.0 0.57 99.4
- 287 -

Application
To widen the applicability of the method, TX-100 and TTAB from a variety of water samples were separated. The results presented in Ta-ble VII show that TTAB and TX-100 from a variety of water and domestic waste water samples can be identified easily after mutual separation on sili-ca gel layers developed with 0.1 M glutamic acid–methanol–acetone, 1:1:1. Table VII
Identification and separation of TTAB and Triton-X100 from different aqueous samples
Separation value RF Sample
TTAB (cationic) TX-100 (non-ionic)Distilled water 0.35 0.55 Tap water 0.30 0.52 Saline water 0.31 0.51 River water 0.30 0.50 Domestic waste 0.31 0.75
CONCLUSION An amino acid-containing mixed aqueous–organic mobile phase has been used for the first time for identification and separation of surfactants. TTAB (a cationic surfactant) has been successfully separated from TX-100 (a non-ionic surfactant) on laboratory prepared silica gel plates and on silica gel HPTLC plates developed with 0.1 M glutamic acid–methanol–acetone, 1:1:1. TLC–spectrophotometry has been used for quantitative esti-mation of TTAB after preliminary separation from TX-100. ACKNOWLEDGMENT The authors are grateful to the Chairman, Department of Applied Chemistry, Aligarh Muslim University, Aligarh, for providing the neces-sary research facilities. The University Grants Commission, New Delhi (India), is thanked for financial assistance.
- 288 -
REFERENCES
[1] L. Jian–Qiang, L. Yu-Xiang, M. Jun, X. Hong-Di, and M. Hong-Lei, Shandong Daxue Xuebao, 38, 64 (2003)
[2] T. Hirore, T. Akieda, and H.Kasimura, Kanzei Chuo Bunseki Shosho, 31, 115 (1992)
[3] M. Jian, and C. Jian-Lua, Jingxi Huagong Bianjibu, 18, 445 (2001) [4] M. Ahel, W. Giger, E. Molnar, and S. Ibric, Croat. Chem. Acta, 73,
209 (2000) [5] C.R. Harrison and C.A. Lucy, J. Chromatogr., 956, 237 (2002) [6] Z. Yam, P.R. Haddad, and J.S. Fritz, J. Chromatogr. A, 985, 359 (2003) [7] J. Jhu and Z. Shi, Intern. J. Mass Spectrometry, 226, 369 (2003) [8] B. Janocha, D. Renzow, and J. Matheis, Galvanotechnik,
88, 3265 (1997) [9] N. Toshio, I. Hideo, and K. Kaoru, Anal. Chem., 33, 1524 (1961)
[10] J. Lesko, S. Holotik, J. Krupcik, and V. Vesely, J. Chromatogr., 119, 293 (1976)
[11] M. Cetinkaya, Parfuem. Kosmet., 72, 816 (1991) [12] M.W. Edens, V.M. Nale, and J.C. Knoel, Polym. Matter. Sci,
69, 551 (1993) [13] F. Ventura and P. de Voogt, Comprehensive Analytical Chemistry,
P.T. Knepper, D. Barcelo, and P. De-Voogt, pp 51–76 (2003) [14] J.M. Herrero-Martinez, E.F. Simo-Alfonso, and G. Ramis-Ramos,
Electrophoresis, 22, 2017 (2001) [15] T.V. Kharitonova, A.V. Rudner, and N.I. Ivanova, Colloid J.,
65, 244 (2003) [16] E. Chirila, I. Corazeanu, and S. Dobrinas, Talanta, 53, 271 (2000) [17] C. Vogt, GIT Labor-Fachzeitschrift, 47, 551 (2003) [18] J. Zweigenbaum, Chromatogram, 11, 9 (1990); Chem. Abstr.,
113, 204210e (1990) [19] K. Mass, Fette–Seifen–Anstrichm., 72, 1032 (1970) [20] R.B. Grieves and D. Bhattacharyya, Sep. Sci, 7, 115 (1972) [21] D. Frahne, S. Schmidt, and H.G. Kuhn, Fette–Seifen–Anstrichm.,
79, 122 (1977) [22] H. Brueschweiler, V. Sieber, and H. Weishaupt, Tenside Deterg.,
17, 126 (1980) [23] R.W. Finney and H. Read, J. Chromatogr., 471, 389 (1989) [24] G. Hohm, Seifen, Oele, Fette, Wachse, 116, 273 (1990) [25] T. Cserhati and Z. Illes, Chromatographia, 31, 152 (1991)
- 289 -
[26] E.G. Sumina, E.V. Ermolaeva, and N.V. Tyurina, Zavodskaya Laboratoriya Diagnostika Materialov, 67, 5 (2001)
[27] E.G. Sumina, S.N. Shtykov, and N.V. Tyurina, J. Anal. Chem., 58, 720 (2003)
[28] L. Nitschke, R. Mueller, G. Metzner, and L.F. Huber, J. Anal. Chem., 342, 711 (1992); Chem. Abstr., 116, 221204k (1992)
[29] T. Ban, E. Papp, and J. Inczedy, J. Chromatogr., 593, 227 (1992) [30] G.J. Lacey and D.G. Horace, Anal. Chem., 33, 1393 (1961) [31] R.A. Menges, T.S. Menyes, G.L. Bertrand, W.D. Armstrong,
and A.L. Spino, J. Liq. Chromatogr., 15, 2909 (1992) [32] K. Ohashi and H. Imura, Nippon Bunseki Kagakkai, 3, 215 (1997) [33] A. Pal and M. Bandyopadhyay, Indian J. Chem. Technol.,
7, 105 (2000) [34] T.V. Vladimirova and E.E. Morgunova, J. Appl. Chem.,
74, 2095 (2001) [35] K.H. Joshi, J. Inst. Chem., 74, 146 (2002) [36] Z. Shu-Lin, L. Shu-Ting, and B. Tan, Fenexi Kexue Xuebao,
19, 240 (2003) [37] H. Achmeteli and R.J. Sabino, Proc. Sci. Sect. Toilet Goods Assoc.,
37, 4 (1962) [38] M. Aminuddin and H.D.C. Rapson, J. Chem. Soc. Pak, 13, 192 (1991) [39] N.A. Adamana, Yu.D. Sister, I.I. Vataman, and V.I. Shlemov,
Ser. Biol. Khim. Nauk, 1, 73 (1986) [40] I. Zjawiony and Z. Klima, Chem. Anal. (Warsaw), 36, 741 (1991) [41] H.Y. Qei–Hans, I. Mai, and D.C. Toro, J. Soc. Cosmet. Chem.,
42, 309 (1991) [42] D. Lowy, A. Patrut, F.D. Anghel, F. Ovari, and M. Walter,
Magy. Kem., 97, 460 (1991) [43] S. Motomizu, M. Oshima, and Y. Horoi, Mikrochim. Acta,
106, 67 (1992) [44] J. Jóźwicka, Wlokna. Chem., 16, 173 (1990) [45] S. Motomizu and M. Kobayashi, Anal. Chim. Acta, 261, 471 (1992) [46] L. Jing-Fu and J. Gui-Bin, Microchem., 68, 29 (2001) [47] Y. Wang, S. Guan, D. Hao, and D. Dan., Fenxi Huaxue,
30, 1455 (2002) [48] M. Barco, C. Planas, O. Palacios, F. Ventura, J. Rivera,
and J. Caixach, Anal. Chem., 75, 5129 (2003) [49] P.T.T. Wang and H.H. Mantsch, ACS Symp. Ser., 447, 44 (1990)
- 290 -

[50] J. Gartshore, Y.C. Lim, and D.G. Cooper, Biotechnol. Lett., 22, 169 (2000)
[51] T. Mihara and N. Koide, Mol. Cryst. Liq. Cryst, 367, 605 (2001) [52] N. Shukla, C. Liu, P.M. Janes, and D. Weller, J. Magn. Magn.
Mater., 266, 178 (2003) [53] E. Pettersson, D. Topgaard, P. Stilbs, and O. Soederman, Langmuir,
20, 1138 (2004) [54] M. Olteanu, I. Mandru, M. Dudau, S. Peretz, and O. Cinteza,
Colloid. Polym. Sci, 122, 87 (2003) [55] W. Lin, B.E. Read, and H. Xue, Hazard. Ind. Wastes, 29, 282 (1997) [56] M. Kazushige, S. Takeshi, Y. Milten, and R. Rosen, Anal. Chem,
35, 2074 (1963) [57] Y. Chizuo, S. Takeshi, K. Takahide, and M.K. Shige, Osaka Kogyo
Daigaku Kiyo, 25, 97 (1980) [58] S. Akini and K.C. Guven, Acta. Pharm. Turc, 34, 121 (1992) [59] J. Cot, M. Fort, and J. Cartiel, AQEIC Bol. Tec, 43, 147 (1992) [60] I.M. Kuleshova and Zh. I. Manevich, Otksytiya. Izobret. Prom.
Obraztsy, Tovarnye Znaki, 3, 357, 151 (1984) [61] M.R. Gasco and G. Gatti, Riv. Ital. Sostanze. Grasse, 43, 175 (1966) [62] E. Moraru, C. Sarbu, T. Hodisan, and C. Liteanu, Rom. Ro 87520,
30 Sep 1985, Chem. Abstract, 105, 17613m (1986) [63] L. Favretto and A. Lokar, Ann. Fac. Econ. Commer, 4, 281 (1966) [64] R. Wickbold, Fette–Seifen–Anstrichm., 70, 688 (1968) [65] S. Miyagishi and M. Nishida, Yukagaku, 18, 309 (1969) [66] N.M. Yudina, L.N. Alekseeva, Zh. A Bedina, and A.A. Cherkasskii,
Nefteperearab. Neftechim., 7, 43 (1972) [67] A.M. Karnaukh and Z.D. Deinekhovskaya., 133, 879 Dec 10 (1960) [68] A. Mohammad and Y.H. Sirwal, J. Planar. Chromatogr., 15, 107 (2003)
- 291 -