Use of Geographic Information Systems in … software as its standard for GIS development and data...
16
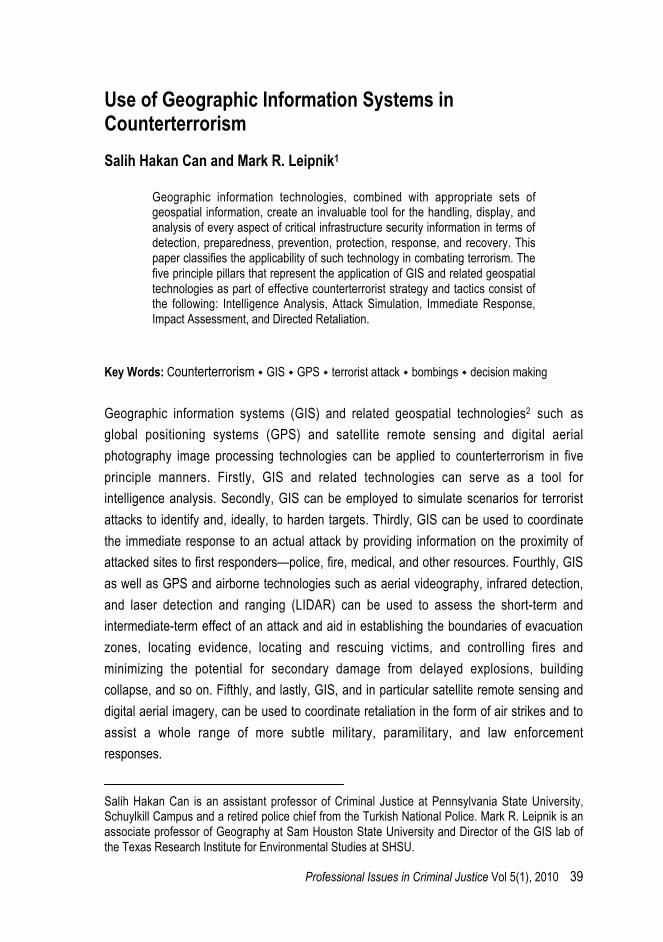
Professional Issues in Criminal Justice Vol 5(1), 2010 39 Use of Geographic Information Systems in Counterterrorism Salih Hakan Can and Mark R. Leipnik 1 Geographic information technologies, combined with appropriate sets of geospatial information, create an invaluable tool for the handling, display, and analysis of every aspect of critical infrastructure security information in terms of detection, preparedness, prevention, protection, response, and recovery. This paper classifies the applicability of such technology in combating terrorism. The five principle pillars that represent the application of GIS and related geospatial technologies as part of effective counterterrorist strategy and tactics consist of the following: Intelligence Analysis, Attack Simulation, Immediate Response, Impact Assessment, and Directed Retaliation. Key Words: Counterterrorism GIS GPS terrorist attack bombings decision making Geographic information systems (GIS) and related geospatial technologies 2 such as global positioning systems (GPS) and satellite remote sensing and digital aerial photography image processing technologies can be applied to counterterrorism in five principle manners. Firstly, GIS and related technologies can serve as a tool for intelligence analysis. Secondly, GIS can be employed to simulate scenarios for terrorist attacks to identify and, ideally, to harden targets. Thirdly, GIS can be used to coordinate the immediate response to an actual attack by providing information on the proximity of attacked sites to first responders—police, fire, medical, and other resources. Fourthly, GIS as well as GPS and airborne technologies such as aerial videography, infrared detection, and laser detection and ranging (LIDAR) can be used to assess the short-term and intermediate-term effect of an attack and aid in establishing the boundaries of evacuation zones, locating evidence, locating and rescuing victims, and controlling fires and minimizing the potential for secondary damage from delayed explosions, building collapse, and so on. Fifthly, and lastly, GIS, and in particular satellite remote sensing and digital aerial imagery, can be used to coordinate retaliation in the form of air strikes and to assist a whole range of more subtle military, paramilitary, and law enforcement responses. Salih Hakan Can is an assistant professor of Criminal Justice at Pennsylvania State University, Schuylkill Campus and a retired police chief from the Turkish National Police. Mark R. Leipnik is an associate professor of Geography at Sam Houston State University and Director of the GIS lab of the Texas Research Institute for Environmental Studies at SHSU.
Transcript of Use of Geographic Information Systems in … software as its standard for GIS development and data...
Professional Issues in Criminal Justice Vol 5(1), 2010 39
Use of Geographic Information Systems inCounterterrorism
Salih Hakan Can and Mark R. Leipnik1
Geographic information technologies, combined with appropriate sets ofgeospatial information, create an invaluable tool for the handling, display, andanalysis of every aspect of critical infrastructure security information in terms ofdetection, preparedness, prevention, protection, response, and recovery. Thispaper classifies the applicability of such technology in combating terrorism. Thefive principle pillars that represent the application of GIS and related geospatialtechnologies as part of effective counterterrorist strategy and tactics consist ofthe following: Intelligence Analysis, Attack Simulation, Immediate Response,Impact Assessment, and Directed Retaliation.
Key Words: Counterterrorism GIS GPS terrorist attack bombings decision making
Geographic information systems (GIS) and related geospatial technologies2 such as
global positioning systems (GPS) and satellite remote sensing and digital aerial
photography image processing technologies can be applied to counterterrorism in five
principle manners. Firstly, GIS and related technologies can serve as a tool for
intelligence analysis. Secondly, GIS can be employed to simulate scenarios for terrorist
attacks to identify and, ideally, to harden targets. Thirdly, GIS can be used to coordinate
the immediate response to an actual attack by providing information on the proximity of
attacked sites to first responders—police, fire, medical, and other resources. Fourthly, GIS
as well as GPS and airborne technologies such as aerial videography, infrared detection,
and laser detection and ranging (LIDAR) can be used to assess the short-term and
intermediate-term effect of an attack and aid in establishing the boundaries of evacuation
zones, locating evidence, locating and rescuing victims, and controlling fires and
minimizing the potential for secondary damage from delayed explosions, building
collapse, and so on. Fifthly, and lastly, GIS, and in particular satellite remote sensing and
digital aerial imagery, can be used to coordinate retaliation in the form of air strikes and to
assist a whole range of more subtle military, paramilitary, and law enforcement
responses.
Salih Hakan Can is an assistant professor of Criminal Justice at Pennsylvania State University,Schuylkill Campus and a retired police chief from the Turkish National Police. Mark R. Leipnik is anassociate professor of Geography at Sam Houston State University and Director of the GIS lab ofthe Texas Research Institute for Environmental Studies at SHSU.

Can and Leipnik
40 Professional Issues in Criminal Justice Vol 5(1), 2010
Background
What Is GIS?
Geographic information systems are a suite of computer programs designed to store,
analyze, manipulate, and create output such as maps, charts, and reports from
geographic data linked to descriptive attribute3 data. The geographic data typically consist
of features that can be portrayed on maps or in aerial photographs; these data are stored
in a special topological structure4 (Burrough, 1986). In this unique topological format,
scale relationships and geometric interrelationships such as contiguity and adjacency are
maintained explicitly. GIS also supports multiple coordinate systems, projections, and
datums, which can be applied and inter-converted to different reference measurements
(coordinate systems, projections, etc.). The descriptive attribute data are stored in a
tabular format and linked to the geographic data. Thus, for every single geographic
feature—such as points representing crime incident locations or the residences of
suspected criminals or parolees, or lines representing streets or polygons that identify the
boundaries of a police beats, districts (precincts), or municipal or provincial boundaries—a
series of corresponding records appear in one or more database tables.
GIS data tend to be structured as a series of layers. These layers are co-registers,5
thus they have the same spatial6 extent, coordinate system, and projection. For example,
a GIS might have a layer of police beat and district boundaries; a layer of streets and
highways; a layer of streams, lakes, and wetlands (hydrography); a layer of municipal,
regional, and national boundaries; and a layer of crime incident locations. There might
also be layers of police station, fire station, and other government facility locations, and a
layer of demographic data subdivided spatially by enumeration area. Each distinct layer
has at least one database table containing as many records as there are features in the
corresponding geographic (map) layer to which it is linked. So, if 706 crime incident
addresses have been geo-coded,7 then the database table linked to these incident
locations would contain 706 records. Each record would have a unique identifier that
served to identify and link that (crime incident report) record to the corresponding point
feature (the crime incident location). Presumably a series of other fields in that particular
record would contain applicable information such as type of offense, victim name, victim
address, victim contact information, responding officer name, and perhaps case clearance
information, name of offender arrested (if any), disposition of the case, and, potentially
(usually in other database tables maintained in a relational data base management
system), information on past offenses by the same offender, known associates of the
offender, other cases in which the same offender was a suspect, information about any

Use of Geographic Information Systems in Counterterrorism
Professional Issues in Criminal Justice Vol 5(1), 2010 41
criminal, terrorist, or subversive groups to which the suspect was affiliated, and so on ad
infinitum.
GIS Functions
The structuring of data in a GIS in this rather complex fashion has its reward in the many
unique forms of spatial analysis that can be performed on the data stored in the GIS. Thus
one can readily generate buffer zones around features and then select the corresponding
records for the other features falling within a designated buffer zone. For example, for a
suspect arrested for an unprovoked assault, one could generate buffer zones around his
residence and place of work to determine whether any other assaults had occurred within
a kilometer of these locations. The crime incident reports for each incident would then be
accessible immediately. One could then peruse each record for a physical description of
the assailant, which might then match the attacker in the incident in which an arrest was
made. Similarly, one could generate buffer zones around locations of terrorist attacks and
see whether any suspected terrorists resided or had been observed within a specified
distance of these attack locations. One could expand the analysis beyond crime incident
locations to include the demographic or sociopolitical characteristics of areas falling within
a specified distance of an incident or incidents such as anti-government disturbances or
the proximity of subversive or suspect individuals to critical infrastructure or high profile
potential targets. The ability of police and security agencies to analyze these other
societal and infrastructure factors depends on data collected by the national or regional
mapping, public utility, and/or census or population registry apparatus. In turn, these data
vary widely from country to country. So, for example, in the United States, about 59 direct
responses from the decennial census are available. In other countries, such as Great
Britain or Sweden, more data are available, while in other countries less data are
available. The frequency of data collection and detail of such demographic data varies
widely (Leipnik & Mehta, 2002).
Another example of a feasible and useful spatial analysis (although somewhat more
complicated than the previous example) would be to determine the areas within 5
minutes’, 10 minutes’ and 20 minutes’ travel time from every terrorist attack. The street
data this analysis uses would need to be merged together into the buffer zone8 data and
would require speed limit data linked to every block. Once determined, travel-time zones
for each incident could be compared with actual suspect locations (if previously encoded)
and demographics of the area for enumeration zones or municipalities falling within these
travel-time limits to get continuous accurate data on possible whereabouts of accused
terrorist or terrorists after the incident to make proper decisions regarding establishment
of checkpoints and roadblocks. These examples only scratch the surface of spatial

Can and Leipnik
42 Professional Issues in Criminal Justice Vol 5(1), 2010
analysis methods with off-the-shelf GIS software and employing readily available data
sets. It is important to note that the spatial analysis methods discussed above can all be
conducted in real-time over secure intranet connections with central servers at national
police agencies (Leipnik & Albert, 2003).
Sources of Software and Data
The leading GIS is the ARCGIS product from ESRI (the Environmental Systems Research
Institute of Redlands, California, Web site: www.esri.com). Of significance is development
of a crime mapping and analysis extension termed CRIMEVIEW (developed by the
Omega Group of San Diego, California, Web site: www.theomegagroup.com) and an
ARCVIEW spatial analyst extension. ESRI’s ARCGIS is the leading GIS software for it
combines higher end applications with their complexity and accuracy with user friendly
applicability, and it has recently further distinguished itself from a dwindling pack of
competitors by introducing an object-oriented approach to design applications, consisting
of data fields and methods together with their interactions in the underlying database
structure. This object-oriented approach adds sophisticated database structure to a wide
range of functions, spatial analysis tools, specialized extensions, and a fully topological
structure to cement ESRI’s position as the world’s leading supplier of sophisticated GIS
software.
A major competitor of ESRI is MapInfo Corporation of Troy, New York, with its
MapInfo Software. This lower end, but more affordable, GIS has been dominant in what is
referred to as desktop mapping applications of GIS (versus server-based applications)
MapInfo offers low cost, easy to use software. Also MapInfo has a strong presence in
Australia where the Australian Bureau of Statistics (the census authority) has selected
MapInfo software as its standard for GIS development and data dissemination. In
Canada, MapInfo has acquired CanMap, the leading purveyor of nationwide street data,
which is frequently an essential component of law enforcement GIS. Within the last few
years, as the popularity of GIS has expanded, other firms have entered into the business;
these include companies such as AutoDesk and Bentley Systems, which have dominated
the computer-aided design (CAD) field, and Intergraph Corporation, which specializes in
high-end turnkey solutions for government and industry. Most of the GIS software of these
latter companies is not particularly suitable for law enforcement applications (although
Intergraph has developed a statewide real-time crime mapping application for the
Delaware State Police [Leipnik 2003]): the software tends to be used in conjunction with
engineering software. A more significant entrant is Microsoft Corporation, which has
developed a GIS called MapPoint, which is intended to compete directly with MapInfo and
like MapInfo has a rather limited range of functions and a commensurately lower price

Use of Geographic Information Systems in Counterterrorism
Professional Issues in Criminal Justice Vol 5(1), 2010 43
compared with ARCGIS. MapPoint currently has a relatively small share of the market for
GIS, but given the massive resources of Microsoft Corporation, it is worth taking very
seriously over the coming years.
The Five Pillars
The five principle pillars of the application of GIS and related geospatial technologies as
part of effective counterterrorist strategy and tactics are Intelligence Analysis, Attack
Simulation, Immediate Response, Impact Assessment, and Directed Retaliation.
Intelligence Analysis
The use of geospatial technologies in counterterrorism intelligence analysis primarily
takes advantage of the spatial analysis functions of GIS to allow an analyst to assemble
multiple layers of data and mine multiple database tables to extract connections in space,
in time, or other relationships such as financial or familial relationships that may exist
among apparently unrelated attacks, organizations, persons, places, bank accounts, and
so on. Typically to start such analysis would require a base-map containing geopolitical
boundaries of and transportation routes (including road, rail, air, and even marine links) to
and from the aforementioned features. Then specific locations such as sites of attacks,
residential locations for suspected members of subversive groups, and possibly
vulnerable facilities would be added. Depending on the situation, the analysis might
portray other features such as locations of financial institutions possibly involved in money
laundering, and locations of sites where subversive groups were known or suspected to
meet. Of course, census data, phone records from pen registers9, and/or any other
databases could be integrated into any layer of information. In the context of the Middle
East, universities or religious schools might figure as features of interest. In Great Britain
certain mosques might be significant, while in the U.S., gun shops/shows and the
sanctuaries of certain religious cults (typically quasi-Christian) have been identified as
hubs of counter-government activities. The intelligence analyst would seek to determine
connections in space and/or in time among and between these disparate elements. For
example, one of the authors (Leipnik), on behalf of the U.S. Secret Service, has analyzed
the relationships between the financial institutions that members of suspected Nigerian
organized crime groups have used to wire transfer illicit cash. These transfers were from
offices and banks in major U.S. cities to banks and financial institutions in various
European, Middle Eastern, Asian, African, Caribbean, and Central American countries.
Specifically, the links were strongest between suburbs of New York City (Queens) and
Detroit, Michigan, and Southern Italy, Lebanon, Pakistan, West Africa, the Cayman
Islands, and Panama. A similar study on drug trafficking connections from Iran, Pakistan,

Can and Leipnik
44 Professional Issues in Criminal Justice Vol 5(1), 2010
and Afghanistan through the Balkan route into Europe (Operation Kilis Connection) was
conducted by one of the authors (Hakan) for Interpol (International Police Organization) to
reveal and visualize relationship between the organized crime groups and terrorist
organizations. In another example, the German Federal Police Agency (Bundeskriminalamt,
or BKA) has analyzed the connection between seizures of heroine and the purported
source and destination of such shipments. In this case, Istanbul is featured along with
Bangkok and Kabul as major source points and Prague, Belgrade, Milan, Warsaw,
Moscow, and Hamburg as intermediate destinations along a route to markets in Munich,
Dresden, Frankfurt, and Berlin as well as in Hamburg itself (Leipnik & Albert, 2003).
These three examples demonstrate the mapping of movements of illicit money and
drugs that might be used to finance terrorist operations, but the mapping could extend to
movement of arms, including radiological materials, and the physical movements of
international terrorists. One indication that such an approach would be valuable is the
active movement exhibited by key players in the 9/11 attacks on the World Trade Center
and Pentagon. A retrospective analysis of the participants in those attacks revealed that
they moved from Saudi Arabia through Pakistan and Afghanistan to Germany and Britain,
Spain, the Czech Republic (possibly), Malaysia, the Philippines, Somalia, and Canada to
south Florida, Arizona, Virginia, and Maryland and then to Boston, Newark, New Jersey,
and Washington, D.C. Such a study could be done routinely to develop different
algorithms to predict future terrorist activities or the soft targets that might be the next
targets of terrorist ideologies. Another approach involves making connections not only
between places but between people residing or working or traveling through or arrested at
various locations. Thus Scotland Yard has used GIS along with neural network analysis10
methods to find connections in space and time among members of traveling criminal
gangs (so called Irish Travelers, although in many cases they are what are frequently
termed gypsies). These connections link these extended criminal families to crimes
ranging from vandalism to bank robbery and murder across the length and breadth of
Great Britain. The connections are primarily ones of kinship, although connections
established among formerly unrelated people made in prison can also be important. The
GIS helps show where these members of extended criminal conspiracies reside and/or
are apprehended. Then crime locations can be analyzed by proximity to the residence of
any member of the extended gang. These gang members (and memberships) of specific
locations in turn can then be related to other members of the gang who may be passing
through the area and are residing temporarily with an affiliated criminal. This approach
seems well suited to analysis of the inter-relationships between the membership and
complex web of activities of terrorist groups. These groups may have a hard core of
“underground” members, but they typically have a much larger above-ground support

Use of Geographic Information Systems in Counterterrorism
Professional Issues in Criminal Justice Vol 5(1), 2010 45
structure of sympathetic affiliated members who provide financial backing and “safe
houses” that may be used to reconnoiter sites for potential attacks. By identifying the
locations associated with these supporters along with developing a robust database of the
activists and their antecedents, one can then obstruct a map of the web spun by these
nefarious human spiders. This web can then be used to entrap the terrorists themselves.
Attack Simulation
GIS is a powerful tool for simulation. In conjunction with specialized spatial analysis
methods and/or customized algorithms imbedded in finite element, finite difference,
optimization, and statistical analysis programs, it is the foremost tool for simulation of
phenomenon such as movement of groundwater contaminant plumes, extent of petroleum
reservoirs and ore bodies, movement of oil spills, change in forest composition, and
behavior of invasive species (Webb & Can, 2005). In the human sphere it is used to
simulate patterns of land-use change, economic development, and spread of diseases
such as AIDS, SARS, and the Ebola virus. With a pedigree stretching back several
decades in the area of simulation of processes and phenomena that have a spatial
component, GIS can be adapted readily to simulation of aspects of terrorist attacks and
the response to such attacks. Of particular relevance is the work of Dr. Lee Griffin at
Louisiana State University and investigators at the Technical University of Brno in the
Czech Republic, all of whom have used GIS to simulate movement of vapor clouds and
air pollutants in cities (Borgharkar, Griffin, Fan, & Maverick, 1999).
The relevance of these simulations to terrorist attacks is that these models can be
used to simulate the effect of release of toxic vapors from attacks on petrochemical
facilities or breaches of tank cars due to deliberate derailments. With modifications, the
effect of radiological aerosols or biological weapons such as anthrax can be simulated.
Simpler simulations can be conducted to estimate blast effects and impacts from attacks
such as truck bombings and suicide hijackings of commercial or package delivery aircraft
that are then crashed into structures. Even cruder methods can be employed to assess
vulnerabilities of facilities and security deployment strategies to safeguard vulnerable
targets. In the latter case, high resolution digital aerial photography is likely to be most
helpful in “gaming”11 scenarios for terrorist attacks and instituting preventive measures.
United States National Capitol Planning Commission GIS analysts use this approach in
preparing event security plans for Washington, D.C. In addition to helping to place
security personnel, barriers, fences, security cameras, and other sensors in optimal and
previously vulnerable locations, GIS can be used to simulate an attack, determine the
effects, estimate the zones of total devastation and major and minor damage, and show
the appropriate locations and routes to evacuate those affected and where and how to
Can and Leipnik
46 Professional Issues in Criminal Justice Vol 5(1), 2010
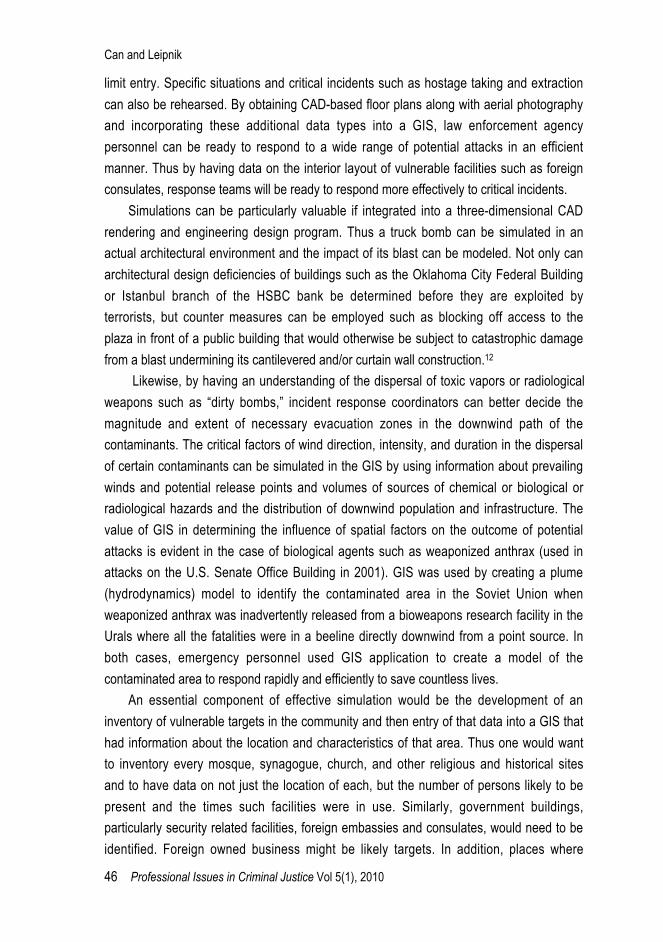
limit entry. Specific situations and critical incidents such as hostage taking and extraction
can also be rehearsed. By obtaining CAD-based floor plans along with aerial photography
and incorporating these additional data types into a GIS, law enforcement agency
personnel can be ready to respond to a wide range of potential attacks in an efficient
manner. Thus by having data on the interior layout of vulnerable facilities such as foreign
consulates, response teams will be ready to respond more effectively to critical incidents.
Simulations can be particularly valuable if integrated into a three-dimensional CAD
rendering and engineering design program. Thus a truck bomb can be simulated in an
actual architectural environment and the impact of its blast can be modeled. Not only can
architectural design deficiencies of buildings such as the Oklahoma City Federal Building
or Istanbul branch of the HSBC bank be determined before they are exploited by
terrorists, but counter measures can be employed such as blocking off access to the
plaza in front of a public building that would otherwise be subject to catastrophic damage
from a blast undermining its cantilevered and/or curtain wall construction.12
Likewise, by having an understanding of the dispersal of toxic vapors or radiological
weapons such as “dirty bombs,” incident response coordinators can better decide the
magnitude and extent of necessary evacuation zones in the downwind path of the
contaminants. The critical factors of wind direction, intensity, and duration in the dispersal
of certain contaminants can be simulated in the GIS by using information about prevailing
winds and potential release points and volumes of sources of chemical or biological or
radiological hazards and the distribution of downwind population and infrastructure. The
value of GIS in determining the influence of spatial factors on the outcome of potential
attacks is evident in the case of biological agents such as weaponized anthrax (used in
attacks on the U.S. Senate Office Building in 2001). GIS was used by creating a plume
(hydrodynamics) model to identify the contaminated area in the Soviet Union when
weaponized anthrax was inadvertently released from a bioweapons research facility in the
Urals where all the fatalities were in a beeline directly downwind from a point source. In
both cases, emergency personnel used GIS application to create a model of the
contaminated area to respond rapidly and efficiently to save countless lives.
An essential component of effective simulation would be the development of an
inventory of vulnerable targets in the community and then entry of that data into a GIS that
had information about the location and characteristics of that area. Thus one would want
to inventory every mosque, synagogue, church, and other religious and historical sites
and to have data on not just the location of each, but the number of persons likely to be
present and the times such facilities were in use. Similarly, government buildings,
particularly security related facilities, foreign embassies and consulates, would need to be
identified. Foreign owned business might be likely targets. In addition, places where

Use of Geographic Information Systems in Counterterrorism
Professional Issues in Criminal Justice Vol 5(1), 2010 47
hazardous chemicals are stored and where munitions are present and the locations of
critical communications and transportation infrastructure should be incorporated into an
evolving homeland security GIS.
Immediate Response
In the immediate aftermath of an attack, the emergency response functions of law
enforcement must be activated rapidly and coordinated effectively. Many dispatching
centers in the United States and other developed countries use GIS to create and
maintain the maps that are critical to expediting the dispatch of police, fire, and
emergency medical resources to the scene of a critical incident. Dispatch and emergency
communications centers also use GIS imbedded in computer-aided dispatching systems
to call forth the specialized resources that might be required for hostage extraction, for
counterterrorist sniper teams, for chemical-biological-radiological weapons response, or
for crowd control and the suppression of civil unrest. Besides helping dispatch first
responders quickly and efficiently to a location where a particular service is needed, GIS
can determine the proximity of that location to the nearest available resources. As the
magnitude of the problem increases, GIS can expand the extent of the area it considers to
draw in more numerous and/or more specialized resources. Terrorist attacks are likely to
call on a large number and wide range of first responders and follow-up teams such as
forensic investigators. Spatial optimization in the form of shortest path and travel-time
optimization methods can be employed as part of computer-aided dispatching systems,
and, in fact, many decisions about the very location of police stations or fire stations are
made by using GIS-based spatial analysis methods such as the hierarchical objective set
covering model.13 In addition to getting appropriate resources to a location as quickly as
possible, GIS can help establish evacuation zones around the location of an actual attack
by identifying critical choke points either to limit access to an area or for evacuation of an
area. Its value in this regard was demonstrated in the evacuation of lower Manhattan in
the aftermath of the 9/11 attacks.
It is particularly important to note that the insidious signature of terrorists such as Al
Qaeda is the use of multiple simultaneous attacks such as those in Riyadh, Saudi Arabia;
Casablanca, Morocco; in Kenya and Tanzania; in New York and Washington D.C. on
9/11; and in Istanbul. In the case of multiple simultaneous attacks, the response
resources of security forces and other government entities are likely to be stretched thin,
and in that situation efficient international deployment is particularly important. See Figure
1 for a map of the global reach of Al Qaeda related terrorism activities. The map shows
the distribution of the attacks and, subsequently, that response to these attacks requires
international effort and consensus for greatest efficacy.

Can and Leipnik
48 Professional Issues in Criminal Justice Vol 5(1), 2010
Figure 1
Wise deployment of response resources becomes critical if diversionary attacks are part
of a carefully coordinated assault. One strategy that has been exhibited by terrorists other
than Al Qaeda (including American extremist Erik Rudolph) and by the Irish Republican
Army is the use of a initial explosive device (or hostage) to lure responders
into an area where an antipersonnel bomb is then detonated with a time delay or by
remote control. All security and law enforcement agencies facing the possible dispatch of
highly trained and valuable personnel such as bomb disposal teams, forensic
investigators, and on-site command level officers need to be cognizant of the potential of
secondary explosives designed to accomplish the real primary objective of the terrorists,
which was to kill or maim government counterterrorism and other response team
members. Another aspect of appropriate response is to determine other secondary
sources of peril. So, for example, if a petrochemical complex was the target of an attack, it
would be the flammable, explosive, or toxic chemicals stored at the complex rather than
the direct impact of a bomb, airplane, or derailment that would be or paramount concern.

Use of Geographic Information Systems in Counterterrorism
Professional Issues in Criminal Justice Vol 5(1), 2010 49
GIS would help identify the contents of nearby tanks, vats, and pipelines at such a facility
and prioritize fire fighting and other response efforts.
Impact Assessment
Once the dust begins to settle and while the fires are yet smoldering in the rubble of sites
such as the World Trade Center (WTC) or the Beth Israel Synagogue, the process of
assessing the effects of an attack, including death and injury from the blast or building
collapse as well as injury from toxic smoke and ash clouds as in the case of the WTC
attack, can begin. Such effects can be evaluated by using GIS augmented by a
technology termed LIDAR (laser detection and ranging), which can be particularly
effective in creating a three-dimensional image of a site such as the WTC. LIDAR uses
aircraft-based laser devices to generate high-resolution rectified three-dimensional
computer representations of an area. If an area such as the WTC was mapped by using
LIDAR before an attack; post attack LIDAR visualization can be superimposed. This
imagery can be used to estimate the volume of material to be removed (in the case of the
WTC, more than 100 million tons of material was removed ultimately). Effects requiring
assessment may include rescue of persons living and recovery of dead trapped in the
rubble of collapsed buildings. In this case, in addition to GIS, GPS technology in
conjunction with CAD and laser and infrared surveying/sensing technologies can be
helpful. All these methods were employed at the WTC to determine the location from
which approximately 20,000 disparate and typically fragmentary body parts were
recovered from the approximately 3,000 victims.
Another way that GIS and satellite and digital aerial photography can be used is in
assessing the effects of a cloud of toxic smoke or aerosol. In the case of the WTC, smoke
and dust containing asbestos fibers, PCBs, dioxins, and heavy metals settled over a
significant and densely populated portion of lower Manhattan, which is the very heart of
the largest city in the United States. Subsequent analysis indicated an increase in
respiratory complaints among New Yorkers, particularly responders, which could perhaps
have been mitigated had the available geospatial data been analyzed and used to
implement expanded evacuation zones and more stringent respiratory protection
measures. The insult to the lungs of Manhattanites was an indirect consequence of the
attack, so how much more serious would the consequences be of an attack with an air
dispersed biological agent such as anthrax or tularemia or a vapor cloud released from
breach of a chlorine or hydrogen fluoride cylinder? The potential magnitude of the effects
of such an event can be comprehended by comparison with the Bhopal incident on
December 3, 1984, in Madhya Pradesh province of India, which may have caused the

Can and Leipnik
50 Professional Issues in Criminal Justice Vol 5(1), 2010
ultimate demise of upwards of 20,000 persons from methyl isocyanate, a less toxic agent
than either chlorine or hydrofluoric acid, both of which are widely used in industry.
Directed Retaliation
A whole volume could be written about the use of geospatial technologies in that most
logical and arguably most efficacious response to terrorism: carefully directed and
selective retaliation. The U.S Defense Department’s immediate response to the attacks
(which some would characterize as military and others are terroristic) on the U.S.S. Cole
on October, 10, 2000, in Yemeni port of Aden was to lob a salvo of cruise missiles at a
pharmaceutical factory (or chemical weapons plant depending on what one cares to
believe) in the Sudan and at rather crude structures at an Al Qaeda training camp in the
wilds of Afghanistan. This prompt and precise response, which used geospatial data and
GIS analysis integrally, did not cost tens of millions of dollars in cruise missiles. GIS was
used to identify the targets based on spy satellite and/or high level spy plane imagery,
then a GIS was used to determine the coordinates of targets, then a highly specialized
GIS program containing a digital elevation model was used along with GPS and inertial
navigational inputs14 to guide these missiles to their intended targets accurately.
Whether this response was efficacious or counterproductive or was even warranted in
the Sudanese case is debatable in hindsight. One can argue that geospatial data and
technology can be used more effectively to target GPS-guided bombs or, in the form of
GPS and digital maps and terrain models, direct special operations teams to travel
through unfamiliar and unfriendly country at night to carry out assaults, make arrests, or
conduct selective neutralization operations. And counterterrorism forces in countries that
do not possess cruise missiles but with assets on the ground and/or greater familiarity
with an area can also find aerial imagery, GPS, and digital mapping of great benefit.
While GPS technology allows an immediate aerial response in an unfamiliar area or
area lacking ground assets, the attacking entity also risks bombing the wrong target,
injuring the innocent, and creating negative reactions in the international community as
these technologies are subject to high tech snafus. Take, for example, the attack on the
People’s Republic of China (PRC) Embassy in Belgrade in May, 7, 1999, which killed
three PRC citizens in the Embassy building (Rosenthal, 1999). In this case, two U.S.
cruise missiles were targeted on a building identified incorrectly as the Yugoslav
Directorate of Logistics in a GIS developed by the National Imagery and Mapping Agency
and based on interpreted satellite imagery. Similarly, a nearly calamitous outcome
resulted from the use of GPS binoculars containing a laser range finder and providing
data to a digital radio communicating to a fighter bomber using a GIS based navigation
system while flying over Northern Afghanistan. In this case, on December, 5, 2001, the

Use of Geographic Information Systems in Counterterrorism
Professional Issues in Criminal Justice Vol 5(1), 2010 51
U.S. special operations soldier directed a 500-pound bomb on his own position rather
than the Taliban Held ridgeline miles away near Sayd Alim Kalay in Afghanistan, and it
killed three U.S. troops and five allied Afghans, injured more than 40, and almost killed
just-appointed Afghan Interim Authority leader Hamid Karzai.. It was later ascertained that
the changing of a GPS receiver’s battery in the middle of the American air raid caused the
incident The receiver defaults to display its own coordinates after the battery is replaced,
something the operator either did not know or overlooked in the heat of battle (Crittenden,
2002).
These examples underscore the observation of noted Vietnam War era
counterinsurgency expert Colonel John Paul Vann that “the best counterinsurgency
weapon is a dagger, then a pistol, then a rifle, then a machine gun, then a mortar, then
artillery, and only as a final and generally ineffective last resort should aerial
bombardment be employed” (Sheehan, 1988, 181). However, whether directing cruise
missiles or covert agents, geospatial technologies are playing an important role in
counterterrorist operations.
Conclusion
As the preceding examples make clear, geospatial technologies are not a panacea for the
wide range of woes that global terrorism has unleashed on the new millennium 21st
century. However, these 21st century technologies are finding an increasingly important
place in the arsenal of modern counterterrorist techniques.
Notes
1. Author names appear in alphabetical order.
2. Refers to technologies such as GIS (Geographical Information Systems), GPS
(Global Positioning Systems), and remote sensing that are used to measure, analyze, and
visualize the attributes of the surface of the earth.
3. Data that relate to a specific, precisely defined location. The data are often
statistical but may be text, images, or multimedia. These are linked in the GIS to spatial
data that define the location.
4. The explicit definition of how map features represented by points, lines, and areas
are related; specifically, issues of connectivity and adjacency of features are accounted for.
5. Data on the different layers use the same spatial extent, coordinate system, and
projection
6. Relating to, occupying, or having the character of space

Can and Leipnik
52 Professional Issues in Criminal Justice Vol 5(1), 2010
7. Added as points at the appropriate spatial location in a new layer co-registered
with the underlying street layer along the side of the corresponding street
8. An area of land specifically designed to separate one zoning use from another,
such as separating a residential neighborhood from an industrial area.
9. An electronic device that records all numbers dialed from a particular telephone line.
10. A decision-making tool that uses artificial intelligence applications to create
mathematical modeling
11. Using platforms such as SimCity or Second Life to simulate terrorist incidents in
real geographical settings with real data (infrastructure, deployment, stockpile, weather
conditions, etc.) to train personnel.
12. Theories that explain the vulnerability of the buildings with their design
deficiencies include target hardening or crime prevention thru environmental design
(Cross-Drew, 1989), defensible space (Newman, 1972), and routine activities (Cohen &
Felson, 1979). In our examples, the building deficiencies were not determined before the
incidents; however, after such incidents, several precautions were introduced to fix these
deficiencies such as strong concrete blockings around the government buildings.
13. Model used by Emergency Medical Services to notify the vehicles needed to
cover all zones while simultaneously maximizing the extent of multiple coverage of zones
14. A computer aided system that uses satellite signals received with two spatially
separated antennas (motion and rotation sensors) to achieve improved heading estimates
for a mobile platform without any external references (coordinates)
References
Borgharkar, N. S.; Griffin, G. L.; Fan, H.; & Maverick, A. W. (1999). Solution delivery ofCu(hfac)2 for alcohol-assisted copper CVD. Journal of the Electrochemical Society,146, 1041–1045.
Burrough, P. A. (1985). Principles of geographic information systems for land resourcesassessment. Oxford, UK: Oxford University Press.
Crittenden, J. (2002, March 27). Report: Air controller called in friendly fire. Boston Herald,pp. A1, A6.
Cohen, L., & Felson, M. (1979). Social change and crime rate trends: A routine activityapproach. American Sociological Review, 44, 588–608.
Cross-Drew, C. (1989). Target hardening: A literature review. Washington DC: Office ofthe Attorney General.

Use of Geographic Information Systems in Counterterrorism
Professional Issues in Criminal Justice Vol 5(1), 2010 53
Leipnik, M. R., & Albert, D. (2003). The Daleware real time crime reporting system: Astatewide and enterprise-wide GIS application for law enforcement. In M. R. Leipnik &D. Albert (Eds.), Geographic information systems in law enforcement: Implementationissues and case studies. (pp. 197–210).. London: Taylor and Francis.
Leipnik, M. R., & Albert, D. (Eds.) (2003). Geographic information systems in lawenforcement: Implementation issues and case studies. London: Taylor and Francis.
Leipnik, M. R., & Mehta, S. (2002, December). Global geo-demographic data in e-commerce. Proceedings of the 2nd International Conference on Electronic Business,Taipei, Taiwan. [In printed proceedings]
Newman, O. (1972). Defensible space: Crime prevention through urban design. NY:Macmillan.
Rosenthal, E. (1999, May 17). Crisis in the Balkans: China; Public anger against U.S. stillsimmers in Beijing. New York Times, p. A11.
Sheehan, N. (1988). A bright shining lie: John Paul Vann and America in Vietnam. NY:Random House.
Webb. D. W, & Can, S. H. (2005). Incident Command Simulation (InCoSiT) Project. Crimeand Justice International, 21(85), 29–35.