Use of Geographic Information Systems and Remote Sensing ...
18
Use of Geographic Information Systems and Remote Sensing in Integrated pest Management Programs Teresia Nyoike, Post-doctoral Research Associate Entomology and Nematology Dept. University of Florida
Transcript of Use of Geographic Information Systems and Remote Sensing ...

Use of Geographic Information Systems
and Remote Sensing in Integrated pest
Management Programs
Teresia Nyoike,
Post-doctoral Research Associate
Entomology and Nematology Dept.
University of Florida
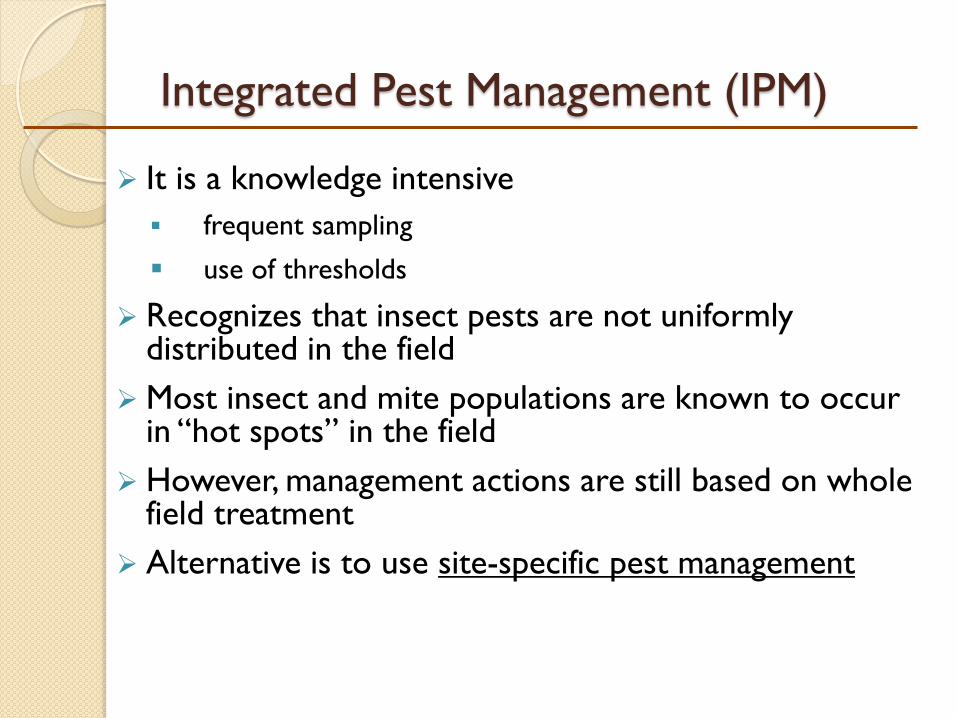
Integrated Pest Management (IPM)
It is a knowledge intensive
frequent sampling
use of thresholds
Recognizes that insect pests are not uniformly distributed in the field
Most insect and mite populations are known to occur in “hot spots” in the field
However, management actions are still based on whole field treatment
Alternative is to use site-specific pest management

Site-specific pest management (SSPM)
SSPM approach recognizes that pest populations are varied in time and space
Therefore:
more informed management decisions
more efficient use of inputs (chemical, biocontrol agents)
conserve the environment
Involves developing sampling program to generate pest density maps that will guide management to target specific locations
To develop the maps, a global positioning systems (GPS), geographic information systems (GIS) and geostatistics are used

Example: Distribution of spider mites and its predatory mite
TSSM populations are known to occur in “hot spots” in the field
Temporal and spatial variability of TSSM & its predator (N. californicus):
provide valuable information towards mite management
study their population dynamics
determine how predatory mites disperse from a point of release after inoculation

Sampling and generating pest density maps - GPS/GIS
Decide your sampling design –regular/stratified/transect
Georefencing your sampling points
Input your geo-referenced points into GIS (e.g. ArcMAP – ESRI)
Keep a record of the insect data and geo-referenced points -GPS point 1 corresponds to insect population at that exact point 1
Choose the optimum interpolation method to generate the continuous surfaces (maps)
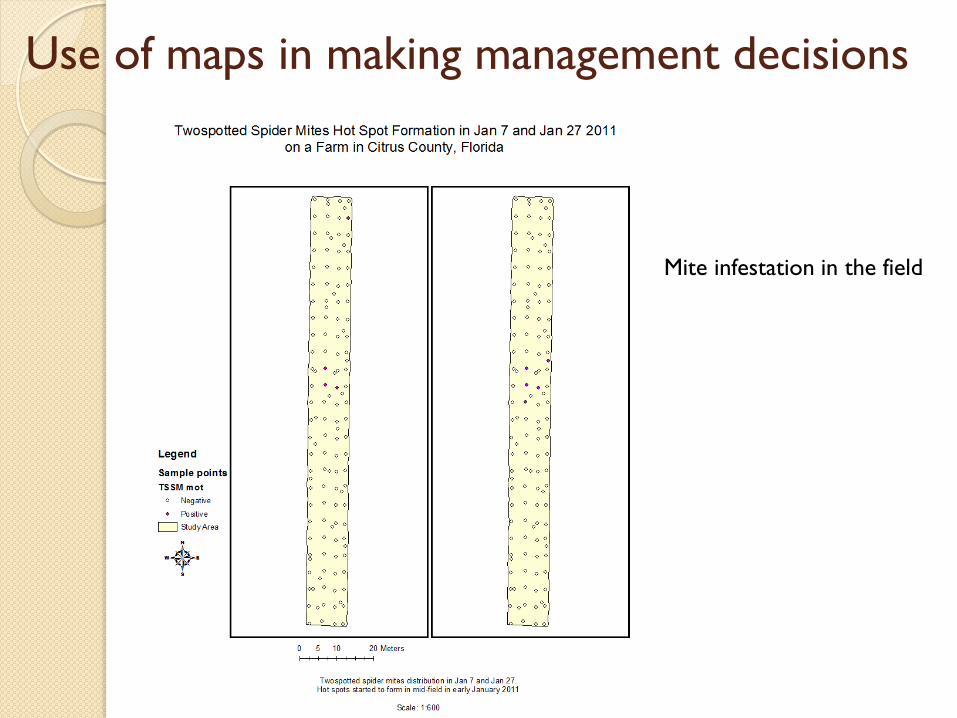
Use of maps in making management decisions
Mite infestation in the field

Sampling dates:
Map 1 – March 1st
Map 2 - March 14th
Map 3 – March 30th
• TSSM management on
March 1st could be done only
in the center and north side
of the field
• Delaying until March 30th
will require treating the
whole field
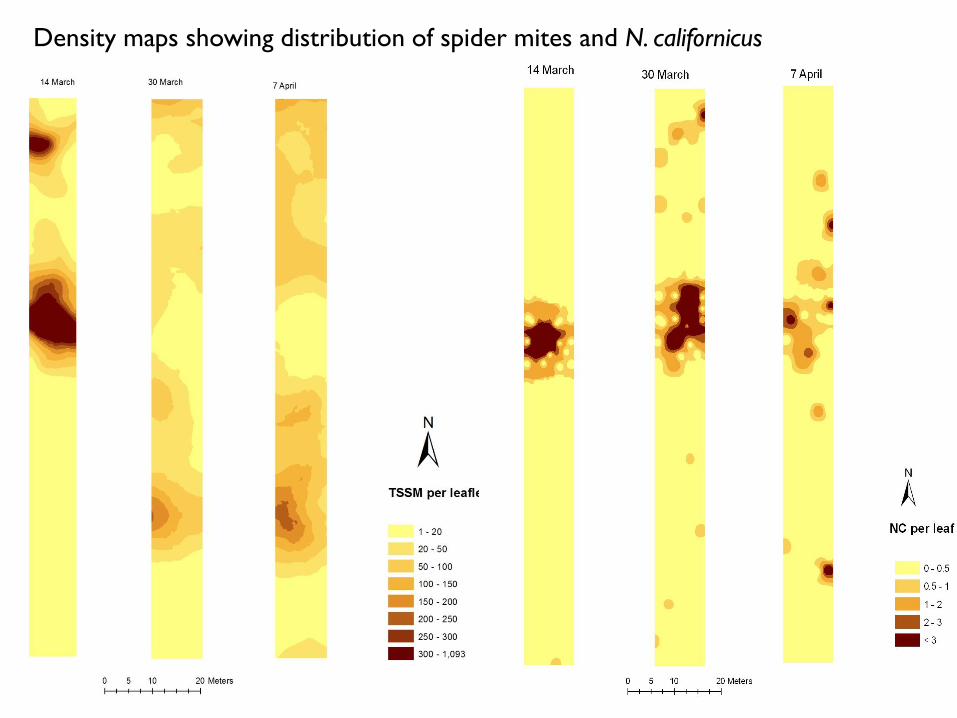
Density maps showing distribution of spider mites and N. californicus

GIS
Where? - location
What is the trends? - what happened
Patterns?
what if? - modeling (pest data + weather
factors or soil type etc)

Use of Remote Sensing for Improved
Sampling Techniques
Use of leaf reflectance spectroscopy (remote
sensing) to detect pest damage on leaves
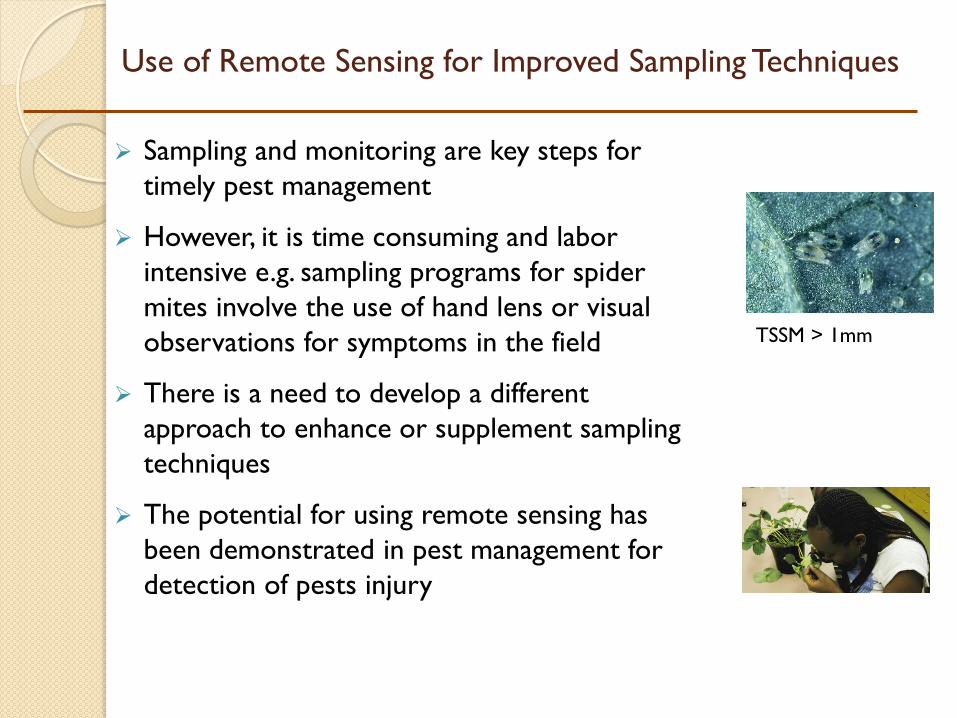
Use of Remote Sensing for Improved Sampling Techniques
Sampling and monitoring are key steps for
timely pest management
However, it is time consuming and labor
intensive e.g. sampling programs for spider
mites involve the use of hand lens or visual
observations for symptoms in the field
There is a need to develop a different
approach to enhance or supplement sampling
techniques
The potential for using remote sensing has
been demonstrated in pest management for
detection of pests injury
TSSM > 1mm
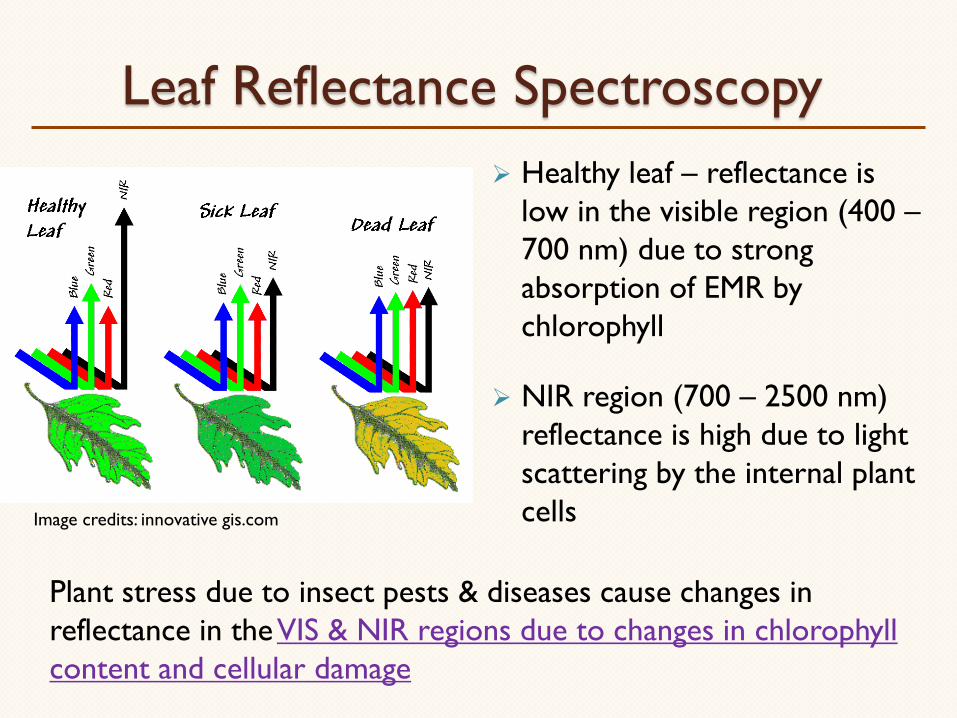
Leaf Reflectance Spectroscopy
Healthy leaf – reflectance is
low in the visible region (400 –
700 nm) due to strong
absorption of EMR by
chlorophyll
NIR region (700 – 2500 nm)
reflectance is high due to light
scattering by the internal plant
cells Image credits: innovative gis.com
Plant stress due to insect pests & diseases cause changes in
reflectance in the VIS & NIR regions due to changes in chlorophyll
content and cellular damage

Example: Spider mites
Mites injury –
removal of chlorophyll
cell structure damage through their feeding
This causes changes in leaf reflectance properties of the leaf
These are changes can be quantified to indirectly estimate the number of spider mites causing injury on the leaf

Leaf Reflectance Curves
0
10
20
30
40
50
60
70
200 700 1200 1700 2200
Refl
ecta
nce (
%)
Wavelength (nm)
Control Low High
Control - 3.6 ± 1.5
Low - 74.0 ± 12.8
High - 161.9 ± 37.6
NIR region was the most important region predict TSSM injury
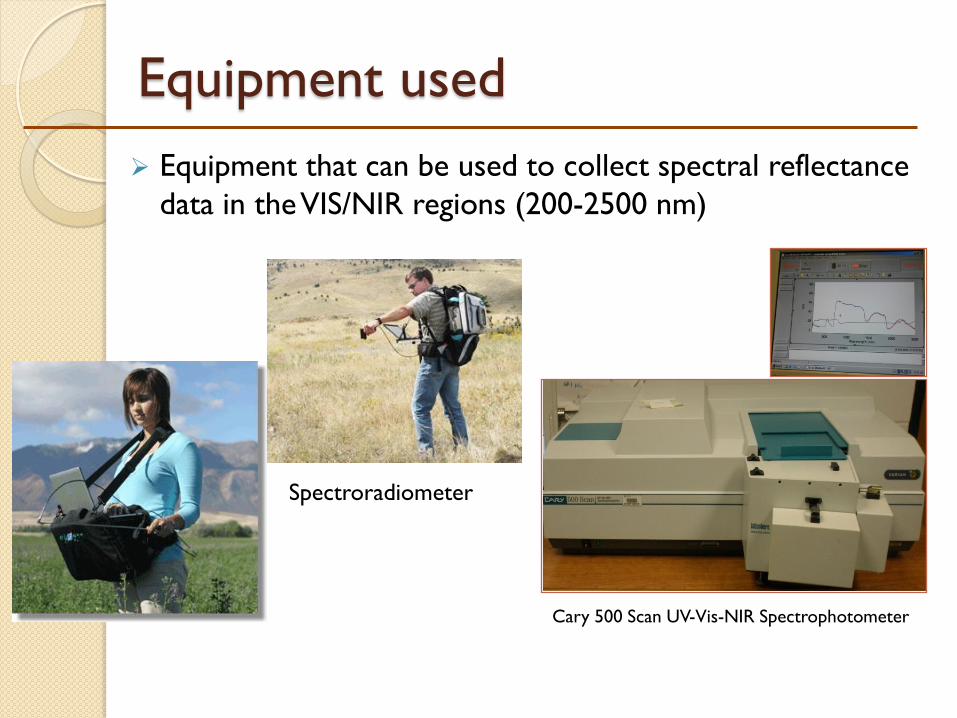
Equipment used
Equipment that can be used to collect spectral reflectance
data in the VIS/NIR regions (200-2500 nm)
Cary 500 Scan UV-Vis-NIR Spectrophotometer
Spectroradiometer

Remote sensing platforms
http://www.searchmesh.net/default.aspx?page=1726 http://gisatmarwadi.wordpress.com/
Satellites – Landsat, GeoEye Inc, Quickbird Air craft

Field Applications…
In real-time sampling programs pests
Hand-held spectrophotometers can be mounted on a
tractor with a GPS to generate field maps for site-
specific pest management of pest
Ground-based

Spotted Wing Drosophila in the U.S.
Since 1980