Use of Geographic Information System (GIS) In Disease ... allows users to collate and analyse...
16
1 Fig 1: Layers Concept in GIS Issue -4 Vol. 1 A monthly Surveillance Report from Integrated Disease Surveillance Programme National Health Mission April 2016 Epidemiology is a study of distribution and determinants of health related states or events and application of the study to the control of diseases and other health problems. One of the factor that determine the disease and aids its transmission is environment. In any disease surveillance system, lot of data for multiple diseases is collected and analysed to prevent occurrence of an outbreak. These analysis are mainly done through table and graphs. Although, tabular and graphical representation represents all of the requested data but, it remains very difficult to fully understand the patterns and trends buried in them or make quick and effective comparisons between the figures. Analysing this information clubbed with other factors like (population density, forests, water bodies, drinking water availability, elevation etc.) makes the situation even more complex. Thus, mapping spatial aspects of diseases could help understand some puzzles of disease outbreaks as the information is more easily understood when visualized on a map. Geographic Information System (GIS) has emerged as an innovative, important component of public health and epidemiology. It is an excellent Inside 1. Use of Geographic Information System (GIS) In Disease Surveillance ….Page 1 2. Surveillance data of Enteric Fever, ADD, Viral Hepatitis A & E, Dengue and Leptospirosis ……Page 3 3. Outbreak Investigation of Viral Hepatitis, Ramnagar, District Nainital, Uttarakhand ……….Page 13 4. ActioŶ froŵ Field……… Page 14 5. Glossary………………Page 15 Use of Geographic Information System (GIS) In Disease Surveillance Data Layers (Tables)
Transcript of Use of Geographic Information System (GIS) In Disease ... allows users to collate and analyse...

1
Fig 1: Layers Concept in GIS
Issue -4 Vol. 1
A monthly Surveillance Report from Integrated Disease Surveillance Programme National Health Mission
April 2016
Epidemiology is a study of distribution and determinants of health related states or events and
application of the study to the control of diseases and other health problems. One of the factor that determine
the disease and aids its transmission is environment.
In any disease surveillance system, lot of data for multiple diseases is collected and analysed to
prevent occurrence of an outbreak. These analysis are mainly done through table and graphs. Although, tabular
and graphical representation represents all of the requested data but, it remains very difficult to fully
understand the patterns and trends buried in them or make quick and effective comparisons between the
figures. Analysing this information clubbed with other factors like (population density, forests, water bodies,
drinking water availability, elevation etc.) makes the situation even more complex.
Thus, mapping spatial aspects of diseases could help understand some puzzles of disease outbreaks
as the information is more easily understood when visualized on a map. Geographic Information System (GIS)
has emerged as an innovative, important component of public health and epidemiology. It is an excellent
Inside
1. Use of Geographic Information System (GIS) In Disease Surveillance ….Page 1
2. Surveillance data of Enteric Fever, ADD, Viral Hepatitis A & E, Dengue and Leptospirosis ……Page 3
3. Outbreak Investigation of Viral Hepatitis, Ramnagar, District Nainital, Uttarakhand ……….Page 13
4. Actio fro Field……… Page 14
5. Glossary………………Page 15
6.
Use of Geographic Information System (GIS) In Disease Surveillance
Data Layers (Tables)

2
means for mapping, visualizing and analysing disease data, revealing trends, dependencies and inter-
relationships between public health data and environment. GIS integrates, manipulates and displays a wide
range of information which creates a picture of an area's geography, environment and socio-economic
characteristics. GIS allows users to collate and analyse various types of spatially referenced data and matched
disease/outbreak data far more readily than the traditional research techniques. It helps to links geographic
locations with characteristics of the phenomena found there (e.g., cases of disease, demographics, water
supply and drainage lines, vector breeding sites like ponds, streams, tanks etc. can easily be identified) and
thus visually display the spatial associations.
For disease surveillance GIS helps in:
1. Identifying subtle patterns like Spatial Distribution of Disease (Disease Clustering) which may be missed in
tabular representation and determine where control and prevention should be focused–
As shown in Fig 2, at all
India level for H1N1 disease
(declared as pandemic by
WHO in 2009 due to its fast
spread all over the world)
we can easily say that the
states reporting maximum
number of deaths for H1N1
are Maharashtra, Gujarat,
Rajasthan and Madhya
Pradesh (all the states have
adjoining boundaries). Of all
the 4 states Maharashtra
reports the maximum
number of deaths.
On further drill down we see
that Pune, Mumbai reports
the maximum no of deaths
compared to other districts of Maharashtra (Fig 3).
Also, GIS can be used at individual or aggregate
level to identify the etiology of a disease and to
understand the association of a disease with
environmental variables. Identification of
diseases determinants like vector breeding
sites (e.g. catchment areas, ponds, streams,
tanks etc.), vulnerable groups, location of
Health facilities, movement of carriers etc. can
instantly be identified by looking at the map.
Climate variables (like temperature, relative
humidity, saturation deficiency and Rainfall)
can also be analysed. Although this association
is subject to availability of their respective GIS
coordinates.
GIS helps us answer following type of questions
like: What is it? (What exists at a particular
location), Where is it? (Instead of identifying
what exists at a particular location we can find
a location where certain conditions are satisfied),
Fig 2: Map of H1N1 deaths reported for the year 2015
Fig 3: Map for cases and deaths reported in Maharashtra
due to H1N1
3
Fig. 4: Reporting Status based on P & L form during April 2014-
2016
trends (seeks to find the differences between the two areas), patterns (like- whether cancer is a major cause of
death among residents near a nuclear power station) etc.
Therefore, GIS application provides a common platform for multi-disease surveillance activities, decision
support system for real-time monitoring and analysis. To initiate the process of integration of GIS in IDSP , a meeting
was held on 16.03.2016 at NCDC under the chairmanship of Director NCDC for development of web-based GIS
application for IDSP.Participants from various Government organizations where GIS application have successfully
been implemented showcased their running models. Also, discussion on the various issues, technology to be
adopted was held. Integration of GIS in IDSP will not only help in dynamically creating thematic maps for
cases/deaths reported for multiple diseases at all levels (All India/State/Dist i t , ut also i the ide tif i g it s relation with other parameters like population density, water-bodies, temperature etc. which may in turn help in
identifying the etiology of disease and determine where control and prevention should be focused. Thus, GIS can
e of g eat aid to st e gthe health o ke s apa ilit fo epide iologi al a al sis a d to fa ilitate the dissemination of data relating to epidemiology and public health.
* Data extracted from IDSP Portal (www.idsp.nic.in) as on August 19; 2016.
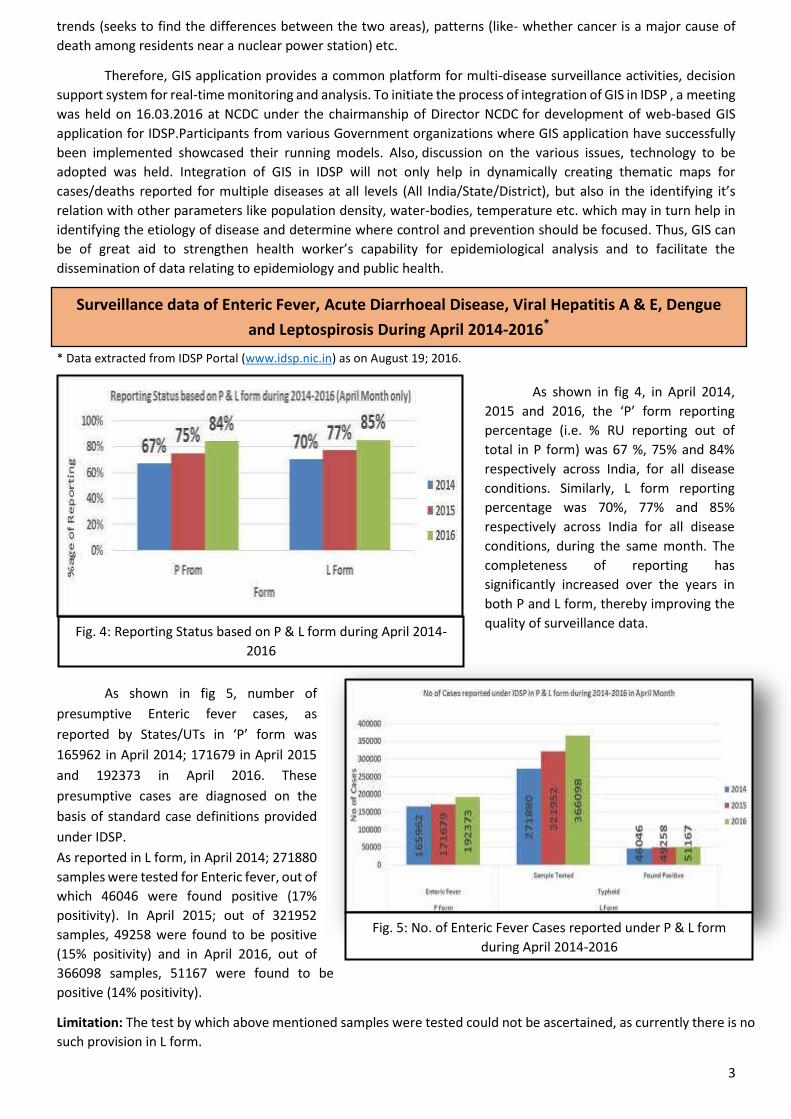
As shown in fig 5, number of
presumptive Enteric fever cases, as
epo ted “tates/UTs i P fo as 165962 in April 2014; 171679 in April 2015
and 192373 in April 2016. These
presumptive cases are diagnosed on the
basis of standard case definitions provided
under IDSP.
As reported in L form, in April 2014; 271880
samples were tested for Enteric fever, out of
which 46046 were found positive (17%
positivity). In April 2015; out of 321952
samples, 49258 were found to be positive
(15% positivity) and in April 2016, out of
366098 samples, 51167 were found to be
positive (14% positivity).
Limitation: The test by which above mentioned samples were tested could not be ascertained, as currently there is no
such provision in L form.
Surveillance data of Enteric Fever, Acute Diarrhoeal Disease, Viral Hepatitis A & E, Dengue
and Leptospirosis During April 2014-2016*
As shown in fig 4, in April 2014,
a d , the P fo epo ti g percentage (i.e. % RU reporting out of
total in P form) was 67 %, 75% and 84%
respectively across India, for all disease
conditions. Similarly, L form reporting
percentage was 70%, 77% and 85%
respectively across India for all disease
conditions, during the same month. The
completeness of reporting has
significantly increased over the years in
both P and L form, thereby improving the
quality of surveillance data.
Fig. 5: No. of Enteric Fever Cases reported under P & L form
during April 2014-2016

4
As shown in fig 6, number of Acute
Diarrhoeal Disease cases, as reported by
States/UTs i P fo as i Ap il 2014; 1000216 in April 2015 and 1165126 in
April 2016. These presumptive cases are
diagnosed on the basis of standard case
definitions provided under IDSP.
As reported in L form, in April 2014,
1859 samples were tested for Cholera out
of which 23 tested positive (1% positivity);
in April 2015, out of 2201 samples, 18
tested positive for Cholera (1%
positivity)and in April 2016, out of 2732
samples, 78 tested positive (3% positivity).
As shown in fig 7, the number of
presumptive viral hepatitis cases was 24133
in April 2014, 19785 in April 2015 and 31547
in April 2016. These presumptive cases were
diagnosed on the basis of standard case
definitions provided under IDSP.
As reported in L form for viral
hepatitis A, in April 2014; 13514 samples
were tested out of which 747 were found
positive (6% positivity). In April 2015; out of
14470 samples, 899 were found to be positive
(6% positivity) and in April 2016, out of 15911
samples, 985 were found to be positive (6%
positivity).
As reported in L form for viral
hepatitis E, in April 2014; 3816 samples were
tested out of which 378 were found positive
(10% positivity). In April 2015; out of
4280 samples, 406 were found to be
positive (9% positivity) and in April 2016,
out of 8278 samples, 886 were found to
be positive (11% positivity).
As shown in fig 8, number of
presumptive Dengue cases, as reported by
“tates/UTs i P fo as i Ap il 2014; 2566 in April 2015 and 4410 in April
2016. These presumptive cases are
diagnosed on the basis of standard case
definitions provided under IDSP.
As reported in L form, in April 2014;
15666 samples were tested for Dengue, out
of which 842 were found positive (5%
positivity). In April 2015; out of 14406
samples, 716 were found to be positive (5% Fig. 8: No. of Dengue Cases reported under IDSP in P & L form
during April 2014-2016
Fig. 7: No of Viral Hepatitis Cases reported under IDSP in P
form & Viral Hepatitis A & E cases reported under L form
during April 2014-2016
Fig. 6: No. of ADD Cases reported under IDSP in P form & Lab
confirmed Cholera cases in L form during April 2014-2016

5
positivity) and in April 2016, out of 28050 samples, 1492 were found to be positive (5% positivity).
Limitation: The test by which above mentioned samples were tested could not be ascertained, as currently there is no
such provision in L form.
As shown in fig 9, number of
presumptive Leptospirosis cases, as
epo ted “tates/UTs i P fo as 519 in April 2014; 851 in April 2015 and
424 in April 2016. These presumptive
cases are diagnosed on the basis of
standard case definitions provided under
IDSP.
As reported in L form, in April
2014; 4859 samples were tested for
Leptospirosis, out of which 99 were found
positive (2% positivity). In April 2015; out
of 4360 samples, 66 were found to be
positive (2% positivity) and in April 2016,
out of 7217 samples, 167 were found to
be positive (2% positivity).
Fig. 9: No. of Leptospirosis Cases reported under IDSP in P & L
form during April 2014-2016
Fig 10: State/UT wise P form completeness % for April 2016
6
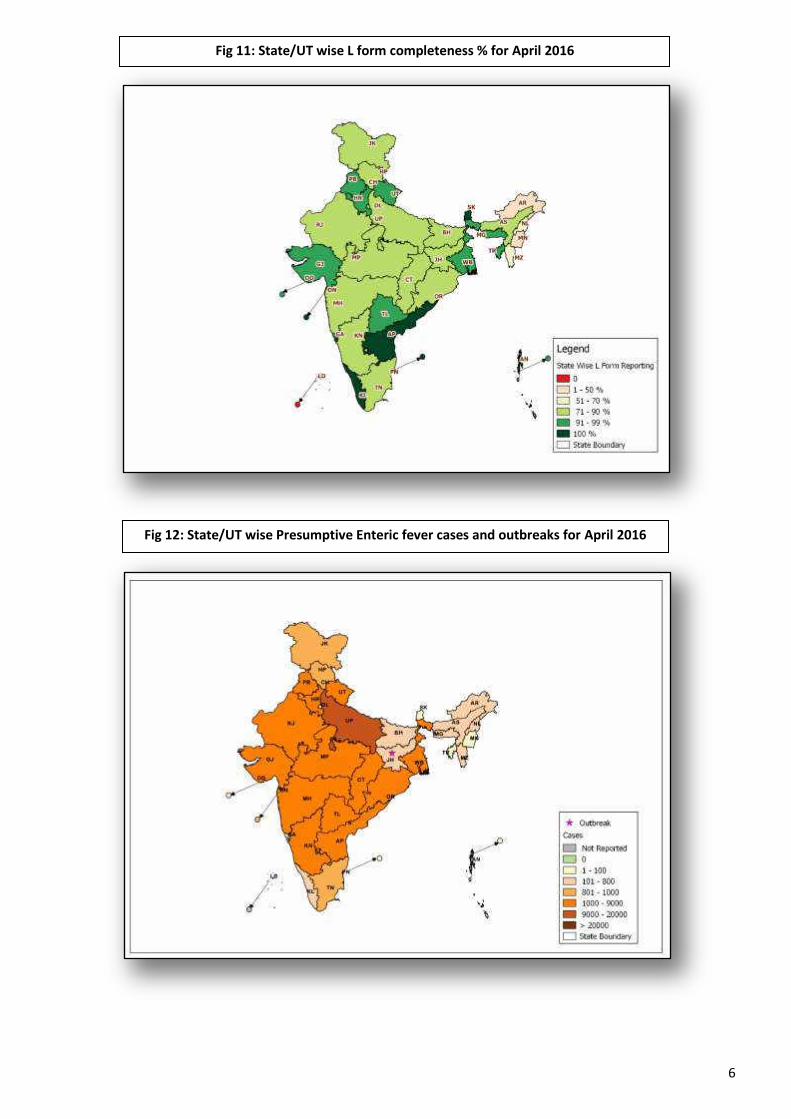
Fig 11: State/UT wise L form completeness % for April 2016
Fig 12: State/UT wise Presumptive Enteric fever cases and outbreaks for April 2016

7
Fig 13: State/UT wise Lab Confirmed Enteric Fever cases and outbreaks for April 2016
Fig 14: State/UT wise Presumptive ADD cases and outbreaks for April 2016

8
Fig 15: State/UT wise Lab Confirmed Cholera cases and outbreaks for April 2016
Fig 16: State/UT wise Presumptive Viral Hepatitis cases and outbreaks for April 2016

9
Fig 17: State/UT wise Lab confirmed Viral Hepatitis A cases for April 2016
Fig 18: State/UT wise Lab confirmed Viral Hepatitis E cases for April 2016

10
Fig 19: State/UT wise Presumptive Dengue cases & outbreaks for April 2016
Fig 20: State/UT wise Lab confirmed Dengue cases for April 2016

11
Fig 21: State/UT wise Presumptive Leptospirosis cases for April 2016
Fig 22: State/UT wise Lab Confirmed Leptospirosis cases & outbreak for April 2016

12
Introduction
I d eek of Ap il suspe ted ases of i al hepatitis i u e e e epo ted i ID“P P Fo (week No. 14, 2016) by Govt. Combined Hospital, Ramnagar to Distict surveillance Unit Nainital. Alert was generated
for suspected viral hepatitis outbreak because the trend of Viral Hepatitis cases suddenly rises in week 14, 2016. RRT
investigated the outbreak on 11/04/2016 with the objective of describing the outbreak, confirming the etiology and
providing recommendation to control.
Methods
RRT visited the reporting Unit (Govt. Combined Hospital, Ramnagar) and used IDSP case definition-
A ute ill ess t pi all i ludi g a ute jau di e, da k u i e, a o e ia, alaise, e treme fatigue, and right upper
uad a t te de ess fo ide tif i g the ases. ‘e ie of e o ds a d egiste s as o du ted to p epa e the li e list and conducting descriptive epidemiology.
05 blood samples were collected for lab confirmation of etiology and tested at IDSP referral lab Govt. Medical
College Haldwani, Nainital. Patients were interviewed and affected areas were visited by local health teams to identify
other cases in community.
Results
20 cases of Viral Hepatitis were identified, admitted at Govt. Combined Hospital, Ramnagar. Of those 08
cases belong to Khatiyari area and others were from different areas. RRT visited the affected areas which are
located under semi urban settings, the population lives in unhygienic and poor sanitary conditions. During
investigation no new case was found. The epi-curve of the outbreak is as below:
Outbreak Investigation of Viral Hepatitis, Ramnagar, Nainital District, Uttarakhand,
April, 2016
Fig 23: Time Wise Distribution of Viral Hepatitis E Cases
Index case was a 06 Yrs/F, R/o Khatiyari, in which symptoms started on 02/04/2016.

13
Fig 24: Area Wise Distribution of Viral Hepatitis E Cases
Fig 25: Age Wise Distribution of Viral Hepatitis E Cases
Fig 25: Distribution of Viral Hepatitis E Cases by Age & Sex

14
Most affected age group was 15-25 yrs and 26-40 yrs. Both the genders were equally affected (50% each).
Laboratory findings
All samples collected tested positive for HEV IgM ELISA at IDSP referral lab at Govt. Medical College Haldwani.
Conclusion
The outbreak was confirmed to be due to Hepatitis E. It may have occurred due to unhygienic and poor living
standard/lifestyle.
Recommendations
Timely identification, treatment and reporting of cases
Provision of safe water, chlorination of drinking water sources
Boiling of drinking water before consumption
Health education and IEC among the population
Regular water quality testing
Inter-sectoral coordination between Health department, Jal Sansthan and Municipality is required.
Daily reporting till outbreak subsides.
Control measures undertaken
Symptomatic treatment of all cases.
Health education and IEC.
Coordination with Jal Sansthan for chlorination of water sources/tanks.
Communicated to Municipal Dept. for sanitation and hygiene.
Contributed by:
Dr. Kiran Bisht, SSO & Additional Director (IDSP), Uttarakhand
Dr. Pankaj Kumar Singh, Assistant Director (IDSP), Uttarakhand
Dr. Akhilesh Tripathi, Epidemiologist IDSP, Uttarakhand
Preparatory activities for Epidemic Intelligence Services during Simhastha, 2016 under IDSP.
HOD Epidemiology NCDC & NPO IDSP NCDC visited the Ujjain, Madhya Pradesh between
11 April to 13 April, 2016 for preparation of epidemiological intelligence activity and to establish
the surveillance system at Simhastha, Ujjain.
Action from the field
A Meeting at DSU (Ujjain) chaired by Principal
Secretary Health, Madhya Pradesh to set up
the surveillance system during mass gathering.
Discussions among officials for
strengthening disease surveillance under
IDSP during Simhastha, 2016

15
Glossary:
P form: Presumptive cases form, in which cases are diagnosed and reported based on typical history and clinical
examination by Medical Officers.
Reporting units under P form: Additional PHC/ New PHC, CHC/ Rural Hospitals, Infectious Disease Hospital (IDH),
Govt. Hospital / Medical College*, Private Health Centre/ Private Practitioners, Private Hospitals*
L form: Lab confirmed form, in which clinical diagnosis is confirmed by an appropriate laboratory tests.
Reporting units under L form: Private Labs, Government Laboratories, Private Hospitals(Lab.), CHC/Rural
Hospitals(Lab.),
HC/ Additional PHC/ New PHC(Lab.), Infectious Disease Hospital (IDH)(Lab.), Govt. Hospital/Medical
College(Lab.), Private Health Centre/ Private Practitioners(Lab.)
Completeness %: Completeness of reporting sites refers to the proportion of reporting sites that submitted the
surveillance report (P & L Form) irrespective of the time when the report was submitted.
State Code:
Andaman & Nicobar Islands AN; Andhra Pradesh AP; Arunachal Pradesh AR; Assam AS; Bihar BH; Chandigarh CH;
Chhattisgarh CT; Dadra & Nagar Haveli DN; Daman & Diu DD; Delhi DL; Goa GA; Gujarat GJ; Haryana HR; Himachal
Pradesh HP; Jammu & Kashmir JK; Jharkhand JH; Karnataka KN; Kerala KL; Lakshadweep LD; Madhya Pradesh
MP; Maharashtra MH; Manipur MN; Meghalaya MG; Mizoram MZ; Nagaland NL; Odisha OR; Puducherry PN;
Punjab PB; Rajasthan RJ; Sikkim SK; Tamil Nadu TN; Telangana TL; Tripura TR; Uttar Pradesh UP; Uttarakhand UT;
West Bengal WB.
Case definitions:
Enteric Fever: Presumptive: Any patient with fever for more than one week and with any two of the following:
Toxic look, Coated tongue, Relative bradycardia, Splenomegaly, Exposure to confirmed case, Clinical presentation
with complications e.g. GI bleeding, perforation, etc. AND/OR Positive serodiagnosis (Widal test)
Confirmed: A case compatible with the clinical description of typhoid fever with confirmed positive culture
(blood, bone marrow, stool, urine) of S. typhi/ S. paratyphi.
ARI/ ILI:-An acute respiratory infection with fever of more than or equal to 38 C° and cough; with onset within
the last 10 days.
Presumptive Acute Diarrheal Disease (Including Acute Gastroenteritis): Passage of 3 or more loose watery
stools in the past 24 hours. (With or without vomiting).
Confirmed Cholera: A case of acute diarrhoea with isolation and identification of Vibrio cholera serogroup O1 or
O139 by culture of a stool specimen.
Viral Hepatitis: Presumptive: Acute illness typically including acute jaundice, dark urine, anorexia, malaise,
extreme fatigue, and right upper quadrant tenderness.
Confirmed: Hepatitis A: A case compatible with the clinical description of acute hepatitis with demonstration of
anti-HAV IgM in serum sample.
Confirmed: Hepatitis E: A case compatible with the clinical description of acute hepatitis with demonstration of
anti-HEV IgM in serum sample.
Dengue: Presumptive: An acute febrile illness of 2-7 days duration with two or more of the mentioned
manifestations:

16
Headache, Retro-orbital pain, Myalgia, Arthralgia, Rash, haemorrhagic manifestations, leukopenia, or Non-
ELISA based NS1 antigen/IgM positive. (A positive test by RDT will be considered as probable due to poor
sensitivity and specificity of currently available RDTs.)
Confirmed: A case compatible with the clinical description of dengue fever with at least one of the following:
Demonstration of dengue virus NS-1 antigen in serum sample by ELISA.
Demonstration of IgM antibodies by IgM antibody capture ELISA in single serum sample.
IgG seroconversion in paired sera after 2 weeks with fourfold increase of IgG titre.
Detection of viral nucleic acid by polymerase Chain reaction (PCR).
Isolation of the dengue virus (virus culture +ve) from serum, plasma, leucocytes.
(Source – Dengue National guidelines, NVBDCP 2014)
Leptospirosis case definition: Presumptive: Acute febrile illness with headache, myalgia and prostration
associated with a history of exposure to infected animals or an environment contaminated with animal urine
With one or more of the following:
Calf muscle tenderness
Conjunctival suffusion
Oliguria or anuria and/or proteinuria
Jaundice
Haemorrhagic manifestations (intestines, lung)
Meningeal irritation
GI symptoms ( Nausea/ Vomiting/ Abdominal pain/Diarrhoea)
And/or one of the following:-
A positive result in IgM based immune- assays, slide agglutination test or latex agglutination test or
immunochromatographic test.
A Microscopic Agglutination Test (MAT) titre of 100/200/400 or above in single sample based on
endemicity.
Demonstration of leptospires directly or by staining methods
Lab Confirmed Case Definition: A case compatible with the clinical description of leptospirosis with at least
one of the following:
Isolation of leptospires from clinical specimen.
Four fold or greater rise in the MAT titre between acute and convalescent phase serum specimens run in
parallel.
(Source: -National Guidelines on Diagnosis, Case Management Prevention and Control of Leptospirosis
NCDC 2015)
Prepared by: Central Surveillance Unit, IDSP under the guidance of Director,
NCDC
Acknowledgement:
This disease alert from IDSP acknowledges the contribution of Dr. S. Venkatesh Director NCDC, Dr.
Pradeep Khasnobis Sr. CMO & Officiating NPO IDSP, Dr. Jyoti Asstt. Director IDSP, Ms. Ritu Malik Consultant
GIS IDSP, Ms. Pallavi Luthra, Consultant IT IDSP, Mr. Priyank Pandya Communication Officer IDSP, Mr. Prasun
Sharma Statistician cum Programmer IDSP, Ms. Sujata Malhotra Data Manager IDSP & Mr. Avnesh Sharma,
Media Scanning Assistant, IDSP .
The data shown in the IDSP Surveillance bulletin are provisional, based on weekly reports to
IDSP by State Surveillance Unit. Inquiries, comments and feedback regarding the IDSP Surveillance
Report, including material to be considered for publication, should be directed to: Director, NCDC
22, Sham Nath Marg, Delhi 110054. Email: [email protected] & [email protected]