Performance Testing of Fiber-Reinforced Polymer Composite ...
Final Report
Use of Fiber Reinforced Polymer Composite Cable for
Post-Tensioning Application
FDOT Contract No. BDK80-977-35 and BDV29-977-10
Amir Mirmiran, Xiong Yang, and Pedram Zohrevand
Department of Civil and Environmental Engineering
Florida International University
Miami, Florida
Nakin Suksawang
Department of Civil Engineering
Florida Institute of Technology
Melbourne, Florida
Madasamy Arockiasamy
Department of Civil, Environmental & Geomatics Engineering
Florida Atlantic University
Boca Raton, Florida
Submitted to:
Mr. William Potter, Project Manager
Marcus H. Ansley Structures Research Center
Florida Department of Transportation
2007 E. Paul Dirac Drive, Tallahassee, FL 32310
July 31, 2015

ii
DISCLAIMER
The opinions, findings, and conclusions expressed in this publication are of the authors alone,
and not necessarily those of the State of Florida Department of Transportation.
iii
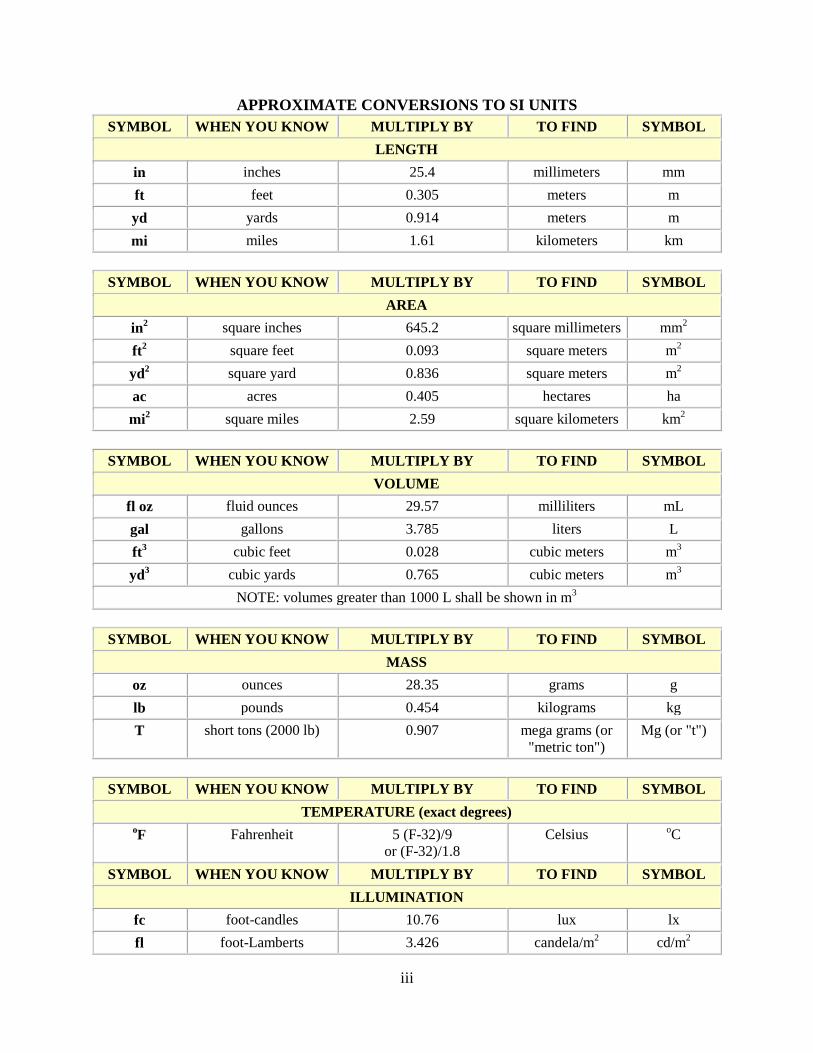
APPROXIMATE CONVERSIONS TO SI UNITS
SYMBOL WHEN YOU KNOW MULTIPLY BY TO FIND SYMBOL
LENGTH
in inches 25.4 millimeters mm
ft feet 0.305 meters m
yd yards 0.914 meters m
mi miles 1.61 kilometers km
SYMBOL WHEN YOU KNOW MULTIPLY BY TO FIND SYMBOL
AREA
in2 square inches 645.2 square millimeters mm
2
ft2 square feet 0.093 square meters m
2
yd2 square yard 0.836 square meters m
2
ac acres 0.405 hectares ha
mi2 square miles 2.59 square kilometers km
2
SYMBOL WHEN YOU KNOW MULTIPLY BY TO FIND SYMBOL
VOLUME
fl oz fluid ounces 29.57 milliliters mL
gal gallons 3.785 liters L
ft3 cubic feet 0.028 cubic meters m
3
yd3 cubic yards 0.765 cubic meters m
3
NOTE: volumes greater than 1000 L shall be shown in m3
SYMBOL WHEN YOU KNOW MULTIPLY BY TO FIND SYMBOL
MASS
oz ounces 28.35 grams g
lb pounds 0.454 kilograms kg
T short tons (2000 lb) 0.907 mega grams (or
"metric ton")
Mg (or "t")
SYMBOL WHEN YOU KNOW MULTIPLY BY TO FIND SYMBOL
TEMPERATURE (exact degrees) oF Fahrenheit 5 (F-32)/9
or (F-32)/1.8
Celsius oC
SYMBOL WHEN YOU KNOW MULTIPLY BY TO FIND SYMBOL
ILLUMINATION
fc foot-candles 10.76 lux lx
fl foot-Lamberts 3.426 candela/m2 cd/m
2
iv
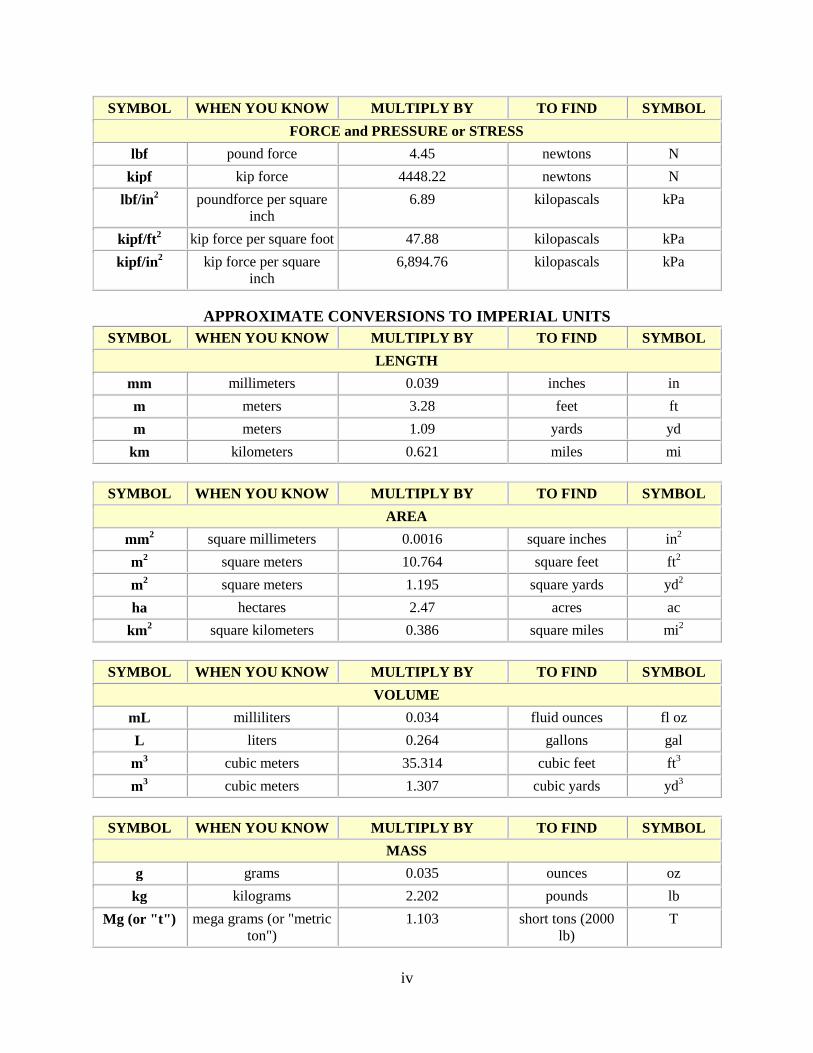
SYMBOL WHEN YOU KNOW MULTIPLY BY TO FIND SYMBOL
FORCE and PRESSURE or STRESS
lbf pound force 4.45 newtons N
kipf kip force 4448.22 newtons N
lbf/in2 poundforce per square
inch
6.89 kilopascals kPa
kipf/ft2 kip force per square foot 47.88 kilopascals kPa
kipf/in2 kip force per square
inch
6,894.76 kilopascals kPa
APPROXIMATE CONVERSIONS TO IMPERIAL UNITS
SYMBOL WHEN YOU KNOW MULTIPLY BY TO FIND SYMBOL
LENGTH
mm millimeters 0.039 inches in
m meters 3.28 feet ft
m meters 1.09 yards yd
km kilometers 0.621 miles mi
SYMBOL WHEN YOU KNOW MULTIPLY BY TO FIND SYMBOL
AREA
mm2 square millimeters 0.0016 square inches in
2
m2 square meters 10.764 square feet ft
2
m2 square meters 1.195 square yards yd
2
ha hectares 2.47 acres ac
km2 square kilometers 0.386 square miles mi
2
SYMBOL WHEN YOU KNOW MULTIPLY BY TO FIND SYMBOL
VOLUME
mL milliliters 0.034 fluid ounces fl oz
L liters 0.264 gallons gal
m3 cubic meters 35.314 cubic feet ft
3
m3 cubic meters 1.307 cubic yards yd
3
SYMBOL WHEN YOU KNOW MULTIPLY BY TO FIND SYMBOL
MASS
g grams 0.035 ounces oz
kg kilograms 2.202 pounds lb
Mg (or "t") mega grams (or "metric
ton")
1.103 short tons (2000
lb)
T
v
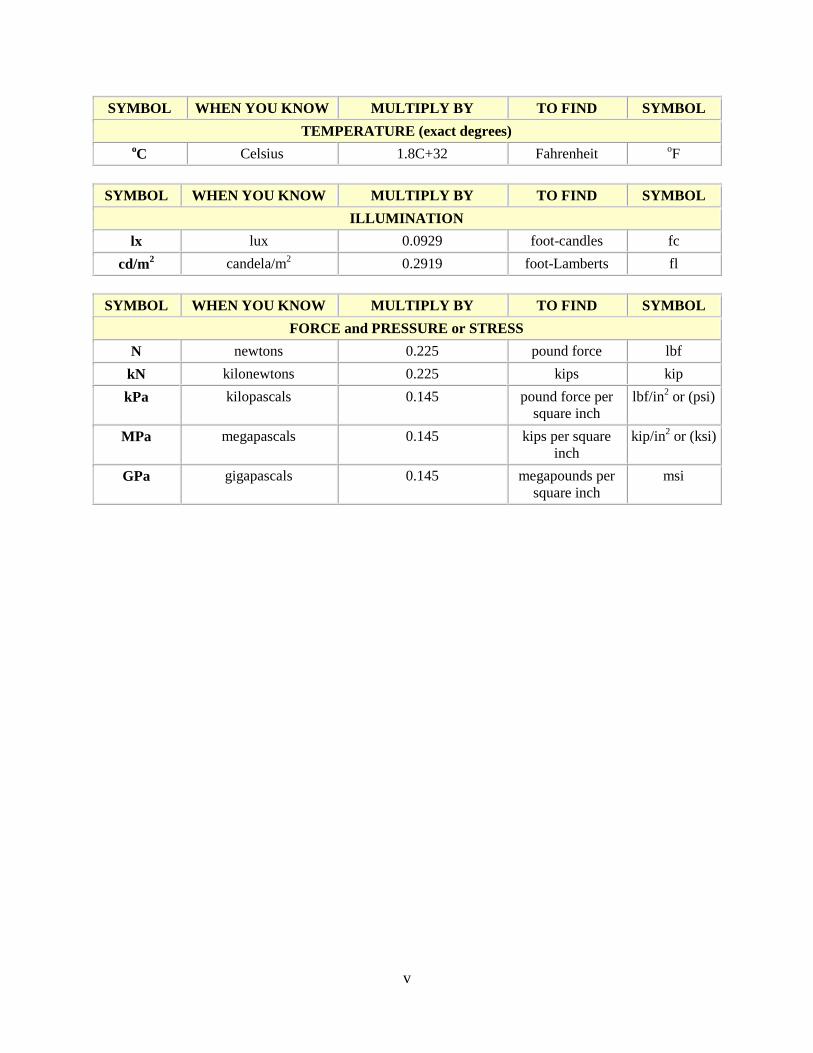
SYMBOL WHEN YOU KNOW MULTIPLY BY TO FIND SYMBOL
TEMPERATURE (exact degrees) oC Celsius 1.8C+32 Fahrenheit
oF
SYMBOL WHEN YOU KNOW MULTIPLY BY TO FIND SYMBOL
ILLUMINATION
lx lux 0.0929 foot-candles fc
cd/m2 candela/m
2 0.2919 foot-Lamberts fl
SYMBOL WHEN YOU KNOW MULTIPLY BY TO FIND SYMBOL
FORCE and PRESSURE or STRESS
N newtons 0.225 pound force lbf
kN kilonewtons 0.225 kips kip
kPa kilopascals 0.145 pound force per
square inch
lbf/in2 or (psi)
MPa megapascals 0.145 kips per square
inch
kip/in2 or (ksi)
GPa gigapascals 0.145 megapounds per
square inch
msi
vi
TECHNICAL REPORT DOCUMENTATION PAGE 1. Report No.
2. Government Accession No.
3. Recipient's Catalog No.
4. Title and Subtitle
Use of Fiber Reinforced Polymer Composite Cable for Post-Tensioning
Application
5. Report Date
August, 2015
6. Performing Organization Code
7. Author(s)
Amir Mirmiran, Xiong Yang, Pedram Zohrevand, Nakin Suksawang, and
Madasamy Arockiasamy
8. Performing Organization Report No.
9. Performing Organization Name and Address
FIU, Department of Civil Engineering, 10555 W. Flagler Street, EC 3600,
Miami, FL 33174
FAU, Department of Civil, Environmental and Geomatics Engineering, 777
Glades Road, Boca Raton, FL 33431
10. Work Unit No. (TRAIS)
11. Contract or Grant No.
BDK80-977-35
BDV29-977-10
BDK80 97
12. Sponsoring Agency Name and Address
Marcus H. Ansley Structures Research Center
The Florida Department of Transportation
2007 E. Paul Dirac Drive
Tallahassee, FL 32310
13. Type of Report and Period Covered
Draft Final
June 2012 – February 2014 (Phase I)
March 2014 – July 2015 (Phase II)
14. Sponsoring Agency Code
15. Supplementary Notes
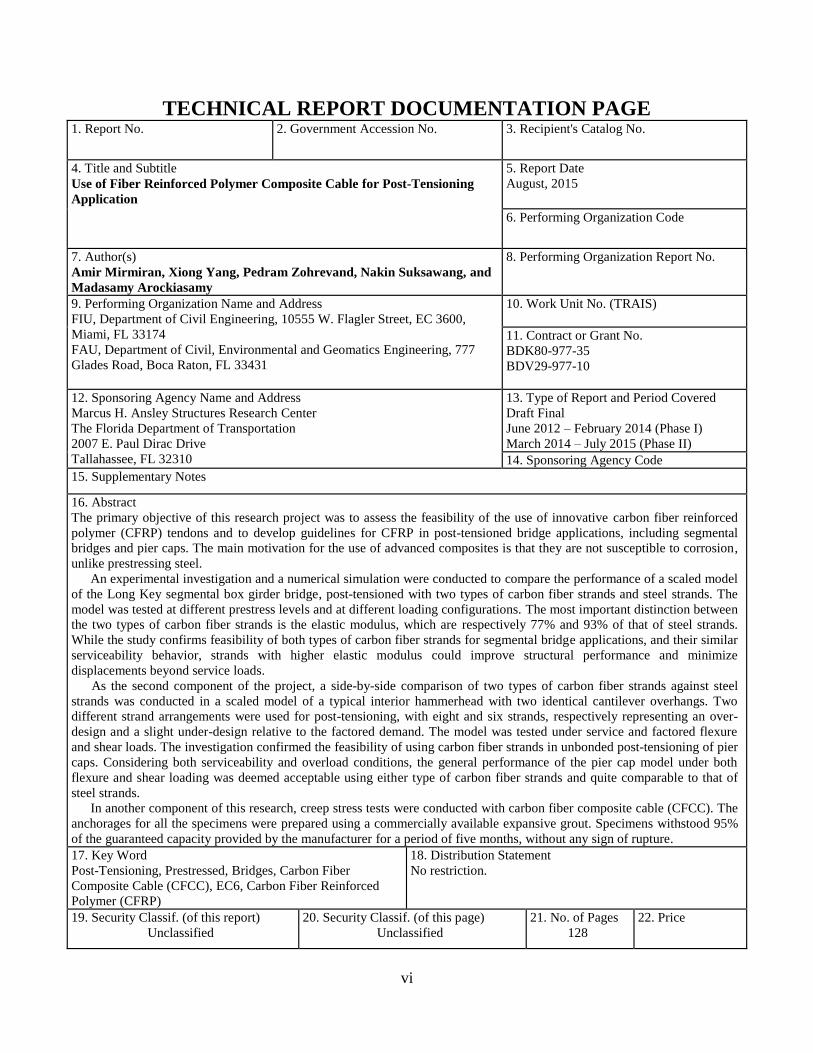
16. Abstract
The primary objective of this research project was to assess the feasibility of the use of innovative carbon fiber reinforced
polymer (CFRP) tendons and to develop guidelines for CFRP in post-tensioned bridge applications, including segmental
bridges and pier caps. The main motivation for the use of advanced composites is that they are not susceptible to corrosion,
unlike prestressing steel.
An experimental investigation and a numerical simulation were conducted to compare the performance of a scaled model
of the Long Key segmental box girder bridge, post-tensioned with two types of carbon fiber strands and steel strands. The
model was tested at different prestress levels and at different loading configurations. The most important distinction between
the two types of carbon fiber strands is the elastic modulus, which are respectively 77% and 93% of that of steel strands.
While the study confirms feasibility of both types of carbon fiber strands for segmental bridge applications, and their similar
serviceability behavior, strands with higher elastic modulus could improve structural performance and minimize
displacements beyond service loads.
As the second component of the project, a side-by-side comparison of two types of carbon fiber strands against steel
strands was conducted in a scaled model of a typical interior hammerhead with two identical cantilever overhangs. Two
different strand arrangements were used for post-tensioning, with eight and six strands, respectively representing an over-
design and a slight under-design relative to the factored demand. The model was tested under service and factored flexure
and shear loads. The investigation confirmed the feasibility of using carbon fiber strands in unbonded post-tensioning of pier
caps. Considering both serviceability and overload conditions, the general performance of the pier cap model under both
flexure and shear loading was deemed acceptable using either type of carbon fiber strands and quite comparable to that of
steel strands.
In another component of this research, creep stress tests were conducted with carbon fiber composite cable (CFCC). The
anchorages for all the specimens were prepared using a commercially available expansive grout. Specimens withstood 95%
of the guaranteed capacity provided by the manufacturer for a period of five months, without any sign of rupture.
17. Key Word
Post-Tensioning, Prestressed, Bridges, Carbon Fiber
Composite Cable (CFCC), EC6, Carbon Fiber Reinforced
Polymer (CFRP)
18. Distribution Statement
No restriction.
19. Security Classif. (of this report)
Unclassified
20. Security Classif. (of this page)
Unclassified
21. No. of Pages
128
22. Price

vii
ACKNOWLEDGEMENTS
The authors would like to thank the Florida Department of Transportation (FDOT) for providing
the funding for this project. Special thanks are also due to the project Manager, Mr. William
Potter, for his continued support and technical contributions to the project.
The authors would also like to acknowledge Titan America for providing the concrete, C&C
Concrete Pumping for providing the concrete pumping, Mo Steel Fabricator & Erector for the
steel frame fabrication, Mr. Emilio R. Vega, the President and CEO of Structural Prestressed
Industries Inc. of Medley, FL, for providing steel strands and steel chucks, and Composite
Rigging Southern Spars of North Kingstown, RI, for providing the EC6 strands.
All experiments were conducted at the Titan America Structures and Construction Testing
Laboratory of the Florida International University in Miami.
viii
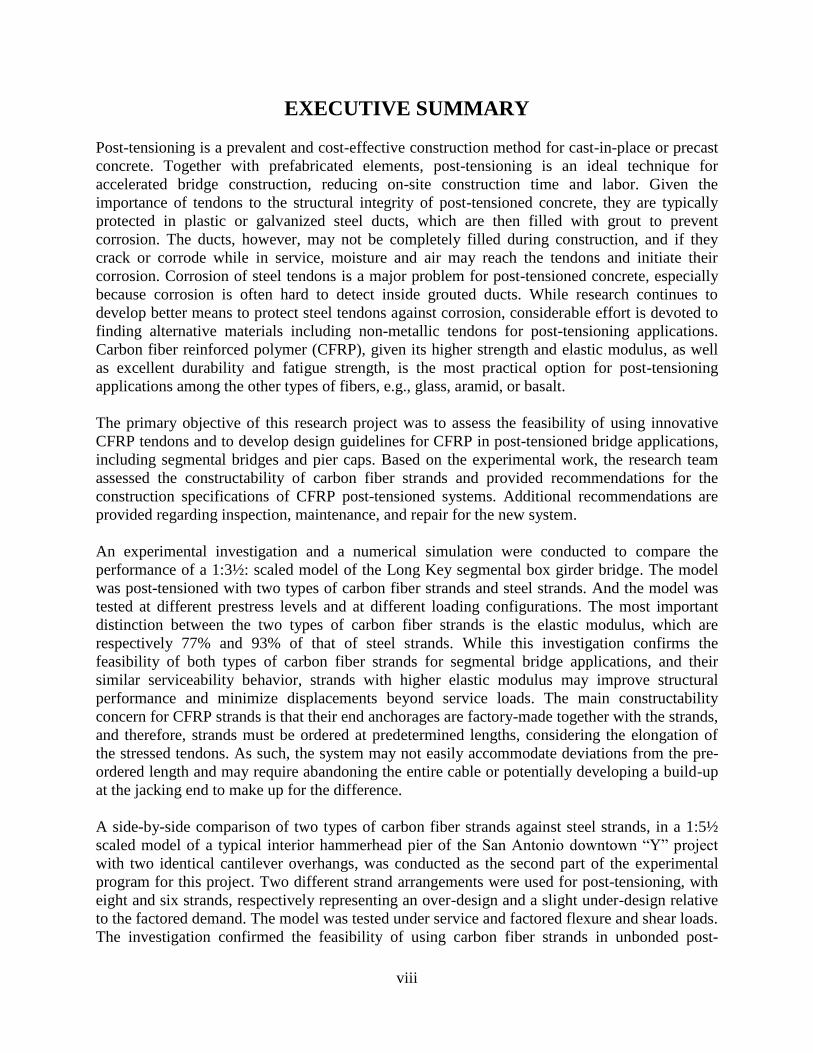
EXECUTIVE SUMMARY
Post-tensioning is a prevalent and cost-effective construction method for cast-in-place or precast
concrete. Together with prefabricated elements, post-tensioning is an ideal technique for
accelerated bridge construction, reducing on-site construction time and labor. Given the
importance of tendons to the structural integrity of post-tensioned concrete, they are typically
protected in plastic or galvanized steel ducts, which are then filled with grout to prevent
corrosion. The ducts, however, may not be completely filled during construction, and if they
crack or corrode while in service, moisture and air may reach the tendons and initiate their
corrosion. Corrosion of steel tendons is a major problem for post-tensioned concrete, especially
because corrosion is often hard to detect inside grouted ducts. While research continues to
develop better means to protect steel tendons against corrosion, considerable effort is devoted to
finding alternative materials including non-metallic tendons for post-tensioning applications.
Carbon fiber reinforced polymer (CFRP), given its higher strength and elastic modulus, as well
as excellent durability and fatigue strength, is the most practical option for post-tensioning
applications among the other types of fibers, e.g., glass, aramid, or basalt.
The primary objective of this research project was to assess the feasibility of using innovative
CFRP tendons and to develop design guidelines for CFRP in post-tensioned bridge applications,
including segmental bridges and pier caps. Based on the experimental work, the research team
assessed the constructability of carbon fiber strands and provided recommendations for the
construction specifications of CFRP post-tensioned systems. Additional recommendations are
provided regarding inspection, maintenance, and repair for the new system.
An experimental investigation and a numerical simulation were conducted to compare the
performance of a 1:3½: scaled model of the Long Key segmental box girder bridge. The model
was post-tensioned with two types of carbon fiber strands and steel strands. And the model was
tested at different prestress levels and at different loading configurations. The most important
distinction between the two types of carbon fiber strands is the elastic modulus, which are
respectively 77% and 93% of that of steel strands. While this investigation confirms the
feasibility of both types of carbon fiber strands for segmental bridge applications, and their
similar serviceability behavior, strands with higher elastic modulus may improve structural
performance and minimize displacements beyond service loads. The main constructability
concern for CFRP strands is that their end anchorages are factory-made together with the strands,
and therefore, strands must be ordered at predetermined lengths, considering the elongation of
the stressed tendons. As such, the system may not easily accommodate deviations from the pre-
ordered length and may require abandoning the entire cable or potentially developing a build-up
at the jacking end to make up for the difference.
A side-by-side comparison of two types of carbon fiber strands against steel strands, in a 1:5½
scaled model of a typical interior hammerhead pier of the San Antonio downtown “Y” project
with two identical cantilever overhangs, was conducted as the second part of the experimental
program for this project. Two different strand arrangements were used for post-tensioning, with
eight and six strands, respectively representing an over-design and a slight under-design relative
to the factored demand. The model was tested under service and factored flexure and shear loads.
The investigation confirmed the feasibility of using carbon fiber strands in unbonded post-

ix
tensioning of pier caps. Considering both serviceability and overload conditions, the general
performance of the pier cap model under both flexure and shear loading was deemed acceptable
using either type of carbon fiber strands and quite comparable to that of steel strands.
In another part of this research, creep stress test was conducted with carbon fiber composite
cable (CFCC). The anchorages for all the specimens were cast by the Research Team using a
commercially available expansive grout. Specimens withstood 95% of the guaranteed capacity
provided by the manufacturer for a period of five months, without any sign of rupture.
x
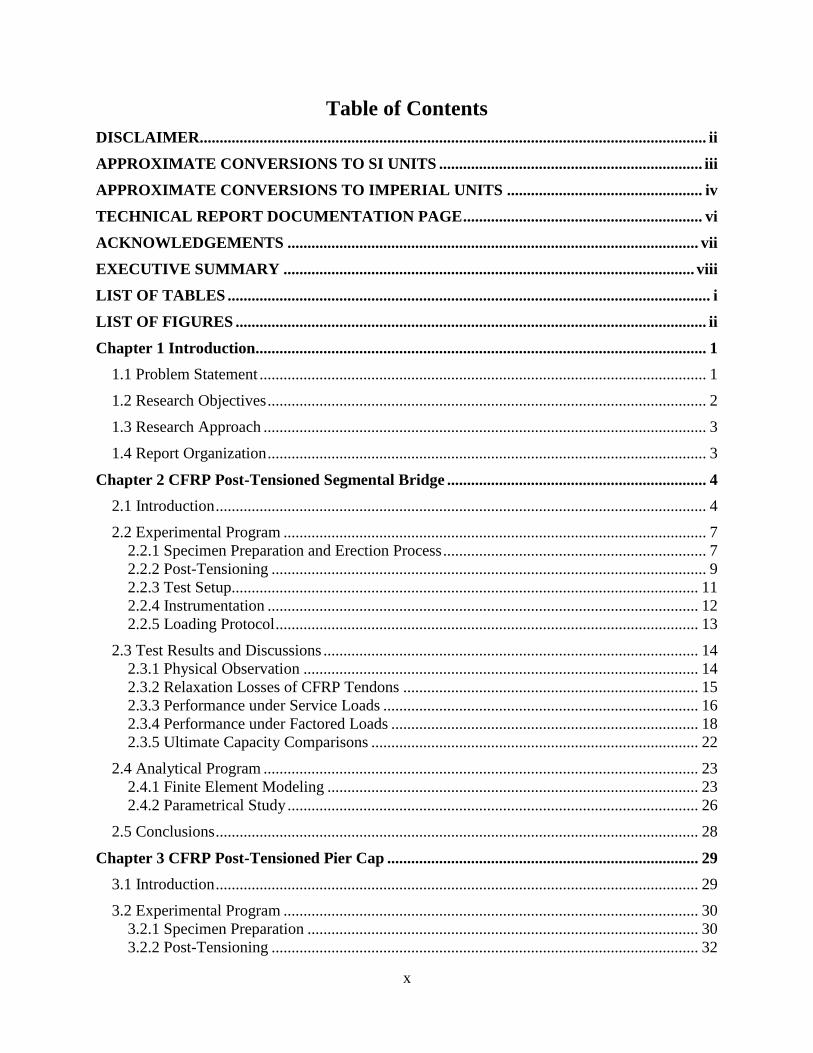
Table of Contents
DISCLAIMER............................................................................................................................... ii
APPROXIMATE CONVERSIONS TO SI UNITS .................................................................. iii
APPROXIMATE CONVERSIONS TO IMPERIAL UNITS ................................................. iv
TECHNICAL REPORT DOCUMENTATION PAGE ............................................................ vi
ACKNOWLEDGEMENTS ....................................................................................................... vii
EXECUTIVE SUMMARY ....................................................................................................... viii
LIST OF TABLES ......................................................................................................................... i
LIST OF FIGURES ...................................................................................................................... ii
Chapter 1 Introduction................................................................................................................. 1
1.1 Problem Statement ................................................................................................................ 1
1.2 Research Objectives .............................................................................................................. 2
1.3 Research Approach ............................................................................................................... 3
1.4 Report Organization .............................................................................................................. 3
Chapter 2 CFRP Post-Tensioned Segmental Bridge ................................................................. 4
2.1 Introduction ........................................................................................................................... 4
2.2 Experimental Program .......................................................................................................... 7
2.2.1 Specimen Preparation and Erection Process .................................................................. 7 2.2.2 Post-Tensioning ............................................................................................................. 9
2.2.3 Test Setup..................................................................................................................... 11 2.2.4 Instrumentation ............................................................................................................ 12
2.2.5 Loading Protocol .......................................................................................................... 13
2.3 Test Results and Discussions .............................................................................................. 14 2.3.1 Physical Observation ................................................................................................... 14
2.3.2 Relaxation Losses of CFRP Tendons .......................................................................... 15 2.3.3 Performance under Service Loads ............................................................................... 16 2.3.4 Performance under Factored Loads ............................................................................. 18
2.3.5 Ultimate Capacity Comparisons .................................................................................. 22
2.4 Analytical Program ............................................................................................................. 23 2.4.1 Finite Element Modeling ............................................................................................. 23
2.4.2 Parametrical Study ....................................................................................................... 26
2.5 Conclusions ......................................................................................................................... 28
Chapter 3 CFRP Post-Tensioned Pier Cap .............................................................................. 29
3.1 Introduction ......................................................................................................................... 29
3.2 Experimental Program ........................................................................................................ 30 3.2.1 Specimen Preparation .................................................................................................. 30 3.2.2 Post-Tensioning ........................................................................................................... 32
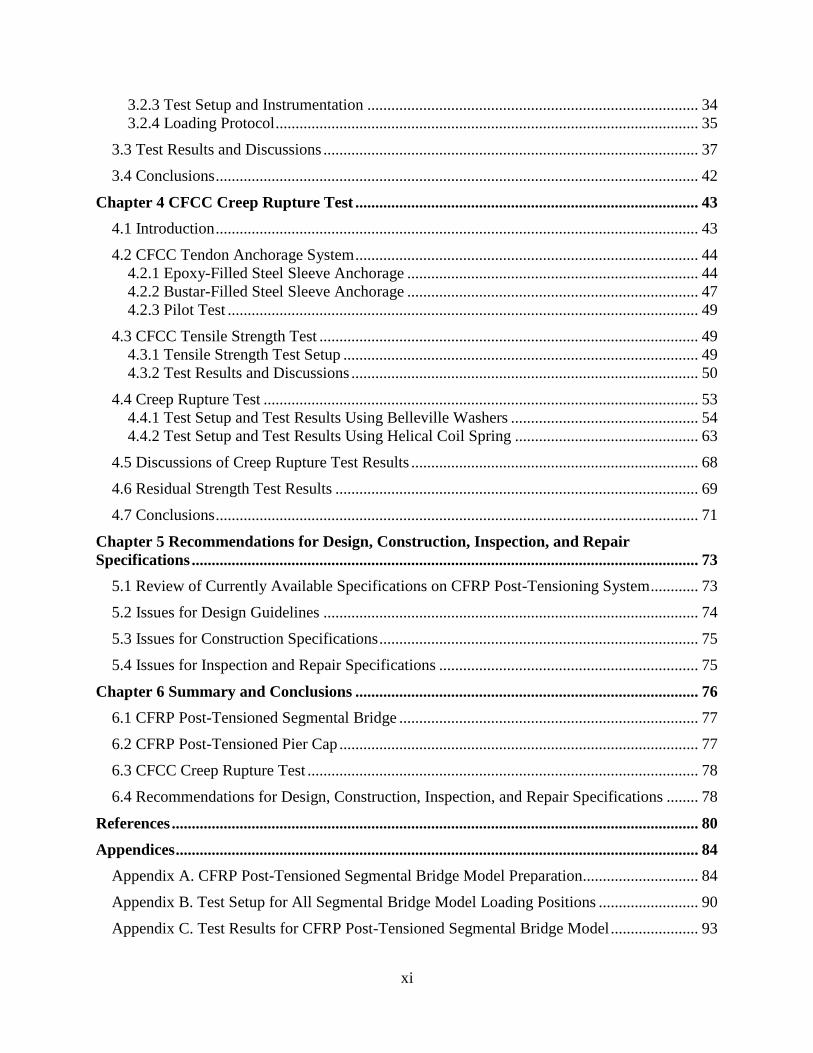
xi
3.2.3 Test Setup and Instrumentation ................................................................................... 34
3.2.4 Loading Protocol .......................................................................................................... 35
3.3 Test Results and Discussions .............................................................................................. 37
3.4 Conclusions ......................................................................................................................... 42
Chapter 4 CFCC Creep Rupture Test ...................................................................................... 43
4.1 Introduction ......................................................................................................................... 43
4.2 CFCC Tendon Anchorage System ...................................................................................... 44 4.2.1 Epoxy-Filled Steel Sleeve Anchorage ......................................................................... 44 4.2.2 Bustar-Filled Steel Sleeve Anchorage ......................................................................... 47
4.2.3 Pilot Test ...................................................................................................................... 49
4.3 CFCC Tensile Strength Test ............................................................................................... 49
4.3.1 Tensile Strength Test Setup ......................................................................................... 49 4.3.2 Test Results and Discussions ....................................................................................... 50
4.4 Creep Rupture Test ............................................................................................................. 53 4.4.1 Test Setup and Test Results Using Belleville Washers ............................................... 54
4.4.2 Test Setup and Test Results Using Helical Coil Spring .............................................. 63
4.5 Discussions of Creep Rupture Test Results ........................................................................ 68
4.6 Residual Strength Test Results ........................................................................................... 69
4.7 Conclusions ......................................................................................................................... 71
Chapter 5 Recommendations for Design, Construction, Inspection, and Repair
Specifications ............................................................................................................................... 73
5.1 Review of Currently Available Specifications on CFRP Post-Tensioning System ............ 73
5.2 Issues for Design Guidelines .............................................................................................. 74
5.3 Issues for Construction Specifications ................................................................................ 75
5.4 Issues for Inspection and Repair Specifications ................................................................. 75
Chapter 6 Summary and Conclusions ...................................................................................... 76
6.1 CFRP Post-Tensioned Segmental Bridge ........................................................................... 77
6.2 CFRP Post-Tensioned Pier Cap .......................................................................................... 77
6.3 CFCC Creep Rupture Test .................................................................................................. 78
6.4 Recommendations for Design, Construction, Inspection, and Repair Specifications ........ 78
References .................................................................................................................................... 80
Appendices ................................................................................................................................... 84
Appendix A. CFRP Post-Tensioned Segmental Bridge Model Preparation............................. 84
Appendix B. Test Setup for All Segmental Bridge Model Loading Positions ......................... 90
Appendix C. Test Results for CFRP Post-Tensioned Segmental Bridge Model ...................... 93

xii
Appendix D. CFRP Post-Tensioned Pier Cap Model Preparation ......................................... 103
Appendix E. Technical Data for the Coil Spring .................................................................... 109
Appendix F. Detailed Dimensions of Creep Rupture Test Frame .......................................... 111
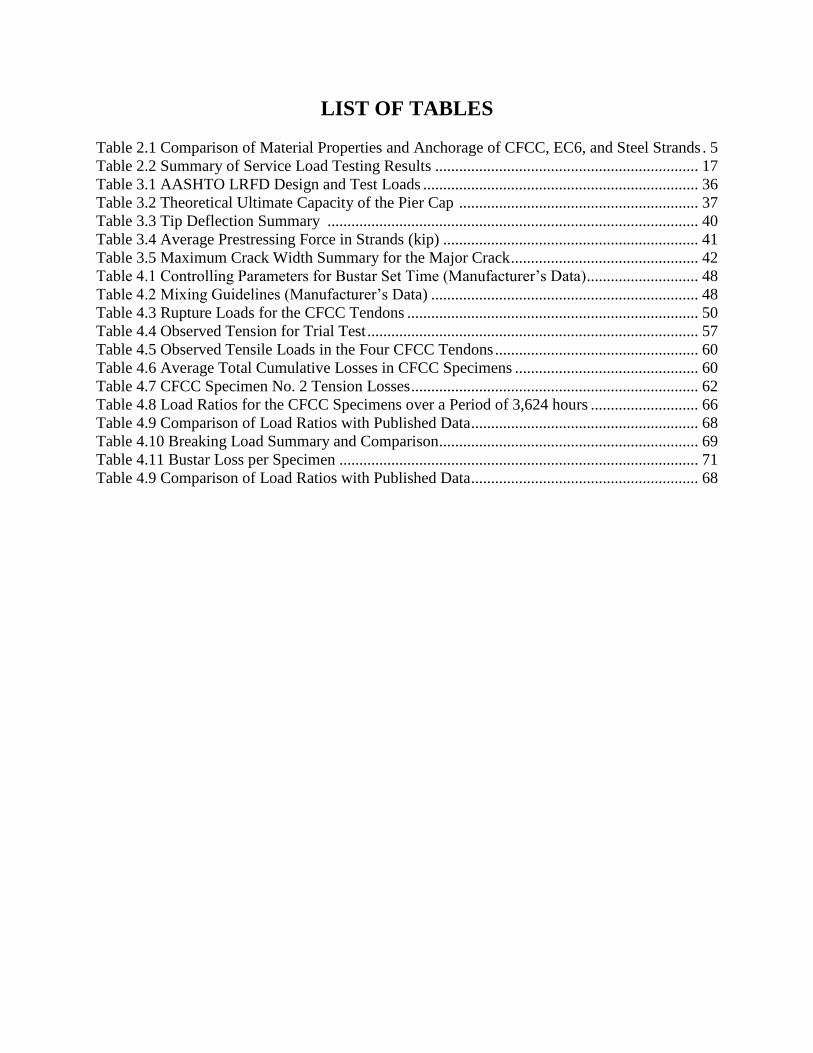
LIST OF TABLES
Table 2.1 Comparison of Material Properties and Anchorage of CFCC, EC6, and Steel Strands . 5
Table 2.2 Summary of Service Load Testing Results .................................................................. 17
Table 3.1 AASHTO LRFD Design and Test Loads ..................................................................... 36
Table 3.2 Theoretical Ultimate Capacity of the Pier Cap ............................................................ 37
Table 3.3 Tip Deflection Summary ............................................................................................. 40
Table 3.4 Average Prestressing Force in Strands (kip) ................................................................ 41
Table 3.5 Maximum Crack Width Summary for the Major Crack ............................................... 42
Table 4.1 Controlling Parameters for Bustar Set Time (Manufacturer’s Data) ............................ 48
Table 4.2 Mixing Guidelines (Manufacturer’s Data) ................................................................... 48
Table 4.3 Rupture Loads for the CFCC Tendons ......................................................................... 50
Table 4.4 Observed Tension for Trial Test ................................................................................... 57
Table 4.5 Observed Tensile Loads in the Four CFCC Tendons ................................................... 60
Table 4.6 Average Total Cumulative Losses in CFCC Specimens .............................................. 60
Table 4.7 CFCC Specimen No. 2 Tension Losses ........................................................................ 62
Table 4.8 Load Ratios for the CFCC Specimens over a Period of 3,624 hours ........................... 66
Table 4.9 Comparison of Load Ratios with Published Data ......................................................... 68
Table 4.10 Breaking Load Summary and Comparison ................................................................. 69
Table 4.11 Bustar Loss per Specimen .......................................................................................... 71
Table 4.9 Comparison of Load Ratios with Published Data ......................................................... 68
ii
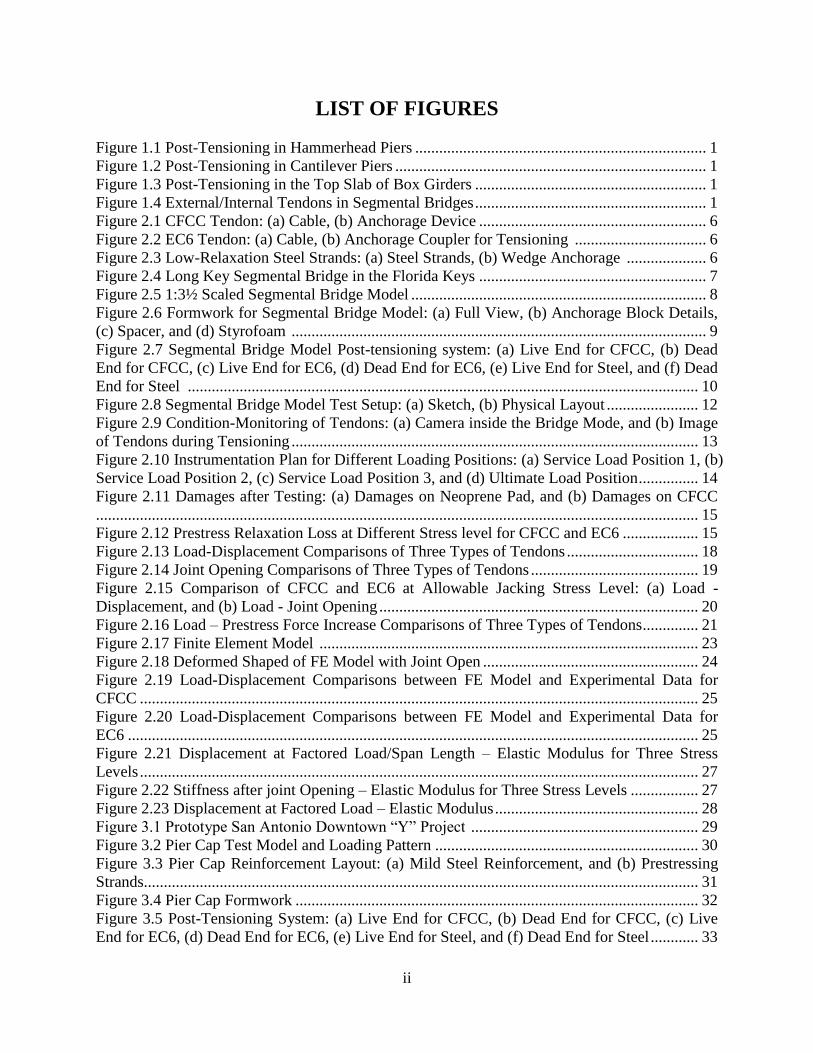
LIST OF FIGURES
Figure 1.1 Post-Tensioning in Hammerhead Piers ......................................................................... 1
Figure 1.2 Post-Tensioning in Cantilever Piers .............................................................................. 1
Figure 1.3 Post-Tensioning in the Top Slab of Box Girders .......................................................... 1
Figure 1.4 External/Internal Tendons in Segmental Bridges .......................................................... 1
Figure 2.1 CFCC Tendon: (a) Cable, (b) Anchorage Device ......................................................... 6
Figure 2.2 EC6 Tendon: (a) Cable, (b) Anchorage Coupler for Tensioning ................................. 6
Figure 2.3 Low-Relaxation Steel Strands: (a) Steel Strands, (b) Wedge Anchorage .................... 6
Figure 2.4 Long Key Segmental Bridge in the Florida Keys ......................................................... 7
Figure 2.5 1:3½ Scaled Segmental Bridge Model .......................................................................... 8
Figure 2.6 Formwork for Segmental Bridge Model: (a) Full View, (b) Anchorage Block Details,
(c) Spacer, and (d) Styrofoam ........................................................................................................ 9
Figure 2.7 Segmental Bridge Model Post-tensioning system: (a) Live End for CFCC, (b) Dead
End for CFCC, (c) Live End for EC6, (d) Dead End for EC6, (e) Live End for Steel, and (f) Dead
End for Steel ................................................................................................................................ 10
Figure 2.8 Segmental Bridge Model Test Setup: (a) Sketch, (b) Physical Layout ....................... 12
Figure 2.9 Condition-Monitoring of Tendons: (a) Camera inside the Bridge Mode, and (b) Image
of Tendons during Tensioning ...................................................................................................... 13
Figure 2.10 Instrumentation Plan for Different Loading Positions: (a) Service Load Position 1, (b)
Service Load Position 2, (c) Service Load Position 3, and (d) Ultimate Load Position ............... 14
Figure 2.11 Damages after Testing: (a) Damages on Neoprene Pad, and (b) Damages on CFCC
....................................................................................................................................................... 15
Figure 2.12 Prestress Relaxation Loss at Different Stress level for CFCC and EC6 ................... 15
Figure 2.13 Load-Displacement Comparisons of Three Types of Tendons ................................. 18
Figure 2.14 Joint Opening Comparisons of Three Types of Tendons .......................................... 19
Figure 2.15 Comparison of CFCC and EC6 at Allowable Jacking Stress Level: (a) Load -
Displacement, and (b) Load - Joint Opening ................................................................................ 20
Figure 2.16 Load – Prestress Force Increase Comparisons of Three Types of Tendons.............. 21
Figure 2.17 Finite Element Model ............................................................................................... 23
Figure 2.18 Deformed Shaped of FE Model with Joint Open ...................................................... 24
Figure 2.19 Load-Displacement Comparisons between FE Model and Experimental Data for
CFCC ............................................................................................................................................ 25
Figure 2.20 Load-Displacement Comparisons between FE Model and Experimental Data for
EC6 ............................................................................................................................................... 25
Figure 2.21 Displacement at Factored Load/Span Length – Elastic Modulus for Three Stress
Levels ............................................................................................................................................ 27
Figure 2.22 Stiffness after joint Opening – Elastic Modulus for Three Stress Levels ................. 27
Figure 2.23 Displacement at Factored Load – Elastic Modulus ................................................... 28
Figure 3.1 Prototype San Antonio Downtown “Y” Project ......................................................... 29
Figure 3.2 Pier Cap Test Model and Loading Pattern .................................................................. 30
Figure 3.3 Pier Cap Reinforcement Layout: (a) Mild Steel Reinforcement, and (b) Prestressing
Strands........................................................................................................................................... 31
Figure 3.4 Pier Cap Formwork ..................................................................................................... 32
Figure 3.5 Post-Tensioning System: (a) Live End for CFCC, (b) Dead End for CFCC, (c) Live
End for EC6, (d) Dead End for EC6, (e) Live End for Steel, and (f) Dead End for Steel ............ 33
iii
Figure 3.6 Test Setup and Instrumentation: (a) Sketch, and (b) Physical Layout ........................ 35
Figure 3.7 Moment-Tip Deflection Comparisons of Pier Cap Model with (a) CFCC, (b) EC6, and
(c) Steel strands ............................................................................................................................ 38
Figure 3.8 Moment-Tip Deflection Comparisons of Pier Cap Model with (a) Eight-Strand, and (b)
Six-Strand Arrangement ............................................................................................................... 39
Figure 3.9 Pier Cap Model Crack Pattern: (a) North Side, and (b) South Side ............................ 41
Figure 4.1 Creep Rupture Tests of FRP Rods (Yamaguchi et al. 1997) ....................................... 43
Figure 4.2 Creep Rupture Tests of CFRP Tendons (Ando et al. 1997) ........................................ 44
Figure 4.3 Anchorage Sleeve Details with Epoxy: (a) Steel Sleeve Dimensions, (b) Top and
Bottom Caps, and (c) Steel Sleeve Fabrication ............................................................................ 45
Figure 4.4 Wooden Frame for Casting and Curing of Grout within Steel Sleeve ........................ 46
Figure 4.5 Epoxy Filler in Curing Process.................................................................................... 46
Figure 4.6 Anchorage Sleeve Design for Details with Bustar Expansive Cement Grout ............. 47
Figure 4.7 Bottom Caps Details ................................................................................................... 48
Figure 4.8 Expansive Pressure vs. Time Elapsed (Courtesy of DTI) .......................................... 49
Figure 4.9 15 in. Sleeve Experimental Setup ................................................................................ 51
Figure 4.10 20 in. Sleeve Experimental Setup .............................................................................. 52
Figure 4.11 Physical Experimental Test Setup ............................................................................. 53
Figure 4.12 Fragments of the Ruptures CFCC Tendons after Failure .......................................... 53
Figure 4.13 CFCC Ratio of Relaxation vs. Time Plot (Tokyo Rope)........................................... 54
Figure 4.14 CFCC Creep Elongation vs. Time Plot (Tokyo Rope) .............................................. 54
Figure 4.15 Creep Rupture Testing Frame Design Details ........................................................... 55
Figure 4.16 Protective Screen in Testing Frame ........................................................................... 55
Figure 4.17 Outer Ends of Specimen Installed in Testing Frame ................................................. 56
Figure 4.18 Belleville Washer Deflection Test Plot ..................................................................... 56
Figure 4.19 Two CFCC Tendons Positioned in the Test Frame for Application of Tension ....... 57
Figure 4.20 Observation of Bustar accumulation on Top of Bottom Sleeve after Tensile
Loading ......................................................................................................................................... 58
Figure 4.21 Four Specimen Loaded onto the Frame ..................................................................... 59
Figure 4.22 Belleville Washers Installed in Testing Frame .......................................................... 59
Figure 4.23 CFCC Tendon Tension Loss at 0.70 Pu vs. Period of Observation ........................... 61
Figure 4.24 CFCC Tendon Tension Loss at 0.95Pu vs. Time ....................................................... 61
Figure 4.25 CFCC Tendon Slippage ............................................................................................. 62
Figure 4.26 Specimen No. 2 Losses for 0.70 Pu and 0.95Pu Tests................................................ 63
Figure 4.27 Test Frame: Modification to accommodate Coil Spring ........................................... 64
Figure 4.28 Symmetric Loading Sequence (Column Not Shown for Clarity. Not to Scale) ........ 65
Figure 4.29 Sequential Loading Sequence (Column Not Shown for Clarity. Not to Scale) ........ 65
Figure 4.30 Testing Frame Modification to Accommodate Coil Springs .................................... 66
Figure 4.31 Loaded Creep Rupture Testing Frame ...................................................................... 66
Figure 4.32 Load Ratio vs. Time (hour) ....................................................................................... 67
Figure 4.33 Load Ratio vs. Log Time (hour) ................................................................................ 67
Figure 4.34 Breaking Load Ratios ................................................................................................ 69
Figure 4.35 CFCC Specimens after Residual Strength Test (interior Ends) ................................ 70
Figure 4.36 Bustar Lost at the Interior Ends ................................................................................. 70
Figure A1. Formwork Framing ..................................................................................................... 85
Figure A2. Formwork Base........................................................................................................... 85
iv
Figure A3. Formwork for End Blocks .......................................................................................... 86
Figure A4. Casting ........................................................................................................................ 86
Figure A5. Specimen after Casting ............................................................................................... 87
Figure A6. Specimen Demolding ................................................................................................. 87
Figure A7. Specimen Erection (1) ................................................................................................ 88
Figure A8. Specimen Erection (2) ................................................................................................ 88
Figure A9. Post-Tensioning Cables through the Segments .......................................................... 89
Figure A10. Protecting the Post-Tensioning Cables at Deviator Block ....................................... 89
Figure B1. Test Setup for Service Load Position 1 and Ultimate Load Test ................................ 91
Figure B2. Test Setup for Service Load Position 2 ...................................................................... 91
Figure B3. Test Setup for Service Load Position 3 ...................................................................... 92
Figure C1. CFCC Load - Displacement for Service Load Position1 and Ultimate Load Test ..... 94
Figure C2. CFCC Load - Joint Opening for Service Load Position1 and Ultimate Load Test .... 94
Figure C3. CFCC Load - Displacement Opening for Service Load Position 2 ............................ 95
Figure C4. CFCC Load - Joint Opening for Service Load Position 2 .......................................... 95
Figure C5. CFCC Load - Displacement Opening for Service Load Position 3 ............................ 96
Figure C6. CFCC Load - Joint Opening for Service Load Position 3 .......................................... 96
Figure C7. EC6 Load - Displacement for Service Load Position1 and Ultimate Load Test ........ 97
Figure C8. EC6 Load – Joint Opening for Service Load Position1 and Ultimate Load Test ....... 97
Figure C9. EC6 Load - Displacement for Service Load Position 2 .............................................. 98
Figure C10. EC6 Load – Joint Opening for Service Load Position 2........................................... 98
Figure C11. EC6 Load - Displacement for Service Load Position 3 ............................................ 99
Figure C12. EC6 Load – Joint Opening for Service Load Position 3........................................... 99
Figure C13. Steel Load - Displacement for Service Load Position1 and Ultimate Load Test ... 100
Figure C14. Steel Load – Joint Opening for Service Load Position1 and Ultimate Load Test .. 100
Figure C15. Steel Load - Displacement for Service Load Position 2 ......................................... 101
Figure C16. Steel Load – Joint Opening for Service Load Position 2 ........................................ 101
Figure C17. Steel Load - Displacement for Service Load Position 3 ......................................... 102
Figure C18. Steel Load – Joint Opening for Service Load Position 3 ........................................ 102
Figure D1. Formwork ................................................................................................................. 104
Figure D2. Ducts for Post-tensioning ......................................................................................... 104
Figure D3. Reinforcement Cage ................................................................................................. 105
Figure D4. PVC Tube Connection for Post-Tensioning Ducts................................................... 105
Figure D5. Anchorage Detail (1) ................................................................................................ 106
Figure D6. Anchorage Detail (2) ................................................................................................ 106
Figure D7. Casting ...................................................................................................................... 107
Figure D8. Specimen after Casting ............................................................................................. 107
Figure D9. Specimen after Demolding ....................................................................................... 108
Figure D10. Anchorage Zone Recasting Using Sikadur 32 Hi-Mod Epoxy .............................. 108
1
Chapter 1 Introduction 1.1 Problem Statement
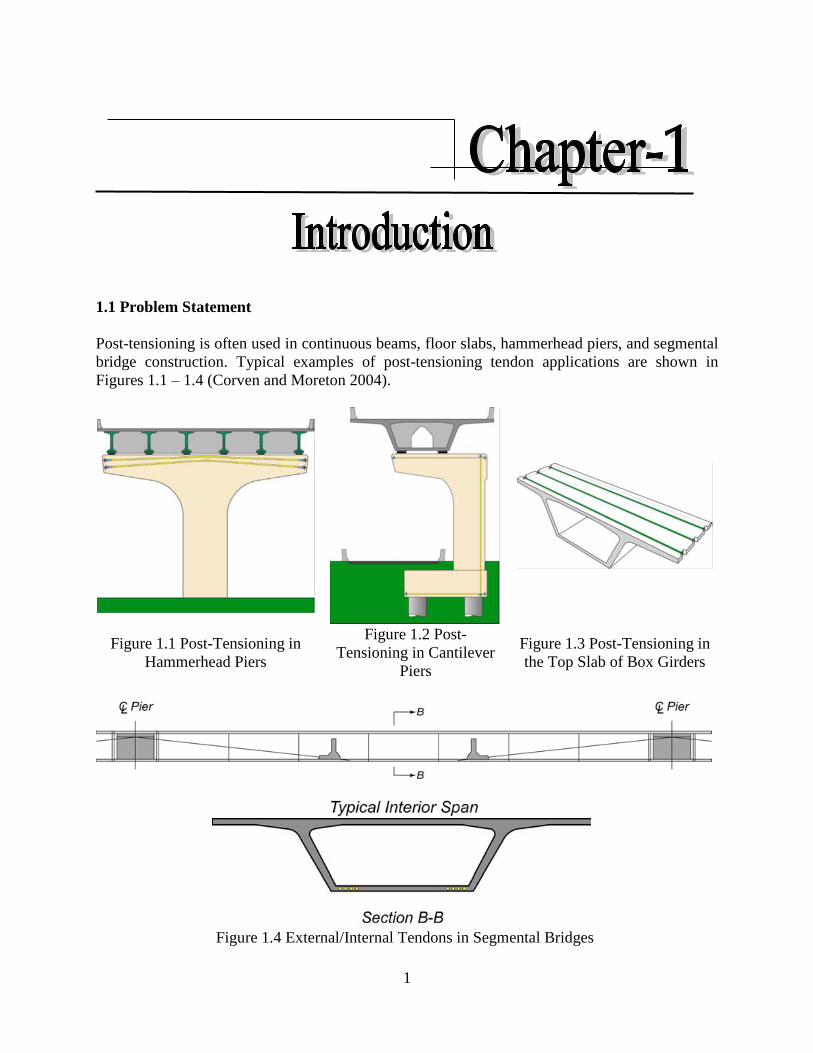
Post-tensioning is often used in continuous beams, floor slabs, hammerhead piers, and segmental
bridge construction. Typical examples of post-tensioning tendon applications are shown in
Figures 1.1 – 1.4 (Corven and Moreton 2004).
Figure 1.1 Post-Tensioning in
Hammerhead Piers
Figure 1.2 Post-
Tensioning in Cantilever
Piers
Figure 1.3 Post-Tensioning in
the Top Slab of Box Girders
Figure 1.4 External/Internal Tendons in Segmental Bridges
2
Post-tensioning has also been used as a strengthening method in bridge structures. The
advantages of post-tensioning are multiplied when combined with prefabrication so as to reduce
on-site construction time. The nature of these applications makes it critically important that the
condition of the tendons be maintained to ensure structural integrity. Typically, to ensure that
tendons remain in good condition and are free from deterioration due to corrosion, they are
placed in ducts made of plastic or galvanized steel. Subsequent to the installation of components
and tensioning of tendons, these ducts are filled with a cementitious grout. In recent years there
has been a rise in durability issues related to post-tensioning tendons as a results of poor grouting
practices or grout inconsistencies.
Corrosion of steel tendons is a major problem for post-tensioned concrete, especially because
corrosion is often hard to detect inside grouted ducts. While research continues to develop better
means to protect steel tendons against corrosion, considerable effort is devoted to finding
suitable non-metallic tendons for post-tensioning applications. Fiber-reinforced polymer (FRP)
composite offers a viable alternative to steel tendons. In addition to their superior durability, FRP
tendons may result in lower relaxation losses as compared with steel (Dolan et al. 2001). FRP
tendons may be made with different types of fibers, for example, carbon, glass, aramid, or basalt.
Due to their higher strength, elastic modulus, and excellent durability, carbon FRP (CFRP)
tendons are the most practical option.
To date, several studies have been carried out on the application of CFRP prestressing in bridge
structures. Of all studies on CFRP prestressed concrete structures, only a few have considered
CFRP for post-tensioning. An unbonded CFRP post-tensioned system has great potential for use
in segmental bridges, bridge girders, decks, and pier caps. However, there are still many gaps in
our knowledge of CFRP post-tensioned systems. For example, to date, a structure in which post-
tensioned CFRP tendons are the only prestressing system has not been investigated.
1.2 Research Objectives
The primary objective of this research project was to investigate the feasibility of the novel
unbonded CFRP post-tensioning system and to provide the following guidelines for using CFRP
tendons as a viable alternative to steel strands in post-tensioned bridges in Florida:
1- Design Guidelines: Establish design guides for CFRP post-tensioned systems
considering material properties, post-tensioning devices, and structural behavior based on
the experimental program and analytical simulation.
2- Construction Specifications: Assess the constructability of CFRP post-tensioned
systems based on the experimental program to lead to construction specifications for
CFRP post-tensioned systems.
3- Inspection Method: Evaluate the methods of inspection of CFRP post-tensioned systems,
based on the experimental program.

3
4- Maintenance and Repair Standards: Develop methodologies and guides for
maintenance and repair of tendons in CFRP post-tensioned systems, based on the
experimental program.
1.3 Research Approach
To achieve the above objectives, the following experimental work and analytical simulation has
been conducted in this study:
1- Scaled CFRP post-tensioned segmental box-girder bridge model
2- Finite element analysis of segmental bridges post-tensioned with CFRP tendons
3- Scaled CFRP post-tensioned pier cap model
4- CFCC post-tensioning anchorage and creep rupture test
1.4 Report Organization
This report is comprised of six chapters. This first chapter serves as an introduction, mainly
describing the problem statement, research objectives, and research approach. Chapter 2 covers
the experimental and analytical work related to CFRP post-tensioned segmental box girder
bridge model. Chapter 3 focuses on the experimental program of the CFRP post-tensioned pier
cap model. Chapter 4 describes the creep rupture test of Carbon Fiber Composite Cable (CFCC).
The guidelines and specifications for the un-bonded CFRP post-tensioned system are provided in
Chapter 5, followed by summary and conclusions for the project, as well as recommendations for
future research in Chapter 6. Additional information is provided in the appendices.
4
Chapter 2 CFRP Post-Tensioned Segmental Bridge 2.1 Introduction
Segmental bridges have grown in popularity in the last few decades, primarily due to their
accelerated construction, better means of quality control, lower maintenance of traffic,
construction cost and environmental impact, especially in areas with limited access or with
environmental concerns. Segmental bridges typically include repetitive concrete box sections
that are progressively connected together to form a completed structure in a span-by-span,
balanced cantilever or unidirectional cantilever erection process.
Even though segmental bridge construction is popular in practice, only a few experiments have
been carried out on these types of bridges, and none with CFRP tendons. A comprehensive study
(MacGregor et al. 1989) investigated the behavior of a three-span external post-tensioned
concrete box-girder bridge model with different types of joint connections including dry joint
and epoxy joint. The bridge model was tested under service loads, factored loads, and ultimate
loads for different loading configurations, all of which could result in maximum flexure and
maximum shear. Test results demonstrated that epoxy joints could help prevent joint opening and
limit bridge deflections. Arockiasamy et al. (2008) investigated the performance of a scaled
single cell precast post-tensioned segmental box-girder bridge model with dry joints subjected to
cyclic loading and temperature changes. Joint opening and cracking were found negligible up to
two million load cycles. The study concluded that temperatures did not seem to make much
difference across the section either.
Structural integrity and long-term durability of segmental bridges depend heavily on corrosion
protection of post-tensioning strands, which has been a major concern and the subject of
numerous research investigations.
A parallel effort has in recent years focused on potential use of Fiber Reinforced Polymer (FRP)
strands as a non-corrosive alternative to steel. FRP may be made with different types of fibers,
e.g., carbon, glass, aramid, or basalt (ACI Committee 440, 2004); of which carbon offers the
most practical option, given its higher strength and elastic modulus as well as excellent durability
and fatigue strength. Carbon fibers may be PAN-based, made of poly–acrylonitrile materials; or
pitch–based, a by–product of petroleum refining or coal coking. Carbon FRP strands are
available commercially as Carbon Fiber Composite Cables (CFCC) made by Tokyo Rope and
CFRP Leadline made by Mitsubishi Kaesei Corp., both of Japan, Jitec by Cousin freres of France,
5
Bri-Ten by British Ropes of the UK, and more recently, EC6 by Composite Rigging Southern
Spars of North Kingstown, RI.
For this experimental study, CFCC and EC6, both which can be coiled in large diameters for
shipping, were chosen to compare with low-relaxation steel strands used in the post-tensioned
segmental bridge model.
CFCC is made using PAN–based carbon fibers supplied by Toray, through a roving prepreg
process for individual wires that are then twisted and wrapped with a synthetic protective yarn,
before bundling them into one (i.e., a single rod), seven, 19, or 37 twisted wires; in diameters
from 0.2 to 1.6 in. Recently, Roddenberry et al. (2014) investigated the bonded pre-tensioned
application of CFCC in prestressed concrete piles in Florida. Other studies have assessed the
structural behavior of concrete beams post-tensioned with un-bonded CFCC strands (Grace et al.,
2003, 2008, and 2011), or effectively demonstrated their field applications (Grace et al., 2002
and 2014; Rohleder et al., 2008).
EC6 cable has been used in rigging systems of yachts, and is now made available for bridge
construction. It is fabricated from a bundle of small diameter pultruded rods made from Toray’s
T800 intermediate modulus fibers. EC6 is available in diameters ranging from 0.2 to 3.2 in.
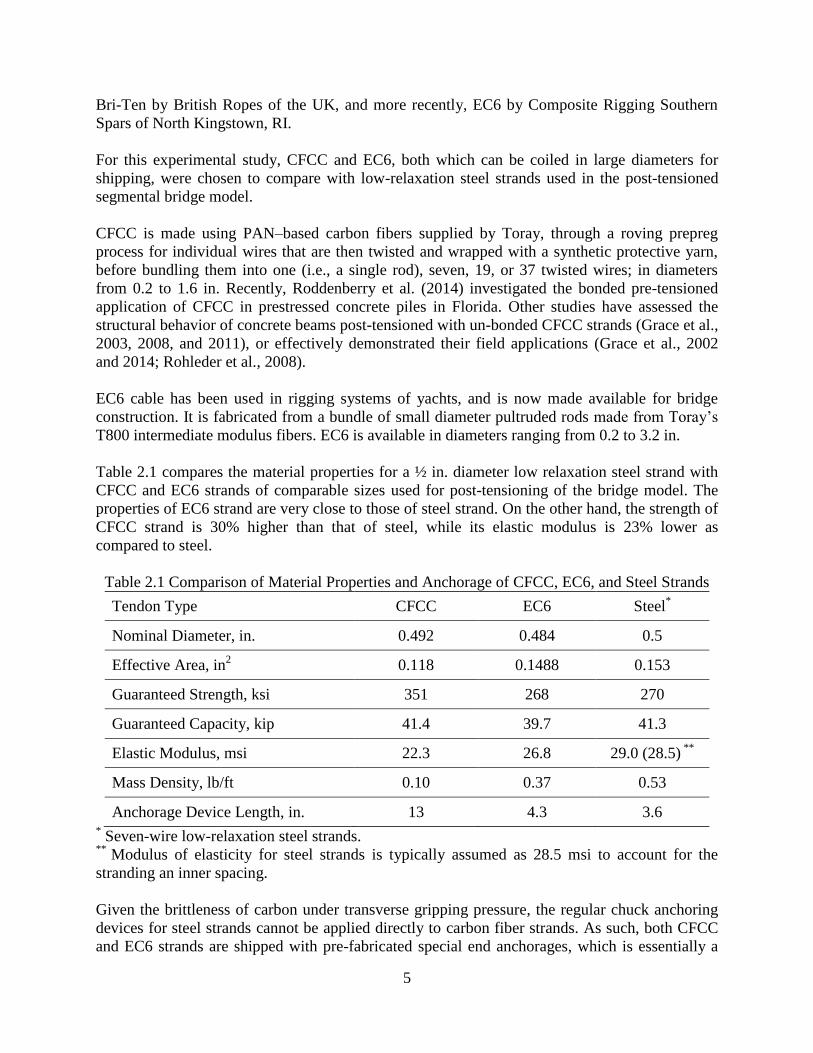
Table 2.1 compares the material properties for a ½ in. diameter low relaxation steel strand with
CFCC and EC6 strands of comparable sizes used for post-tensioning of the bridge model. The
properties of EC6 strand are very close to those of steel strand. On the other hand, the strength of
CFCC strand is 30% higher than that of steel, while its elastic modulus is 23% lower as
compared to steel.
Table 2.1 Comparison of Material Properties and Anchorage of CFCC, EC6, and Steel Strands
Tendon Type CFCC EC6 Steel*
Nominal Diameter, in. 0.492 0.484 0.5
Effective Area, in2 0.118 0.1488 0.153
Guaranteed Strength, ksi 351 268 270
Guaranteed Capacity, kip 41.4 39.7 41.3
Elastic Modulus, msi 22.3 26.8 29.0 (28.5) **
Mass Density, lb/ft 0.10 0.37 0.53
Anchorage Device Length, in. 13 4.3 3.6 * Seven-wire low-relaxation steel strands.
** Modulus of elasticity for steel strands is typically assumed as 28.5 msi to account for the
stranding an inner spacing.
Given the brittleness of carbon under transverse gripping pressure, the regular chuck anchoring
devices for steel strands cannot be applied directly to carbon fiber strands. As such, both CFCC
and EC6 strands are shipped with pre-fabricated special end anchorages, which is essentially a
6
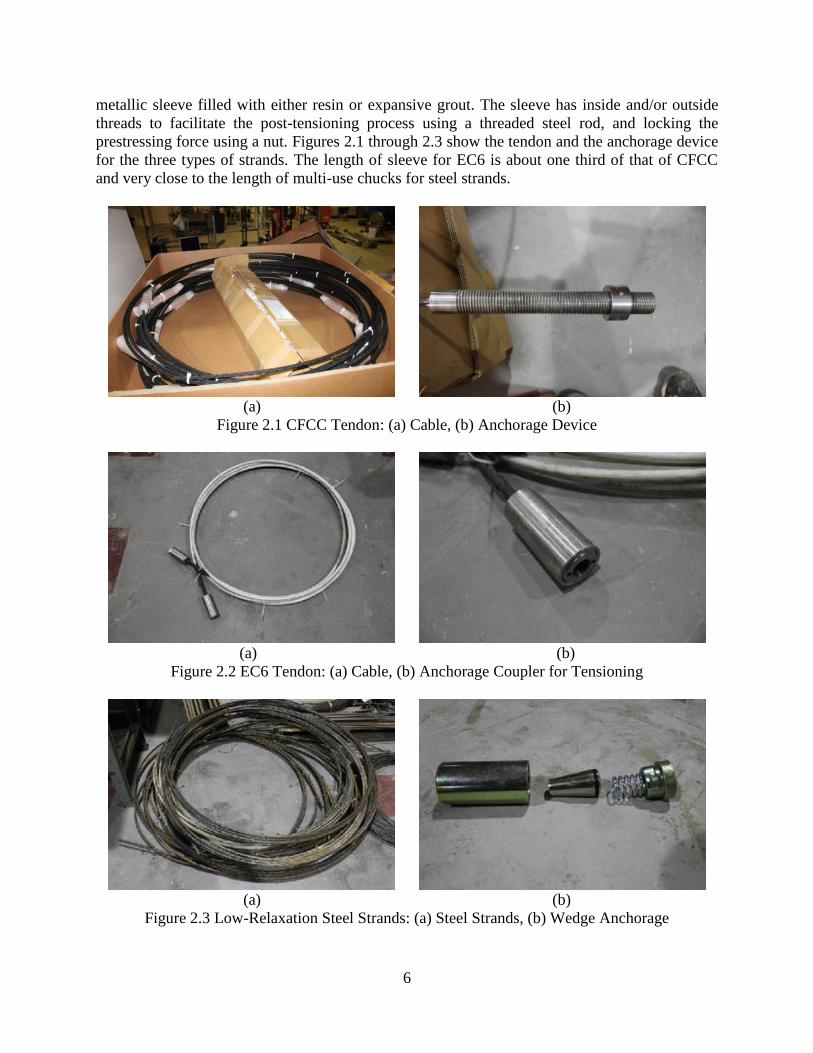
metallic sleeve filled with either resin or expansive grout. The sleeve has inside and/or outside
threads to facilitate the post-tensioning process using a threaded steel rod, and locking the
prestressing force using a nut. Figures 2.1 through 2.3 show the tendon and the anchorage device
for the three types of strands. The length of sleeve for EC6 is about one third of that of CFCC
and very close to the length of multi-use chucks for steel strands.
(a) (b)
Figure 2.1 CFCC Tendon: (a) Cable, (b) Anchorage Device
(a) (b)
Figure 2.2 EC6 Tendon: (a) Cable, (b) Anchorage Coupler for Tensioning
(a) (b)
Figure 2.3 Low-Relaxation Steel Strands: (a) Steel Strands, (b) Wedge Anchorage
7
2.2 Experimental Program
A 1:3½ scale model of Long Key Bridge segmental box-girder bridge superstructure was
constructed and used as a test bed for a series of experiments. The segmental bridge model was
first post-tensioned using CFCC, after which the bridge model was de-tensioned and CFCC
strands were replaced with EC6. Finally, the bridge model was tested with steel strands.
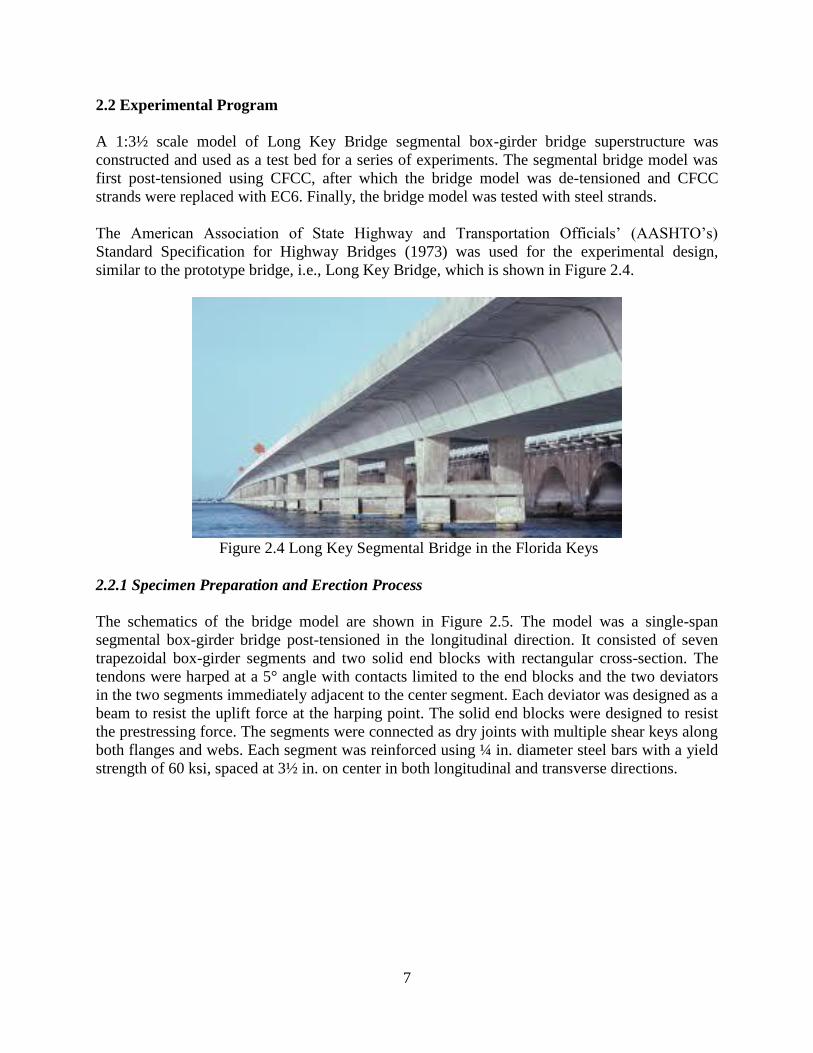
The American Association of State Highway and Transportation Officials’ (AASHTO’s)
Standard Specification for Highway Bridges (1973) was used for the experimental design,
similar to the prototype bridge, i.e., Long Key Bridge, which is shown in Figure 2.4.
Figure 2.4 Long Key Segmental Bridge in the Florida Keys
2.2.1 Specimen Preparation and Erection Process
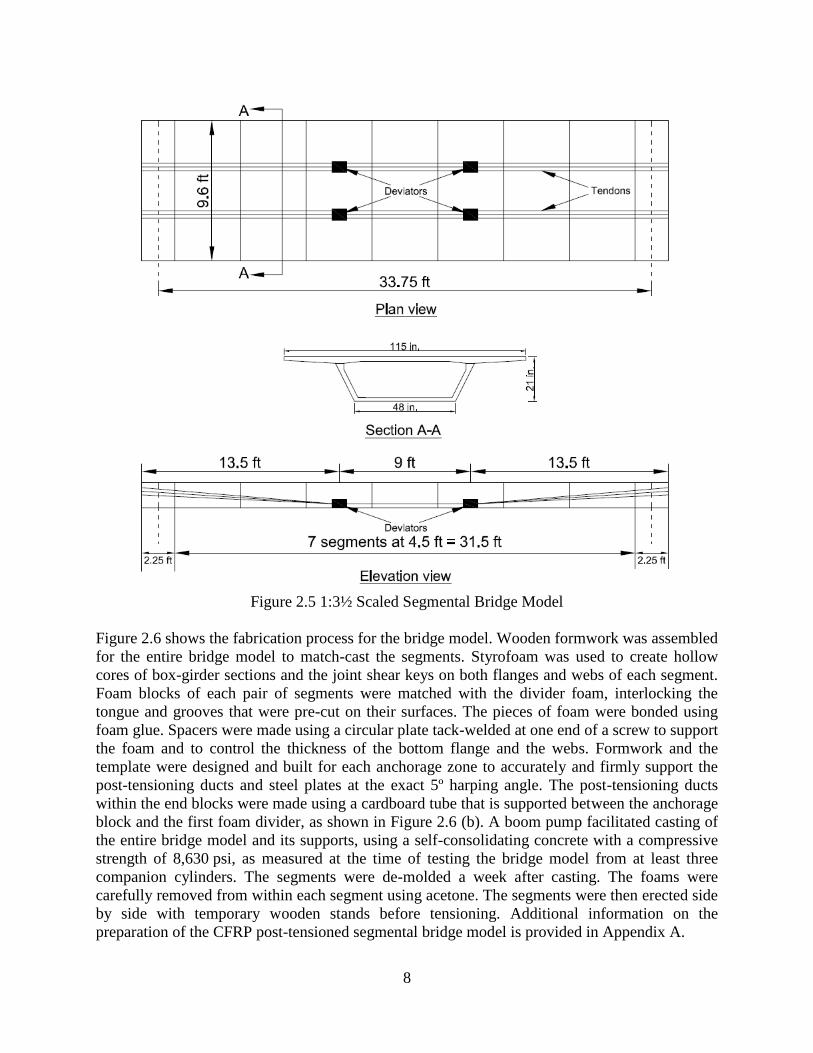
The schematics of the bridge model are shown in Figure 2.5. The model was a single-span
segmental box-girder bridge post-tensioned in the longitudinal direction. It consisted of seven
trapezoidal box-girder segments and two solid end blocks with rectangular cross-section. The
tendons were harped at a 5° angle with contacts limited to the end blocks and the two deviators
in the two segments immediately adjacent to the center segment. Each deviator was designed as a
beam to resist the uplift force at the harping point. The solid end blocks were designed to resist
the prestressing force. The segments were connected as dry joints with multiple shear keys along
both flanges and webs. Each segment was reinforced using ¼ in. diameter steel bars with a yield
strength of 60 ksi, spaced at 3½ in. on center in both longitudinal and transverse directions.
8
Figure 2.5 1:3½ Scaled Segmental Bridge Model
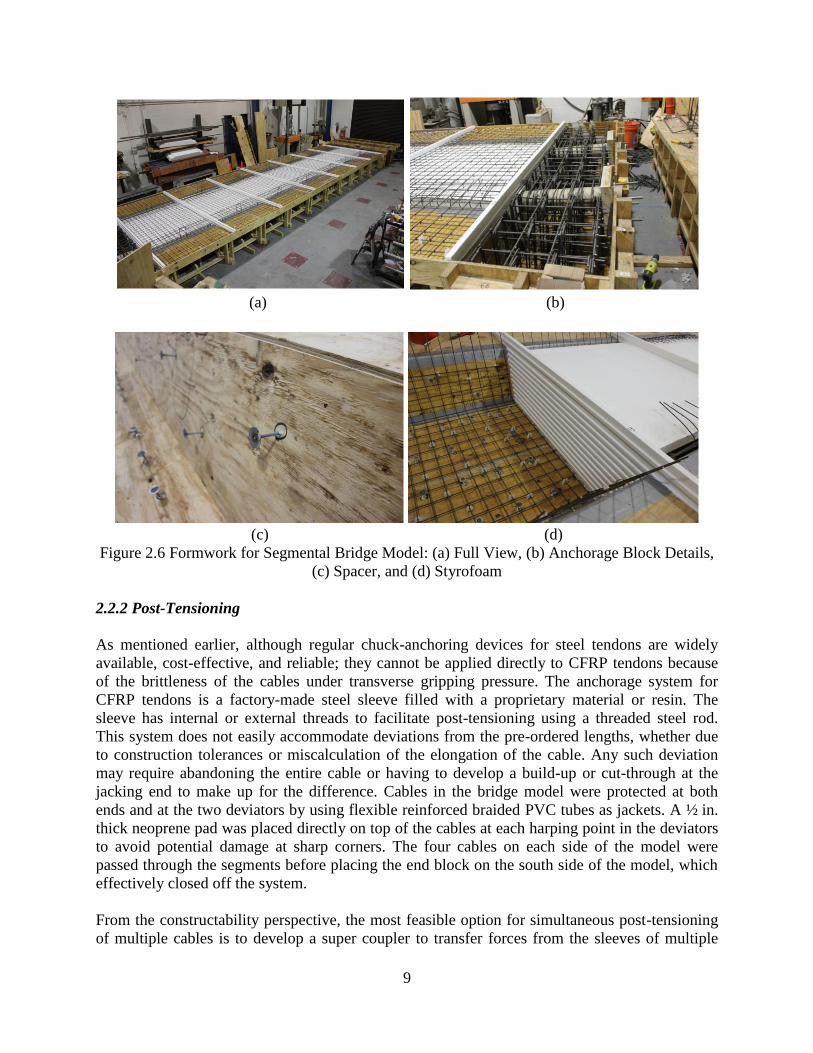
Figure 2.6 shows the fabrication process for the bridge model. Wooden formwork was assembled
for the entire bridge model to match-cast the segments. Styrofoam was used to create hollow
cores of box-girder sections and the joint shear keys on both flanges and webs of each segment.
Foam blocks of each pair of segments were matched with the divider foam, interlocking the
tongue and grooves that were pre-cut on their surfaces. The pieces of foam were bonded using
foam glue. Spacers were made using a circular plate tack-welded at one end of a screw to support
the foam and to control the thickness of the bottom flange and the webs. Formwork and the
template were designed and built for each anchorage zone to accurately and firmly support the
post-tensioning ducts and steel plates at the exact 5º harping angle. The post-tensioning ducts
within the end blocks were made using a cardboard tube that is supported between the anchorage
block and the first foam divider, as shown in Figure 2.6 (b). A boom pump facilitated casting of
the entire bridge model and its supports, using a self-consolidating concrete with a compressive
strength of 8,630 psi, as measured at the time of testing the bridge model from at least three
companion cylinders. The segments were de-molded a week after casting. The foams were
carefully removed from within each segment using acetone. The segments were then erected side
by side with temporary wooden stands before tensioning. Additional information on the
preparation of the CFRP post-tensioned segmental bridge model is provided in Appendix A.
9
(a) (b)
(c) (d)
Figure 2.6 Formwork for Segmental Bridge Model: (a) Full View, (b) Anchorage Block Details,
(c) Spacer, and (d) Styrofoam
2.2.2 Post-Tensioning
As mentioned earlier, although regular chuck-anchoring devices for steel tendons are widely
available, cost-effective, and reliable; they cannot be applied directly to CFRP tendons because
of the brittleness of the cables under transverse gripping pressure. The anchorage system for
CFRP tendons is a factory-made steel sleeve filled with a proprietary material or resin. The
sleeve has internal or external threads to facilitate post-tensioning using a threaded steel rod.
This system does not easily accommodate deviations from the pre-ordered lengths, whether due
to construction tolerances or miscalculation of the elongation of the cable. Any such deviation
may require abandoning the entire cable or having to develop a build-up or cut-through at the
jacking end to make up for the difference. Cables in the bridge model were protected at both
ends and at the two deviators by using flexible reinforced braided PVC tubes as jackets. A ½ in.
thick neoprene pad was placed directly on top of the cables at each harping point in the deviators
to avoid potential damage at sharp corners. The four cables on each side of the model were
passed through the segments before placing the end block on the south side of the model, which
effectively closed off the system.
From the constructability perspective, the most feasible option for simultaneous post-tensioning
of multiple cables is to develop a super coupler to transfer forces from the sleeves of multiple

10
tendons on one side to regular steel strands on the other side that are pulled by a hydraulic jack.
This option allows the contractor to use its current jacking tools to stress CFRP tendons. For the
bridge model, however, a second option was developed, as shown in Figure 2.7. It included two
14 7/8 × 12 in., 2 in. thick steel plates with four 1½ in. diameter holes at 3 in. on center. This
system allows passing the end sleeves through the holes, and turning the locknuts or placing the
load cells. A pair of hydraulic jacks was sandwiched between the two steel plates at each
anchorage. A similar approach was applied to steel strands, except for the use of chucks instead
of sleeves and locknuts. The strands were post-tensioned alternatively between the east and west
side of the model in increments of 20 kip, with an average force of 5 kip in each cable, to reach
the target prestressing force, while the load in each cable was continuously monitored using a
load cell.
(a) (b)
(c) (d)
(e) (f)
Figure 2.7 Segmental Bridge Model Post-tensioning system: (a) Live End for CFCC, (b) Dead
End for CFCC, (c) Live End for EC6, (d) Dead End for EC6, (e) Live End for Steel, and (f) Dead
End for Steel
11
The CFCC tendons were stressed up to 63%, 65%, and 70% of their guaranteed capacity. The
lower level of 63% was designed to match the prestress force in steel strands, as tested
previously by Arockiasamy et al. (2008). The 65% level is the maximum stress permitted for
carbon cables as per ACI Committee 440 (2004). The 70% level was chosen to evaluate the
performance of the bridge model under an over-designed prestress force. The relaxation loss of
CFCC was recorded at both 63% and 70% prestress levels for different durations before load
testing of the model. After monitoring of stresses in CFCC for almost two months, the 63%
prestress had dropped to 62% before load testing, and is noted as such in all subsequent sections.
The stress relaxation loss in EC6 tendons was recorded for 28 days at the initial stress level of 67%
of its guaranteed strength. Tests were conducted under the two post-tensioning stress levels of 65%
and 70% for each strand type (CFCC and EC6) for Loading Position 1. Shifting the test setup to
Loading Positions 2 and 3, the segmental bridge model was further tested up to the service load
at two stress levels (62% and 70) for CFCC and one stress level (70%) for EC6. The tests for the
bridge model post-tensioned with steel strands were carried out with the same prestress forces on
each tendon as the tests for the EC6 cables.
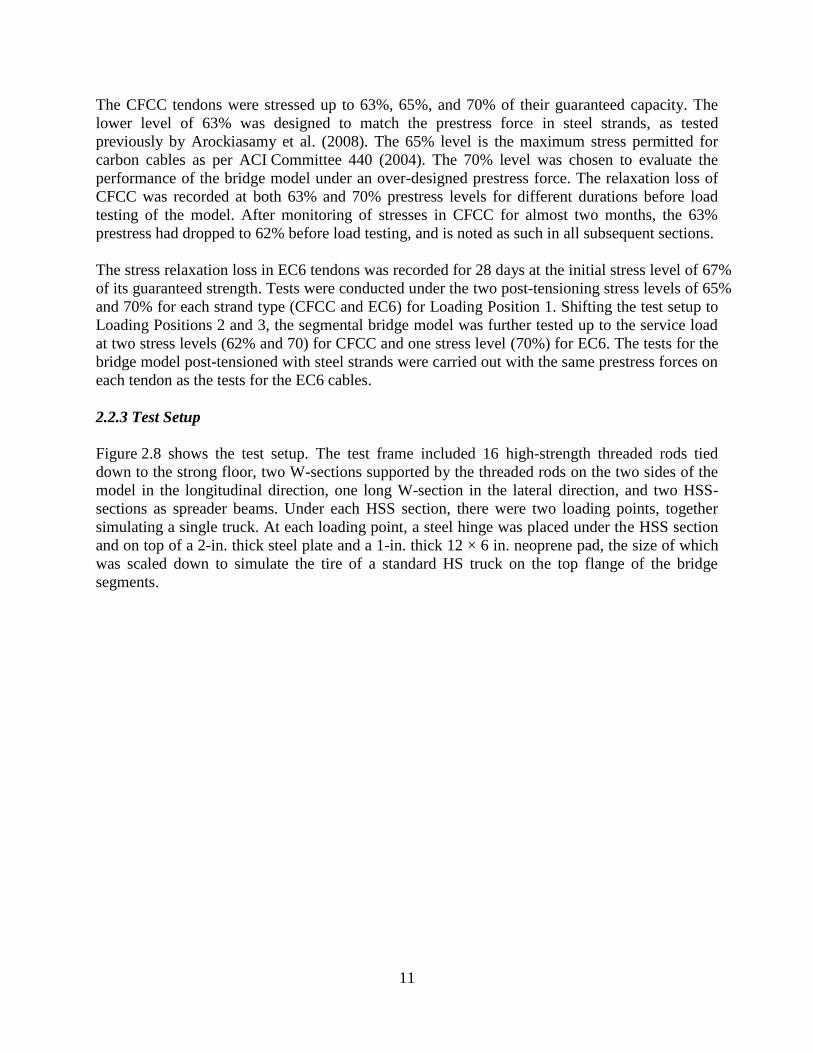
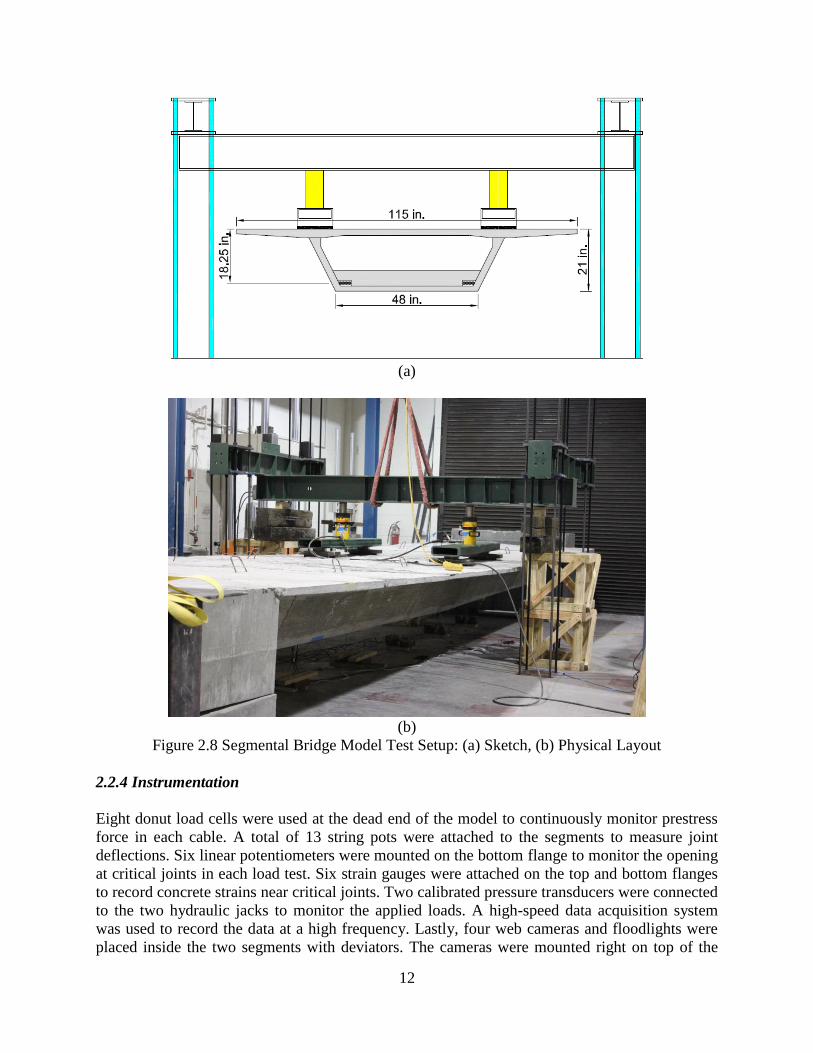
2.2.3 Test Setup
Figure 2.8 shows the test setup. The test frame included 16 high-strength threaded rods tied
down to the strong floor, two W-sections supported by the threaded rods on the two sides of the
model in the longitudinal direction, one long W-section in the lateral direction, and two HSS-
sections as spreader beams. Under each HSS section, there were two loading points, together
simulating a single truck. At each loading point, a steel hinge was placed under the HSS section
and on top of a 2-in. thick steel plate and a 1-in. thick 12 × 6 in. neoprene pad, the size of which
was scaled down to simulate the tire of a standard HS truck on the top flange of the bridge
segments.
12
(a)
(b)
Figure 2.8 Segmental Bridge Model Test Setup: (a) Sketch, (b) Physical Layout
2.2.4 Instrumentation
Eight donut load cells were used at the dead end of the model to continuously monitor prestress
force in each cable. A total of 13 string pots were attached to the segments to measure joint
deflections. Six linear potentiometers were mounted on the bottom flange to monitor the opening
at critical joints in each load test. Six strain gauges were attached on the top and bottom flanges
to record concrete strains near critical joints. Two calibrated pressure transducers were connected
to the two hydraulic jacks to monitor the applied loads. A high-speed data acquisition system
was used to record the data at a high frequency. Lastly, four web cameras and floodlights were
placed inside the two segments with deviators. The cameras were mounted right on top of the
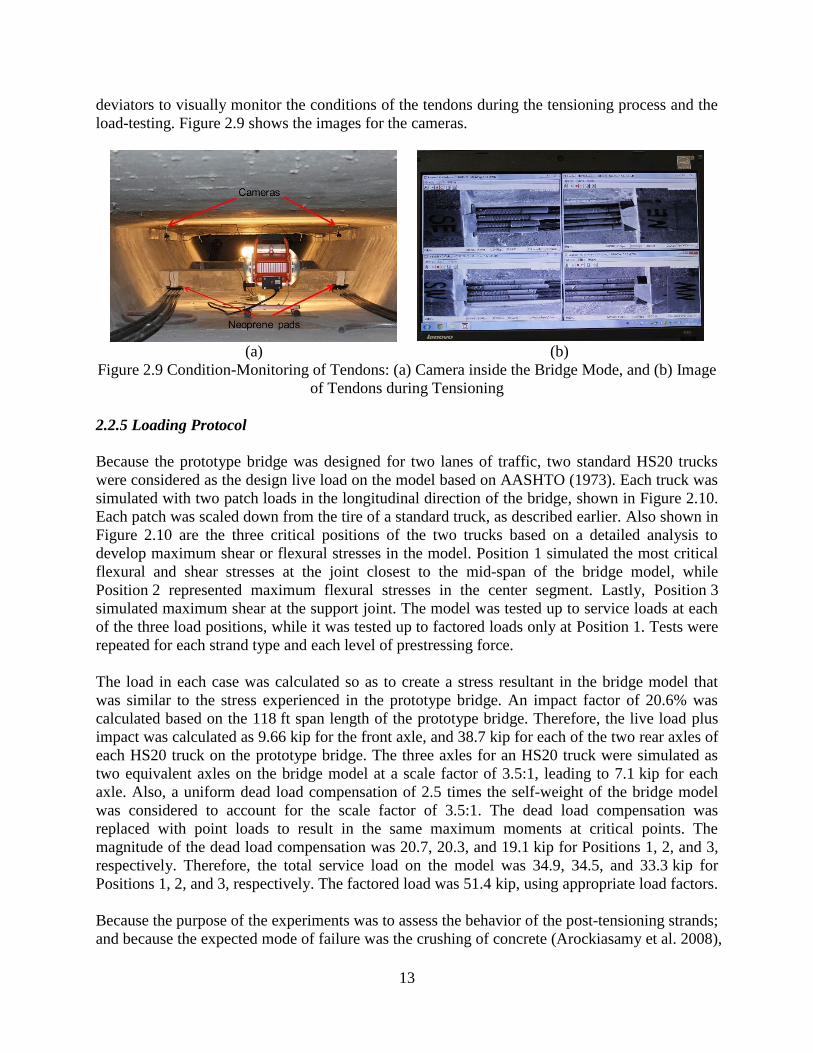
13
deviators to visually monitor the conditions of the tendons during the tensioning process and the
load-testing. Figure 2.9 shows the images for the cameras.
(a) (b)
Figure 2.9 Condition-Monitoring of Tendons: (a) Camera inside the Bridge Mode, and (b) Image
of Tendons during Tensioning
2.2.5 Loading Protocol
Because the prototype bridge was designed for two lanes of traffic, two standard HS20 trucks
were considered as the design live load on the model based on AASHTO (1973). Each truck was
simulated with two patch loads in the longitudinal direction of the bridge, shown in Figure 2.10.
Each patch was scaled down from the tire of a standard truck, as described earlier. Also shown in
Figure 2.10 are the three critical positions of the two trucks based on a detailed analysis to
develop maximum shear or flexural stresses in the model. Position 1 simulated the most critical
flexural and shear stresses at the joint closest to the mid-span of the bridge model, while
Position 2 represented maximum flexural stresses in the center segment. Lastly, Position 3
simulated maximum shear at the support joint. The model was tested up to service loads at each
of the three load positions, while it was tested up to factored loads only at Position 1. Tests were
repeated for each strand type and each level of prestressing force.
The load in each case was calculated so as to create a stress resultant in the bridge model that
was similar to the stress experienced in the prototype bridge. An impact factor of 20.6% was
calculated based on the 118 ft span length of the prototype bridge. Therefore, the live load plus
impact was calculated as 9.66 kip for the front axle, and 38.7 kip for each of the two rear axles of
each HS20 truck on the prototype bridge. The three axles for an HS20 truck were simulated as
two equivalent axles on the bridge model at a scale factor of 3.5:1, leading to 7.1 kip for each
axle. Also, a uniform dead load compensation of 2.5 times the self-weight of the bridge model
was considered to account for the scale factor of 3.5:1. The dead load compensation was
replaced with point loads to result in the same maximum moments at critical points. The
magnitude of the dead load compensation was 20.7, 20.3, and 19.1 kip for Positions 1, 2, and 3,
respectively. Therefore, the total service load on the model was 34.9, 34.5, and 33.3 kip for
Positions 1, 2, and 3, respectively. The factored load was 51.4 kip, using appropriate load factors.
Because the purpose of the experiments was to assess the behavior of the post-tensioning strands;
and because the expected mode of failure was the crushing of concrete (Arockiasamy et al. 2008),
14
tests were stopped each time at the target factored loads due to safety concerns and to allow for
repeated loading of the model as a test bed.
Additional information on the test setup for all segmental bridge model testing positions is
provided in Appendix B.
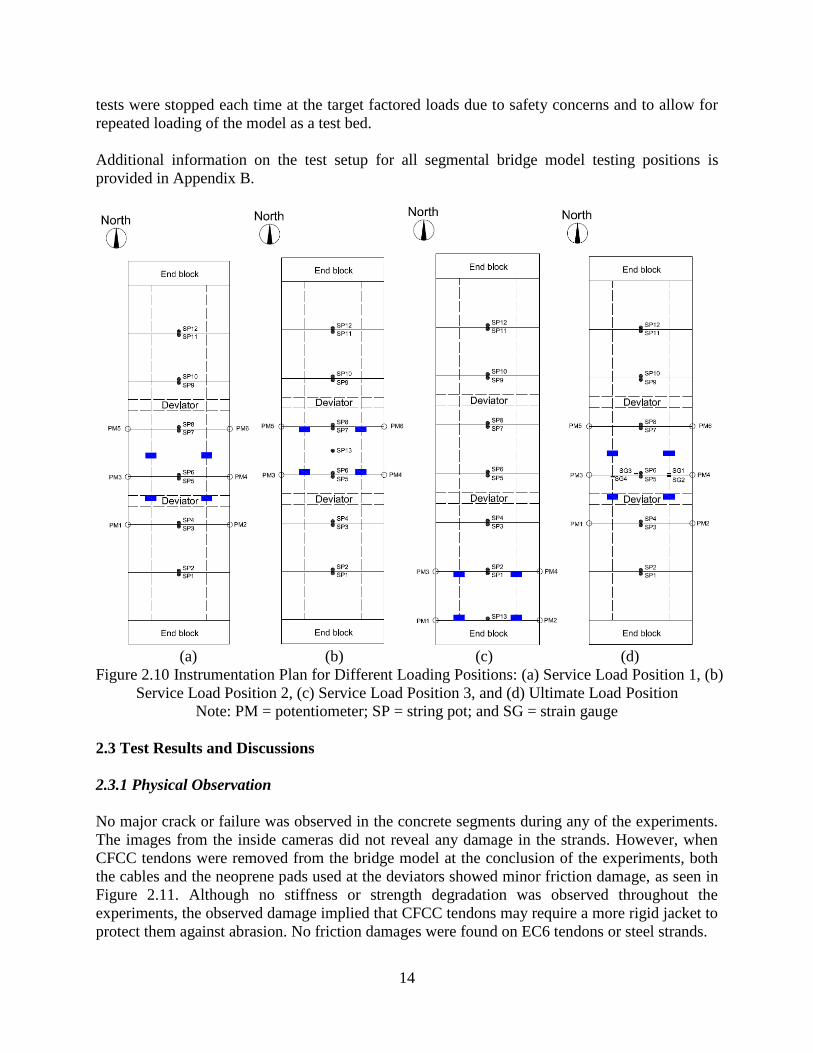
(a) (b) (c) (d)
Figure 2.10 Instrumentation Plan for Different Loading Positions: (a) Service Load Position 1, (b)
Service Load Position 2, (c) Service Load Position 3, and (d) Ultimate Load Position
Note: PM = potentiometer; SP = string pot; and SG = strain gauge
2.3 Test Results and Discussions
2.3.1 Physical Observation
No major crack or failure was observed in the concrete segments during any of the experiments.
The images from the inside cameras did not reveal any damage in the strands. However, when
CFCC tendons were removed from the bridge model at the conclusion of the experiments, both
the cables and the neoprene pads used at the deviators showed minor friction damage, as seen in
Figure 2.11. Although no stiffness or strength degradation was observed throughout the
experiments, the observed damage implied that CFCC tendons may require a more rigid jacket to
protect them against abrasion. No friction damages were found on EC6 tendons or steel strands.
15
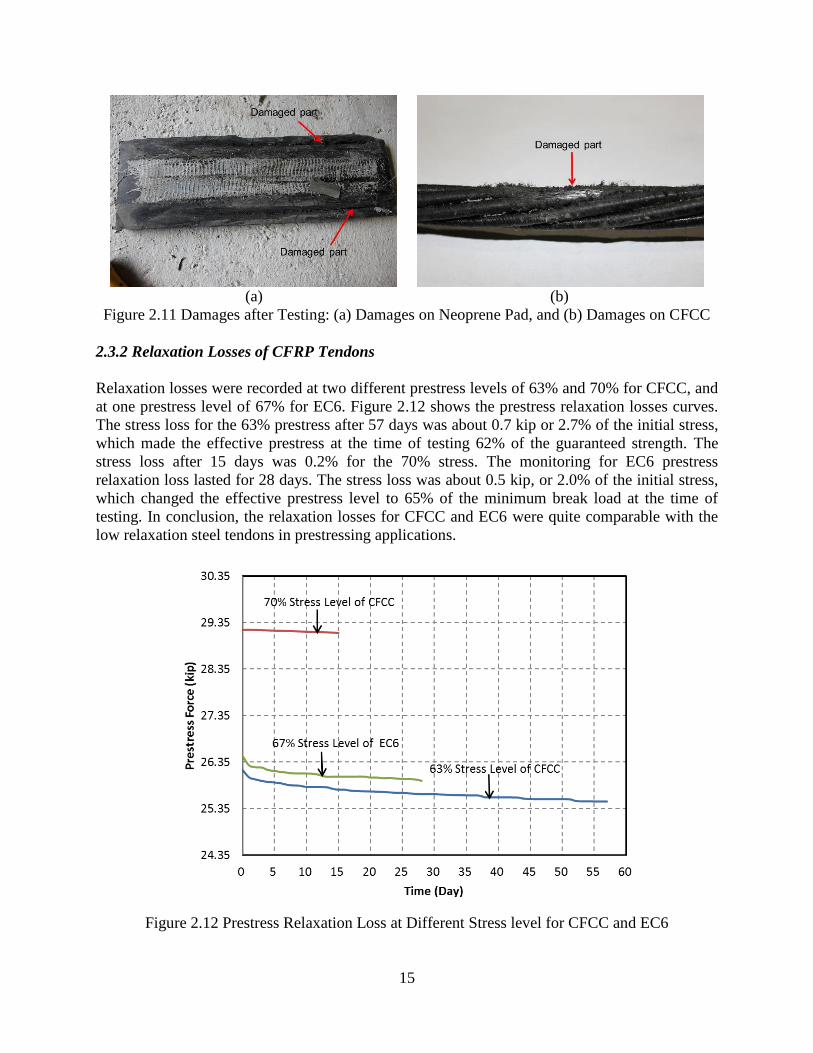
(a) (b)
Figure 2.11 Damages after Testing: (a) Damages on Neoprene Pad, and (b) Damages on CFCC
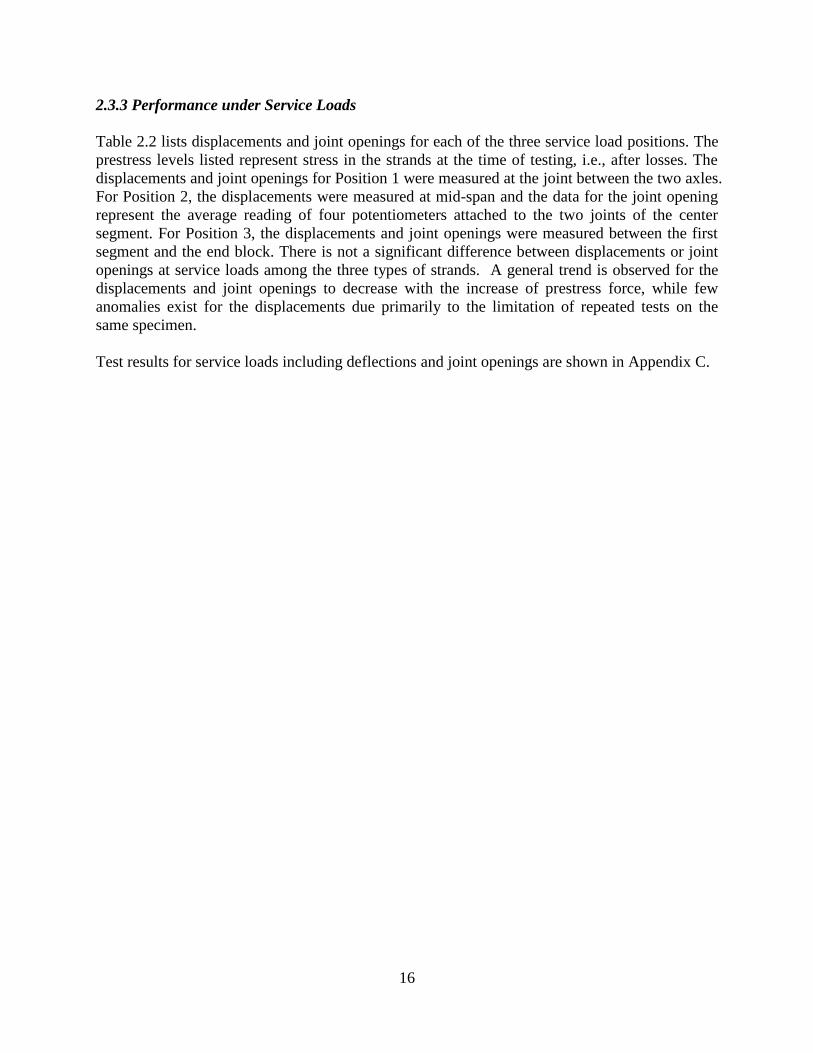
2.3.2 Relaxation Losses of CFRP Tendons
Relaxation losses were recorded at two different prestress levels of 63% and 70% for CFCC, and
at one prestress level of 67% for EC6. Figure 2.12 shows the prestress relaxation losses curves.
The stress loss for the 63% prestress after 57 days was about 0.7 kip or 2.7% of the initial stress,
which made the effective prestress at the time of testing 62% of the guaranteed strength. The
stress loss after 15 days was 0.2% for the 70% stress. The monitoring for EC6 prestress
relaxation loss lasted for 28 days. The stress loss was about 0.5 kip, or 2.0% of the initial stress,
which changed the effective prestress level to 65% of the minimum break load at the time of
testing. In conclusion, the relaxation losses for CFCC and EC6 were quite comparable with the
low relaxation steel tendons in prestressing applications.
Figure 2.12 Prestress Relaxation Loss at Different Stress level for CFCC and EC6
16
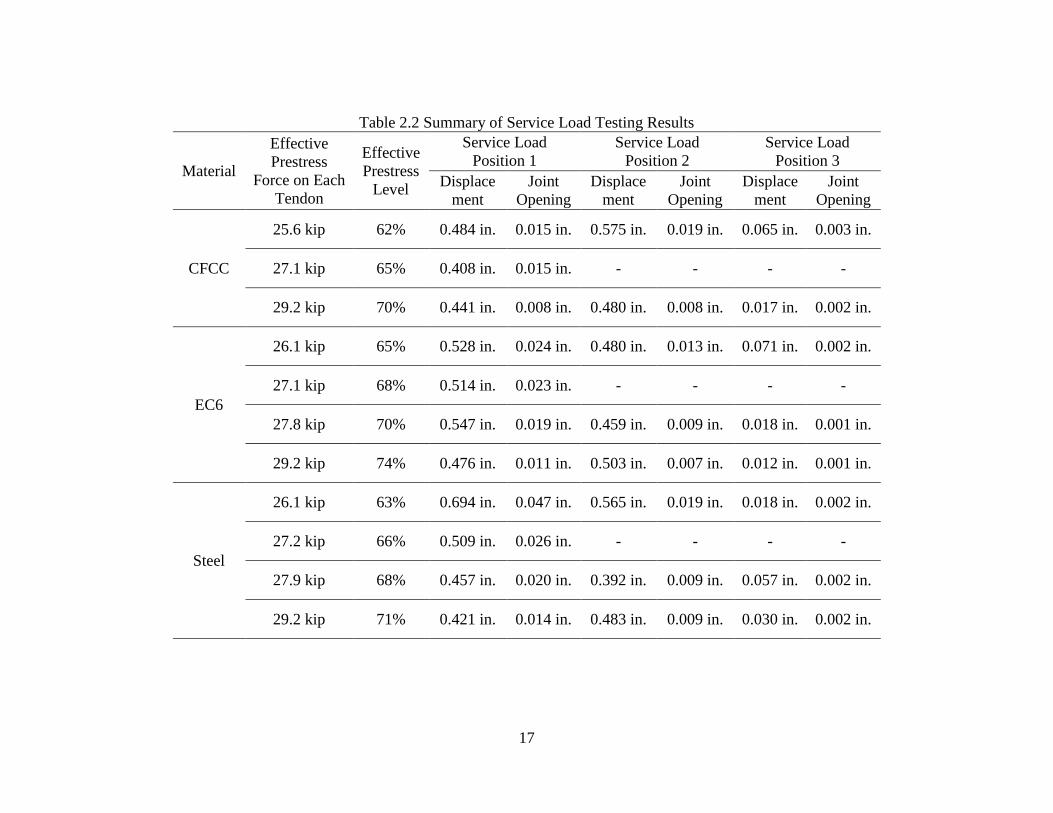
2.3.3 Performance under Service Loads
Table 2.2 lists displacements and joint openings for each of the three service load positions. The
prestress levels listed represent stress in the strands at the time of testing, i.e., after losses. The
displacements and joint openings for Position 1 were measured at the joint between the two axles.
For Position 2, the displacements were measured at mid-span and the data for the joint opening
represent the average reading of four potentiometers attached to the two joints of the center
segment. For Position 3, the displacements and joint openings were measured between the first
segment and the end block. There is not a significant difference between displacements or joint
openings at service loads among the three types of strands. A general trend is observed for the
displacements and joint openings to decrease with the increase of prestress force, while few
anomalies exist for the displacements due primarily to the limitation of repeated tests on the
same specimen.
Test results for service loads including deflections and joint openings are shown in Appendix C.
17
Table 2.2 Summary of Service Load Testing Results
Material
Effective
Prestress
Force on Each
Tendon
Effective
Prestress
Level
Service Load
Position 1
Service Load
Position 2
Service Load
Position 3
Displace
ment
Joint
Opening
Displace
ment
Joint
Opening
Displace
ment
Joint
Opening
CFCC
25.6 kip 62% 0.484 in. 0.015 in. 0.575 in. 0.019 in. 0.065 in. 0.003 in.
27.1 kip 65% 0.408 in. 0.015 in. - - - -
29.2 kip 70% 0.441 in. 0.008 in. 0.480 in. 0.008 in. 0.017 in. 0.002 in.
EC6
26.1 kip 65% 0.528 in. 0.024 in. 0.480 in. 0.013 in. 0.071 in. 0.002 in.
27.1 kip 68% 0.514 in. 0.023 in. - - - -
27.8 kip 70% 0.547 in. 0.019 in. 0.459 in. 0.009 in. 0.018 in. 0.001 in.
29.2 kip 74% 0.476 in. 0.011 in. 0.503 in. 0.007 in. 0.012 in. 0.001 in.
Steel
26.1 kip 63% 0.694 in. 0.047 in. 0.565 in. 0.019 in. 0.018 in. 0.002 in.
27.2 kip 66% 0.509 in. 0.026 in. - - - -
27.9 kip 68% 0.457 in. 0.020 in. 0.392 in. 0.009 in. 0.057 in. 0.002 in.
29.2 kip 71% 0.421 in. 0.014 in. 0.483 in. 0.009 in. 0.030 in. 0.002 in.
18
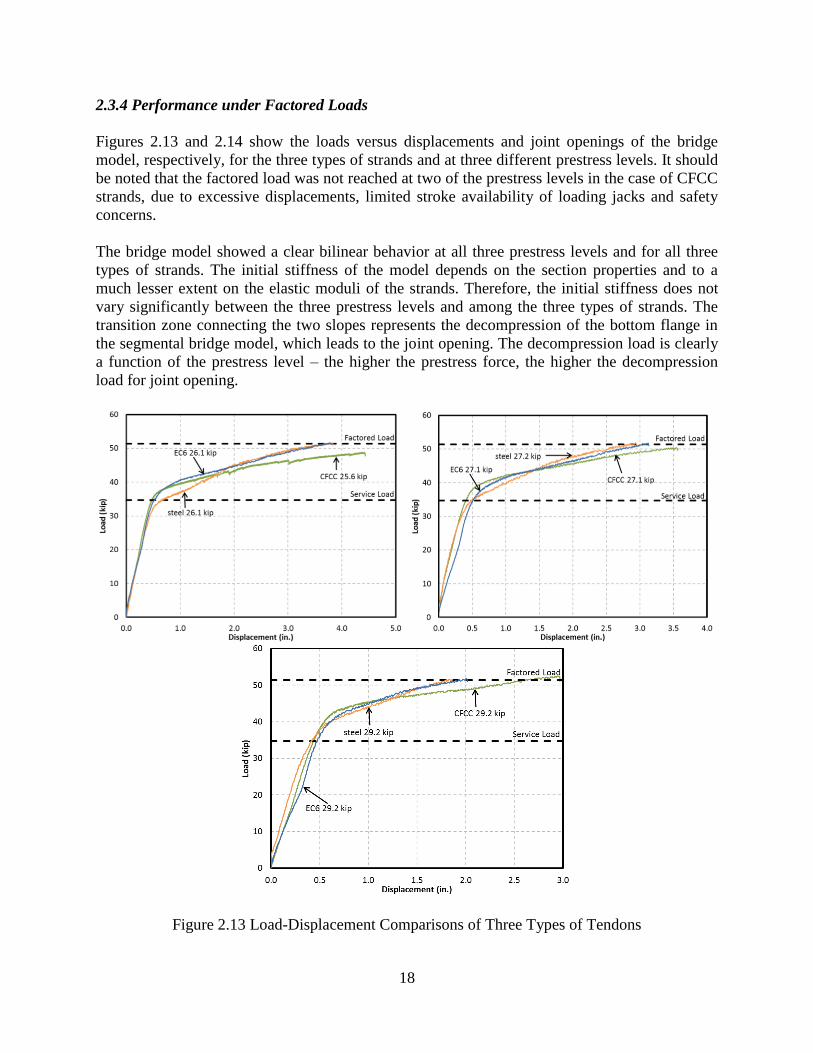
2.3.4 Performance under Factored Loads
Figures 2.13 and 2.14 show the loads versus displacements and joint openings of the bridge
model, respectively, for the three types of strands and at three different prestress levels. It should
be noted that the factored load was not reached at two of the prestress levels in the case of CFCC
strands, due to excessive displacements, limited stroke availability of loading jacks and safety
concerns.
The bridge model showed a clear bilinear behavior at all three prestress levels and for all three
types of strands. The initial stiffness of the model depends on the section properties and to a
much lesser extent on the elastic moduli of the strands. Therefore, the initial stiffness does not
vary significantly between the three prestress levels and among the three types of strands. The
transition zone connecting the two slopes represents the decompression of the bottom flange in
the segmental bridge model, which leads to the joint opening. The decompression load is clearly
a function of the prestress level – the higher the prestress force, the higher the decompression
load for joint opening.
Figure 2.13 Load-Displacement Comparisons of Three Types of Tendons
19
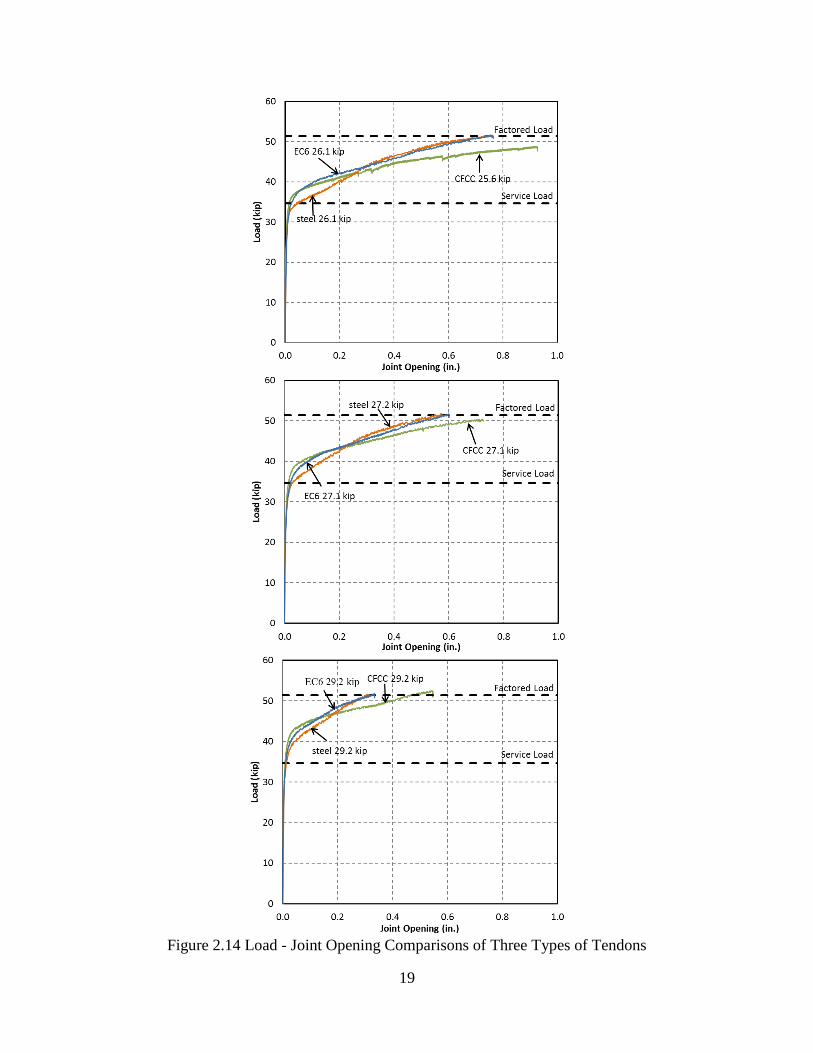
Figure 2.14 Load - Joint Opening Comparisons of Three Types of Tendons
20
Subsequent to the joint opening, the top flange acts as a hinge, accommodating the rotation of the
two adjacent segments. At this stage, the response is signified with a considerably lower stiffness,
corresponding mainly to the stiffness of the strands. While the higher prestress level could delay
the joint opening, it does not appear to have a measurable impact on the secondary stiffness of
the bridge model after joint opening. On the other hand, elastic modulus of the strand has an
impact on the secondary stiffness. Only a small portion of the second stiffness of the section was
contributed by the concrete. As such, displacements and joint openings for EC6 and steel stands
are quite close to each other, and higher than those for CFCC strands. This finding has an
implication in a stiffness-based equivalency approach, as will be described later.
(a)
(b)
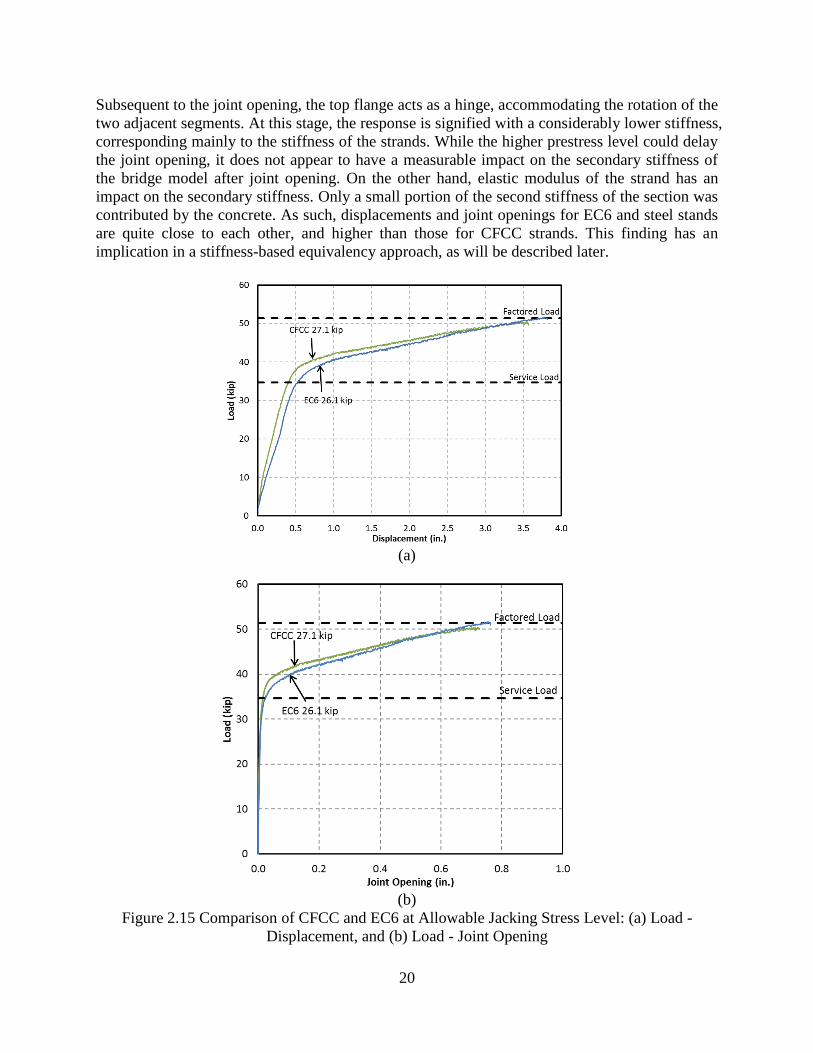
Figure 2.15 Comparison of CFCC and EC6 at Allowable Jacking Stress Level: (a) Load -
Displacement, and (b) Load - Joint Opening
21
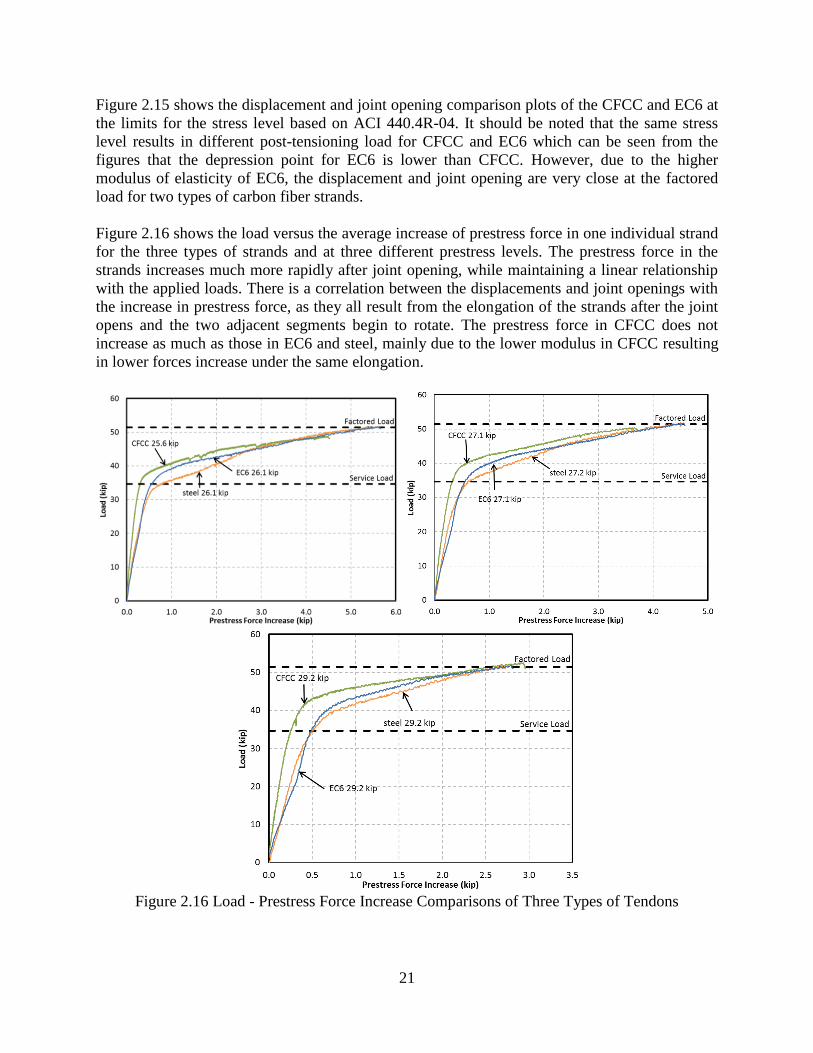
Figure 2.15 shows the displacement and joint opening comparison plots of the CFCC and EC6 at
the limits for the stress level based on ACI 440.4R-04. It should be noted that the same stress
level results in different post-tensioning load for CFCC and EC6 which can be seen from the
figures that the depression point for EC6 is lower than CFCC. However, due to the higher
modulus of elasticity of EC6, the displacement and joint opening are very close at the factored
load for two types of carbon fiber strands.
Figure 2.16 shows the load versus the average increase of prestress force in one individual strand
for the three types of strands and at three different prestress levels. The prestress force in the
strands increases much more rapidly after joint opening, while maintaining a linear relationship
with the applied loads. There is a correlation between the displacements and joint openings with
the increase in prestress force, as they all result from the elongation of the strands after the joint
opens and the two adjacent segments begin to rotate. The prestress force in CFCC does not
increase as much as those in EC6 and steel, mainly due to the lower modulus in CFCC resulting
in lower forces increase under the same elongation.
Figure 2.16 Load - Prestress Force Increase Comparisons of Three Types of Tendons
22
As described earlier, the bridge model was post-tensioned with unbonded external CFRP tendons
to develop the same prestressing force as that of unbonded external steel strands; as
Apf fpf = Aps fps (2.1)
where Apf and Aps = area of carbon fiber and steel strands, respectively, and fpf and fps = nominal
failure stress in carbon fiber and steel strands, respectively.
This approach, however, leads to much higher deformations after joint opening, which is beyond
the service limit, for segmental bridges with CFRP tendons, as observed in the experiments.
Therefore, one may consider a stiffness-based approach to make the responses of the two types
of tendons more comparable; as
Apf Epf = Aps Eps (2.2)
where Epf and Eps = elastic modulus of carbon fiber and steel strands, respectively.
Such a stiffness-based approach could, however, lower the stress level in carbon fiber strands to
compensate for their lower elastic moduli in the unbonded external post-tensioning system; as
𝑓𝑝𝑓 =𝐸𝑝𝑓
𝐸𝑝𝑠 𝑓𝑝𝑠 (2.3)
For instance, the maximum-allowable jacking stress for steel is typically 80% of its ultimate
strength, as compared with the 65% limit recommended for CFRP by ACI 440.4R-04 (2004).
Although CFCC could physically be stressed as high as 65% of its guaranteed strength without
any concern for stress rupture, using the above stiffness-based equivalency approach could
potentially lower the stress level to 48% of its guaranteed strength to provide a similar response
to steel tendons with elastic modulus of 28.5 msi. The same approach for EC6 strands yields a
jacking stress level of 76%, closer to that of steel. However, it is important to note that if a
similar behavior to steel after joint opening is not desired, the use of stiffness-based approach
will not be necessary.
2.3.5 Ultimate Capacity Comparisons
Since the segmental bridge model was not tested to failure, a comparison cannot be made
between the experimental and theoretical values of the ultimate capacity. However, the tested
factored load may still be used to compare with the theoretical capacities of the model using
carbon fiber and steel strands. The theoretical ultimate capacities, calculated based on ACI 440,
ranged between 2,929 and 3,336 kip·in for CFCC and 2,988 to 3,338 kip·in for EC6, for the
different levels of prestressing force used in the experiments. The theoretical ultimate capacity
for the case of steel strands was 4,582 kip·in, based on AASHTO (2012). Compared with the
tested factored moment of 4,495 kip·in at the critical joint, it is clear that the theoretical ultimate
capacities of the segmental bridge using carbon fiber strands are grossly underestimated.
23
2.4 Analytical Program
2.4.1 Finite Element Modeling
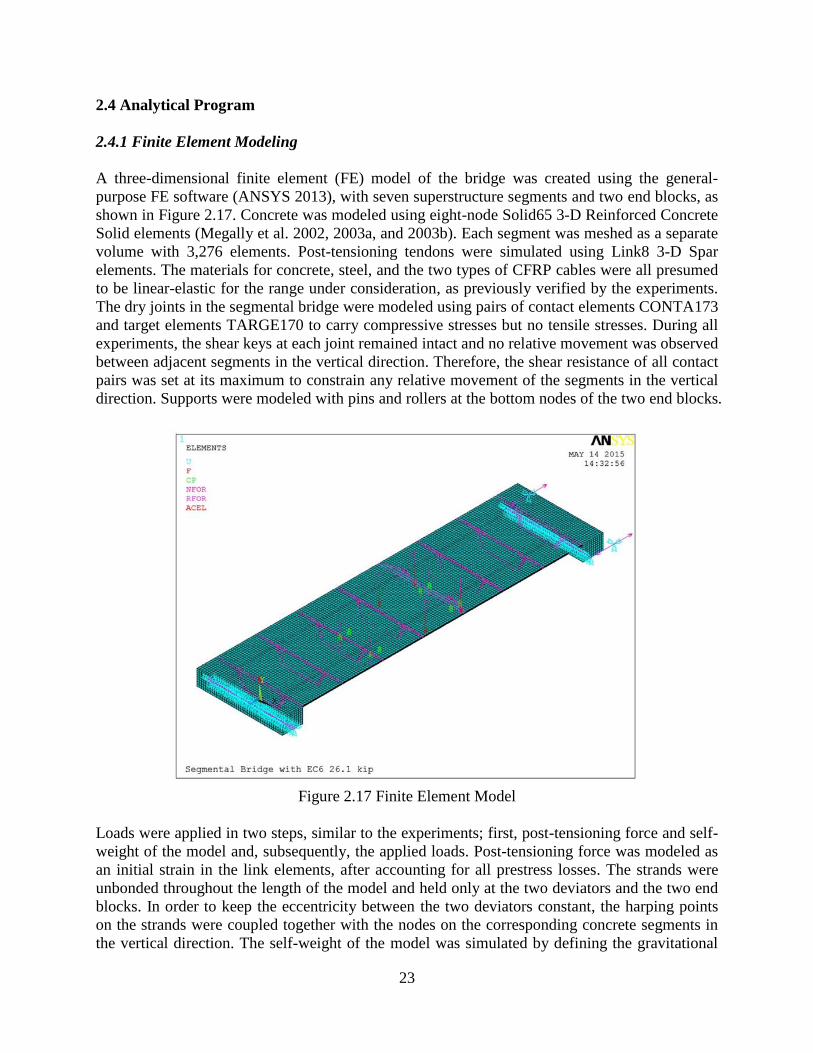
A three-dimensional finite element (FE) model of the bridge was created using the general-
purpose FE software (ANSYS 2013), with seven superstructure segments and two end blocks, as
shown in Figure 2.17. Concrete was modeled using eight-node Solid65 3-D Reinforced Concrete
Solid elements (Megally et al. 2002, 2003a, and 2003b). Each segment was meshed as a separate
volume with 3,276 elements. Post-tensioning tendons were simulated using Link8 3-D Spar
elements. The materials for concrete, steel, and the two types of CFRP cables were all presumed
to be linear-elastic for the range under consideration, as previously verified by the experiments.
The dry joints in the segmental bridge were modeled using pairs of contact elements CONTA173
and target elements TARGE170 to carry compressive stresses but no tensile stresses. During all
experiments, the shear keys at each joint remained intact and no relative movement was observed
between adjacent segments in the vertical direction. Therefore, the shear resistance of all contact
pairs was set at its maximum to constrain any relative movement of the segments in the vertical
direction. Supports were modeled with pins and rollers at the bottom nodes of the two end blocks.
Figure 2.17 Finite Element Model
Loads were applied in two steps, similar to the experiments; first, post-tensioning force and self-
weight of the model and, subsequently, the applied loads. Post-tensioning force was modeled as
an initial strain in the link elements, after accounting for all prestress losses. The strands were
unbonded throughout the length of the model and held only at the two deviators and the two end
blocks. In order to keep the eccentricity between the two deviators constant, the harping points
on the strands were coupled together with the nodes on the corresponding concrete segments in
the vertical direction. The self-weight of the model was simulated by defining the gravitational

24
acceleration in the vertical direction. In the second step, the four-point loading was applied on
the model at the intersection of the top flange and the web to avoid any unintended punching
shear.
In all experiments, the two end blocks were seated directly on top of the solid concrete blocks.
The constraints were not the perfect pin-roller supports as used in the finite element model, and
as such, the friction between the end block and the concrete support needed to be accounted for.
Two parallel linear spring elements were placed at the roller supports in the direction of the
bridge model to simulate the friction. The spring constant k in each of the two springs was
calibrated from test results, i.e., dividing the total friction force by twice the difference between
the values of the experimental joint opening and the joint opening of the perfect pin-roller
support model. The friction force was estimated from the total applied loads multiplied by the
coefficient of friction between two concrete surfaces, selected as 0.6 (ACI Committee 318, 2014).
During the first set of experiments, limited concrete spalling and local damage was noted at the
inner edge of the end blocks. The local damage effectively moved the pivot point of the end
block towards the center of the support. This was accurately modeled by moving the placement
of the constraints at the end block subsequent to the first experiment.
Figure 2.18 shows the deformed specimen and the joint opening between the segments for one of
the tests, as predicted by the finite element model.
Figure 2.18 Deformed Shaped of FE Model with Joint Opening
Figures 2.19 and 2.20 show a comparison of the load-displacements from the experiments and
the FE model post-tensioned with CFCC and EC6 strands at three different prestress levels,
respectively. A close match is observed between the FE results and the experimental data in the
initial stiffness and the curvature of the transition zone. The slight discrepancy that is observed

25
may be attributed to the engagement between the segments, because the same bridge model was
tested repeatedly.
Figure 2.19 Load-Displacement Comparisons between FE Model and Experimental Data for
CFCC
Figure 2.20 Load-Displacement Comparisons between FE Model and Experimental Data for
EC6
26
2.4.2 Parametrical Study
To study the effect of the elastic modulus on the behavior of segmental bridge, a prefect pin-
roller supported simple-span segmental bridge model with a span length of 400.22 in. was
modeled using finite elements. Five different elastic moduli were chosen as the parameters
including 19.8 msi referring to ACI Committee 440 (2004) for CFCC, 22.3 msi as the modulus
provided by the manufacturer for CFCC, 24.6 msi as the intermediate value between the moduli
of CFCC and EC6, 26.8 msi as provided by the manufacturer for EC6, and 29 msi as the elastic
modulus for steel. Three initial prestress levels were chosen based on the maximum stress limit,
which were the 90% of the yield strength of prestressing steel 207 ksi and 65% of ultimate
strength of two CFRP strands, 174 ksi and 228 ksi. The cross sectional area of prestressing
strands was kept as constant.
Figure 2.21 shows the relationship between the elastic modulus of strands and the vertical
displacement of the joint between the loading points in the longitudinal direction of the model
over the span length at factored load for three prestress levels. With the same initial prestress, the
decompression points for all the models with different elastic moduli were identical. Prior to
joint opening, the response of the model was perfectly linear and about same for all cases. The
elastic modulus began governing the performance of the model after joint opening. The higher
elastic modulus can significantly reduce the displacement, whereas the higher stress level can
minimize the difference since it can help postpone the decompression and joint opening. Figure
2.22 shows the secondary stiffness in the load-displacement relationship versus elastic modulus.
Regression analysis was conducted to find the best fit linear load-displacement relationship after
joint opening. The tendency for the stiffness increase was obvious along with the increase of the
elastic modulus. Moreover, it seems as though the prestress level was a factor affecting the
secondary stiffness, i.e., the higher the stress level the higher the stiffness after joint opening.
This was because the secondary stiffness was not solely proportional to the elastic modulus of
the strands, but rather a function of the moment of inertia of the entire section, which includes
both concrete and strands. The overall moment of inertia continues to change due to the opening
of the joint. The stiffness of the structure continues to decrease along with the growth of the joint
opening. The changes in stiffness may also be attributed to the change in eccentricity of the
external tendons with the bridge deformations and joint opening. This partially explains why a
higher stress level may lead to a higher stiffness after joint opening, as it slows down the process.
Additionally, one may consider deflections and joint openings of the segmental bridge after
decompression of the section given the implications of the lower elastic modulus of carbon fiber
strands. To achieve the same structural behavior of the segmental bridge post-tensioned using
steel strands, prestress level and cross sectional area of carbon fiber strands need to be
proportionally sized by the ratio of the elastic moduli between carbon fiber and steel strands. A
lower elastic modulus may require a lower prestress level, but with the same applied force to the
section and a larger cross sectional area for the strands. Finite element models were used to
demonstrate this stiffness-based approach. Several input sets were examined with strands of
different prestress levels, cross sectional areas, and elastic moduli. Figure 2.23 shows the
deflection of the critical joint at factored load for several cases, showing exactly the same
response as that of steel strands, when a stiffness-based approach is utilized.
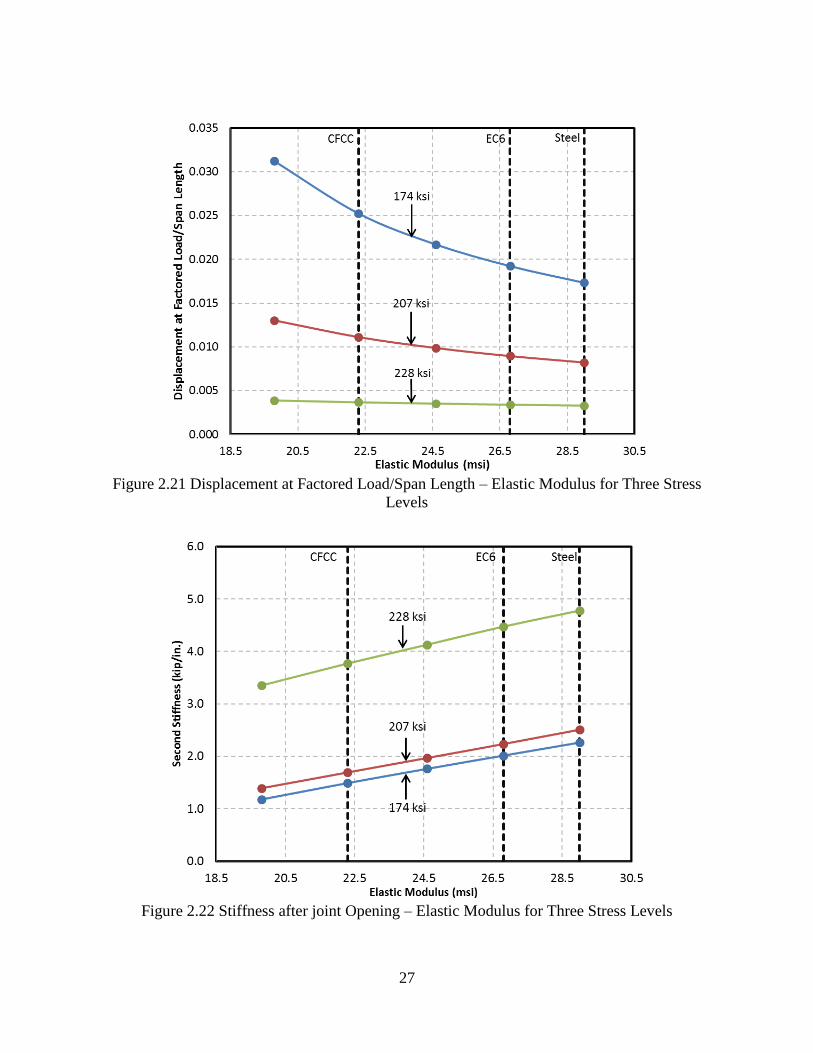
27
Figure 2.21 Displacement at Factored Load/Span Length – Elastic Modulus for Three Stress
Levels
Figure 2.22 Stiffness after joint Opening – Elastic Modulus for Three Stress Levels
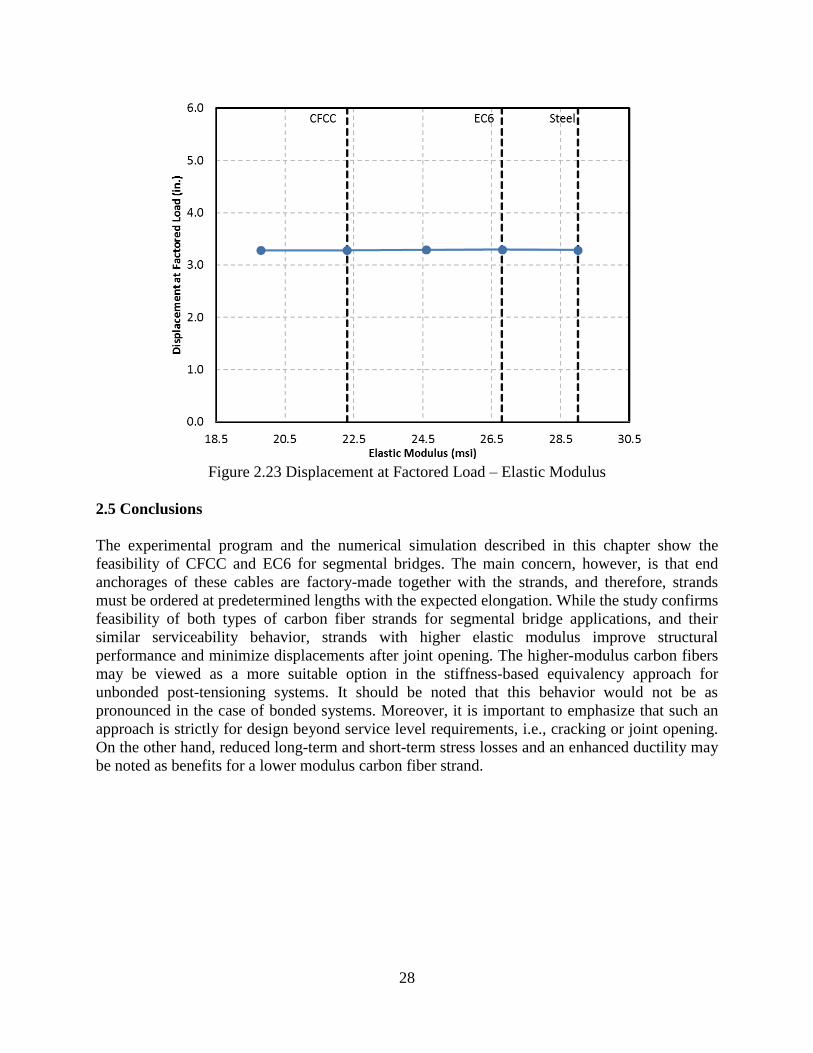
28
Figure 2.23 Displacement at Factored Load – Elastic Modulus
2.5 Conclusions
The experimental program and the numerical simulation described in this chapter show the
feasibility of CFCC and EC6 for segmental bridges. The main concern, however, is that end
anchorages of these cables are factory-made together with the strands, and therefore, strands
must be ordered at predetermined lengths with the expected elongation. While the study confirms
feasibility of both types of carbon fiber strands for segmental bridge applications, and their
similar serviceability behavior, strands with higher elastic modulus improve structural
performance and minimize displacements after joint opening. The higher-modulus carbon fibers
may be viewed as a more suitable option in the stiffness-based equivalency approach for
unbonded post-tensioning systems. It should be noted that this behavior would not be as
pronounced in the case of bonded systems. Moreover, it is important to emphasize that such an
approach is strictly for design beyond service level requirements, i.e., cracking or joint opening.
On the other hand, reduced long-term and short-term stress losses and an enhanced ductility may
be noted as benefits for a lower modulus carbon fiber strand.
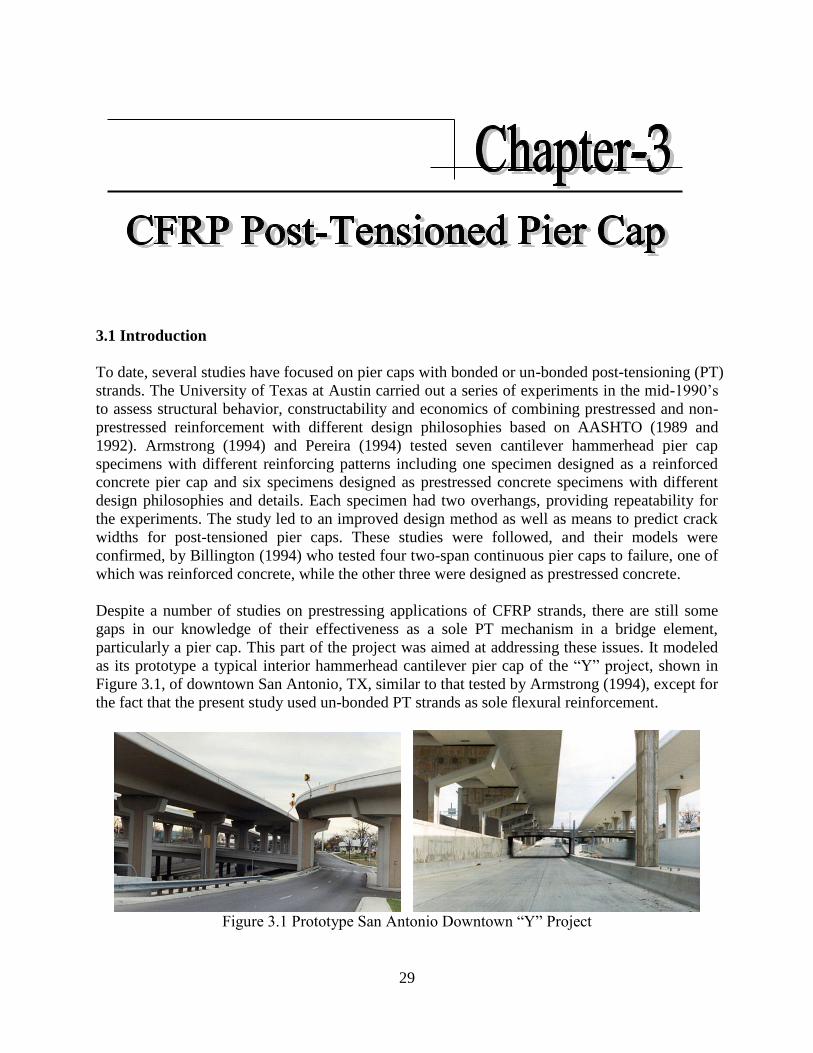
29
Chapter 3 CFRP Post-Tensioned Pier Cap 3.1 Introduction
To date, several studies have focused on pier caps with bonded or un-bonded post-tensioning (PT)
strands. The University of Texas at Austin carried out a series of experiments in the mid-1990’s
to assess structural behavior, constructability and economics of combining prestressed and non-
prestressed reinforcement with different design philosophies based on AASHTO (1989 and
1992). Armstrong (1994) and Pereira (1994) tested seven cantilever hammerhead pier cap
specimens with different reinforcing patterns including one specimen designed as a reinforced
concrete pier cap and six specimens designed as prestressed concrete specimens with different
design philosophies and details. Each specimen had two overhangs, providing repeatability for
the experiments. The study led to an improved design method as well as means to predict crack
widths for post-tensioned pier caps. These studies were followed, and their models were
confirmed, by Billington (1994) who tested four two-span continuous pier caps to failure, one of
which was reinforced concrete, while the other three were designed as prestressed concrete.
Despite a number of studies on prestressing applications of CFRP strands, there are still some
gaps in our knowledge of their effectiveness as a sole PT mechanism in a bridge element,
particularly a pier cap. This part of the project was aimed at addressing these issues. It modeled
as its prototype a typical interior hammerhead cantilever pier cap of the “Y” project, shown in
Figure 3.1, of downtown San Antonio, TX, similar to that tested by Armstrong (1994), except for
the fact that the present study used un-bonded PT strands as sole flexural reinforcement.
Figure 3.1 Prototype San Antonio Downtown “Y” Project
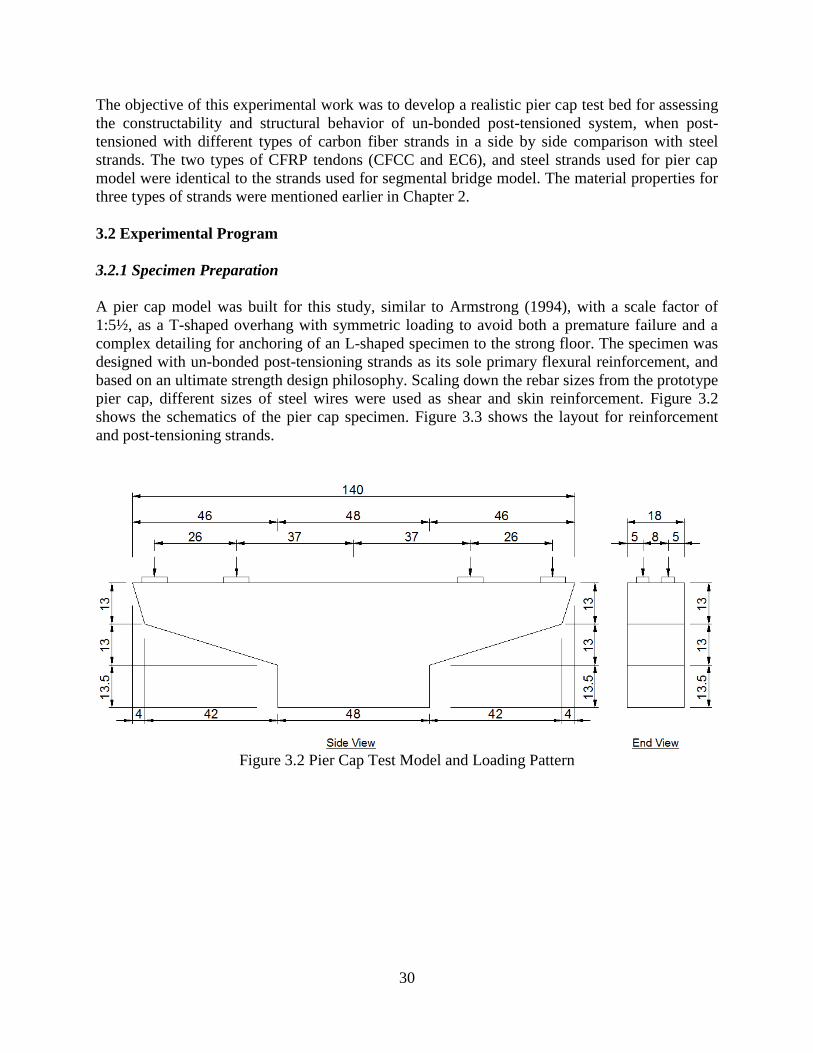
30
The objective of this experimental work was to develop a realistic pier cap test bed for assessing
the constructability and structural behavior of un-bonded post-tensioned system, when post-
tensioned with different types of carbon fiber strands in a side by side comparison with steel
strands. The two types of CFRP tendons (CFCC and EC6), and steel strands used for pier cap
model were identical to the strands used for segmental bridge model. The material properties for
three types of strands were mentioned earlier in Chapter 2.
3.2 Experimental Program
3.2.1 Specimen Preparation
A pier cap model was built for this study, similar to Armstrong (1994), with a scale factor of
1:5½, as a T-shaped overhang with symmetric loading to avoid both a premature failure and a
complex detailing for anchoring of an L-shaped specimen to the strong floor. The specimen was
designed with un-bonded post-tensioning strands as its sole primary flexural reinforcement, and
based on an ultimate strength design philosophy. Scaling down the rebar sizes from the prototype
pier cap, different sizes of steel wires were used as shear and skin reinforcement. Figure 3.2
shows the schematics of the pier cap specimen. Figure 3.3 shows the layout for reinforcement
and post-tensioning strands.
Figure 3.2 Pier Cap Test Model and Loading Pattern
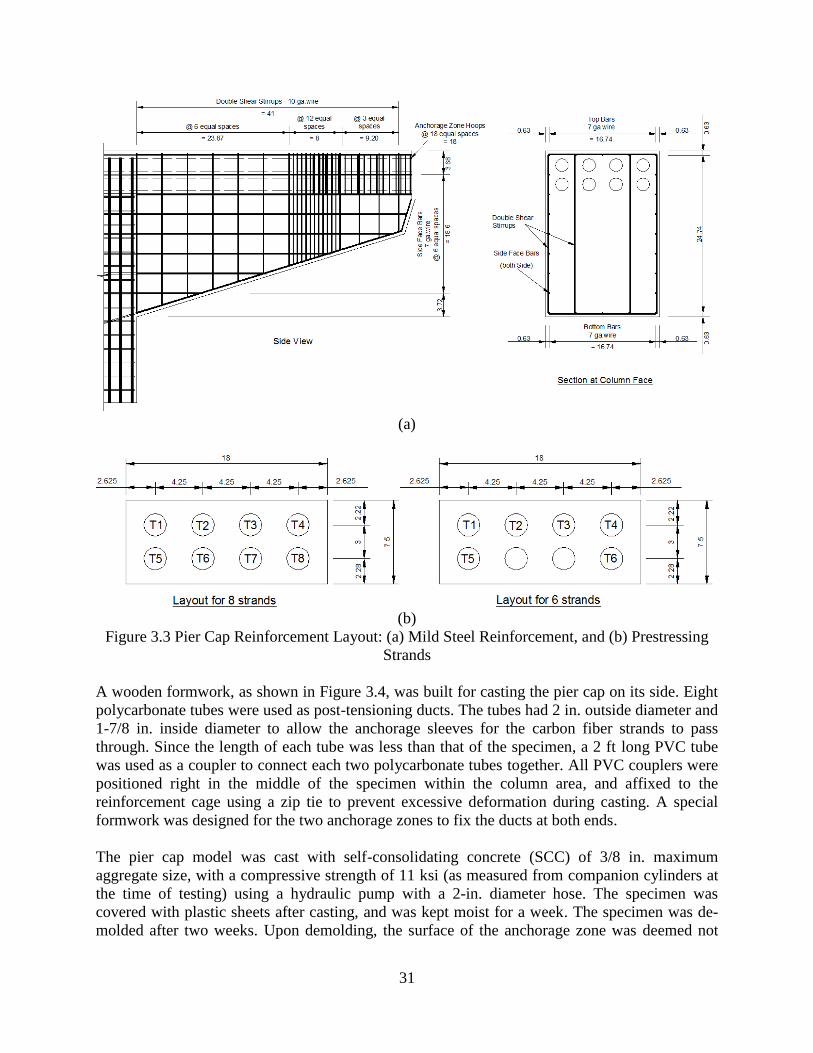
31
(a)
(b)
Figure 3.3 Pier Cap Reinforcement Layout: (a) Mild Steel Reinforcement, and (b) Prestressing
Strands
A wooden formwork, as shown in Figure 3.4, was built for casting the pier cap on its side. Eight
polycarbonate tubes were used as post-tensioning ducts. The tubes had 2 in. outside diameter and
1-7/8 in. inside diameter to allow the anchorage sleeves for the carbon fiber strands to pass
through. Since the length of each tube was less than that of the specimen, a 2 ft long PVC tube
was used as a coupler to connect each two polycarbonate tubes together. All PVC couplers were
positioned right in the middle of the specimen within the column area, and affixed to the
reinforcement cage using a zip tie to prevent excessive deformation during casting. A special
formwork was designed for the two anchorage zones to fix the ducts at both ends.
The pier cap model was cast with self-consolidating concrete (SCC) of 3/8 in. maximum
aggregate size, with a compressive strength of 11 ksi (as measured from companion cylinders at
the time of testing) using a hydraulic pump with a 2-in. diameter hose. The specimen was
covered with plastic sheets after casting, and was kept moist for a week. The specimen was de-
molded after two weeks. Upon demolding, the surface of the anchorage zone was deemed not
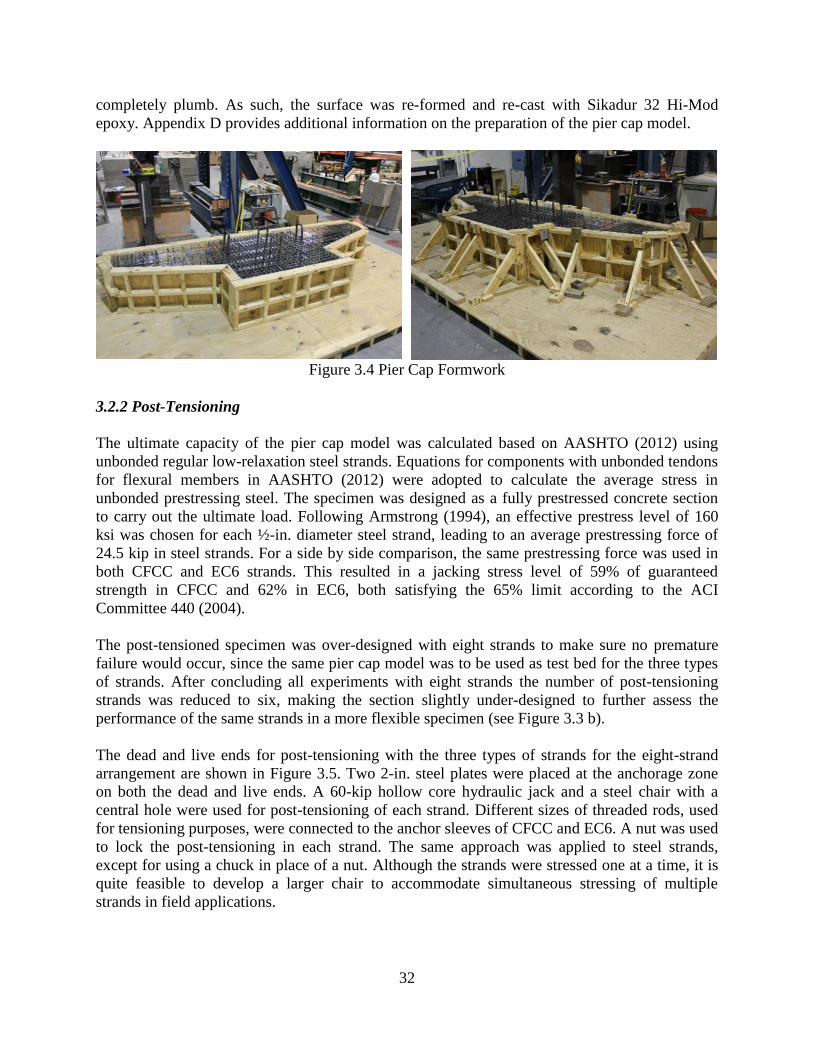
32
completely plumb. As such, the surface was re-formed and re-cast with Sikadur 32 Hi-Mod
epoxy. Appendix D provides additional information on the preparation of the pier cap model.
Figure 3.4 Pier Cap Formwork
3.2.2 Post-Tensioning
The ultimate capacity of the pier cap model was calculated based on AASHTO (2012) using
unbonded regular low-relaxation steel strands. Equations for components with unbonded tendons
for flexural members in AASHTO (2012) were adopted to calculate the average stress in
unbonded prestressing steel. The specimen was designed as a fully prestressed concrete section
to carry out the ultimate load. Following Armstrong (1994), an effective prestress level of 160
ksi was chosen for each ½-in. diameter steel strand, leading to an average prestressing force of
24.5 kip in steel strands. For a side by side comparison, the same prestressing force was used in
both CFCC and EC6 strands. This resulted in a jacking stress level of 59% of guaranteed
strength in CFCC and 62% in EC6, both satisfying the 65% limit according to the ACI
Committee 440 (2004).
The post-tensioned specimen was over-designed with eight strands to make sure no premature
failure would occur, since the same pier cap model was to be used as test bed for the three types
of strands. After concluding all experiments with eight strands the number of post-tensioning
strands was reduced to six, making the section slightly under-designed to further assess the
performance of the same strands in a more flexible specimen (see Figure 3.3 b).
The dead and live ends for post-tensioning with the three types of strands for the eight-strand
arrangement are shown in Figure 3.5. Two 2-in. steel plates were placed at the anchorage zone
on both the dead and live ends. A 60-kip hollow core hydraulic jack and a steel chair with a
central hole were used for post-tensioning of each strand. Different sizes of threaded rods, used
for tensioning purposes, were connected to the anchor sleeves of CFCC and EC6. A nut was used
to lock the post-tensioning in each strand. The same approach was applied to steel strands,
except for using a chuck in place of a nut. Although the strands were stressed one at a time, it is
quite feasible to develop a larger chair to accommodate simultaneous stressing of multiple
strands in field applications.
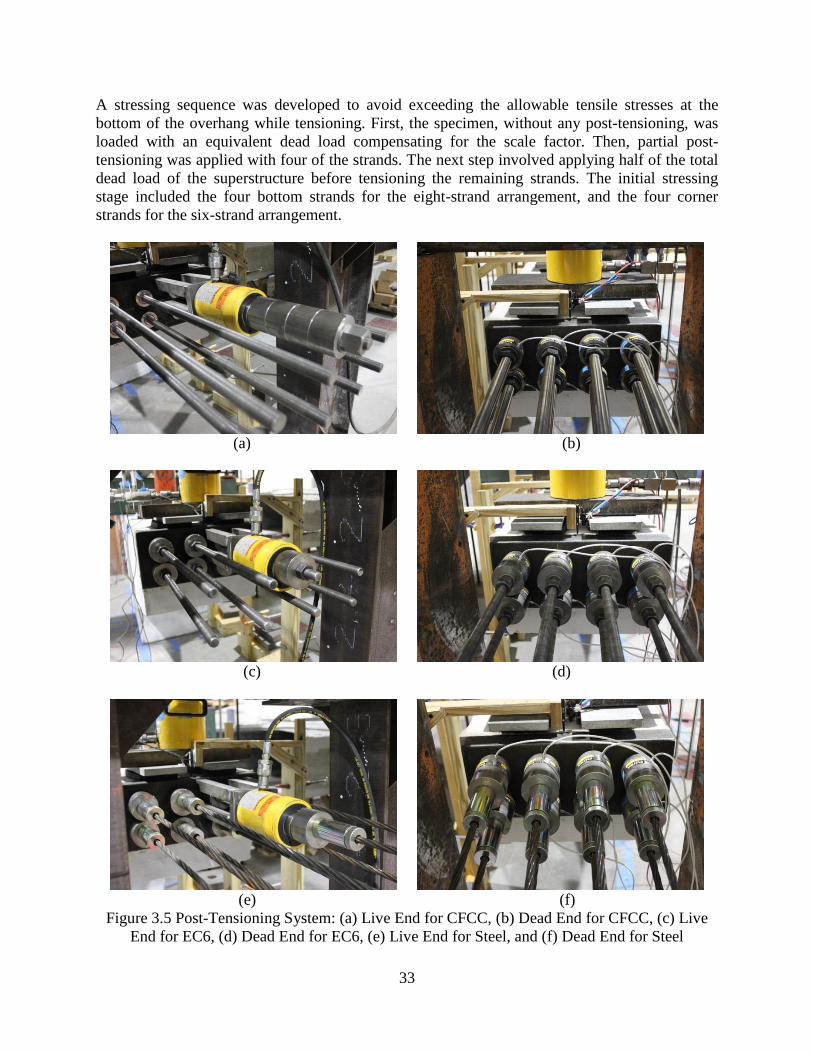
33
A stressing sequence was developed to avoid exceeding the allowable tensile stresses at the
bottom of the overhang while tensioning. First, the specimen, without any post-tensioning, was
loaded with an equivalent dead load compensating for the scale factor. Then, partial post-
tensioning was applied with four of the strands. The next step involved applying half of the total
dead load of the superstructure before tensioning the remaining strands. The initial stressing
stage included the four bottom strands for the eight-strand arrangement, and the four corner
strands for the six-strand arrangement.
(a) (b)
(c) (d)
(e) (f)
Figure 3.5 Post-Tensioning System: (a) Live End for CFCC, (b) Dead End for CFCC, (c) Live
End for EC6, (d) Dead End for EC6, (e) Live End for Steel, and (f) Dead End for Steel
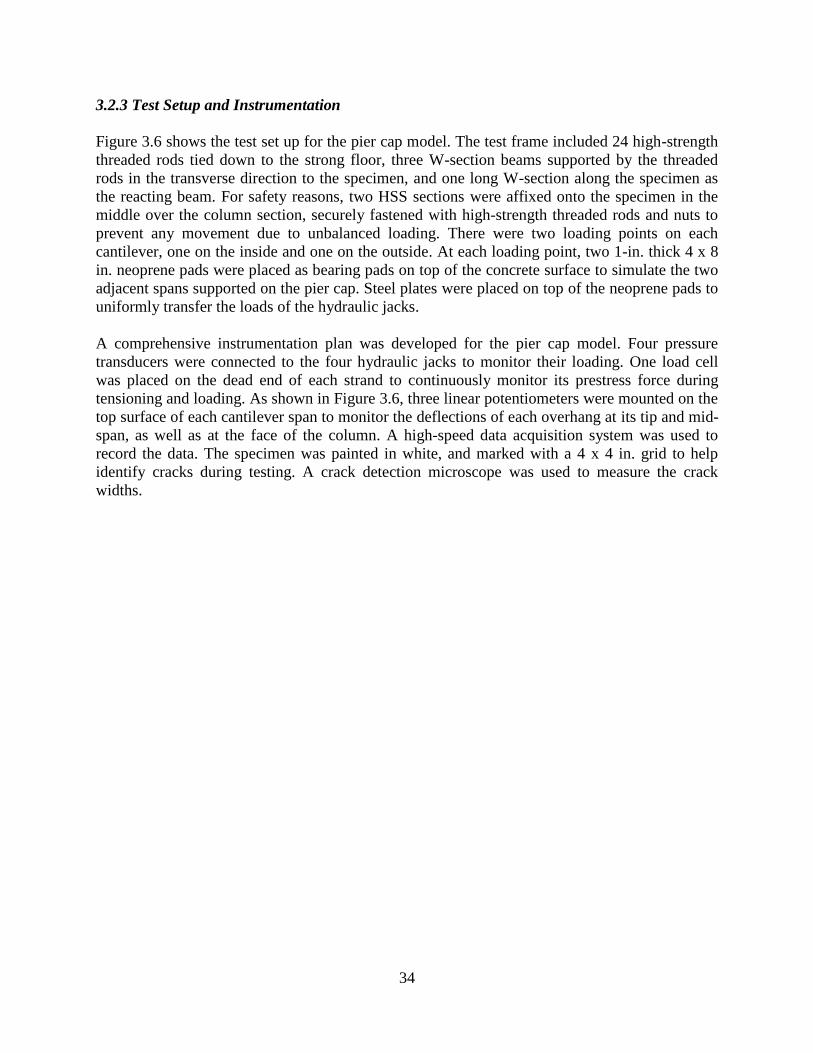
34
3.2.3 Test Setup and Instrumentation
Figure 3.6 shows the test set up for the pier cap model. The test frame included 24 high-strength
threaded rods tied down to the strong floor, three W-section beams supported by the threaded
rods in the transverse direction to the specimen, and one long W-section along the specimen as
the reacting beam. For safety reasons, two HSS sections were affixed onto the specimen in the
middle over the column section, securely fastened with high-strength threaded rods and nuts to
prevent any movement due to unbalanced loading. There were two loading points on each
cantilever, one on the inside and one on the outside. At each loading point, two 1-in. thick 4 x 8
in. neoprene pads were placed as bearing pads on top of the concrete surface to simulate the two
adjacent spans supported on the pier cap. Steel plates were placed on top of the neoprene pads to
uniformly transfer the loads of the hydraulic jacks.
A comprehensive instrumentation plan was developed for the pier cap model. Four pressure
transducers were connected to the four hydraulic jacks to monitor their loading. One load cell
was placed on the dead end of each strand to continuously monitor its prestress force during
tensioning and loading. As shown in Figure 3.6, three linear potentiometers were mounted on the
top surface of each cantilever span to monitor the deflections of each overhang at its tip and mid-
span, as well as at the face of the column. A high-speed data acquisition system was used to
record the data. The specimen was painted in white, and marked with a 4 x 4 in. grid to help
identify cracks during testing. A crack detection microscope was used to measure the crack
widths.
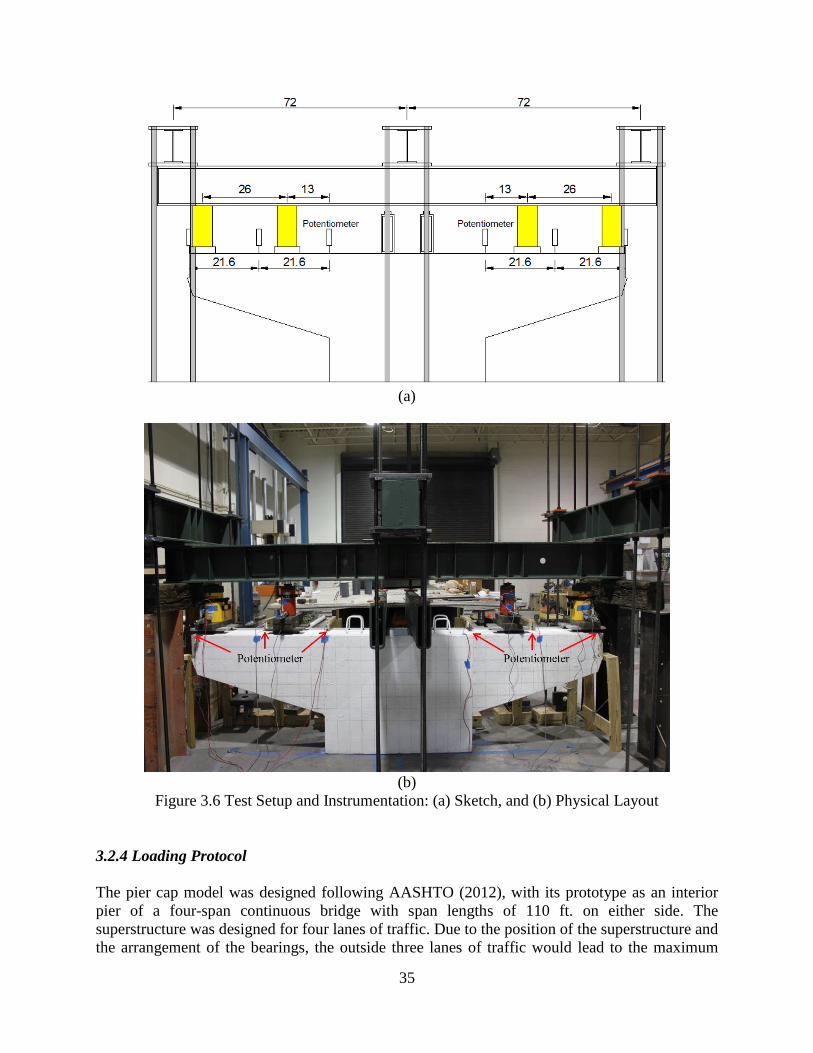
35
(a)
(b)
Figure 3.6 Test Setup and Instrumentation: (a) Sketch, and (b) Physical Layout
3.2.4 Loading Protocol
The pier cap model was designed following AASHTO (2012), with its prototype as an interior
pier of a four-span continuous bridge with span lengths of 110 ft. on either side. The
superstructure was designed for four lanes of traffic. Due to the position of the superstructure and
the arrangement of the bearings, the outside three lanes of traffic would lead to the maximum
36
moment at the face of the column, whereas the four lanes of traffic would maximize the shear at
the face of the column. Two design trucks were placed in adjacent spans, with 50 ft. of spacing
between the rear axle of one truck and the front axle of the other one. A total of 90% of the effect
of the two design trucks and 90% of the effect caused by the lane loading were used to calculate
the reaction at the interior pier. Since the specimen was a scaled model of the prototype, the scale
factor was taken into account for live load calculations as well as self-weight dead load
compensation. The dead load compensation was simulated by 1.47 kip at the outside loading
points and 4.47 kip at the inside loading points. Table 3.1 summarizes target loads and moments
at different stages of loading.
The pier cap model was tested with two different strand arrangements, as explained before. For
each arrangement, the sequence of testing was CFCC, EC6, and steel strands. The model with
the eight-strand arrangement underwent four loading steps; service flexure, service shear,
factored flexure, and factored shear load. On the other hand, since the model with the six-strand
arrangement was under-designed, it was subjected to service flexure, service shear, and only 93%
of the factored flexure load. The reason for terminating the tests at 93% of the target factored
flexure load was because the width of existing crack No. 1 became quite large at that load level
during the first set of tests with six strands. Therefore, the test was stopped at that level to avoid
catastrophic damages, which might have otherwise rendered the specimen unusable for the
remaining tests. All subsequent tests with the six-strand arrangement were stopped at the same
load level to compare the behaviors. Loading was applied by two pairs of hydraulic jacks, 120
and 100 kip at the outside and inside loading points, respectively. Each pair of jacks was inter-
connected to a single hydraulic pump to ensure symmetric loading of the two overhangs. For
each target load, loads in the outside jacks were increased in increments of 4 kip, while loads in
the inside jacks were increased linearly and proportionally. Upon reaching each target level, the
model was unloaded back to the dead load, before reloading it to the next target load.
Table 3.1 AASHTO LRFD Design and Test Loads
Outside Point Load
(kip)
Inside Point Load
(kip)
Moment at Face of Column*
(kip∙in)
Self-Weight Compensation 1.47 4.47 141
Superstructure Dead Load 40.5 43.5 2,170
Service Load for Flexure 66.4 35.8 3,080
Service Load for Shear 49.8 52.8 2,650
Factored Load for Flexure 95.6 39.7 4,270
Factored Load for Shear 66.5 69.5 3,520
* Moment at face of column includes self-weight of the specimen.
37
3.3 Test Results and Discussions
Table 3.2 shows the theoretical ultimate capacity of the pier cap using three types of strands in
two different strand arrangements. The capacities of the pier cap with CFCC and EC6 strands,
calculated based on ACI 440 for unbonded tendons, were grossly under-estimated relative to the
tested factored load. The capacity of the pier cap with steel strands, on the other hand, more
accurately reflected the tested values. Although not tested to failure, the expected mode of failure
for the section post-tensioned using steel strands was crushing of concrete. The factored moment
for the pier cap model was calculated as 4,270 kip·in, based on AASHTO (2012). The first set of
loading tests was conducted with the full eight-strand arrangement, for which the ultimate
moment capacity of the pier cap model using steel strands was estimated as 5,433 kip·in, or 27%
above the demand. After finishing the experiments with the over-designed section, the second set
of loading tests was conducted with the six-strand arrangement, for which the ultimate moment
capacity of the pier cap model was estimated as 4,210 kip·in, or 1.5% below the demand.
Table 3.2 Theoretical Ultimate Capacity of the Pier Cap
CFCC (kip·in) EC6 (kip·in) Steel (kip·in)
8 Strands Layout 3,647 3,663 5,433
6 Strands Layout 2,828 2,846 4,210
Figures 3.7 (a) – (c) show the relationships between the moment at the face of the column and
the average tip deflections of the two overhangs, for CFCC, EC6, and steel strands. Each figure
shows two response curves for the eight-strand and six-strand arrangements. The figures show
the initial fluctuations of the tip deflection for all three types of strands, caused by the stressing
sequence, as described earlier. The figures also demonstrate that the camber for the six-strand
arrangement was more than that for the eight-strand arrangement for all three types of strands.
This may be attributed to the geometric arrangement of the strands. There were two rows of four
strands for the over-designed section, whereas the under-designed section had two center strands
missing on the bottom row. As described earlier, to avoid exceeding allowable tensile stresses at
the bottom of the overhang, a two-stage stressing sequence was devised. The initial stressing
stage included the four bottom strands for the eight-strand arrangement, and the four corner
strands for the six-strand arrangement. Therefore, a larger moment and a larger corresponding
camber were developed for the under-designed specimen at the initial tensioning stage.
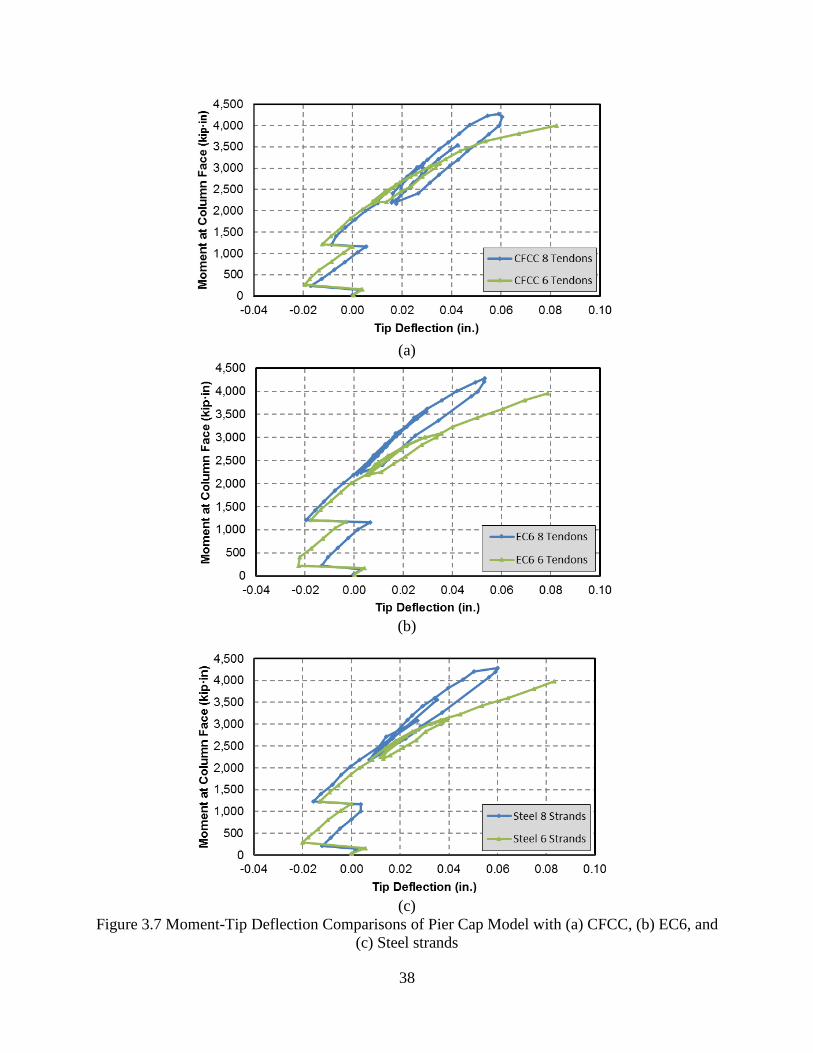
38
(a)
(b)
(c)
Figure 3.7 Moment-Tip Deflection Comparisons of Pier Cap Model with (a) CFCC, (b) EC6, and
(c) Steel strands
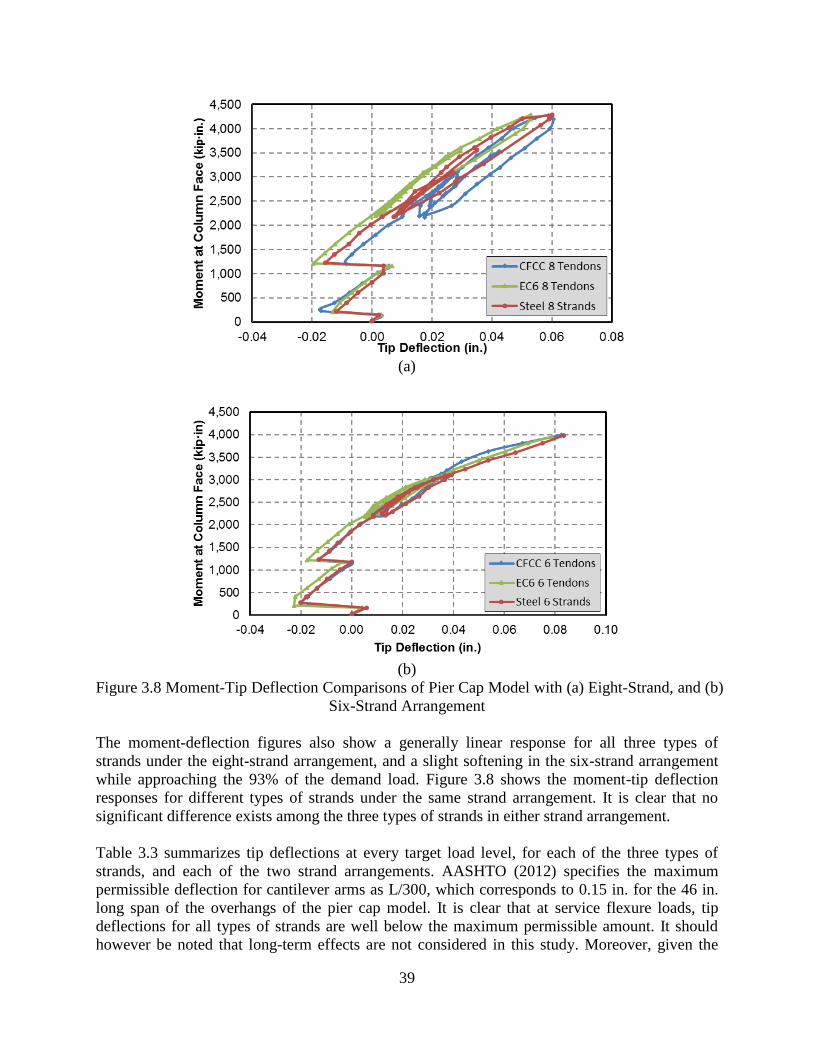
39
(a)
(b)
Figure 3.8 Moment-Tip Deflection Comparisons of Pier Cap Model with (a) Eight-Strand, and (b)
Six-Strand Arrangement
The moment-deflection figures also show a generally linear response for all three types of
strands under the eight-strand arrangement, and a slight softening in the six-strand arrangement
while approaching the 93% of the demand load. Figure 3.8 shows the moment-tip deflection
responses for different types of strands under the same strand arrangement. It is clear that no
significant difference exists among the three types of strands in either strand arrangement.
Table 3.3 summarizes tip deflections at every target load level, for each of the three types of
strands, and each of the two strand arrangements. AASHTO (2012) specifies the maximum
permissible deflection for cantilever arms as L/300, which corresponds to 0.15 in. for the 46 in.
long span of the overhangs of the pier cap model. It is clear that at service flexure loads, tip
deflections for all types of strands are well below the maximum permissible amount. It should
however be noted that long-term effects are not considered in this study. Moreover, given the
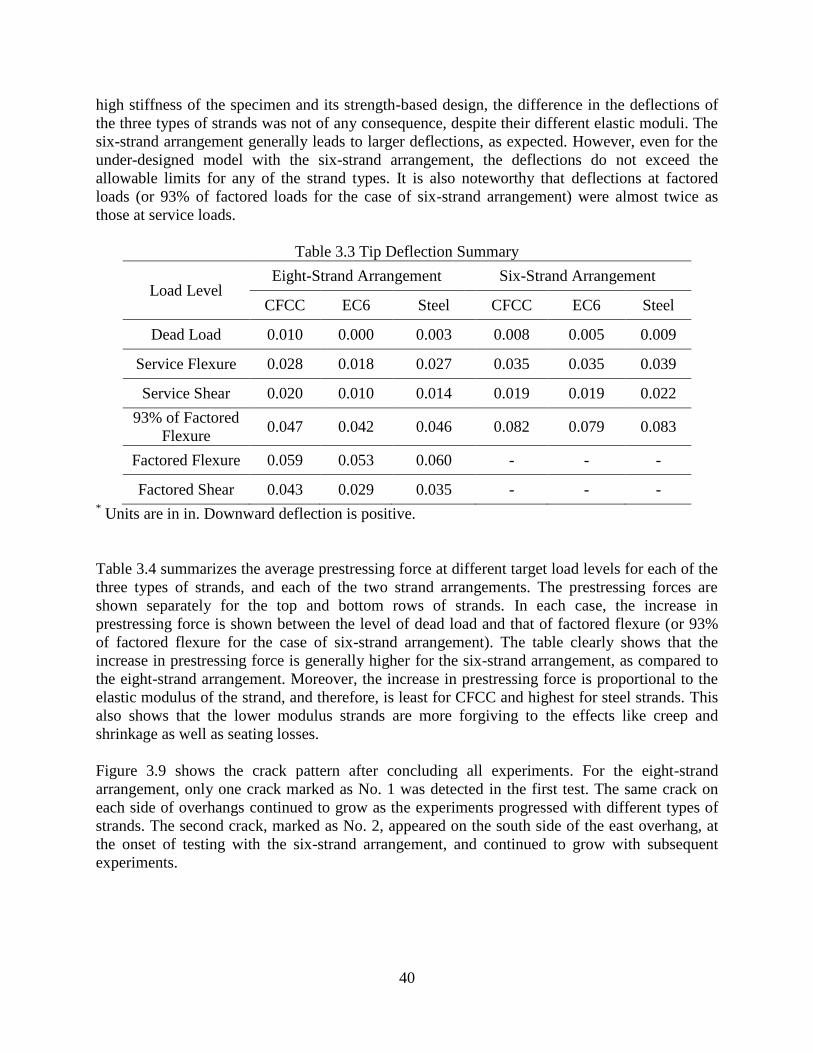
40
high stiffness of the specimen and its strength-based design, the difference in the deflections of
the three types of strands was not of any consequence, despite their different elastic moduli. The
six-strand arrangement generally leads to larger deflections, as expected. However, even for the
under-designed model with the six-strand arrangement, the deflections do not exceed the
allowable limits for any of the strand types. It is also noteworthy that deflections at factored
loads (or 93% of factored loads for the case of six-strand arrangement) were almost twice as
those at service loads.
Table 3.3 Tip Deflection Summary
Load Level Eight-Strand Arrangement Six-Strand Arrangement
CFCC EC6 Steel CFCC EC6 Steel
Dead Load 0.010 0.000 0.003 0.008 0.005 0.009
Service Flexure 0.028 0.018 0.027 0.035 0.035 0.039
Service Shear 0.020 0.010 0.014 0.019 0.019 0.022
93% of Factored
Flexure 0.047 0.042 0.046 0.082 0.079 0.083
Factored Flexure 0.059 0.053 0.060 - - -
Factored Shear 0.043 0.029 0.035 - - - * Units are in in. Downward deflection is positive.
Table 3.4 summarizes the average prestressing force at different target load levels for each of the
three types of strands, and each of the two strand arrangements. The prestressing forces are
shown separately for the top and bottom rows of strands. In each case, the increase in
prestressing force is shown between the level of dead load and that of factored flexure (or 93%
of factored flexure for the case of six-strand arrangement). The table clearly shows that the
increase in prestressing force is generally higher for the six-strand arrangement, as compared to
the eight-strand arrangement. Moreover, the increase in prestressing force is proportional to the
elastic modulus of the strand, and therefore, is least for CFCC and highest for steel strands. This
also shows that the lower modulus strands are more forgiving to the effects like creep and
shrinkage as well as seating losses.
Figure 3.9 shows the crack pattern after concluding all experiments. For the eight-strand
arrangement, only one crack marked as No. 1 was detected in the first test. The same crack on
each side of overhangs continued to grow as the experiments progressed with different types of
strands. The second crack, marked as No. 2, appeared on the south side of the east overhang, at
the onset of testing with the six-strand arrangement, and continued to grow with subsequent
experiments.
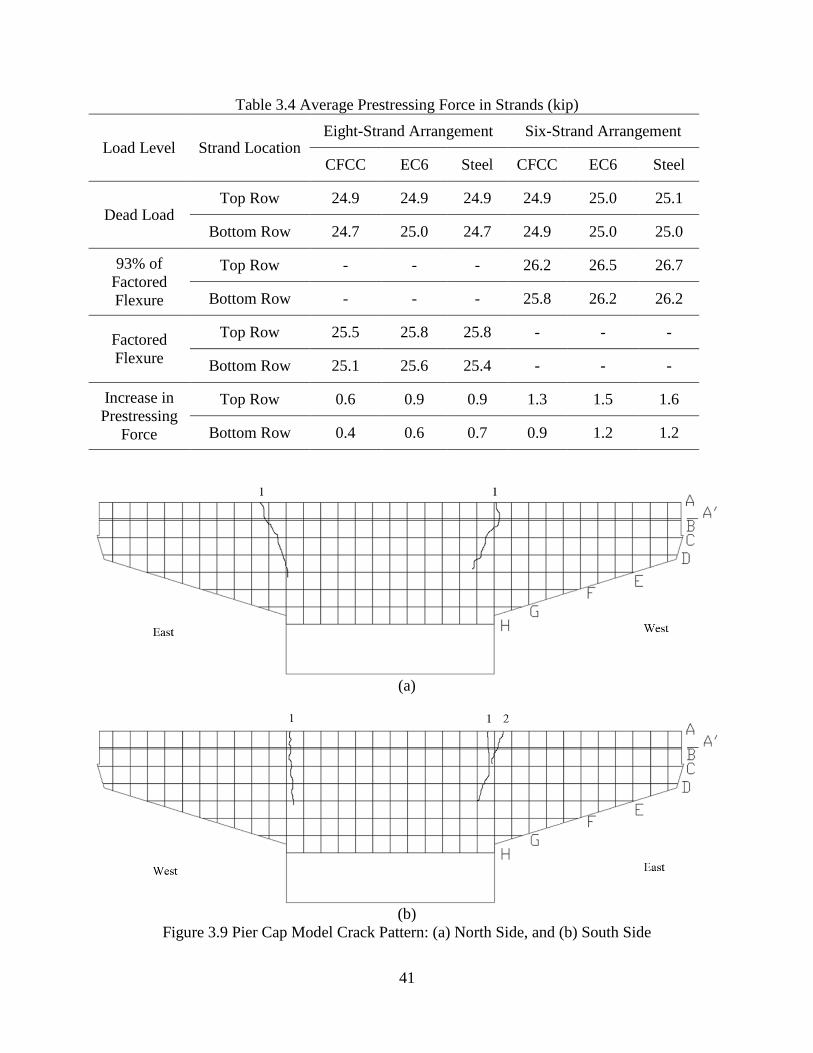
41
Table 3.4 Average Prestressing Force in Strands (kip)
Load Level Strand Location Eight-Strand Arrangement Six-Strand Arrangement
CFCC EC6 Steel CFCC EC6 Steel
Dead Load Top Row 24.9 24.9 24.9 24.9 25.0 25.1
Bottom Row 24.7 25.0 24.7 24.9 25.0 25.0
93% of
Factored
Flexure
Top Row - - - 26.2 26.5 26.7
Bottom Row - - - 25.8 26.2 26.2
Factored
Flexure
Top Row 25.5 25.8 25.8 - - -
Bottom Row 25.1 25.6 25.4 - - -
Increase in
Prestressing
Force
Top Row 0.6 0.9 0.9 1.3 1.5 1.6
Bottom Row 0.4 0.6 0.7 0.9 1.2 1.2
(a)
(b)
Figure 3.9 Pier Cap Model Crack Pattern: (a) North Side, and (b) South Side
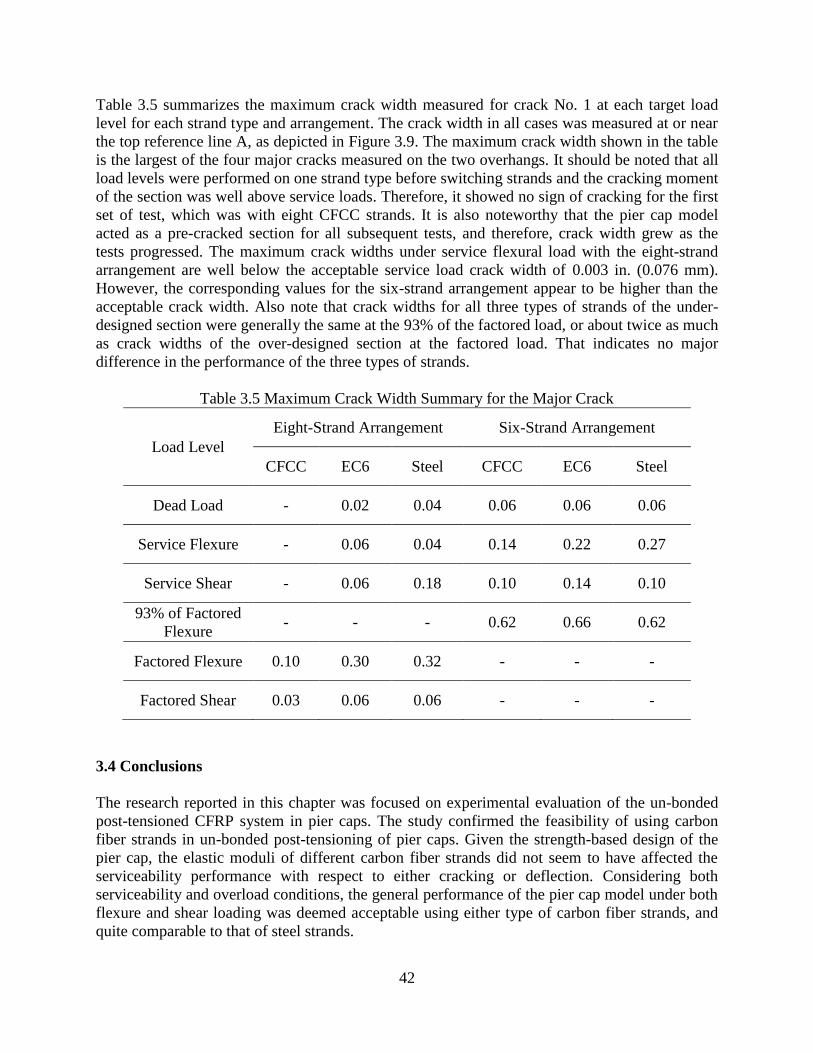
42
Table 3.5 summarizes the maximum crack width measured for crack No. 1 at each target load
level for each strand type and arrangement. The crack width in all cases was measured at or near
the top reference line A, as depicted in Figure 3.9. The maximum crack width shown in the table
is the largest of the four major cracks measured on the two overhangs. It should be noted that all
load levels were performed on one strand type before switching strands and the cracking moment
of the section was well above service loads. Therefore, it showed no sign of cracking for the first
set of test, which was with eight CFCC strands. It is also noteworthy that the pier cap model
acted as a pre-cracked section for all subsequent tests, and therefore, crack width grew as the
tests progressed. The maximum crack widths under service flexural load with the eight-strand
arrangement are well below the acceptable service load crack width of 0.003 in. (0.076 mm).
However, the corresponding values for the six-strand arrangement appear to be higher than the
acceptable crack width. Also note that crack widths for all three types of strands of the under-
designed section were generally the same at the 93% of the factored load, or about twice as much
as crack widths of the over-designed section at the factored load. That indicates no major
difference in the performance of the three types of strands.
Table 3.5 Maximum Crack Width Summary for the Major Crack
Load Level
Eight-Strand Arrangement Six-Strand Arrangement
CFCC EC6 Steel CFCC EC6 Steel
Dead Load - 0.02 0.04 0.06 0.06 0.06
Service Flexure - 0.06 0.04 0.14 0.22 0.27
Service Shear - 0.06 0.18 0.10 0.14 0.10
93% of Factored
Flexure - - - 0.62 0.66 0.62
Factored Flexure 0.10 0.30 0.32 - - -
Factored Shear 0.03 0.06 0.06 - - -
3.4 Conclusions
The research reported in this chapter was focused on experimental evaluation of the un-bonded
post-tensioned CFRP system in pier caps. The study confirmed the feasibility of using carbon
fiber strands in un-bonded post-tensioning of pier caps. Given the strength-based design of the
pier cap, the elastic moduli of different carbon fiber strands did not seem to have affected the
serviceability performance with respect to either cracking or deflection. Considering both
serviceability and overload conditions, the general performance of the pier cap model under both
flexure and shear loading was deemed acceptable using either type of carbon fiber strands, and
quite comparable to that of steel strands.
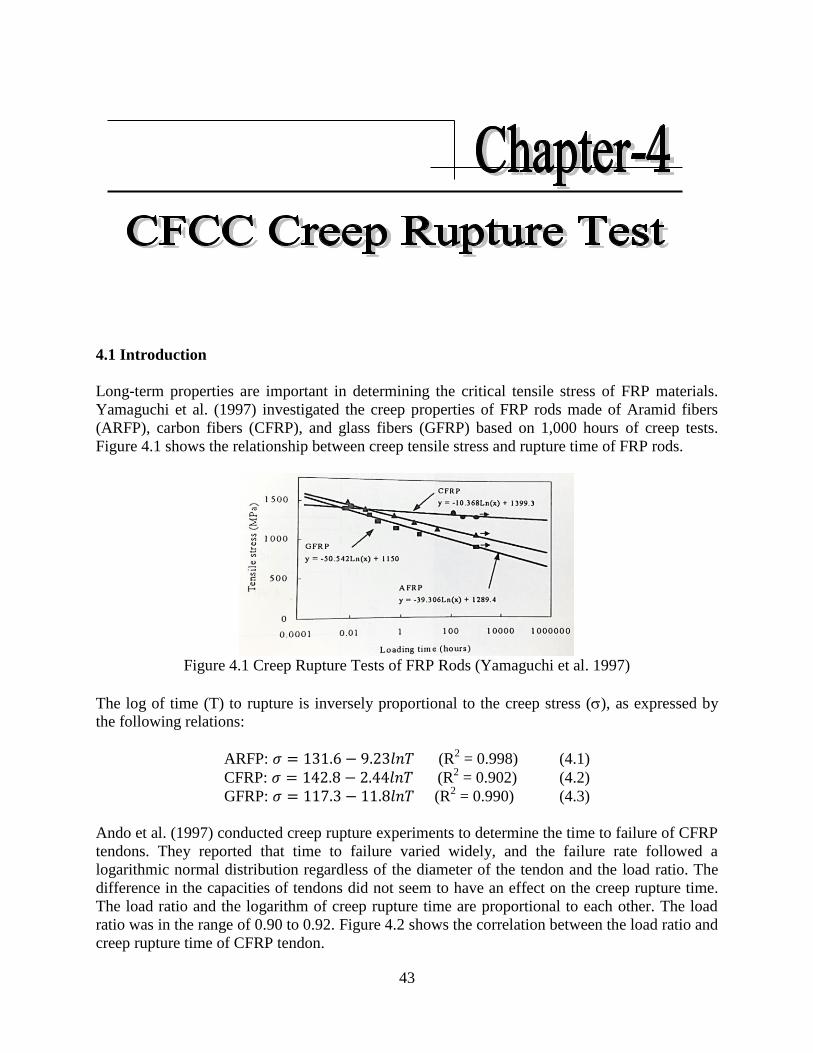
43
Chapter 4 CFCC Creep Rupture Test 4.1 Introduction
Long-term properties are important in determining the critical tensile stress of FRP materials.
Yamaguchi et al. (1997) investigated the creep properties of FRP rods made of Aramid fibers
(ARFP), carbon fibers (CFRP), and glass fibers (GFRP) based on 1,000 hours of creep tests.
Figure 4.1 shows the relationship between creep tensile stress and rupture time of FRP rods.
Figure 4.1 Creep Rupture Tests of FRP Rods (Yamaguchi et al. 1997)
The log of time (T) to rupture is inversely proportional to the creep stress (), as expressed by
the following relations:
ARFP: 𝜎 = 131.6 − 9.23𝑙𝑛𝑇 (R2 = 0.998) (4.1)
CFRP: 𝜎 = 142.8 − 2.44𝑙𝑛𝑇 (R2 = 0.902) (4.2)
GFRP: 𝜎 = 117.3 − 11.8𝑙𝑛𝑇 (R2 = 0.990) (4.3)
Ando et al. (1997) conducted creep rupture experiments to determine the time to failure of CFRP
tendons. They reported that time to failure varied widely, and the failure rate followed a
logarithmic normal distribution regardless of the diameter of the tendon and the load ratio. The
difference in the capacities of tendons did not seem to have an effect on the creep rupture time.
The load ratio and the logarithm of creep rupture time are proportional to each other. The load
ratio was in the range of 0.90 to 0.92. Figure 4.2 shows the correlation between the load ratio and
creep rupture time of CFRP tendon.
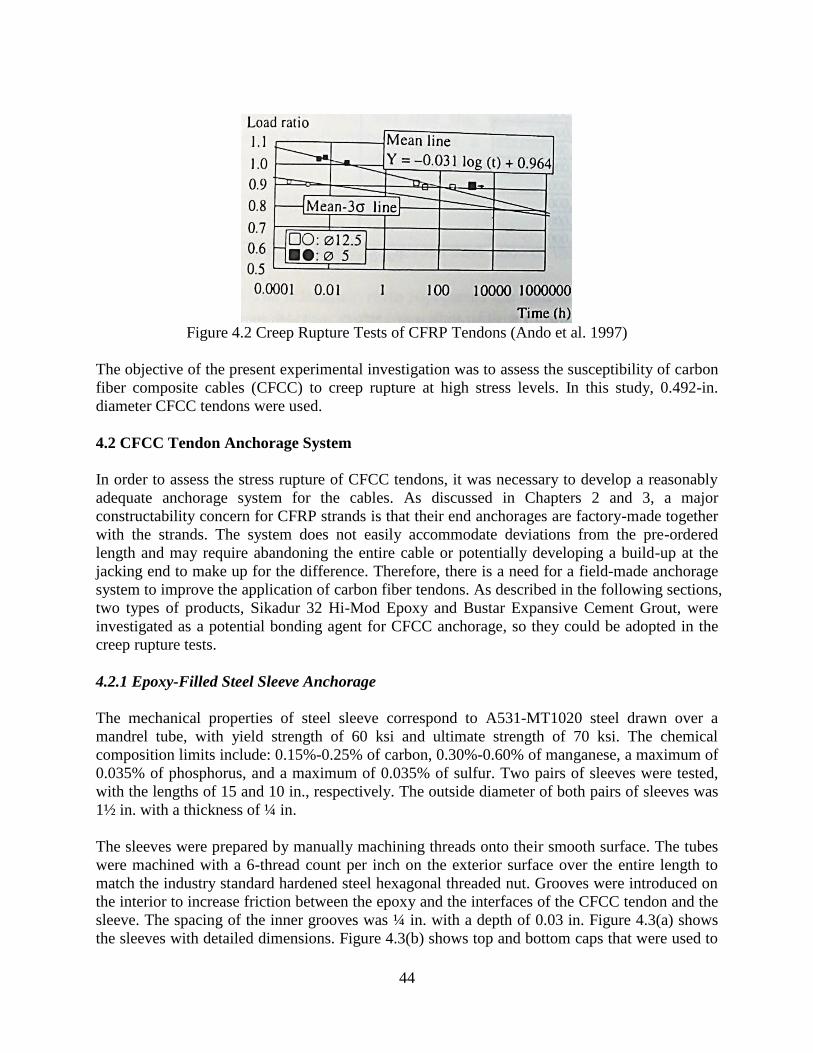
44
Figure 4.2 Creep Rupture Tests of CFRP Tendons (Ando et al. 1997)
The objective of the present experimental investigation was to assess the susceptibility of carbon
fiber composite cables (CFCC) to creep rupture at high stress levels. In this study, 0.492-in.
diameter CFCC tendons were used.
4.2 CFCC Tendon Anchorage System
In order to assess the stress rupture of CFCC tendons, it was necessary to develop a reasonably
adequate anchorage system for the cables. As discussed in Chapters 2 and 3, a major
constructability concern for CFRP strands is that their end anchorages are factory-made together
with the strands. The system does not easily accommodate deviations from the pre-ordered
length and may require abandoning the entire cable or potentially developing a build-up at the
jacking end to make up for the difference. Therefore, there is a need for a field-made anchorage
system to improve the application of carbon fiber tendons. As described in the following sections,
two types of products, Sikadur 32 Hi-Mod Epoxy and Bustar Expansive Cement Grout, were
investigated as a potential bonding agent for CFCC anchorage, so they could be adopted in the
creep rupture tests.
4.2.1 Epoxy-Filled Steel Sleeve Anchorage
The mechanical properties of steel sleeve correspond to A531-MT1020 steel drawn over a
mandrel tube, with yield strength of 60 ksi and ultimate strength of 70 ksi. The chemical
composition limits include: 0.15%-0.25% of carbon, 0.30%-0.60% of manganese, a maximum of
0.035% of phosphorus, and a maximum of 0.035% of sulfur. Two pairs of sleeves were tested,
with the lengths of 15 and 10 in., respectively. The outside diameter of both pairs of sleeves was
1½ in. with a thickness of ¼ in.
The sleeves were prepared by manually machining threads onto their smooth surface. The tubes
were machined with a 6-thread count per inch on the exterior surface over the entire length to
match the industry standard hardened steel hexagonal threaded nut. Grooves were introduced on
the interior to increase friction between the epoxy and the interfaces of the CFCC tendon and the
sleeve. The spacing of the inner grooves was ¼ in. with a depth of 0.03 in. Figure 4.3(a) shows
the sleeves with detailed dimensions. Figure 4.3(b) shows top and bottom caps that were used to
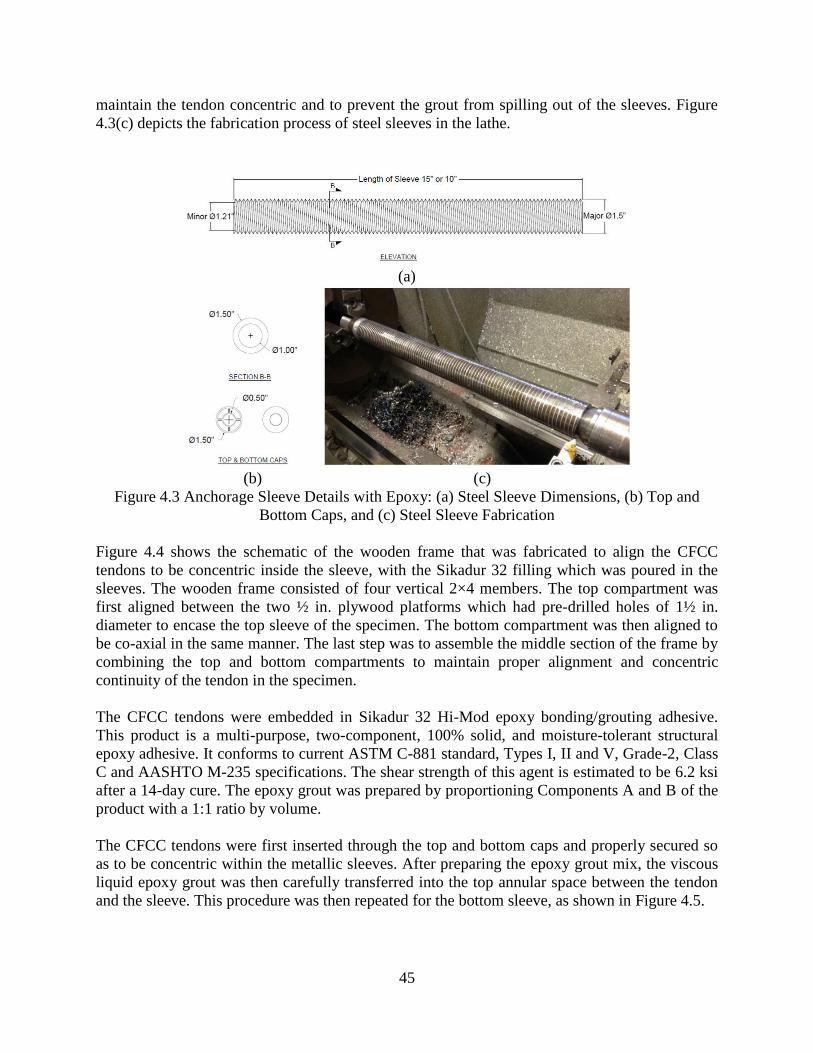
45
maintain the tendon concentric and to prevent the grout from spilling out of the sleeves. Figure
4.3(c) depicts the fabrication process of steel sleeves in the lathe.
(a)
(b) (c)
Figure 4.3 Anchorage Sleeve Details with Epoxy: (a) Steel Sleeve Dimensions, (b) Top and
Bottom Caps, and (c) Steel Sleeve Fabrication
Figure 4.4 shows the schematic of the wooden frame that was fabricated to align the CFCC
tendons to be concentric inside the sleeve, with the Sikadur 32 filling which was poured in the
sleeves. The wooden frame consisted of four vertical 2×4 members. The top compartment was
first aligned between the two ½ in. plywood platforms which had pre-drilled holes of 1½ in.
diameter to encase the top sleeve of the specimen. The bottom compartment was then aligned to
be co-axial in the same manner. The last step was to assemble the middle section of the frame by
combining the top and bottom compartments to maintain proper alignment and concentric
continuity of the tendon in the specimen.
The CFCC tendons were embedded in Sikadur 32 Hi-Mod epoxy bonding/grouting adhesive.
This product is a multi-purpose, two-component, 100% solid, and moisture-tolerant structural
epoxy adhesive. It conforms to current ASTM C-881 standard, Types I, II and V, Grade-2, Class
C and AASHTO M-235 specifications. The shear strength of this agent is estimated to be 6.2 ksi
after a 14-day cure. The epoxy grout was prepared by proportioning Components A and B of the
product with a 1:1 ratio by volume.
The CFCC tendons were first inserted through the top and bottom caps and properly secured so
as to be concentric within the metallic sleeves. After preparing the epoxy grout mix, the viscous
liquid epoxy grout was then carefully transferred into the top annular space between the tendon
and the sleeve. This procedure was then repeated for the bottom sleeve, as shown in Figure 4.5.
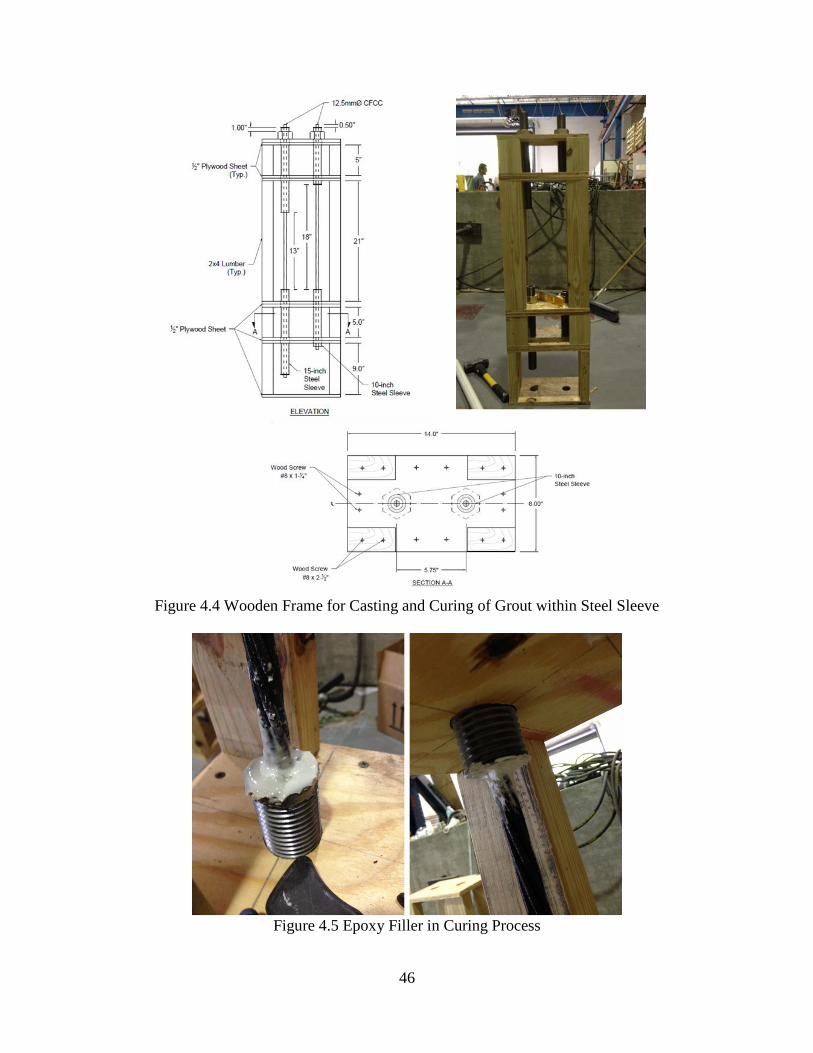
46
Figure 4.4 Wooden Frame for Casting and Curing of Grout within Steel Sleeve
Figure 4.5 Epoxy Filler in Curing Process
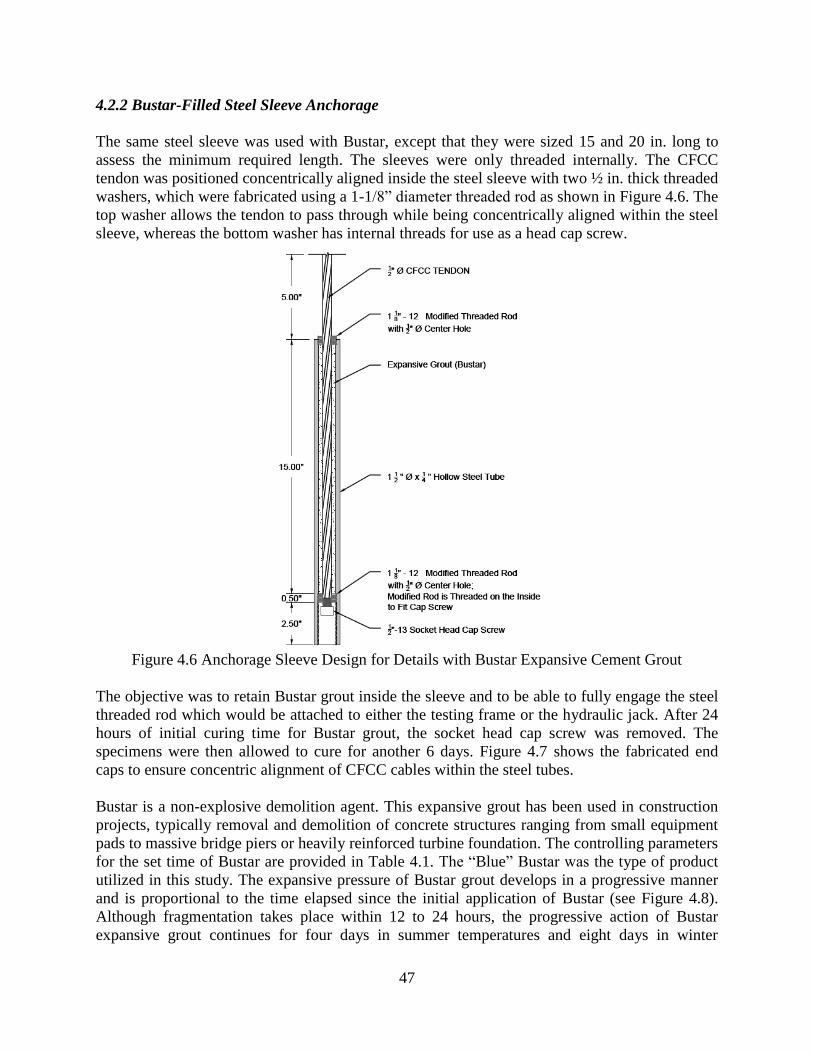
47
4.2.2 Bustar-Filled Steel Sleeve Anchorage
The same steel sleeve was used with Bustar, except that they were sized 15 and 20 in. long to
assess the minimum required length. The sleeves were only threaded internally. The CFCC
tendon was positioned concentrically aligned inside the steel sleeve with two ½ in. thick threaded
washers, which were fabricated using a 1-1/8” diameter threaded rod as shown in Figure 4.6. The
top washer allows the tendon to pass through while being concentrically aligned within the steel
sleeve, whereas the bottom washer has internal threads for use as a head cap screw.
Figure 4.6 Anchorage Sleeve Design for Details with Bustar Expansive Cement Grout
The objective was to retain Bustar grout inside the sleeve and to be able to fully engage the steel
threaded rod which would be attached to either the testing frame or the hydraulic jack. After 24
hours of initial curing time for Bustar grout, the socket head cap screw was removed. The
specimens were then allowed to cure for another 6 days. Figure 4.7 shows the fabricated end
caps to ensure concentric alignment of CFCC cables within the steel tubes.
Bustar is a non-explosive demolition agent. This expansive grout has been used in construction
projects, typically removal and demolition of concrete structures ranging from small equipment
pads to massive bridge piers or heavily reinforced turbine foundation. The controlling parameters
for the set time of Bustar are provided in Table 4.1. The “Blue” Bustar was the type of product
utilized in this study. The expansive pressure of Bustar grout develops in a progressive manner
and is proportional to the time elapsed since the initial application of Bustar (see Figure 4.8).
Although fragmentation takes place within 12 to 24 hours, the progressive action of Bustar
expansive grout continues for four days in summer temperatures and eight days in winter
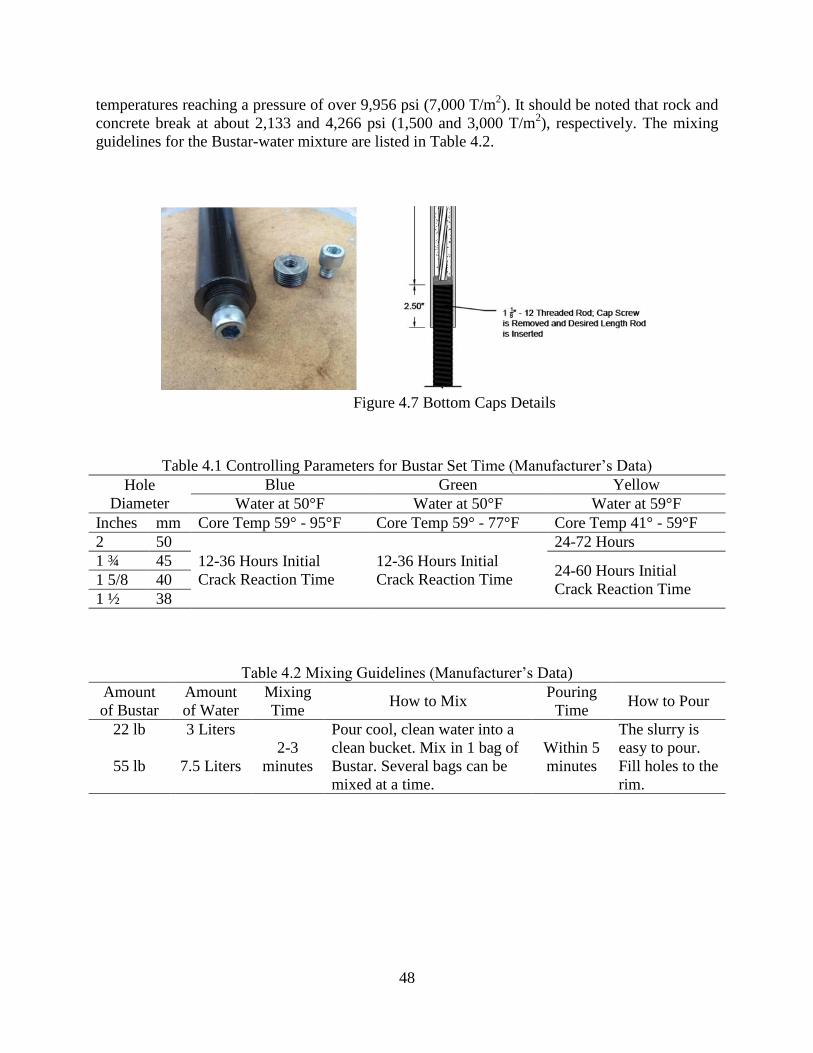
48
temperatures reaching a pressure of over 9,956 psi (7,000 T/m2). It should be noted that rock and
concrete break at about 2,133 and 4,266 psi (1,500 and 3,000 T/m2), respectively. The mixing
guidelines for the Bustar-water mixture are listed in Table 4.2.
Figure 4.7 Bottom Caps Details
Table 4.1 Controlling Parameters for Bustar Set Time (Manufacturer’s Data)
Hole
Diameter
Blue Green Yellow
Water at 50°F Water at 50°F Water at 59°F
Inches mm Core Temp 59° - 95°F Core Temp 59° - 77°F Core Temp 41° - 59°F
2 50
12-36 Hours Initial
Crack Reaction Time
12-36 Hours Initial
Crack Reaction Time
24-72 Hours
1 ¾ 45 24-60 Hours Initial
Crack Reaction Time 1 5/8 40
1 ½ 38
Table 4.2 Mixing Guidelines (Manufacturer’s Data)
Amount
of Bustar
Amount
of Water
Mixing
Time How to Mix
Pouring
Time How to Pour
22 lb 3 Liters
2-3
minutes
Pour cool, clean water into a
clean bucket. Mix in 1 bag of
Bustar. Several bags can be
mixed at a time.
Within 5
minutes
The slurry is
easy to pour.
Fill holes to the
rim.
55 lb 7.5 Liters
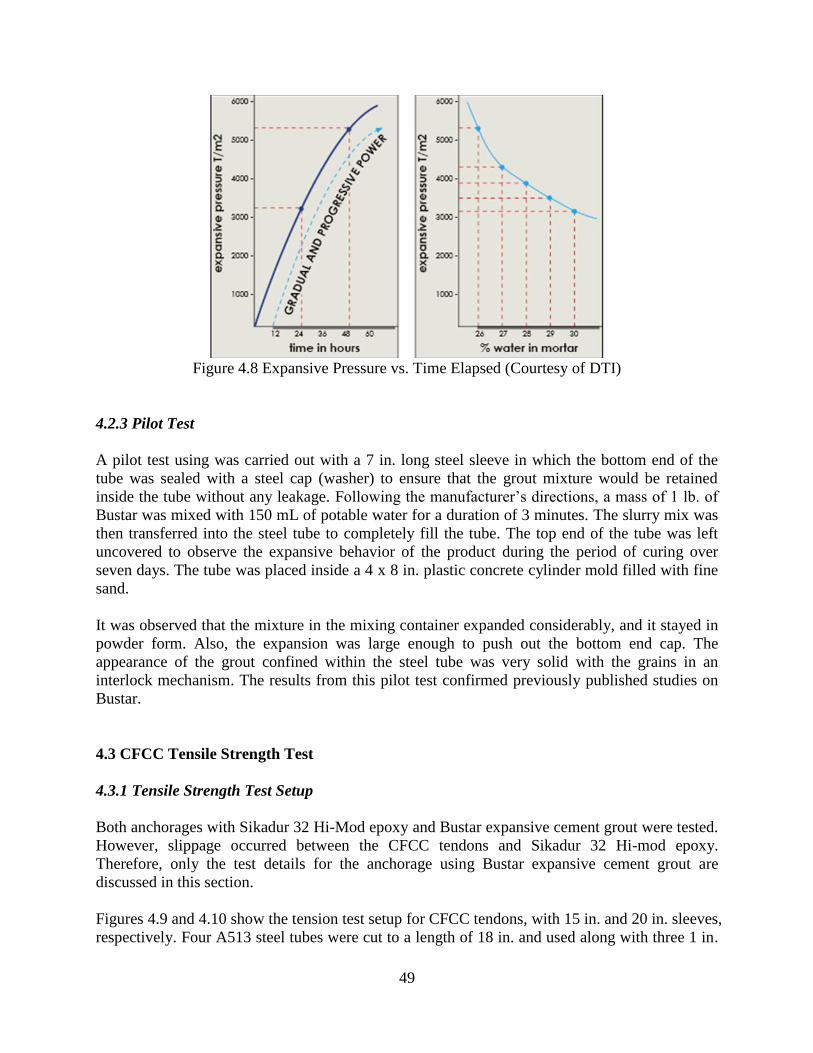
49
Figure 4.8 Expansive Pressure vs. Time Elapsed (Courtesy of DTI)
4.2.3 Pilot Test
A pilot test using was carried out with a 7 in. long steel sleeve in which the bottom end of the
tube was sealed with a steel cap (washer) to ensure that the grout mixture would be retained
inside the tube without any leakage. Following the manufacturer’s directions, a mass of 1 lb. of
Bustar was mixed with 150 mL of potable water for a duration of 3 minutes. The slurry mix was
then transferred into the steel tube to completely fill the tube. The top end of the tube was left
uncovered to observe the expansive behavior of the product during the period of curing over
seven days. The tube was placed inside a 4 x 8 in. plastic concrete cylinder mold filled with fine
sand.
It was observed that the mixture in the mixing container expanded considerably, and it stayed in
powder form. Also, the expansion was large enough to push out the bottom end cap. The
appearance of the grout confined within the steel tube was very solid with the grains in an
interlock mechanism. The results from this pilot test confirmed previously published studies on
Bustar.
4.3 CFCC Tensile Strength Test
4.3.1 Tensile Strength Test Setup
Both anchorages with Sikadur 32 Hi-Mod epoxy and Bustar expansive cement grout were tested.
However, slippage occurred between the CFCC tendons and Sikadur 32 Hi-mod epoxy.
Therefore, only the test details for the anchorage using Bustar expansive cement grout are
discussed in this section.
Figures 4.9 and 4.10 show the tension test setup for CFCC tendons, with 15 in. and 20 in. sleeves,
respectively. Four A513 steel tubes were cut to a length of 18 in. and used along with three 1 in.
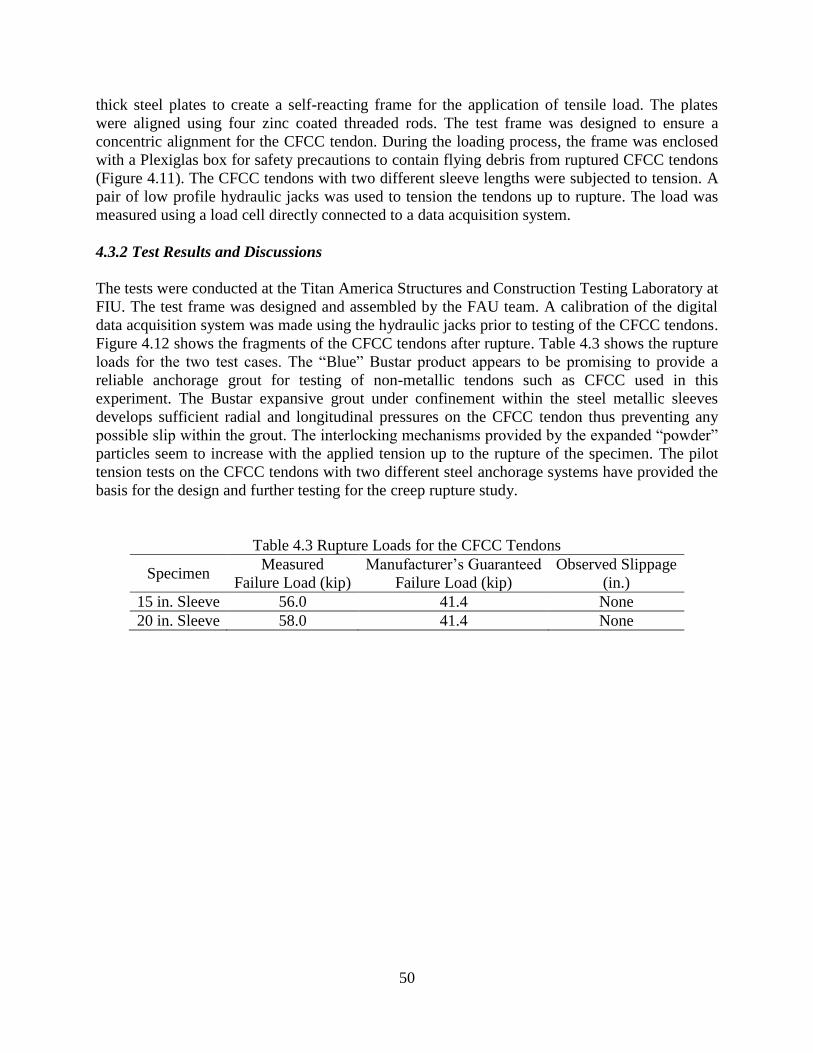
50
thick steel plates to create a self-reacting frame for the application of tensile load. The plates
were aligned using four zinc coated threaded rods. The test frame was designed to ensure a
concentric alignment for the CFCC tendon. During the loading process, the frame was enclosed
with a Plexiglas box for safety precautions to contain flying debris from ruptured CFCC tendons
(Figure 4.11). The CFCC tendons with two different sleeve lengths were subjected to tension. A
pair of low profile hydraulic jacks was used to tension the tendons up to rupture. The load was
measured using a load cell directly connected to a data acquisition system.
4.3.2 Test Results and Discussions
The tests were conducted at the Titan America Structures and Construction Testing Laboratory at
FIU. The test frame was designed and assembled by the FAU team. A calibration of the digital
data acquisition system was made using the hydraulic jacks prior to testing of the CFCC tendons.
Figure 4.12 shows the fragments of the CFCC tendons after rupture. Table 4.3 shows the rupture
loads for the two test cases. The “Blue” Bustar product appears to be promising to provide a
reliable anchorage grout for testing of non-metallic tendons such as CFCC used in this
experiment. The Bustar expansive grout under confinement within the steel metallic sleeves
develops sufficient radial and longitudinal pressures on the CFCC tendon thus preventing any
possible slip within the grout. The interlocking mechanisms provided by the expanded “powder”
particles seem to increase with the applied tension up to the rupture of the specimen. The pilot
tension tests on the CFCC tendons with two different steel anchorage systems have provided the
basis for the design and further testing for the creep rupture study.
Table 4.3 Rupture Loads for the CFCC Tendons
Specimen Measured
Failure Load (kip)
Manufacturer’s Guaranteed
Failure Load (kip)
Observed Slippage
(in.)
15 in. Sleeve 56.0 41.4 None
20 in. Sleeve 58.0 41.4 None
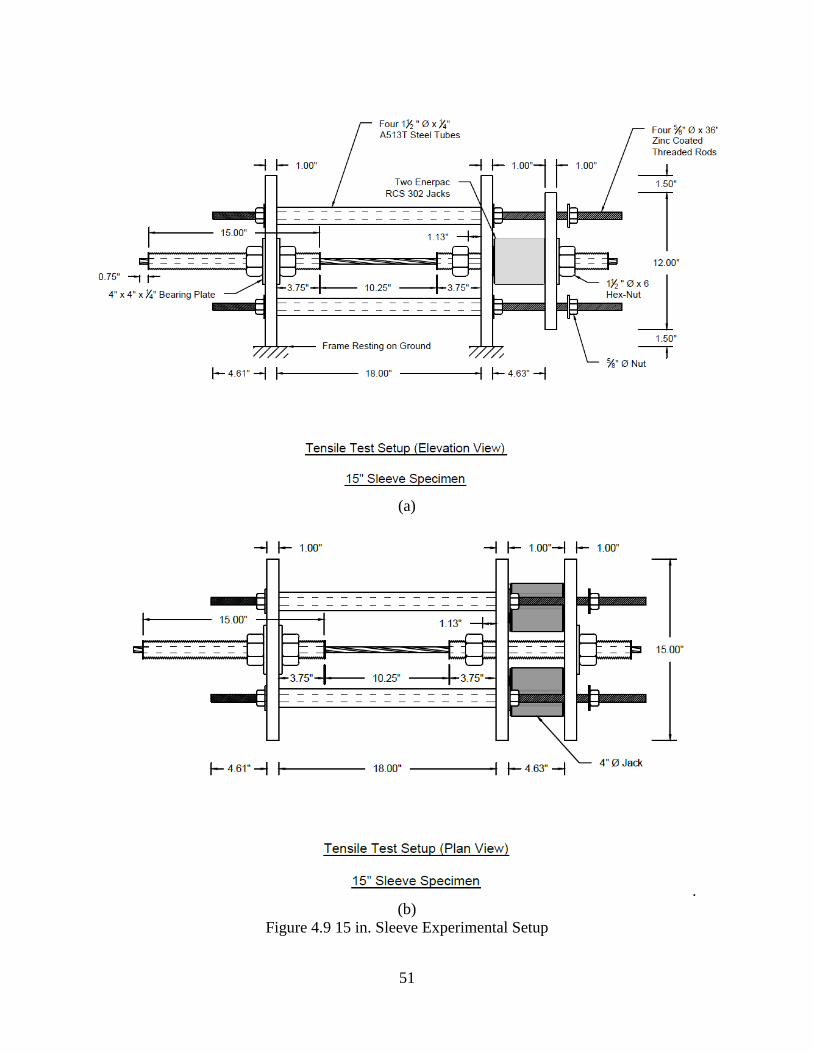
51
(a)
.
(b)
Figure 4.9 15 in. Sleeve Experimental Setup
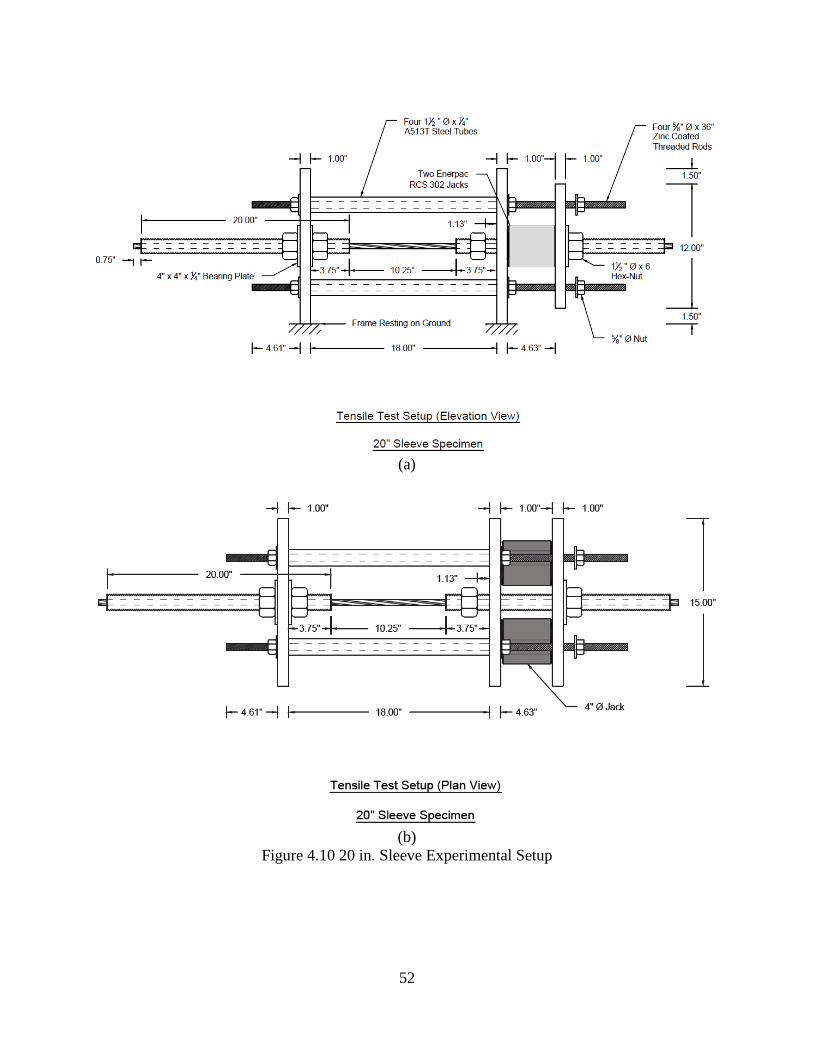
52
(a)
(b)
Figure 4.10 20 in. Sleeve Experimental Setup
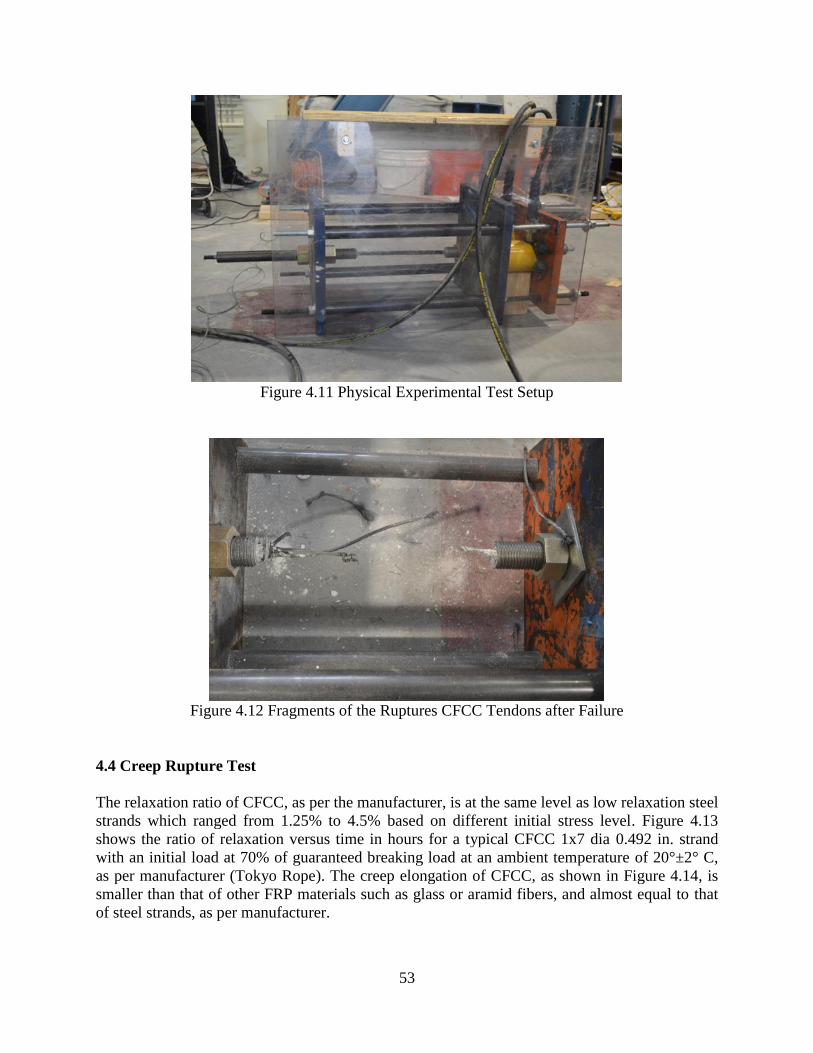
53
Figure 4.11 Physical Experimental Test Setup
Figure 4.12 Fragments of the Ruptures CFCC Tendons after Failure
4.4 Creep Rupture Test
The relaxation ratio of CFCC, as per the manufacturer, is at the same level as low relaxation steel
strands which ranged from 1.25% to 4.5% based on different initial stress level. Figure 4.13
shows the ratio of relaxation versus time in hours for a typical CFCC 1x7 dia 0.492 in. strand
with an initial load at 70% of guaranteed breaking load at an ambient temperature of 20°±2° C,
as per manufacturer (Tokyo Rope). The creep elongation of CFCC, as shown in Figure 4.14, is
smaller than that of other FRP materials such as glass or aramid fibers, and almost equal to that
of steel strands, as per manufacturer.
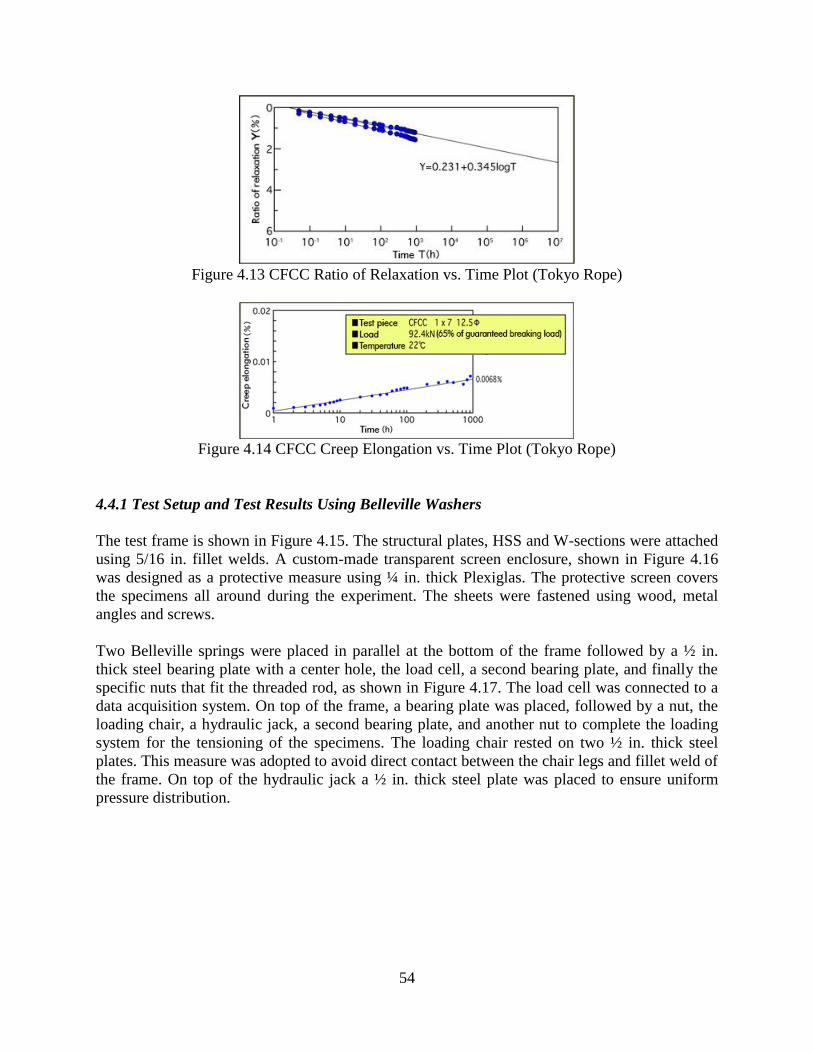
54
Figure 4.13 CFCC Ratio of Relaxation vs. Time Plot (Tokyo Rope)
Figure 4.14 CFCC Creep Elongation vs. Time Plot (Tokyo Rope)
4.4.1 Test Setup and Test Results Using Belleville Washers
The test frame is shown in Figure 4.15. The structural plates, HSS and W-sections were attached
using 5/16 in. fillet welds. A custom-made transparent screen enclosure, shown in Figure 4.16
was designed as a protective measure using ¼ in. thick Plexiglas. The protective screen covers
the specimens all around during the experiment. The sheets were fastened using wood, metal
angles and screws.
Two Belleville springs were placed in parallel at the bottom of the frame followed by a ½ in.
thick steel bearing plate with a center hole, the load cell, a second bearing plate, and finally the
specific nuts that fit the threaded rod, as shown in Figure 4.17. The load cell was connected to a
data acquisition system. On top of the frame, a bearing plate was placed, followed by a nut, the
loading chair, a hydraulic jack, a second bearing plate, and another nut to complete the loading
system for the tensioning of the specimens. The loading chair rested on two ½ in. thick steel
plates. This measure was adopted to avoid direct contact between the chair legs and fillet weld of
the frame. On top of the hydraulic jack a ½ in. thick steel plate was placed to ensure uniform
pressure distribution.
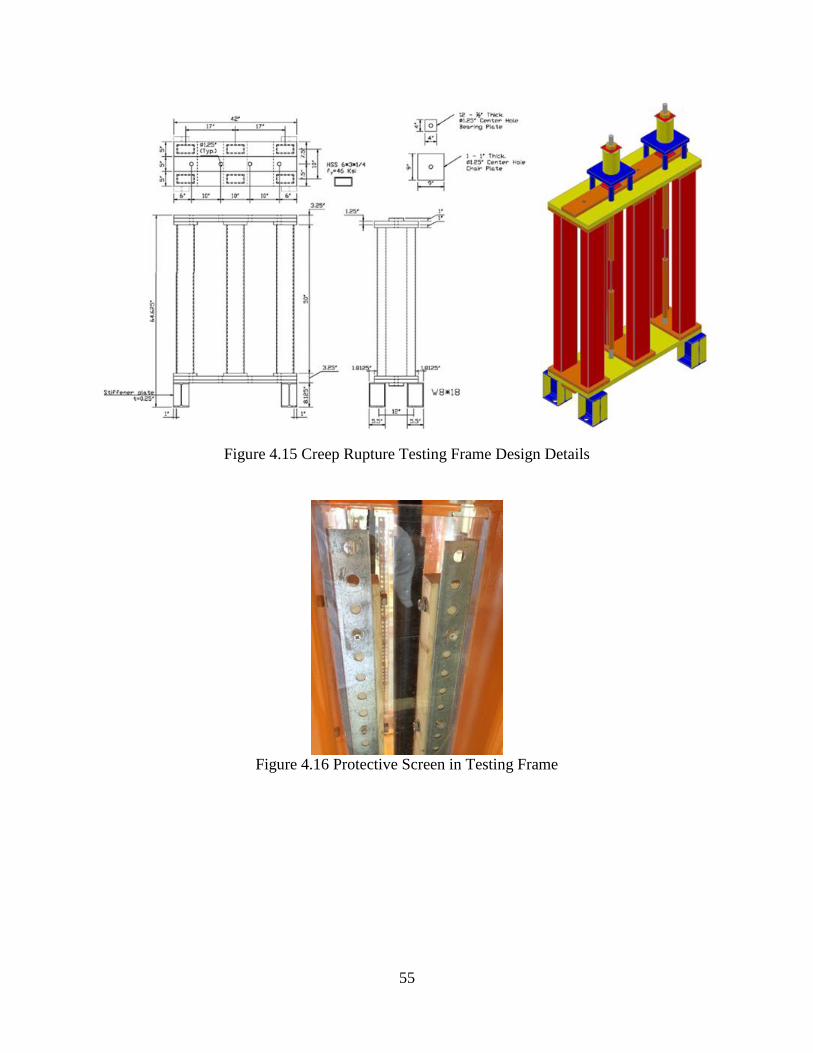
55
Figure 4.15 Creep Rupture Testing Frame Design Details
Figure 4.16 Protective Screen in Testing Frame
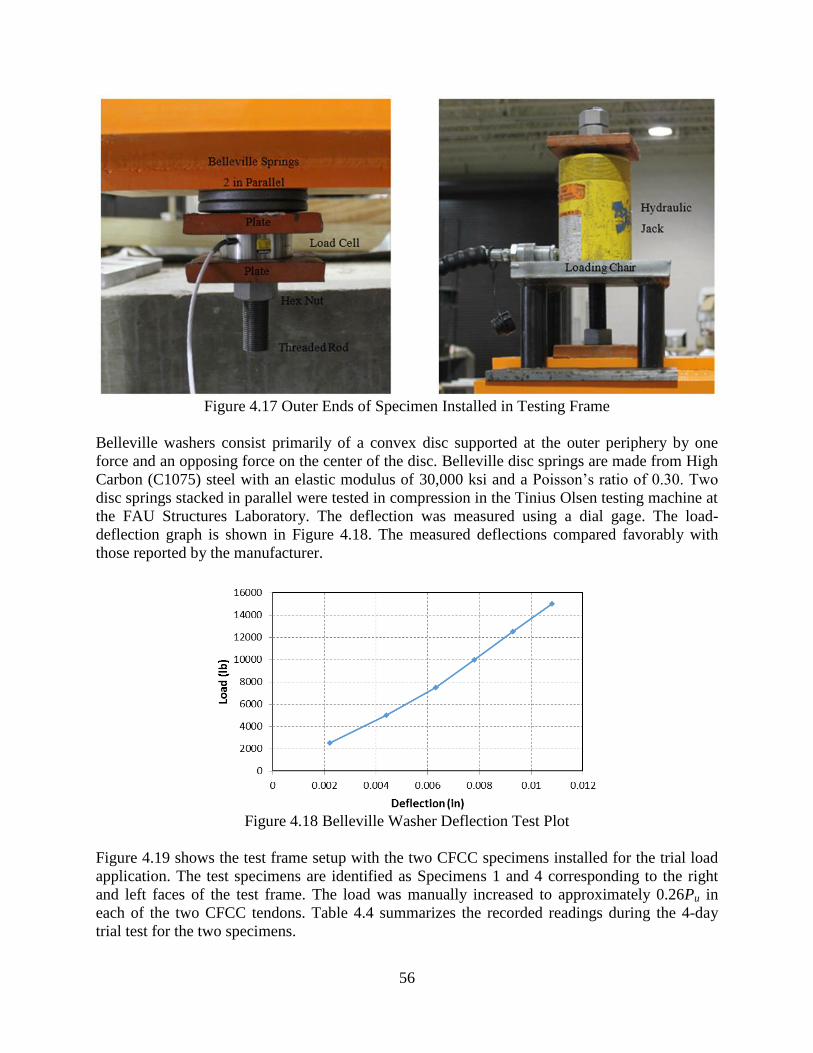
56
Figure 4.17 Outer Ends of Specimen Installed in Testing Frame
Belleville washers consist primarily of a convex disc supported at the outer periphery by one
force and an opposing force on the center of the disc. Belleville disc springs are made from High
Carbon (C1075) steel with an elastic modulus of 30,000 ksi and a Poisson’s ratio of 0.30. Two
disc springs stacked in parallel were tested in compression in the Tinius Olsen testing machine at
the FAU Structures Laboratory. The deflection was measured using a dial gage. The load-
deflection graph is shown in Figure 4.18. The measured deflections compared favorably with
those reported by the manufacturer.
Figure 4.18 Belleville Washer Deflection Test Plot
Figure 4.19 shows the test frame setup with the two CFCC specimens installed for the trial load
application. The test specimens are identified as Specimens 1 and 4 corresponding to the right
and left faces of the test frame. The load was manually increased to approximately 0.26Pu in
each of the two CFCC tendons. Table 4.4 summarizes the recorded readings during the 4-day
trial test for the two specimens.
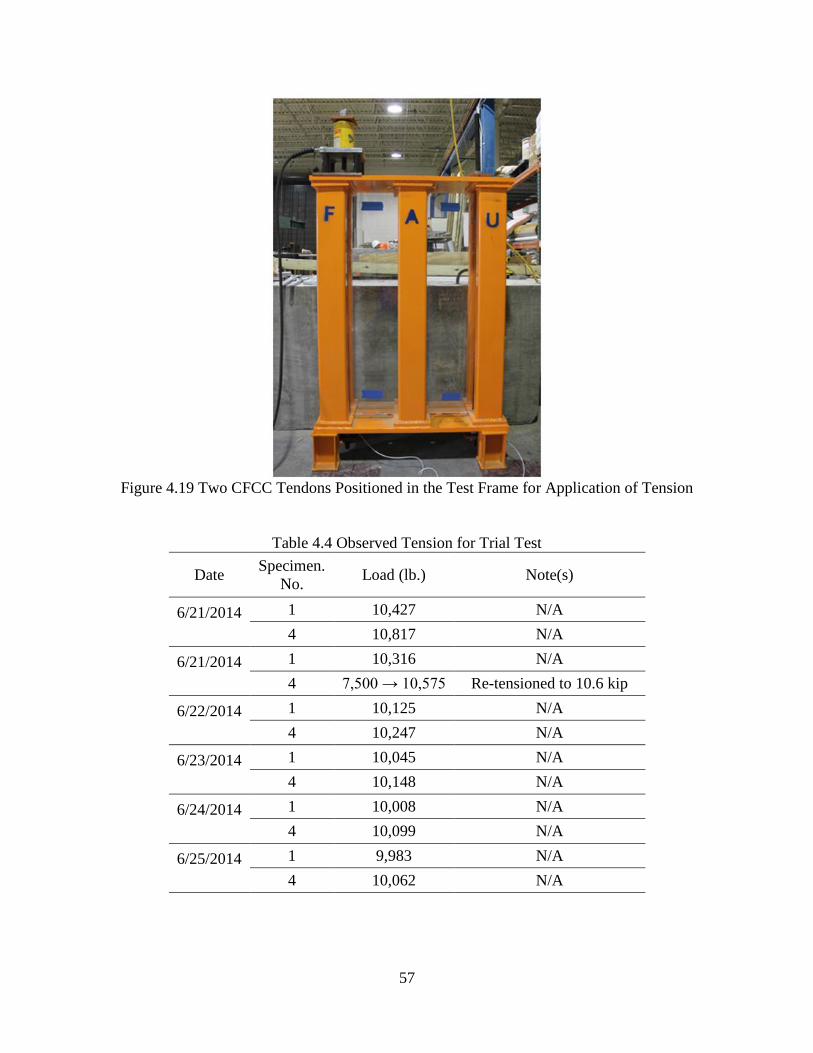
57
Figure 4.19 Two CFCC Tendons Positioned in the Test Frame for Application of Tension
Table 4.4 Observed Tension for Trial Test
Date Specimen.
No. Load (lb.) Note(s)
6/21/2014
1 10,427 N/A
4 10,817 N/A
6/21/2014
1 10,316 N/A
4 7,500 → 10,575 Re-tensioned to 10.6 kip
6/22/2014
1 10,125 N/A
4 10,247 N/A
6/23/2014
1 10,045 N/A
4 10,148 N/A
6/24/2014
1 10,008 N/A
4 10,099 N/A
6/25/2014
1 9,983 N/A
4 10,062 N/A
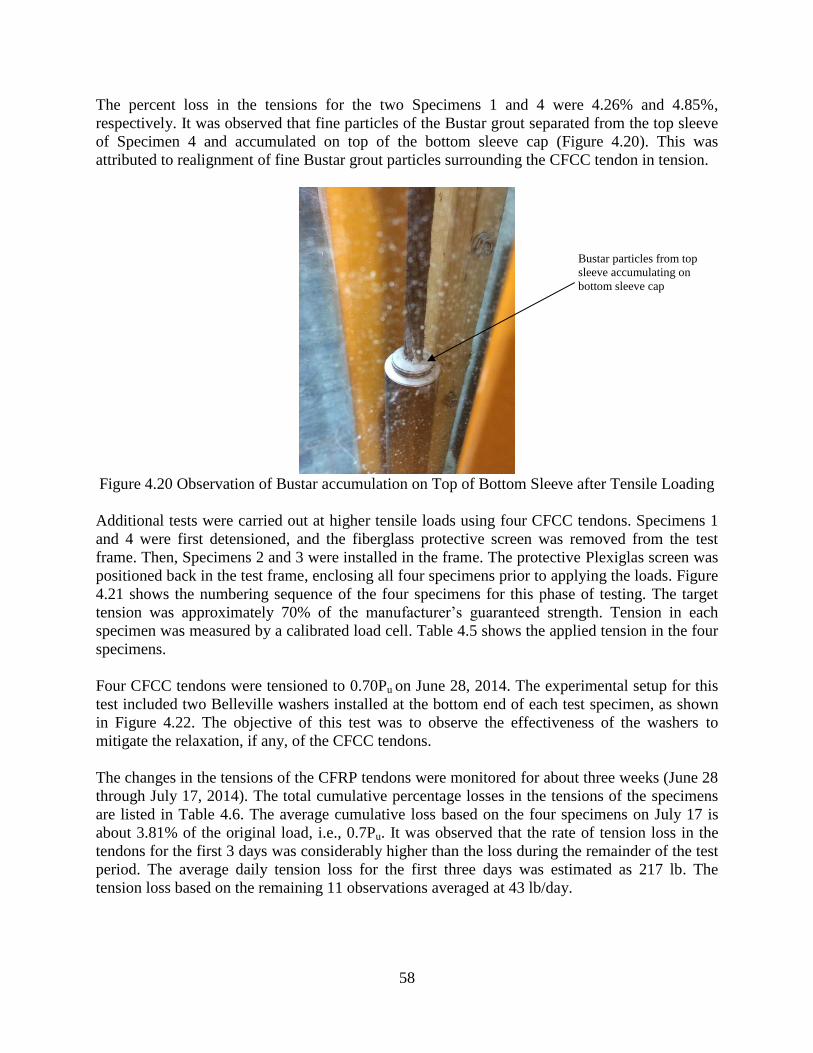
58
The percent loss in the tensions for the two Specimens 1 and 4 were 4.26% and 4.85%,
respectively. It was observed that fine particles of the Bustar grout separated from the top sleeve
of Specimen 4 and accumulated on top of the bottom sleeve cap (Figure 4.20). This was
attributed to realignment of fine Bustar grout particles surrounding the CFCC tendon in tension.
Figure 4.20 Observation of Bustar accumulation on Top of Bottom Sleeve after Tensile Loading
Additional tests were carried out at higher tensile loads using four CFCC tendons. Specimens 1
and 4 were first detensioned, and the fiberglass protective screen was removed from the test
frame. Then, Specimens 2 and 3 were installed in the frame. The protective Plexiglas screen was
positioned back in the test frame, enclosing all four specimens prior to applying the loads. Figure
4.21 shows the numbering sequence of the four specimens for this phase of testing. The target
tension was approximately 70% of the manufacturer’s guaranteed strength. Tension in each
specimen was measured by a calibrated load cell. Table 4.5 shows the applied tension in the four
specimens.
Four CFCC tendons were tensioned to 0.70Pu on June 28, 2014. The experimental setup for this
test included two Belleville washers installed at the bottom end of each test specimen, as shown
in Figure 4.22. The objective of this test was to observe the effectiveness of the washers to
mitigate the relaxation, if any, of the CFCC tendons.
The changes in the tensions of the CFRP tendons were monitored for about three weeks (June 28
through July 17, 2014). The total cumulative percentage losses in the tensions of the specimens
are listed in Table 4.6. The average cumulative loss based on the four specimens on July 17 is
about 3.81% of the original load, i.e., 0.7Pu. It was observed that the rate of tension loss in the
tendons for the first 3 days was considerably higher than the loss during the remainder of the test
period. The average daily tension loss for the first three days was estimated as 217 lb. The
tension loss based on the remaining 11 observations averaged at 43 lb/day.
Bustar particles from top
sleeve accumulating on
bottom sleeve cap
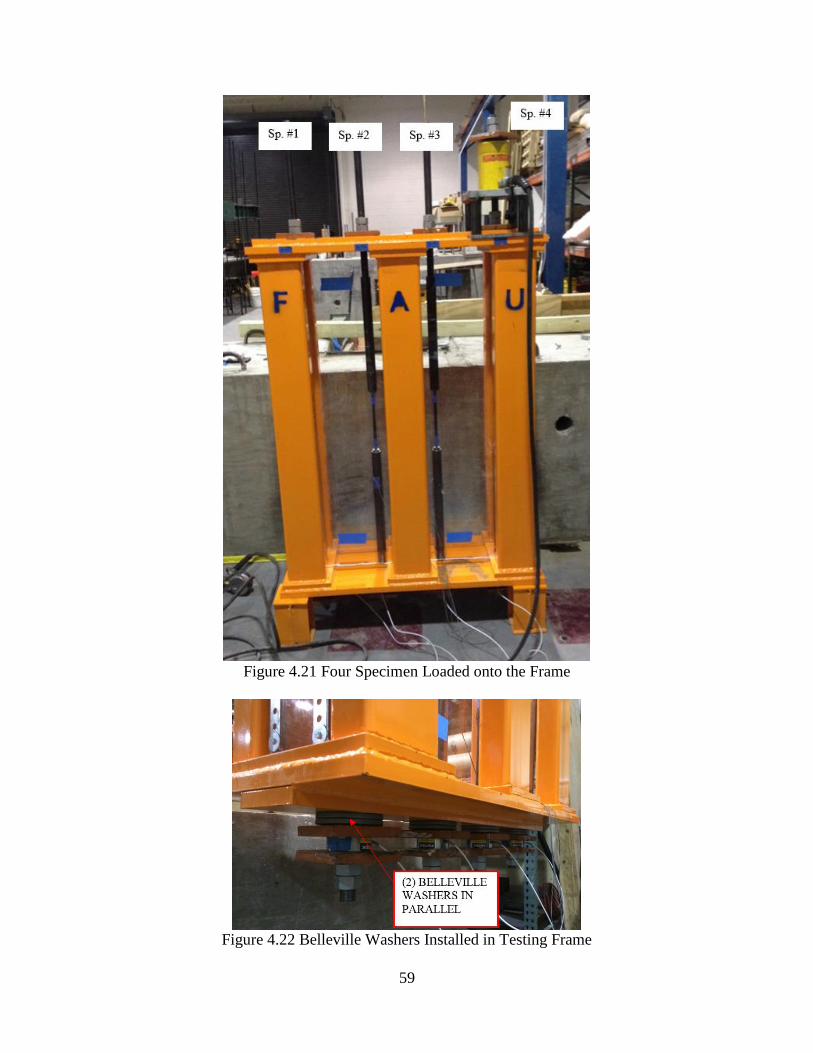
59
Figure 4.21 Four Specimen Loaded onto the Frame
Figure 4.22 Belleville Washers Installed in Testing Frame
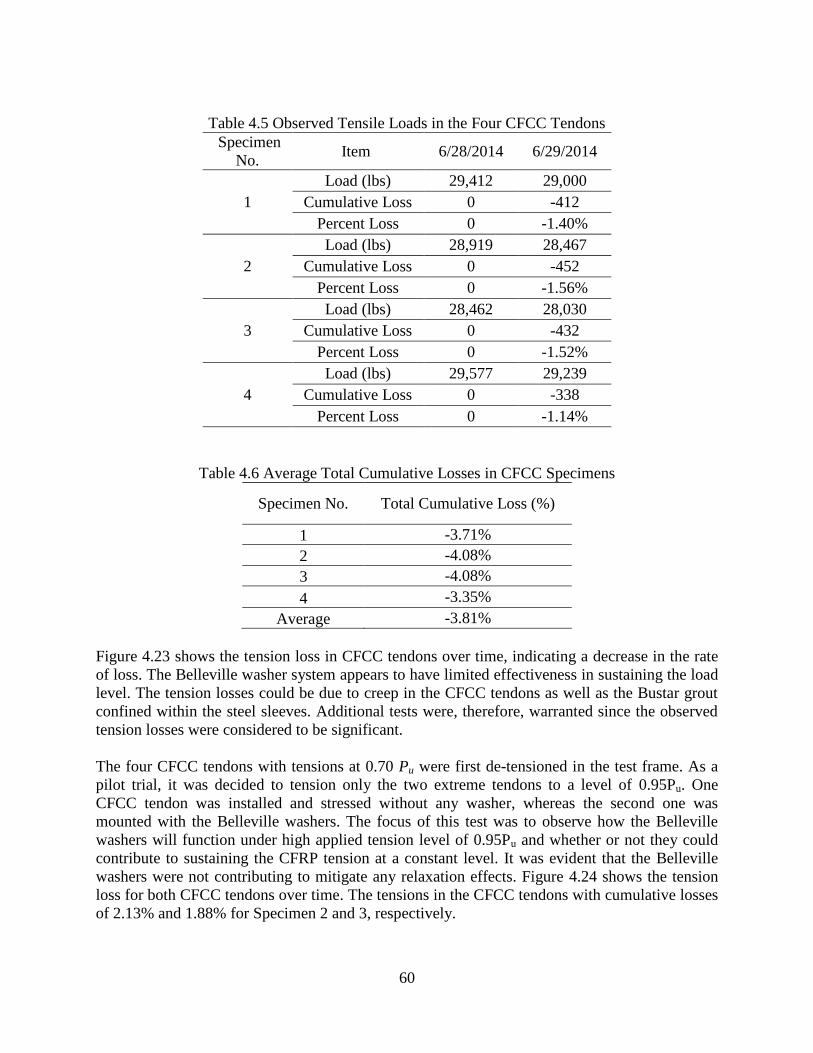
60
Table 4.5 Observed Tensile Loads in the Four CFCC Tendons
Specimen
No. Item 6/28/2014 6/29/2014
1
Load (lbs) 29,412 29,000
Cumulative Loss 0 -412
Percent Loss 0 -1.40%
2
Load (lbs) 28,919 28,467
Cumulative Loss 0 -452
Percent Loss 0 -1.56%
3
Load (lbs) 28,462 28,030
Cumulative Loss 0 -432
Percent Loss 0 -1.52%
4
Load (lbs) 29,577 29,239
Cumulative Loss 0 -338
Percent Loss 0 -1.14%
Table 4.6 Average Total Cumulative Losses in CFCC Specimens
Specimen No. Total Cumulative Loss (%)
1 -3.71%
2 -4.08%
3 -4.08%
4 -3.35%
Average -3.81%
Figure 4.23 shows the tension loss in CFCC tendons over time, indicating a decrease in the rate
of loss. The Belleville washer system appears to have limited effectiveness in sustaining the load
level. The tension losses could be due to creep in the CFCC tendons as well as the Bustar grout
confined within the steel sleeves. Additional tests were, therefore, warranted since the observed
tension losses were considered to be significant.
The four CFCC tendons with tensions at 0.70 Pu were first de-tensioned in the test frame. As a
pilot trial, it was decided to tension only the two extreme tendons to a level of 0.95Pu. One
CFCC tendon was installed and stressed without any washer, whereas the second one was
mounted with the Belleville washers. The focus of this test was to observe how the Belleville
washers will function under high applied tension level of 0.95Pu and whether or not they could
contribute to sustaining the CFRP tension at a constant level. It was evident that the Belleville
washers were not contributing to mitigate any relaxation effects. Figure 4.24 shows the tension
loss for both CFCC tendons over time. The tensions in the CFCC tendons with cumulative losses
of 2.13% and 1.88% for Specimen 2 and 3, respectively.
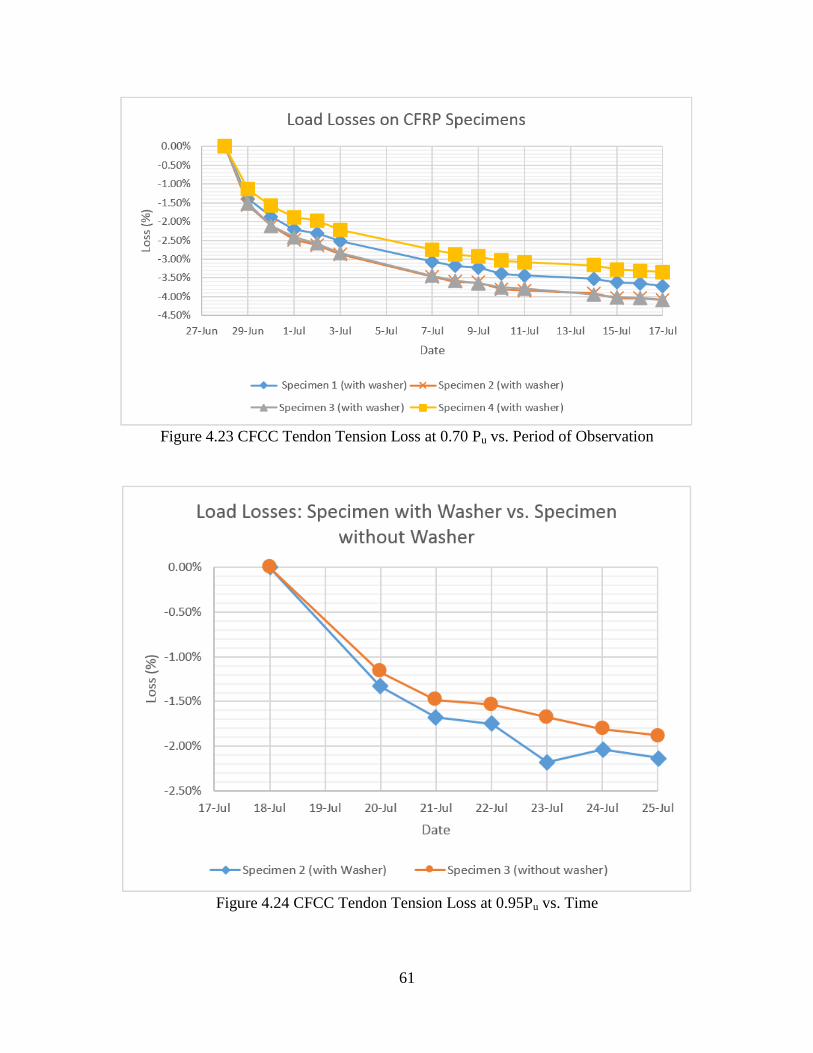
61
Figure 4.23 CFCC Tendon Tension Loss at 0.70 Pu vs. Period of Observation
Figure 4.24 CFCC Tendon Tension Loss at 0.95Pu vs. Time
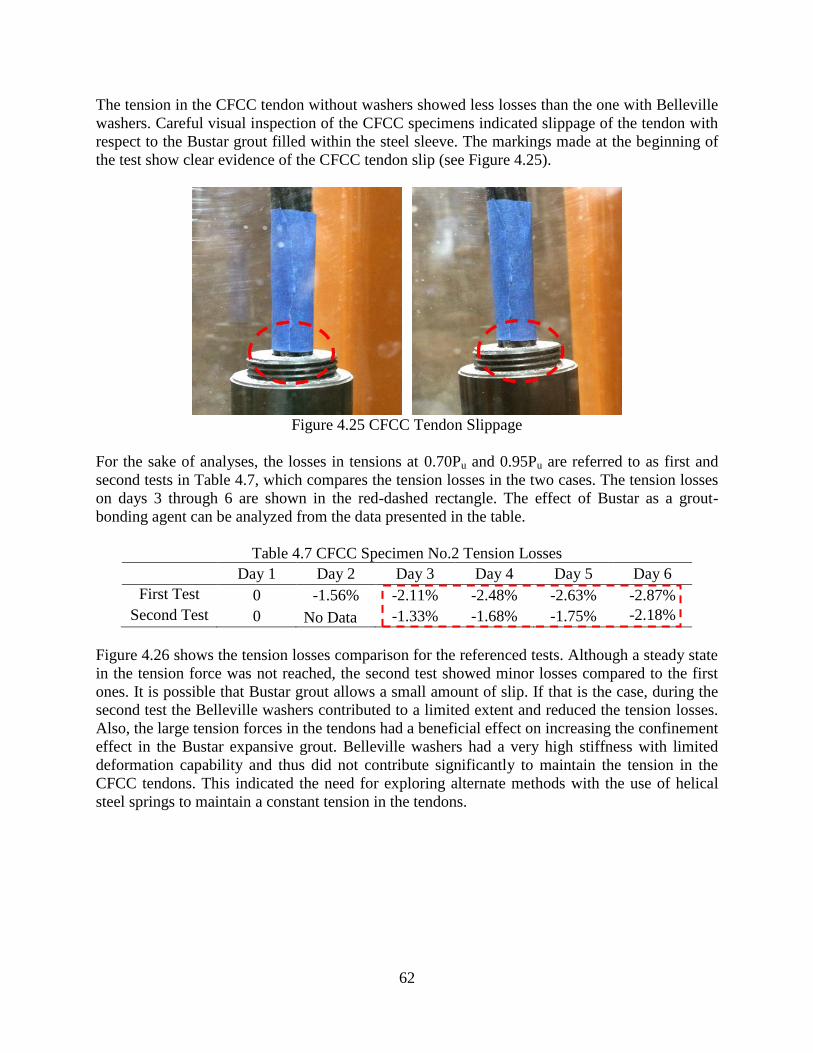
62
The tension in the CFCC tendon without washers showed less losses than the one with Belleville
washers. Careful visual inspection of the CFCC specimens indicated slippage of the tendon with
respect to the Bustar grout filled within the steel sleeve. The markings made at the beginning of
the test show clear evidence of the CFCC tendon slip (see Figure 4.25).
Figure 4.25 CFCC Tendon Slippage
For the sake of analyses, the losses in tensions at 0.70Pu and 0.95Pu are referred to as first and
second tests in Table 4.7, which compares the tension losses in the two cases. The tension losses
on days 3 through 6 are shown in the red-dashed rectangle. The effect of Bustar as a grout-
bonding agent can be analyzed from the data presented in the table.
Table 4.7 CFCC Specimen No.2 Tension Losses
Day 1 Day 2 Day 3 Day 4 Day 5 Day 6
First Test 0 -1.56% -2.11% -2.48% -2.63% -2.87%
Second Test 0 No Data -1.33% -1.68% -1.75% -2.18%
Figure 4.26 shows the tension losses comparison for the referenced tests. Although a steady state
in the tension force was not reached, the second test showed minor losses compared to the first
ones. It is possible that Bustar grout allows a small amount of slip. If that is the case, during the
second test the Belleville washers contributed to a limited extent and reduced the tension losses.
Also, the large tension forces in the tendons had a beneficial effect on increasing the confinement
effect in the Bustar expansive grout. Belleville washers had a very high stiffness with limited
deformation capability and thus did not contribute significantly to maintain the tension in the
CFCC tendons. This indicated the need for exploring alternate methods with the use of helical
steel springs to maintain a constant tension in the tendons.
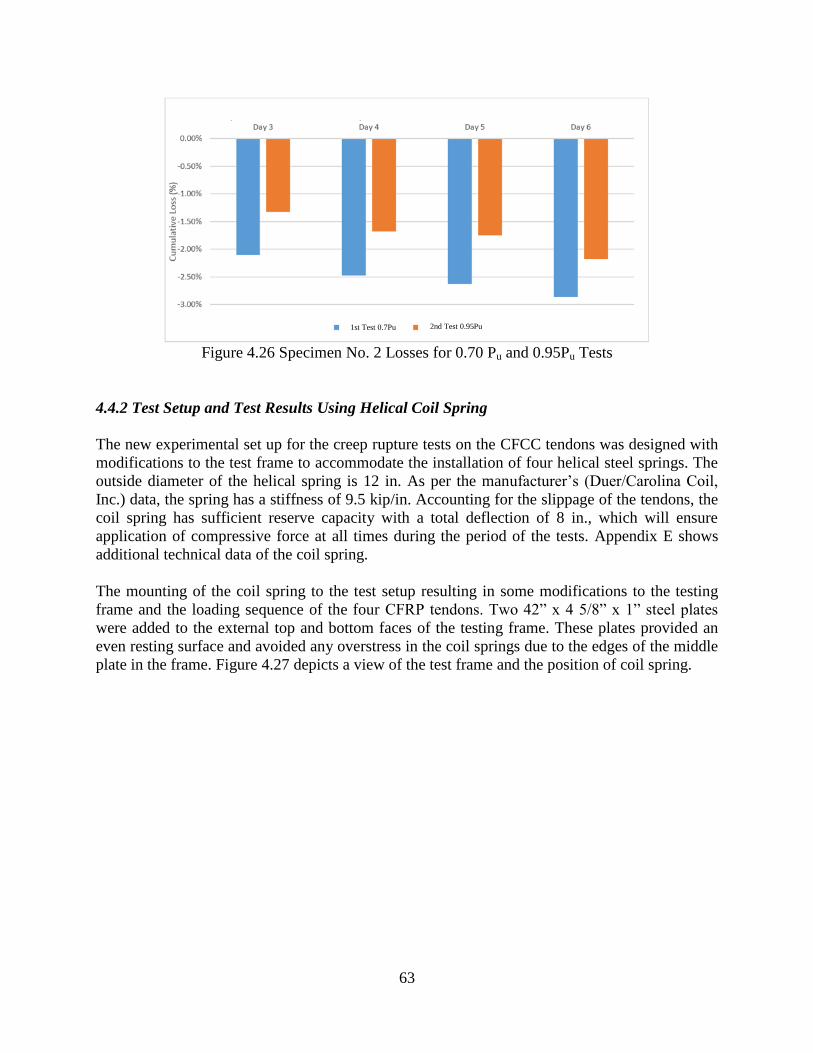
63
Figure 4.26 Specimen No. 2 Losses for 0.70 Pu and 0.95Pu Tests
4.4.2 Test Setup and Test Results Using Helical Coil Spring
The new experimental set up for the creep rupture tests on the CFCC tendons was designed with
modifications to the test frame to accommodate the installation of four helical steel springs. The
outside diameter of the helical spring is 12 in. As per the manufacturer’s (Duer/Carolina Coil,
Inc.) data, the spring has a stiffness of 9.5 kip/in. Accounting for the slippage of the tendons, the
coil spring has sufficient reserve capacity with a total deflection of 8 in., which will ensure
application of compressive force at all times during the period of the tests. Appendix E shows
additional technical data of the coil spring.
The mounting of the coil spring to the test setup resulting in some modifications to the testing
frame and the loading sequence of the four CFRP tendons. Two 42” x 4 5/8” x 1” steel plates
were added to the external top and bottom faces of the testing frame. These plates provided an
even resting surface and avoided any overstress in the coil springs due to the edges of the middle
plate in the frame. Figure 4.27 depicts a view of the test frame and the position of coil spring.
1st Test 0.7Pu 2nd Test 0.95Pu
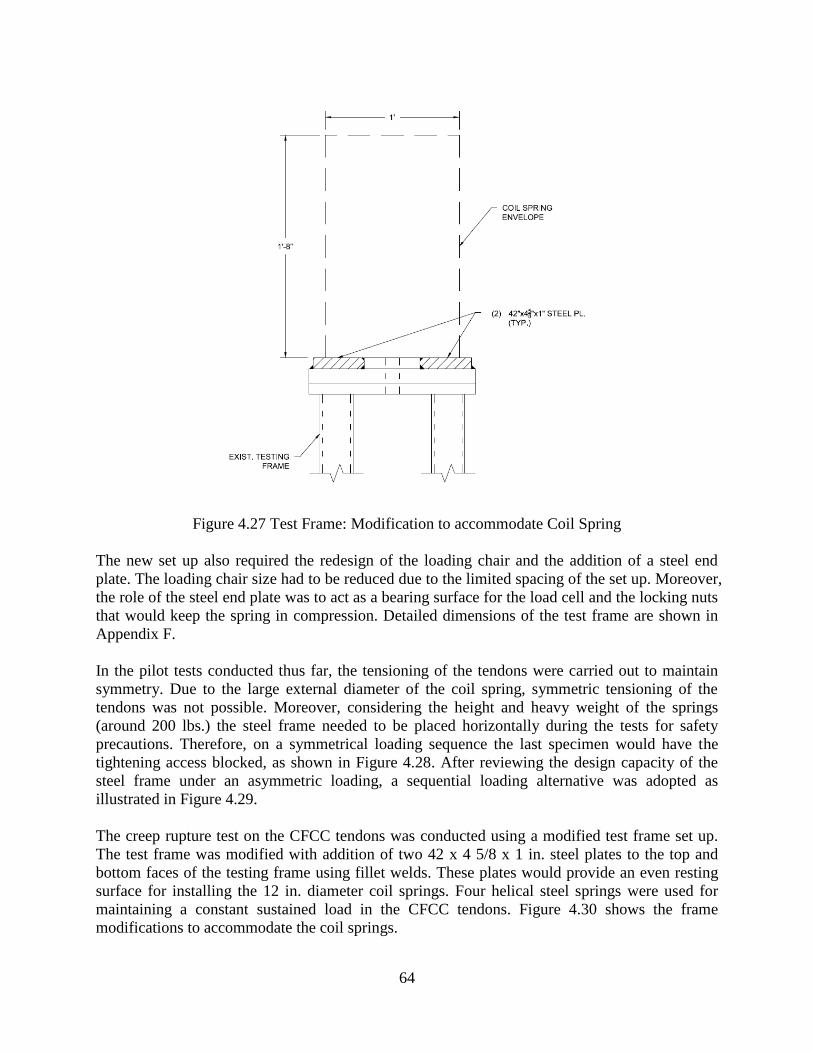
64
Figure 4.27 Test Frame: Modification to accommodate Coil Spring
The new set up also required the redesign of the loading chair and the addition of a steel end
plate. The loading chair size had to be reduced due to the limited spacing of the set up. Moreover,
the role of the steel end plate was to act as a bearing surface for the load cell and the locking nuts
that would keep the spring in compression. Detailed dimensions of the test frame are shown in
Appendix F.
In the pilot tests conducted thus far, the tensioning of the tendons were carried out to maintain
symmetry. Due to the large external diameter of the coil spring, symmetric tensioning of the
tendons was not possible. Moreover, considering the height and heavy weight of the springs
(around 200 lbs.) the steel frame needed to be placed horizontally during the tests for safety
precautions. Therefore, on a symmetrical loading sequence the last specimen would have the
tightening access blocked, as shown in Figure 4.28. After reviewing the design capacity of the
steel frame under an asymmetric loading, a sequential loading alternative was adopted as
illustrated in Figure 4.29.
The creep rupture test on the CFCC tendons was conducted using a modified test frame set up.
The test frame was modified with addition of two 42 x 4 5/8 x 1 in. steel plates to the top and
bottom faces of the testing frame using fillet welds. These plates would provide an even resting
surface for installing the 12 in. diameter coil springs. Four helical steel springs were used for
maintaining a constant sustained load in the CFCC tendons. Figure 4.30 shows the frame
modifications to accommodate the coil springs.
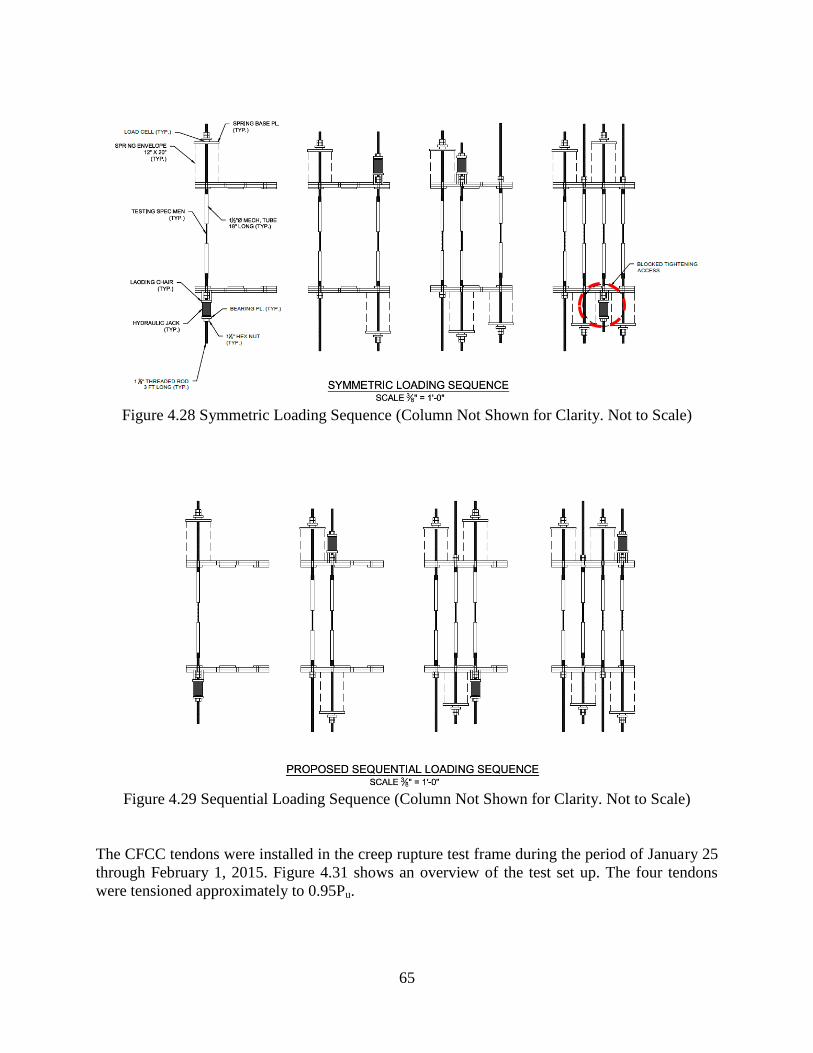
65
Figure 4.28 Symmetric Loading Sequence (Column Not Shown for Clarity. Not to Scale)
Figure 4.29 Sequential Loading Sequence (Column Not Shown for Clarity. Not to Scale)
The CFCC tendons were installed in the creep rupture test frame during the period of January 25
through February 1, 2015. Figure 4.31 shows an overview of the test set up. The four tendons
were tensioned approximately to 0.95Pu.
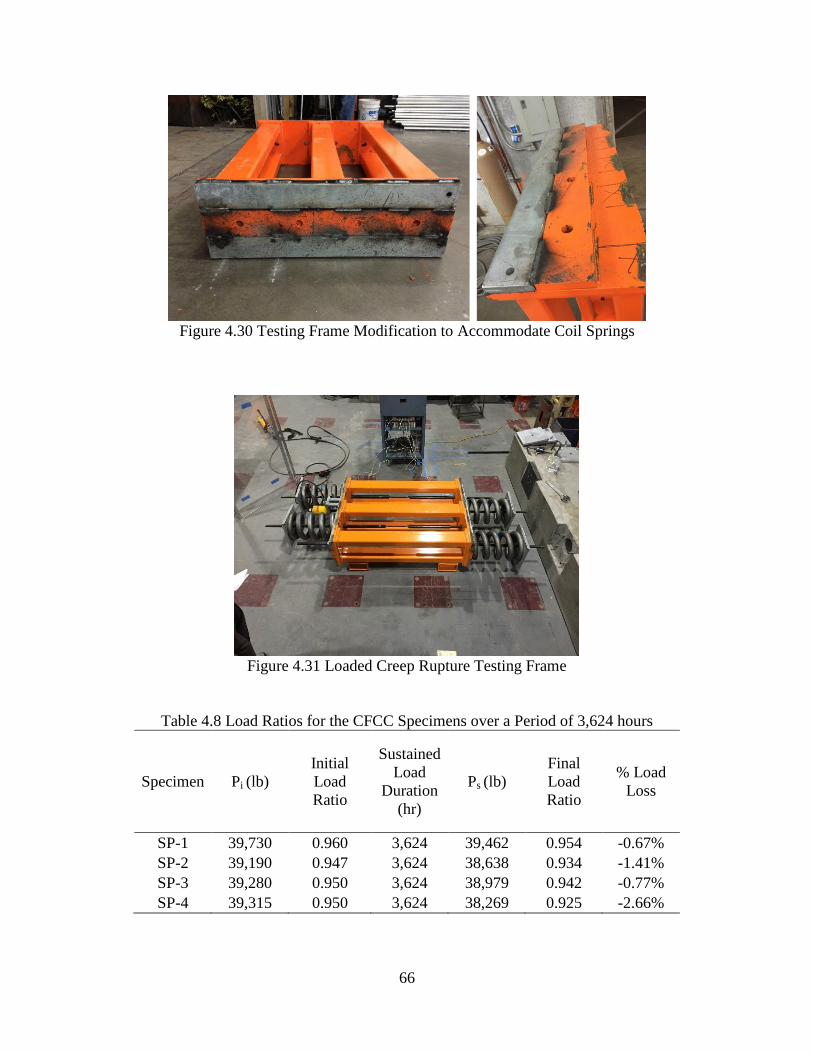
66
Figure 4.30 Testing Frame Modification to Accommodate Coil Springs
Figure 4.31 Loaded Creep Rupture Testing Frame
Table 4.8 Load Ratios for the CFCC Specimens over a Period of 3,624 hours
Specimen Pi (lb)
Initial
Load
Ratio
Sustained
Load
Duration
(hr)
Ps (lb)
Final
Load
Ratio
% Load
Loss
SP-1 39,730 0.960 3,624 39,462 0.954 -0.67%
SP-2 39,190 0.947 3,624 38,638 0.934 -1.41%
SP-3 39,280 0.950 3,624 38,979 0.942 -0.77%
SP-4 39,315 0.950 3,624 38,269 0.925 -2.66%

67
Figure 4.32 Load Ratio vs. Time (hour)
Figure 4.33 Load Ratio vs. Log Time (hour)
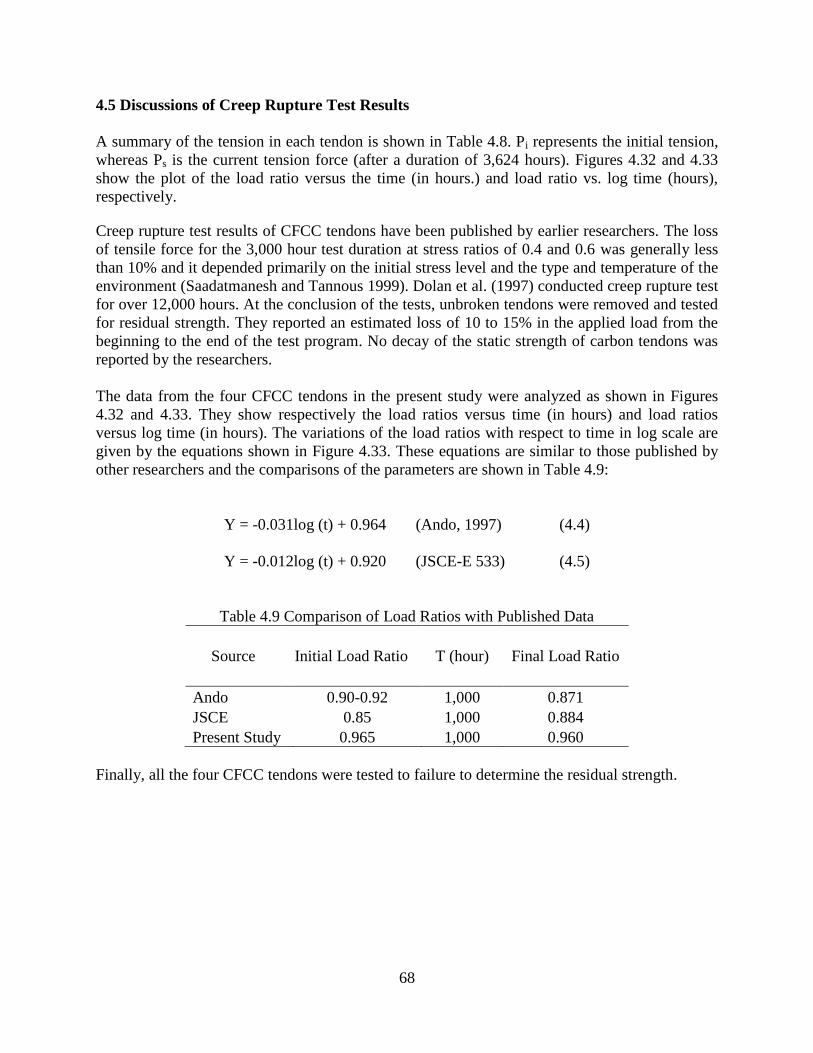
68
4.5 Discussions of Creep Rupture Test Results
A summary of the tension in each tendon is shown in Table 4.8. Pi represents the initial tension,
whereas Ps is the current tension force (after a duration of 3,624 hours). Figures 4.32 and 4.33
show the plot of the load ratio versus the time (in hours.) and load ratio vs. log time (hours),
respectively.
Creep rupture test results of CFCC tendons have been published by earlier researchers. The loss
of tensile force for the 3,000 hour test duration at stress ratios of 0.4 and 0.6 was generally less
than 10% and it depended primarily on the initial stress level and the type and temperature of the
environment (Saadatmanesh and Tannous 1999). Dolan et al. (1997) conducted creep rupture test
for over 12,000 hours. At the conclusion of the tests, unbroken tendons were removed and tested
for residual strength. They reported an estimated loss of 10 to 15% in the applied load from the
beginning to the end of the test program. No decay of the static strength of carbon tendons was
reported by the researchers.
The data from the four CFCC tendons in the present study were analyzed as shown in Figures
4.32 and 4.33. They show respectively the load ratios versus time (in hours) and load ratios
versus log time (in hours). The variations of the load ratios with respect to time in log scale are
given by the equations shown in Figure 4.33. These equations are similar to those published by
other researchers and the comparisons of the parameters are shown in Table 4.9:
Y = -0.031log (t) + 0.964 (Ando, 1997) (4.4)
Y = -0.012log (t) + 0.920 (JSCE-E 533) (4.5)
Table 4.9 Comparison of Load Ratios with Published Data
Source Initial Load Ratio T (hour) Final Load Ratio
Ando 0.90-0.92 1,000 0.871
JSCE 0.85 1,000 0.884
Present Study 0.965 1,000 0.960
Finally, all the four CFCC tendons were tested to failure to determine the residual strength.
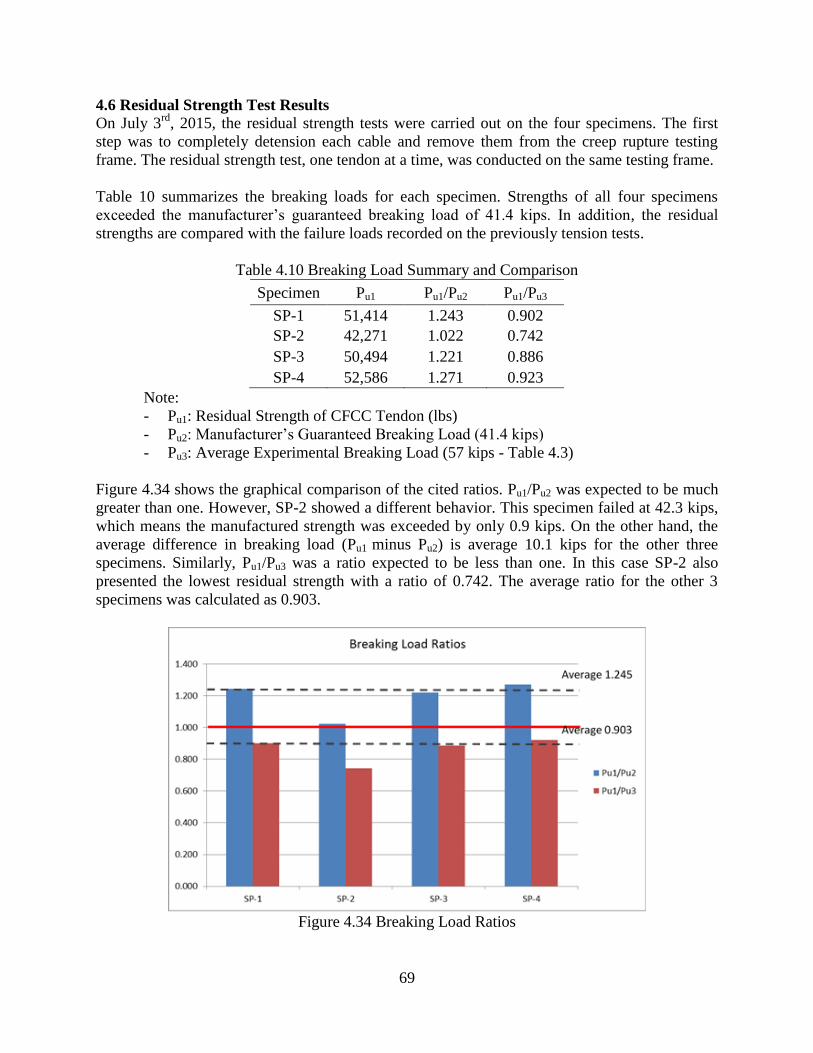
69
4.6 Residual Strength Test Results
On July 3rd
, 2015, the residual strength tests were carried out on the four specimens. The first
step was to completely detension each cable and remove them from the creep rupture testing
frame. The residual strength test, one tendon at a time, was conducted on the same testing frame.
Table 10 summarizes the breaking loads for each specimen. Strengths of all four specimens
exceeded the manufacturer’s guaranteed breaking load of 41.4 kips. In addition, the residual
strengths are compared with the failure loads recorded on the previously tension tests.
Table 4.10 Breaking Load Summary and Comparison
Specimen Pu1 Pu1/Pu2 Pu1/Pu3
SP-1 51,414 1.243 0.902
SP-2 42,271 1.022 0.742
SP-3 50,494 1.221 0.886
SP-4 52,586 1.271 0.923
Note:
- Pu1: Residual Strength of CFCC Tendon (lbs)
- Pu2: Manufacturer’s Guaranteed Breaking Load (41.4 kips)
- Pu3: Average Experimental Breaking Load (57 kips - Table 4.3)
Figure 4.34 shows the graphical comparison of the cited ratios. Pu1/Pu2 was expected to be much
greater than one. However, SP-2 showed a different behavior. This specimen failed at 42.3 kips,
which means the manufactured strength was exceeded by only 0.9 kips. On the other hand, the
average difference in breaking load (Pu1 minus Pu2) is average 10.1 kips for the other three
specimens. Similarly, Pu1/Pu3 was a ratio expected to be less than one. In this case SP-2 also
presented the lowest residual strength with a ratio of 0.742. The average ratio for the other 3
specimens was calculated as 0.903.
Figure 4.34 Breaking Load Ratios
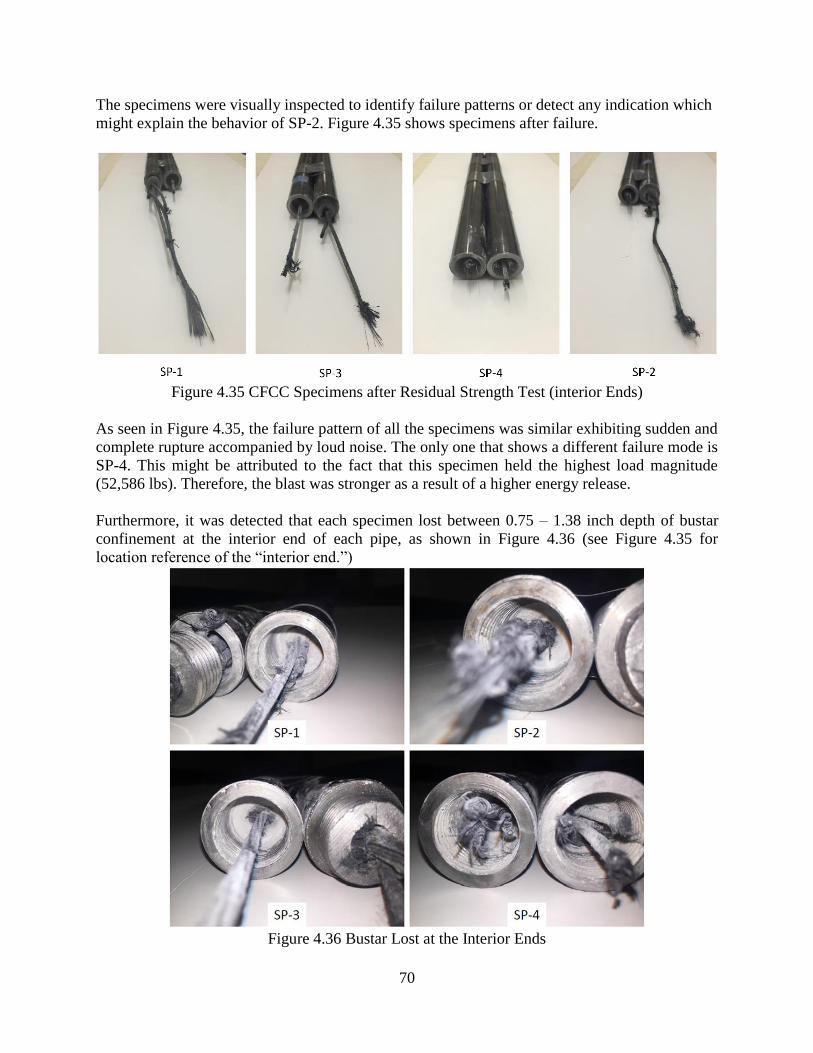
70
The specimens were visually inspected to identify failure patterns or detect any indication which
might explain the behavior of SP-2. Figure 4.35 shows specimens after failure.
Figure 4.35 CFCC Specimens after Residual Strength Test (interior Ends)
As seen in Figure 4.35, the failure pattern of all the specimens was similar exhibiting sudden and
complete rupture accompanied by loud noise. The only one that shows a different failure mode is
SP-4. This might be attributed to the fact that this specimen held the highest load magnitude
(52,586 lbs). Therefore, the blast was stronger as a result of a higher energy release.
Furthermore, it was detected that each specimen lost between 0.75 – 1.38 inch depth of bustar
confinement at the interior end of each pipe, as shown in Figure 4.36 (see Figure 4.35 for
location reference of the “interior end.”)
Figure 4.36 Bustar Lost at the Interior Ends
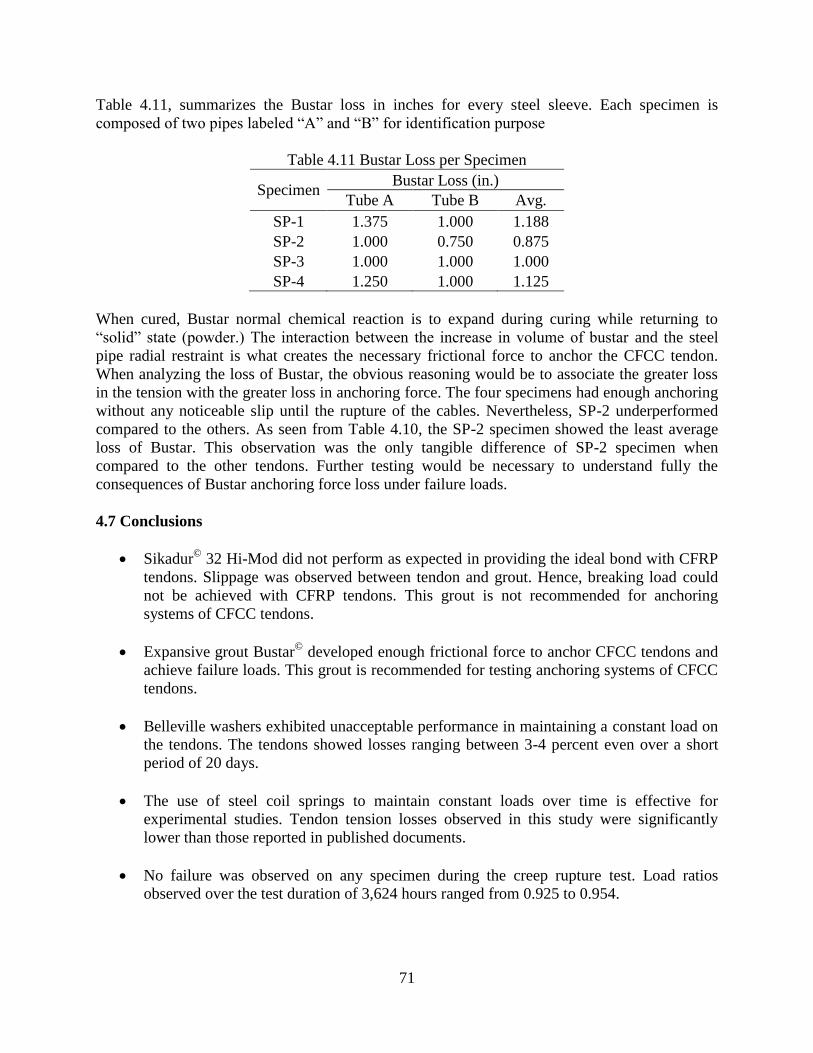
71
Table 4.11, summarizes the Bustar loss in inches for every steel sleeve. Each specimen is
composed of two pipes labeled “A” and “B” for identification purpose
Table 4.11 Bustar Loss per Specimen
Specimen Bustar Loss (in.)
Tube A Tube B Avg.
SP-1 1.375 1.000 1.188
SP-2 1.000 0.750 0.875
SP-3 1.000 1.000 1.000
SP-4 1.250 1.000 1.125
When cured, Bustar normal chemical reaction is to expand during curing while returning to
“solid” state (powder.) The interaction between the increase in volume of bustar and the steel
pipe radial restraint is what creates the necessary frictional force to anchor the CFCC tendon.
When analyzing the loss of Bustar, the obvious reasoning would be to associate the greater loss
in the tension with the greater loss in anchoring force. The four specimens had enough anchoring
without any noticeable slip until the rupture of the cables. Nevertheless, SP-2 underperformed
compared to the others. As seen from Table 4.10, the SP-2 specimen showed the least average
loss of Bustar. This observation was the only tangible difference of SP-2 specimen when
compared to the other tendons. Further testing would be necessary to understand fully the
consequences of Bustar anchoring force loss under failure loads.
4.7 Conclusions
Sikadur©
32 Hi-Mod did not perform as expected in providing the ideal bond with CFRP
tendons. Slippage was observed between tendon and grout. Hence, breaking load could
not be achieved with CFRP tendons. This grout is not recommended for anchoring
systems of CFCC tendons.
Expansive grout Bustar©
developed enough frictional force to anchor CFCC tendons and
achieve failure loads. This grout is recommended for testing anchoring systems of CFCC
tendons.
Belleville washers exhibited unacceptable performance in maintaining a constant load on
the tendons. The tendons showed losses ranging between 3-4 percent even over a short
period of 20 days.
The use of steel coil springs to maintain constant loads over time is effective for
experimental studies. Tendon tension losses observed in this study were significantly
lower than those reported in published documents.
No failure was observed on any specimen during the creep rupture test. Load ratios
observed over the test duration of 3,624 hours ranged from 0.925 to 0.954.

72
Average residual strength ranged from 122 to 127% when compared to guaranteed
manufacturer’s breaking load.
The loss in strength after 3,624 hours at an averaged load ratio of 0.94 ranged from -7.7
to -11.4% (using the experimental breaking load of 57 kips as reference.)
There is a linear relationship between the final load ratio and the residual strength. SP-4
had the largest % load loss (-2.30% after 3,624 hours) and the smallest strength loss (-7.7%
after 3,624 hours.)
Further study is suggested for determining the effects of loss in anchoring force when
testing for residual strength.

73
Chapter 5 Recommendations for Design, Construction, Inspection, and Repair Specifications
5.1 Review of Currently Available Specifications on CFRP Post-Tensioning System
ACI 440.4R-04 provides guidelines for the design of concrete prestressed with FRP tendons. It
covers the characteristics of different FRP tendons and anchorages, flexural design, shear design,
serviceability, bonded development length, and unbonded external tendon systems.
ISIS Canada Design manual No. 5 provides comprehensive information regarding the design of
prestressed concrete members using FRP, covering almost the same topics as ACI 440.4R-04.
Japan Society of Civil Engineers (JSCE) had published some general recommendations for
design and construction of concrete structures using continuous fiber reinforcing materials, back
to the 1990s. They also published the quality assurance specifications and test methods for
continuous fiber reinforcing materials.
Even though the ACI, ISIS, and JSCE provide the general recommendation, more specific design
guidelines and construction specifications may be required due to different behaviors of different
structural elements and different material properties of various FRP tendons.
Florida DOT has recently published the Fiber Reinforced Polymer Guidelines. One chapter
covers the carbon fiber reinforced polymer (CFRP) Strands. However, only the application for
piles is available at this stage and it mainly specifies the same recommendations as ACI.
Guidelines and specifications for other structural elements, especially for unbonded post-
tensioned system, are still required to be developed.
Florida State University investigated the application of carbon fiber composite cables (CFCC) in
prestressed concrete piles which included the installation of CFCC and stressing couplers, CFCC
bond characteristics, and flexural capacity of CFCC prestressed pile.
Lawrence Technological University conducted several studies to investigate CFRP leadline
tendons and CFCC in prestressed concrete applications. Experimental tests and analytical studies
have been performed to assess the flexural behavior of decked bulb T-beams, AASHTO type I
beams, box beams using CFRP materials, the transverse CFCC post-tensioning system for box
74
beams and the unbonded external CFCC post-tensioning system which was applied to the Bridge
Street Bridge.
CFRP material has shown great potential to be used on bridge construction projects especially
for prestressed concrete structures. However, no comprehensive specification and guideline has
yet been developed for CFRP material.
Michigan and Maine DOTs have both provided some special provisions for CFCC transverse
post-tensioning using CFCC strands. Methods and steps were provided to check the CFCC
material properties including length, diameter, linear density, breaking load, tensile modulus, and
elongation at break. The post-tensioning accessories, such as polyethylene sheathing, sheathing
wrap, gasket, stress transfer plate, protective cover, connection rod, and stressing chair have all
been standardized in these provisions. General storage, handling, and installation instruction has
also been listed in the provisions. Information and standards for CFCC anchorage device and
instrumentation for monitoring the tendons has also been summarized in Michigan DOT
provisions.
The objectives of this study were to develop recommendations for the design guidelines,
construction specifications, inspection and repair specifications of CFRP post-tensioning system
for FDOT.
5.2 Issues for Design Guidelines
Unbonded segmental bridges behave in a bilinear pattern. The initial stiffness of
segmental bridge is mainly decided by the geometry of the concrete cross section. After
decompression and joint opening of the segmental bridge, the stiffness of the cable itself
would greatly affect the stiffness of the entire structure. Therefore, the cable with lower
modulus of elasticity than steel may cause much more deflection beyond service limit.
Given the higher flexibility of segmental bridges post-tensioned with CFCC and EC6, a
stiffness-based equivalency approach could be appropriate, which will further reduce the
maximum allowable stress level of 65% specified in ACI 440.4R-04. However, the
behavior beyond service limit is typically not a concern as long as the ultimate capacity
are similar or meet the load demand at this stage of philosophy for design. Additionally,
epoxy joints are required for the segmental bridges nowadays, which could provide slight
differences in behavior compared to the segmental bridge with dry joints.
The general performances of pier cap using CFCC and EC6 were quite comparable with
steel. For these types of short-span structures, as well as those members that require
transverse post-tensioning, strength-based design philosophy, similar to steel strands,
seems to be adequate, given the expected small deflections.
75
5.3 Issues for Construction Specifications
Both CFCC and EC6 are available in large diameters, which can reduce the number of
tendons used in the structure to achieve the same amount of post-tensioning load. It can
also address the congestion problems at the anchorage and simplify the tensioning device.
CFCC and EC6 have high strength in the longitudinal direction but in the lateral direction
they are brittle and weak. Some damages were detected on CFCC at the corners of the
deviators after finishing all experiments. Therefore, further protection is required for the
cable in the lateral direction.
A more efficient tensioning-anchoring system, which should allow a close spacing of
tendons to optimize the system or allow for multiple strands to be tensioned
simultaneously, is need for field applications. The new system should be able to pull the
cable and cast the anchor on site. Additionally, curing of the grout used inside the sleeve
should be within hours.
5.4 Issues for Inspection and Repair Specifications
For the structures, such as segmental bridge, which allow the access to the cables, the
condition of the tendons can be detected visually much the same as the Research Team
did by mounting four web cameras inside the segmental bridge model tested at FIU to
monitor the tendons during tensioning and testing. However, sometimes the visual
detection maybe limited since some sort of covering (HDPE Pipe, etc.) should be
provided for general protection due to potential construction activities or vandalism as the
CFRP is very weak in shear. Therefore, it is important to include load cells for
continuous monitoring of all carbon fiber strands.
For the structures, such as pier cap, which the condition of the cable cannot be detected
visually, load cells are certainly needed.
Since the unbonded CFRP post-tensioning system is not grouted, rehabilitation for the
damaged cable will be much easier than the bonded system. Additionally, means should
be provided to pull through and anchor additional strands if necessary.

76
Chapter 6 Summary and Conclusions The primary objective of this research project was to assess the feasibility of the use of
innovative Carbon Fiber Reinforced Polymer (CFRP) tendons and to develop guidelines for
CFRP in post-tensioned bridge applications, including segmental bridges and pier caps. The
main motivation for the use of advanced composites is that they are not susceptible to corrosion
unlike prestressing steel.
This project consisted of a three part investigation. The first part is the 1:3½ scaled model of the
Long Key segmental box girder bridge post-tensioned using three different types of strands;
namely, CFCC, EC6, and steel. The bridge model was tested at three different prestress levels
and at three different loading configurations. The most important distinction between the two
types of carbon fiber strands is their elastic moduli, which for EC6 is about 93% of that of steel,
while for CFCC is only 77% of that of steel. A finite element model of the same scaled
segmental bridge model was developed and calibrated against the experimental data. A
parametric study was also carried out to investigate the effect of the elastic modulus of carbon
fiber strands on the performance of the post-tensioned segmental bridge.
The second part is the 1:5½ scaled model of a typical interior hammerhead pier of San Antonio
downtown “Y” project. The pier cap model was made with two identical cantilever overhangs as
a test bed for a side by side comparison of the performance of the same three types of strands
used for the segmental bridge model with unbonded post-tensioning as the primary and sole
flexural reinforcement. Two different strand arrangements were used for the post-tensioning of
the model, one with eight strands that represented 27% excess capacity over demand, and
another with six strands representing 1.5% under-design. The pier cap model was tested under
service and factored flexure and shear loads, and 93% of factored flexure for the case of six-
strand arrangement.
The last part of the study is the CFCC anchorage and creep rupture test. Four CFCC tendons
were stressed at 95% of the guaranteed capacity provided by the manufacturer for 5 months with
the anchors made by the Research Team.
These experimental and analytical studies led to the following conclusions and recommendations.
77
6.1 CFRP Post-Tensioned Segmental Bridge
CFCC and EC6 have the potential for use in post-tensioned segmental bridges, from the
perspectives of both constructability and design even though some of the construction
details for CFCC and EC6 post-tensioning mechanisms and strand arrangements are quite
different from those commonly used for the steel post-tensioning system.
The main constructability concern for CFCC and EC6 tendons is that their end
anchorages are factory-made together with the strands, and therefore, strands must be
ordered at predetermined lengths, considering the increased elongation of the stressed
tendons. The system does not easily accommodate deviations from the pre-ordered length
and may require abandoning the entire cable or potentially developing a build-up at the
jacking end to make up for the difference. To date, field application of the anchorages are
not well proven and require a substantial amount of time.
The segmental bridge model shows a bilinear response irrespective of the type of strand,
whether carbon or steel. While the initial stiffness is generally the same for all three types
of strands, the secondary stiffness is higher for EC6 and steel strands, in comparison with
CFCC strands, after decompression and joint opening.
Higher prestress levels can delay joint openings and reduce overall deflections in the
segmental bridge model after joint opening.
Given the higher flexibility of the segmental bridge model post-tensioned with CFCC, a
stiffness-based equivalency approach may provide a more comparable performance to the
same bridge model post-tensioned with steel beyond service load. Such an approach,
however, may lower the stress in CFCC commensurate with its lower elastic modulus.
However, the behavior beyond service limit is typically not a concern as long as the
ultimate capacity are similar or meet the load demand at this stage of philosophy for
design. Additionally, epoxy joints are required for the segmental bridges nowadays,
which could provide some slight differences in behavior compared to the segmental
bridge with dry joints.
6.2 CFRP Post-Tensioned Pier Cap
For application of un-bonded CFCC and EC6 strands for post-tensioning of pier caps,
similar constructability problems exist as that for the application in segmental bridges.
However, this may not be as large of an obstacle.
Design of un-bonded post-tensioned pier caps may follow AASHTO (2012), selecting
CFCC or EC6 strands (number and size) with the same capacity as that of steel strands.
The design should limit the stress level in carbon fiber strands to 65% of their guaranteed
strength, according to the ACI Committee 440 (2004).
Given the strength-based design of the pier cap, the elastic moduli of different carbon
fiber strands did not seem to have affected the serviceability performance of the pier cap
78
model with respect to either cracking or deflection. Therefore, allowable stress levels of
ACI Committee 440 (2004) for carbon fiber strands can be followed quite safely.
Considering both serviceability and overload conditions, the general performance of the
pier cap model under both flexure and shear loading was quite acceptable using either
CFCC or EC6 strands, and comparable to that of steel strands. No major difference in the
performance was noted between the three types of strands.
Future research is needed to investigate the fatigue and long-time performance of pier
caps using unbonded post-tensioning CFCC or EC6 strands.
6.3 CFCC Creep Rupture Test
It is feasible to make a generic anchorage device for CFCC tendons in the field with
adequate strength, using expansive cement grout. Long-term performance of the grout
will require further in-depth studies.
Creep stress test of four CFCC tendons at 95% of manufacturer guaranteed strength for a
period of over 3,624 hours shown that the stress level can be maintained and that no sign
of rupture exists in the tendons. No slippage of the tendons from the anchorage device
has been observed during this study using expansive cement grout.
Average residual strength ranged from 122 to 127% compared to guaranteed
manufacturer’s breaking load. The strength loss after 3,624 hours at an average load of
0.94 ranged from -7.7 to -11.4% compared with the average experimental breaking load
of 57 kips as reference.
Further study is suggested for determining the effects of loss in anchoring force when
testing for residual strength
6.4 Recommendations for Design, Construction, Inspection, and Repair Specifications
Segmental bridges behave in a bilinear pattern. The initial stiffness of a segmental bridge
is mainly determined by the geometry of the concrete cross-section. After decompression
and joint opening of the segmental bridge, the stiffness of the cable itself greatly affect
the stiffness of the entire structure. Therefore, the cable with lower modulus of elasticity
than steel may cause much more deflection. Given the higher flexibility of segmental
bridges post-tensioned with CFCC and EC6, a stiffness-based equivalency approach
could be appropriate, which will further reduce the maximum allowable stress level of 65%
specified in ACI 440.4R-04. However, the behavior beyond service limit is typically not
a concern as long as the ultimate capacity are similar or meet the load demand at this
stage of philosophy for design.
The general performances of pier caps using CFCC and EC6 were quite comparable with
steel. For these types of short-span structures, as well as those members that require
79
transverse post-tensioning, strength-based design philosophy, similar to steel strands,
shows to be adequate, given the expected small deflections.
Both CFCC and EC6 are available in large diameters, which can reduce the number of
tendons used in the structure to achieve the same amount of post-tensioning load. It can
also address the congestion problems at the anchorage and simplify the tensioning device.
CFCC and EC6 have high strength in the longitudinal direction, but in the lateral
direction, they are brittle and weak. Some damages were detected on CFCC at the corners
of the deviators after finishing all experiments. Therefore, further protection is required
for the cable in the lateral direction.
A more efficient tensioning-anchoring system, which should allow a close spacing of
tendons to optimize the system or allow for multiple strands to be tensioned
simultaneously, is need for field applications. The new system should be able to pull the
cable and cast the anchor on site. Additionally, curing of the grout used inside the sleeve
should within hours.
For the structures, such as segmental bridge, which allow the access to the cables, the
condition of the tendons can be detected visually much the same as the Research Team
did by mounting four web cameras inside the segmental bridge model tested at FIU to
monitor the tendons during tensioning and testing. However, sometimes the visual
detection maybe limited since some sort of covering (HDPE Pipe, etc.) should be
provided for general protection due to potential construction activities or vandalism as the
CFRP is very weak in shear. Therefore, it is important to include load cells for
continuous monitoring of all carbon fiber strands.
For the structures, such as pier cap, which the condition of the cable cannot be detected
visually, load cells are certainly needed.
Since the unbonded CFRP post-tensioning system is not grouted, rehabilitation for the
damaged cable will be much easier than the bonded system. Additionally, means should
be provided to pull through and anchor additional strands if necessary.
Although not studied in this project, it is understood that the cost for CFRP tendons and
their anchorage is much higher than prestressing system using steel strands. However,
long-term costs of repair and maintenance for corrosion will be significantly reduced due
to the fact that carbon fibers are not corrosive.
80
References
AASHTO (1973). Standard Specifications for Highway Bridge, 13th
Edition. American
Association of State Highway and Transportation Officials, Washington, D.C.
AASHTO (1989). Standard Specifications for Highway Bridge, 14th
Edition. American
Association of State Highway and Transportation Officials, Washington, D.C.
AASHTO (1992). Standard Specifications for Highway Bridge, 15th
Edition. American
Association of State Highway and Transportation Officials, Washington, D.C.
AASHTO (2012). AASHTO LRFD Bridge Design Specifications, 6th
Edition (with 2013 Interim
Revisions). American Association of State Highway and Transportation Officials,
Washington, D.C.
ACI Committee 318. (2014). Building Code Requirement for Structural Concrete and
Commentary. ACI 318-14, American Concrete Institute, Farmington Hills, MI.
ACI Committee 440. (2004). Prestressing Concrete Structures with FRP Tendons. ACI 440.4R-
04, American Concrete Institute, Farmington Hills, MI.
Ando, N., Matsukawa, H., Hattori, A., and Mashima, A. (1997). “Experimental Studies on the
Long-Term Tensile Properties of RFP Tendons”. Proceedings of Third International
Symposium on Non-Metallic (FRP) Reinforcement for Concrete Structures, Japan Concrete
Institute, October 1997, pp. 203-210.
ANSYS. (2013). Release 15.0 User Manual, ANSYS, Canonsburg, PA.
Armstrong, S.D. (1994). Design and Behavior of Large Concrete Cantilever Overhang with
Combination of Prestressed and Non-Prestressed Reinforcement (M.S. Thesis). University of
Texas, Austin, TX.
Arockiasamy, M., Reddy, D.V., Sivakumar, M., and Shahawy, M. (2008). “Fatigue Loading and
Temperature Distribution in Single Cell Segmental Box Bridges.” Practice Periodical on
Structural Design and Construction, ASCE, V.13, No.3, pp. 118-127.
Billington, S.L. (1994). Behavior of Two-Span Continuous Pier Caps with Varying Levels of
Prestress (M.S. Thesis). University of Texas, Austin, TX.
Corven, J., & Moreton, A. (2004). Post-Tensioning Tendon Installation and Grouting Manual.
Federal Highway Administration, Washington, DC
Dolan, C.W., Bakis, C.E., and Nanni, A. (2001). Design Recommendations for Concrete
Structures Prestressed with FRP Tendons (Report No. DTFH61-96-C-00019). Federal
Highway Association, Washington, D.C.
81
Dolan, C.W., Leu, B.L., and Hundley, A. (1997). “Creep Rupture of Fiber Reinforced Plastics in
a Concrete Environment”, Proceedings of Third International Symposium on Non-metallic
(FRP) Reinforcement for Concrete Structures, Japan Concrete Institute, October 1997, pp.
187-194.
FDOT. (2015). “Fiber Reinforced Polymer Guidelines (FRPG).” FDOT Structural Manual, V. 4,
Tallahassee, FL.
Grace, N. F., and Singh, S. B. (2003). “Design Approach for CFRP Prestressed Concrete Bridge
Beams.” ACI Structural Journal, V. 100, No. 3, pp. 365-376.
Grace, N.F. (2000). “Response of Continuous CFRP Prestressed Concrete Bridges Under Static
and Repeated Loadings.” PCI Journal, V. 45, No. 6, 84-102.
Grace, N.F., Bebawy, M., and Ushijima, K. (2014). “Field Application of Composite Post-
Tensioning System.” Concrete International, ACI, V. 36, No.11, pp. 39-42.
Grace, N.F., Enomoto, T., Abdel-Sayed, G., Yagi, K., and Collavino, L. (2003). “Experimental
Study and Analysis of a Full-Scale CFRP/CFCC Double-Tee Bridge Beam.” PCI Journal, V.
48, No. 4, pp. 120-139.
Grace, N.F., Enomoto, T., Abel-Mohti, A., Tokal, Y., and Puravankara, S. (2008). “Flexural
Behavior of Concrete Box Beams Post-tensioned with Unbonded Carbon-Fiber-Composite
Cables.” PCI Journal, V. 53, No. 4, pp. 62-82.
Grace, N.F., Enomoto, T., Baah, P., and Bebawy, M. (2012). “Flexural Behavior of CFRP
Precast Prestressed Decked Bulb T Beams.” ASCE Journal of Composites for Construction,
V. 16, No. 3, pp. 225-234.
Grace, N.F., Jensen, E., Matsagar, V., and Penjendra, P. (2013). “Performance of AASHTO
Beam Bridge Prestressed with CFRP Tendons.” ASCE Journal of Bridge Engineering, V. 18,
No. 2, pp. 110-121.
Grace, N.F., Navarre, F.C, Nacey, R.B., Bonus, W., and Collavino, L. (2002). “Design-
Construction of Bridge Street Bridge-First CFRP Bridge in the United States.” PCI Journal,
V. 47, No. 5, pp. 20-35.
Grace, N.F., Patki, K., Soliman, E., and Hanson, J. (2011) “Flexural Behavior of Side-by-side
Box-beam Bridges: A comparative Study.” PCI Journal, V. 56, No. 3, pp. 94-112.
Design Manual No. 5 (2008). Prestressing Concrete Structures with FRPs. Intelligent Sensing
for Innovative Structures Canada Corporation (ISIS), Winnipeg, Manitoba, Canada.
JSCE Research Subcommittee on Continuous Fiber Reinforcing Materials. (1997).
“Recommendation for Design and Construction of Concrete Structures using Continuous
Fiber Reinforcing Materials.” Concrete Engineering Series 23.

82
MacGregor, R.J.G., Kreger, M.E., and Breen, J.E. (1989). “Strength and Ductility of a Three-
span Externally Post-tensioned Segmental Box Girder Bridge Model.” Research Report 365-
3F, University of Texas at Austin, Austin, TX.
MaineDOT Transportation Research Division. (2013). “Post-Tensioned Carbon Fiber Composite
Cable (CFCC), Little Pond Bridge, Route 302, Fryeburg, Maine.” MaineDOT Technical
Report 13-02.
MDOT. (2011). “Carbon Fiber Composite Cables Anchoring Device - 12DS800 (D195).”
MDOT Special Provision.
MDOT. (2011). “Carbon Fiber Composite Cables Transverse Post-Tensioning - 12DS708
(A255).” MDOT Special Provision.
MDOT. (2011). “Carbon Fiber Reinforced Polymer (CFRP) Element - 12DS819 (A260).”
MDOT Special Provision.
MDOT. (2013). “Carbon Fiber Composite Cable Element Instrumentation and Data Collection -
12DS800 (D480).” MDOT Special Provision.
MDOT. (2013). “Carbon Fiber Composite Cables Transverse Post-Tensioning - 12DS708
(E430).” MDOT Special Provision.
MDOT. (2013). “Carbon Fiber Reinforced Polymer Post Tensioning - 12DS708 (E265).” MDOT
Special Provision.
MDOT. (2013). “Field Installation of Carbon Fiber Composite Cable Reinforcement - 12DS800
(D475).” MDOT Special Provision.
Megally, S., Seible, F., and Dowell, R.K. (2003a). “Seismic Performance of Precast Segmental
Bridges: Segment-to-segment Joints Subjected to High Flexural Moments and Low Shears.”
PCI Journal, V. 48, No.2, pp. 80-96.
Megally, S., Seible, F., and Dowell, R.K. (2003b). “Seismic Performance of Precast Segmental
Bridges: Segment-to-segment Joints Subjected to High Flexural Moments and High Shears.”
PCI Journal, V. 48, No.3, pp. 72-90.
Megally, S., Seible, F., Garg, M., and Dowell, R.K. (2002). “Seismic Performance of Precast
Segmental Bridge Superstructures with Internally Bonded Prestressing Tendons.” PCI
Journal, 4V. 7, No.2, pp. 40-56.
Pereira, R. (1994). “Behavior of Structural Concrete Cantilever Piers using T-Headed
Reinforcing Bars and Varied Prestressing Design Criteria” M.S. Thesis, University of Texas,
Austin, TX.
Roddenberry, M., Mtenga, P., and Joshi, K. (2014). “Investigation of Carbon Fiber Composite
Cables (CFCC) in Prestressed Concrete Piles.” Final Report, Florida Department of
Transportation, Tallahassee, FL, 307 p.
83
Rohleder, W.J., Tang, B., Doe, T.A., Grace, N.F., and Burgess, C.J. (2008). “Carbon Fiber-
Reinforced Polymer Strand Application on Cable-Stayed Bridge, Penobscot Narrows, Maine.”
Journal of the Transportation Research Board, No. 2050, pp. 169–176.
Saadatmanesh, H., and Tannous, F.E. (1999). “Relaxation, Creep and Fatigue Behavior of
Carbon Fiber Reinforced Plastic Tendons”, ACI Materials Journal, V. 96, No. 2, pp. 143-153.
Yamaguchi, T., Kato, Y., Nishimura, T., and Uomoto, T. (1997). “Creep Rupture of FRP Rods
Made of Aramid, Carbon and Glass Fibers”, Proceedings of Third International Symposium
on Non-metallic (FRP) Reinforcement for Concrete Structures, Japan Concrete Institute,
October 1997, pp. 179-186.

84
Appendices
Appendix A. CFRP Post-Tensioned Segmental Bridge Model Preparation
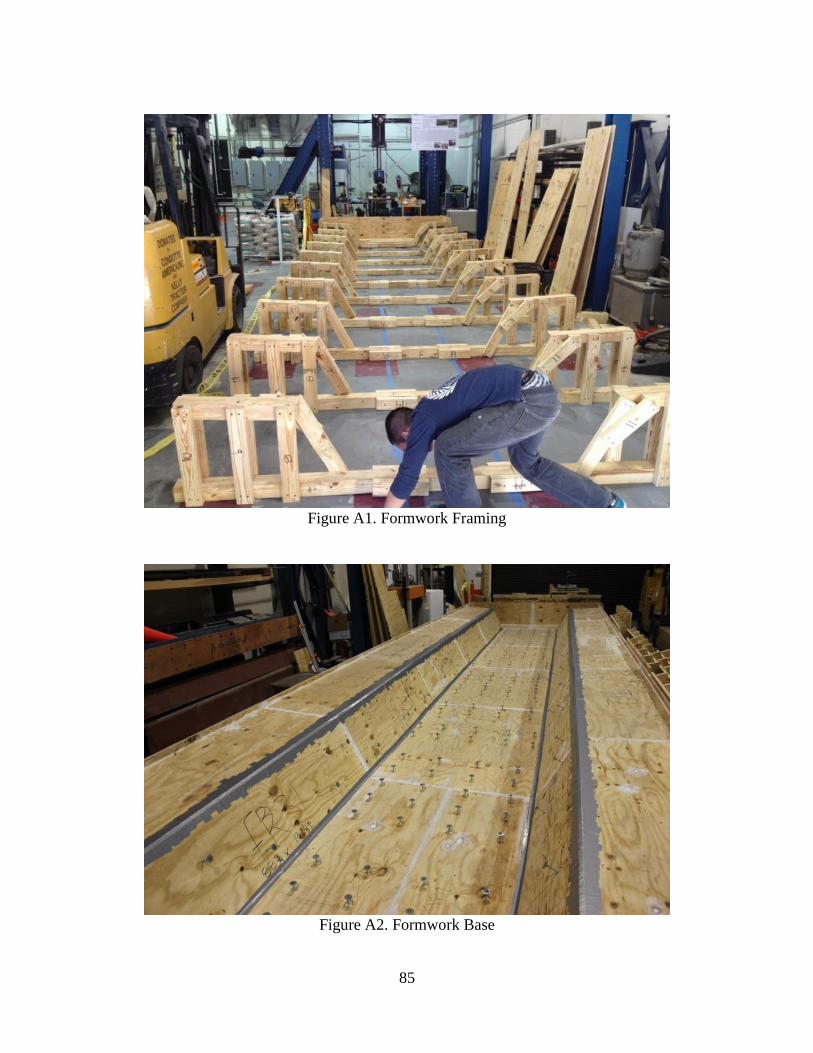
85
Figure A1. Formwork Framing
Figure A2. Formwork Base
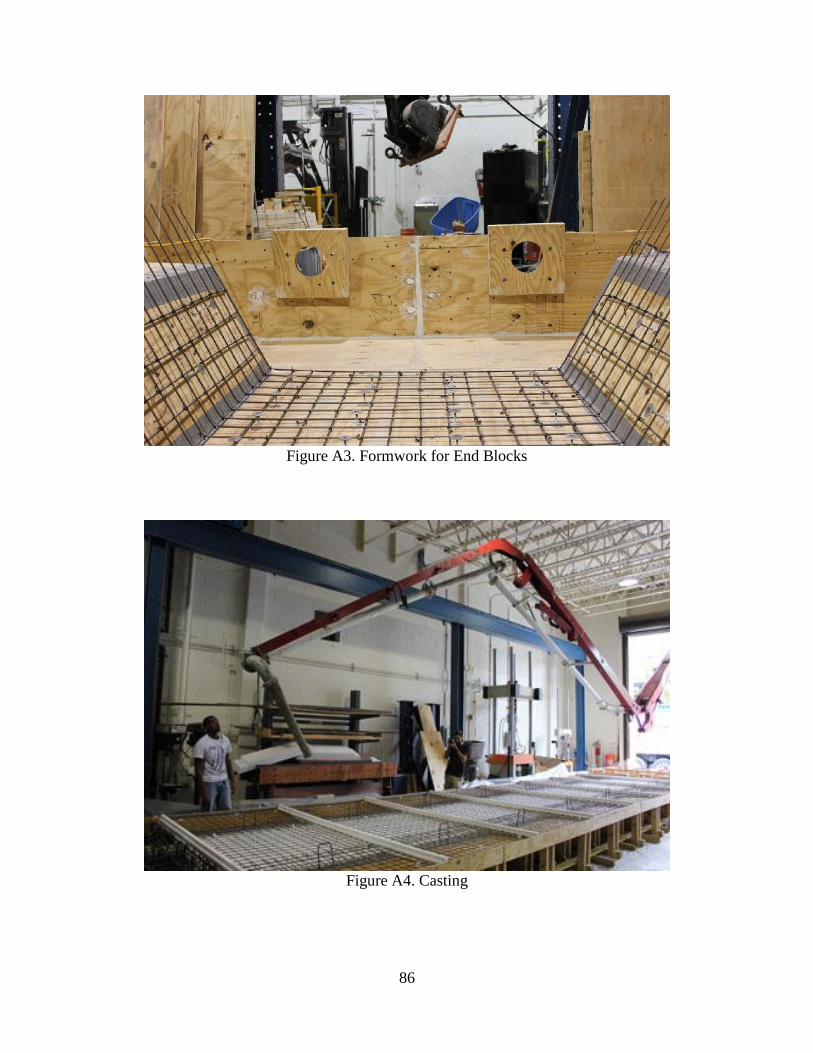
86
Figure A3. Formwork for End Blocks
Figure A4. Casting
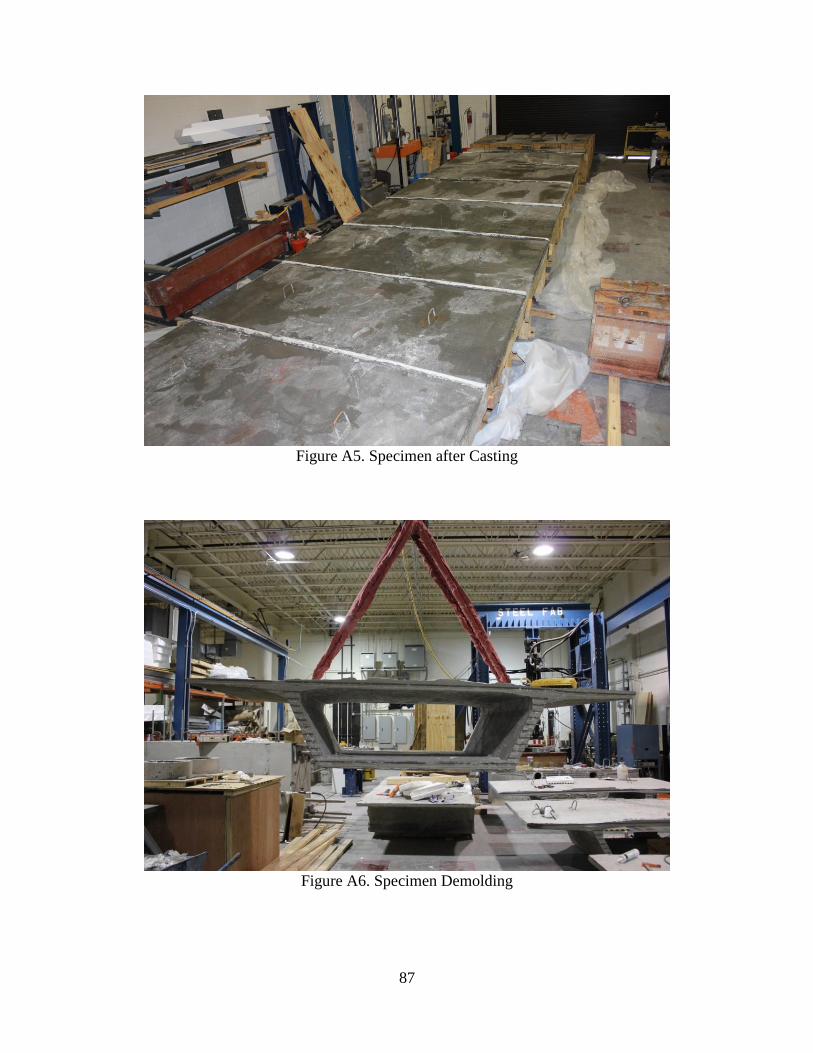
87
Figure A5. Specimen after Casting
Figure A6. Specimen Demolding
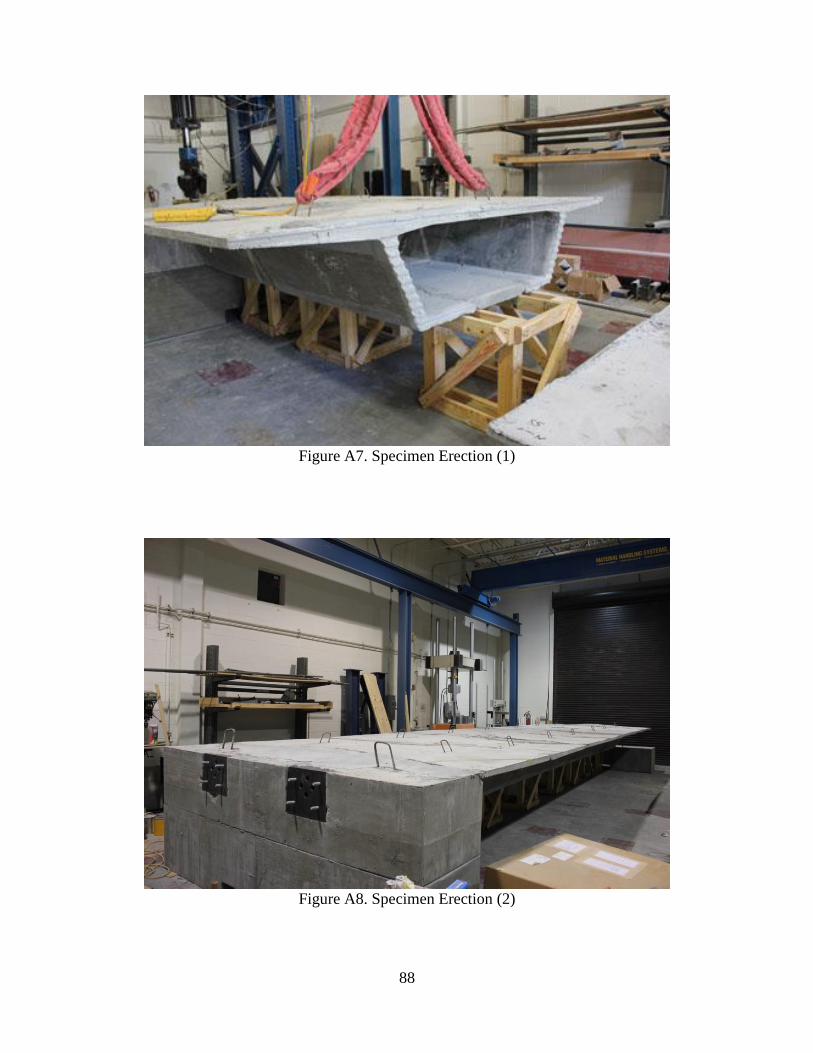
88
Figure A7. Specimen Erection (1)
Figure A8. Specimen Erection (2)
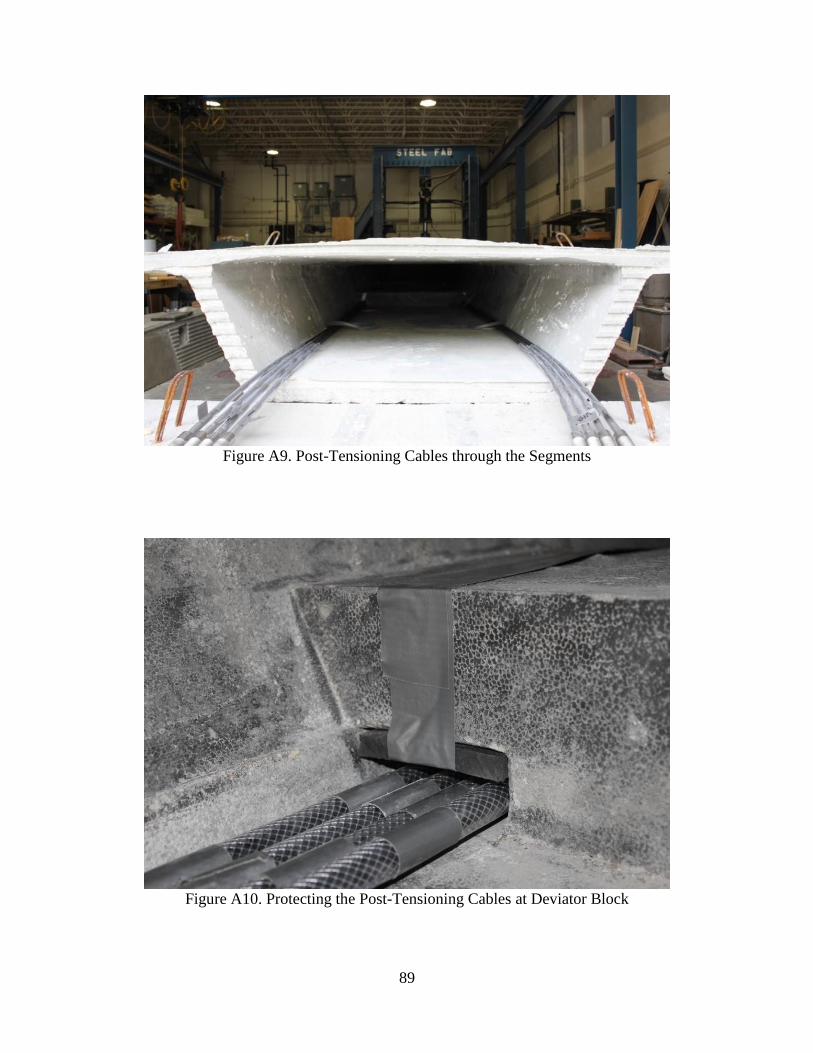
89
Figure A9. Post-Tensioning Cables through the Segments
Figure A10. Protecting the Post-Tensioning Cables at Deviator Block

90
Appendix B. Test Setup for All Segmental Bridge Model Loading Positions
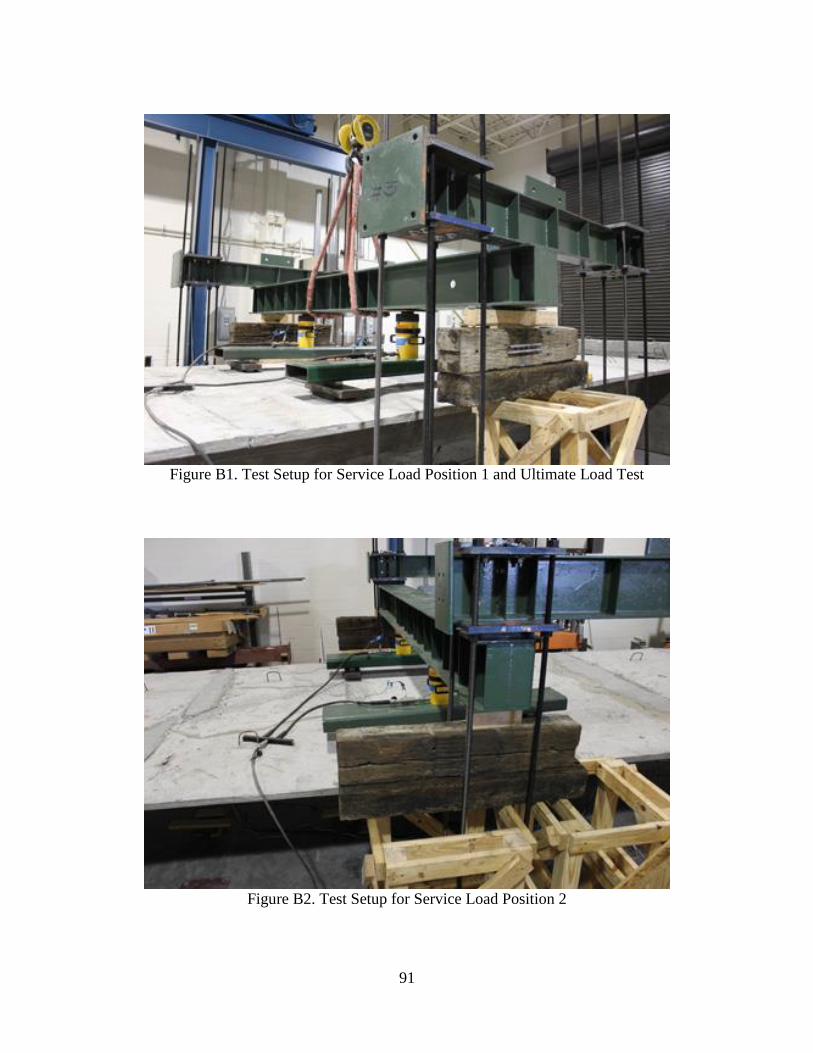
91
Figure B1. Test Setup for Service Load Position 1 and Ultimate Load Test
Figure B2. Test Setup for Service Load Position 2
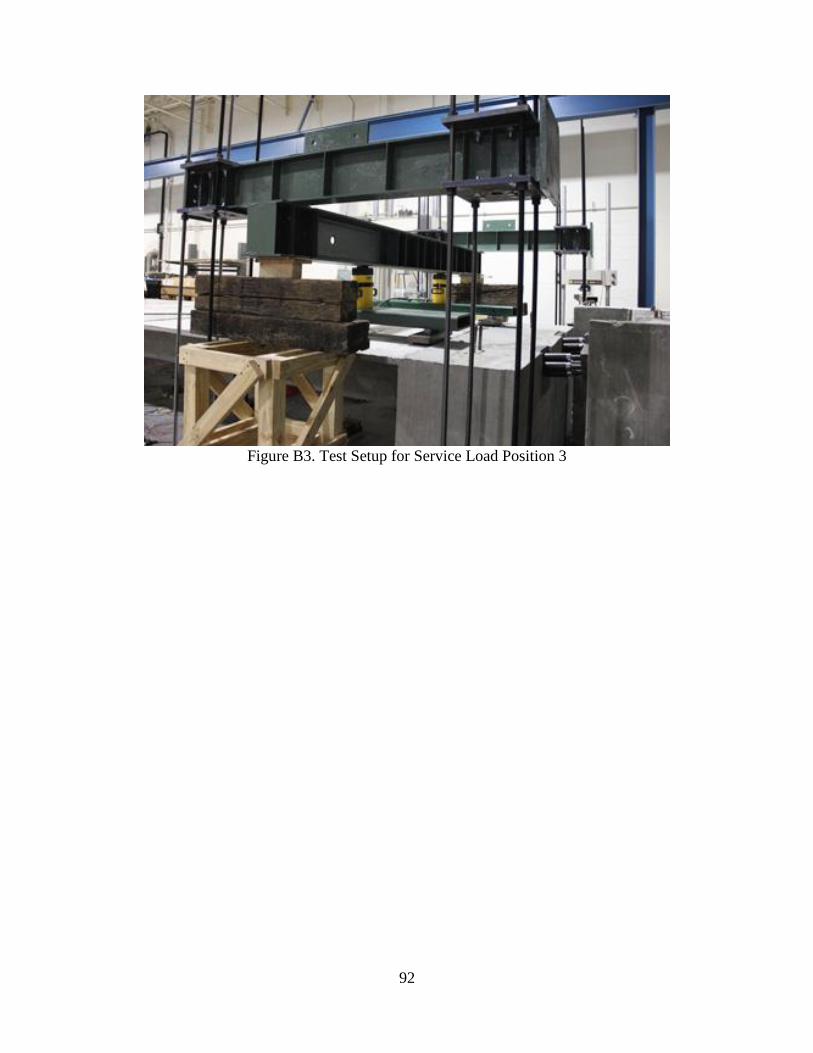
92
Figure B3. Test Setup for Service Load Position 3

93
Appendix C. Test Results for CFRP Post-Tensioned Segmental Bridge Model
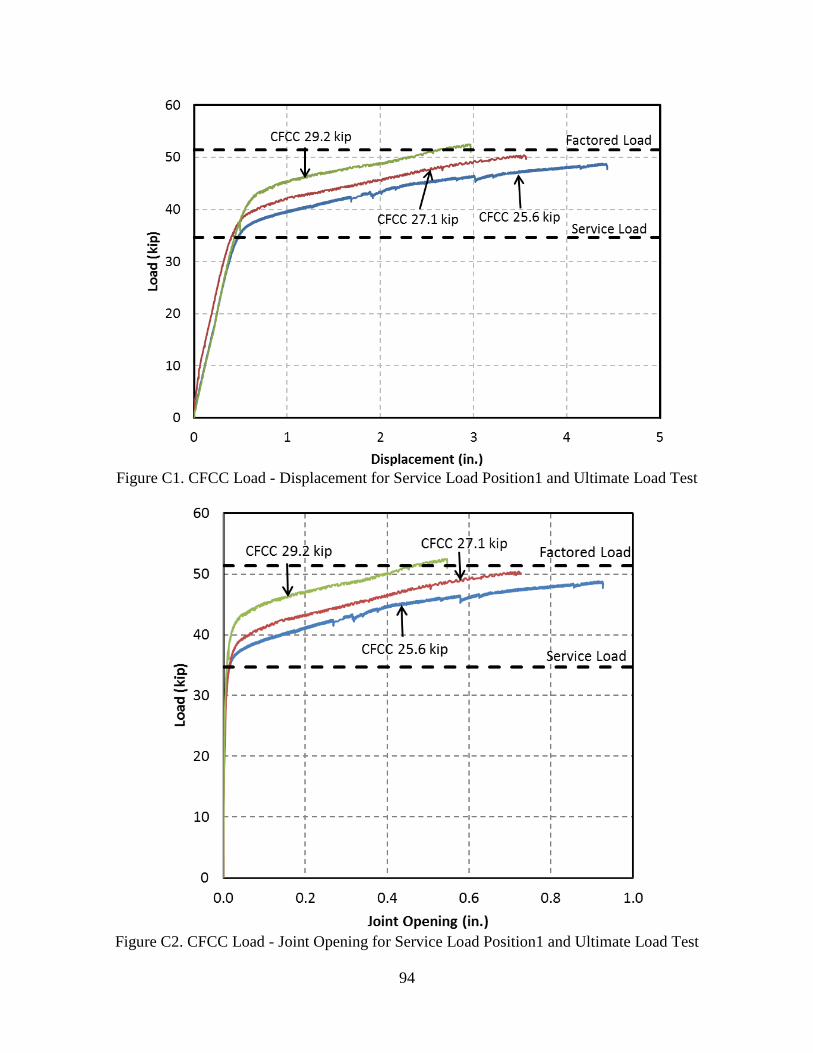
94
Figure C1. CFCC Load - Displacement for Service Load Position1 and Ultimate Load Test
Figure C2. CFCC Load - Joint Opening for Service Load Position1 and Ultimate Load Test
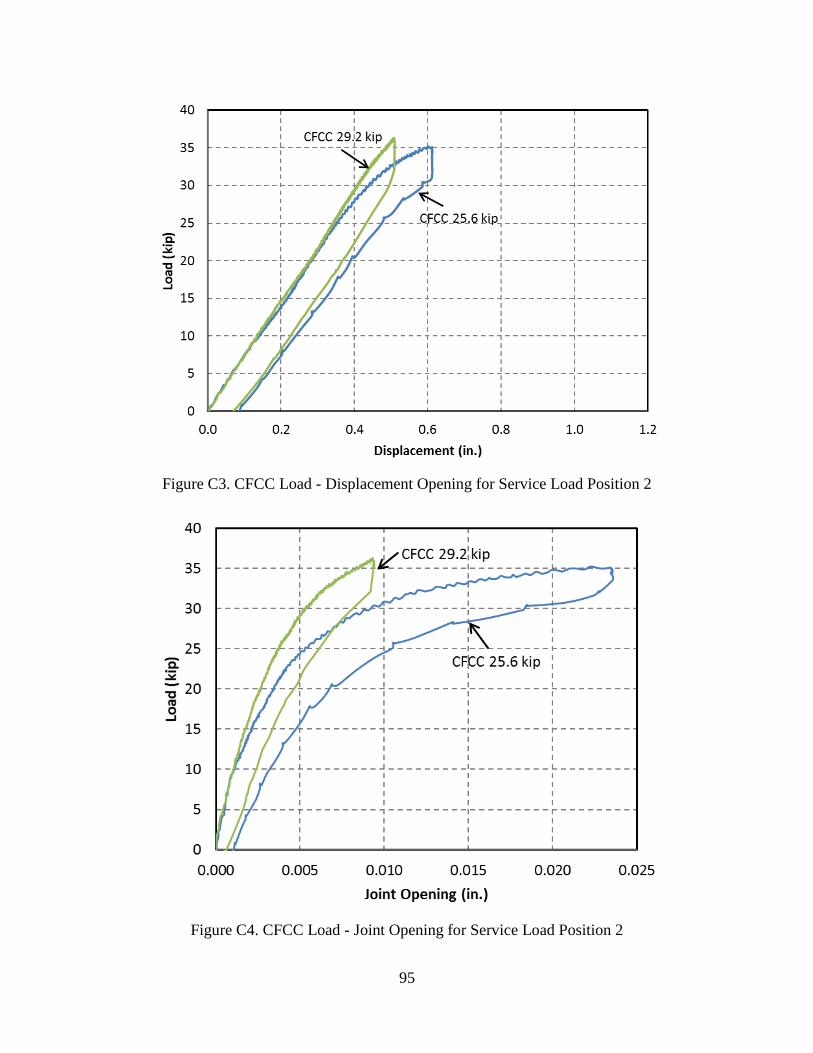
95
Figure C3. CFCC Load - Displacement Opening for Service Load Position 2
Figure C4. CFCC Load - Joint Opening for Service Load Position 2

96
Figure C5. CFCC Load - Displacement Opening for Service Load Position 3
Figure C6. CFCC Load - Joint Opening for Service Load Position 3
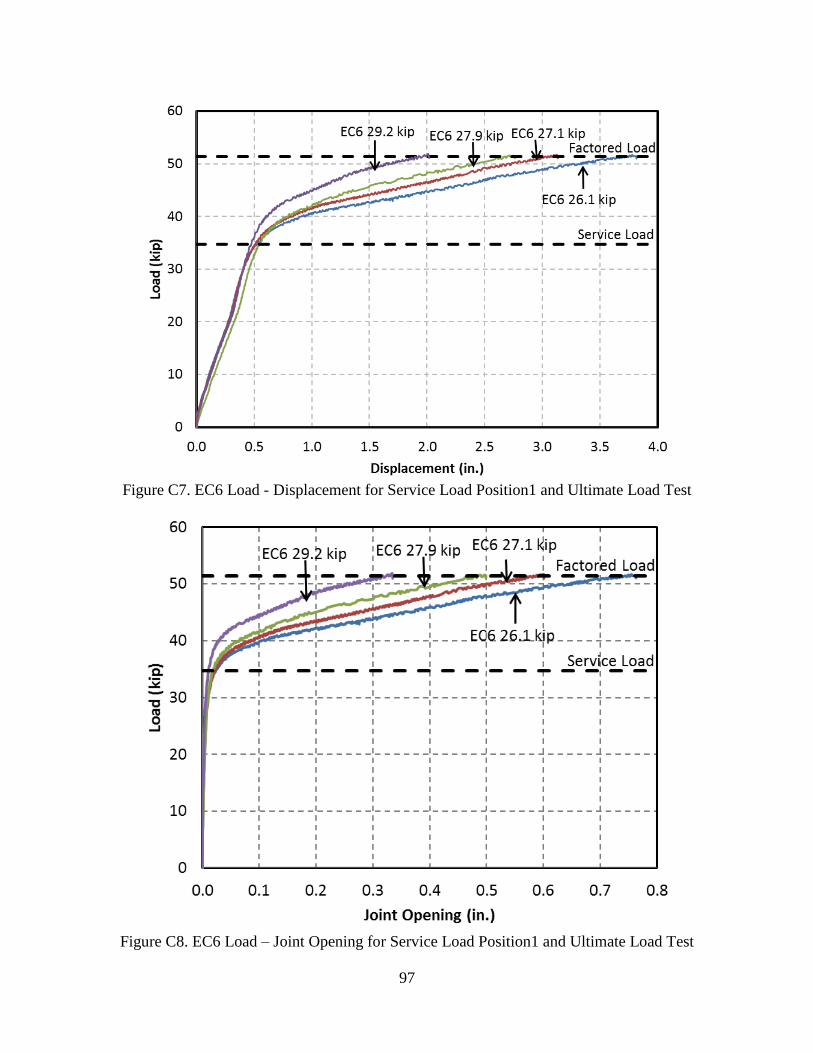
97
Figure C7. EC6 Load - Displacement for Service Load Position1 and Ultimate Load Test
Figure C8. EC6 Load – Joint Opening for Service Load Position1 and Ultimate Load Test

98
Figure C9. EC6 Load - Displacement for Service Load Position 2
Figure C10. EC6 Load – Joint Opening for Service Load Position 2
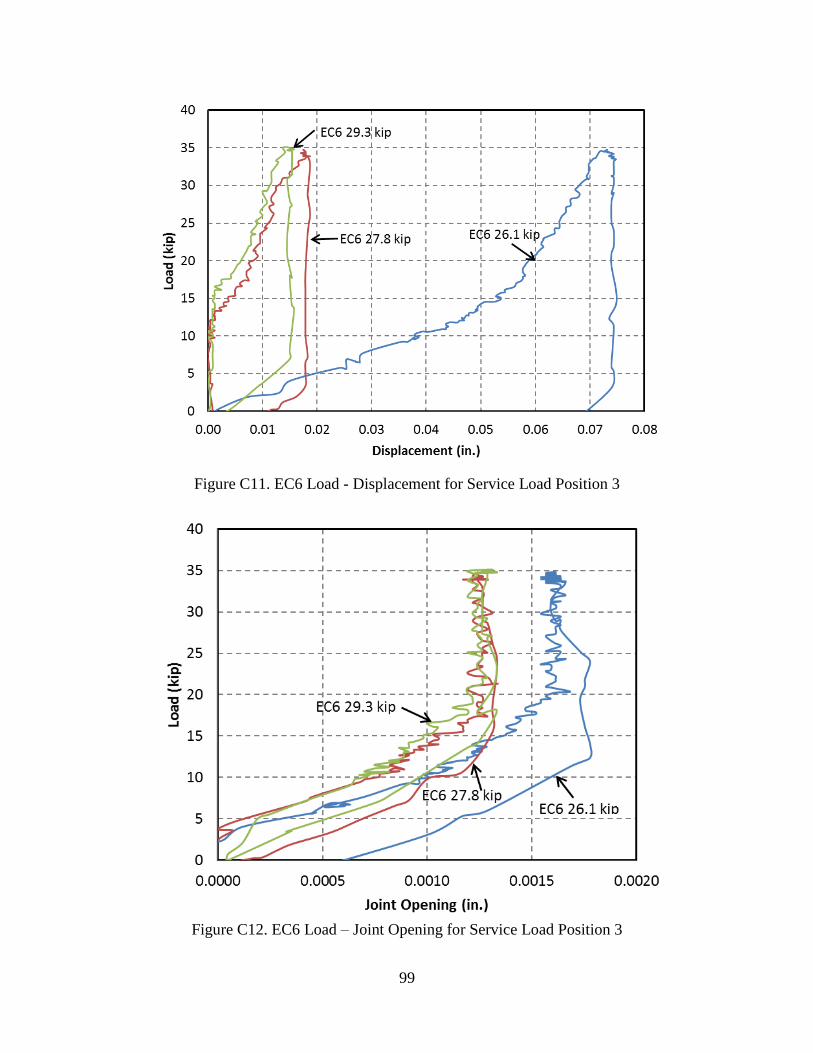
99
Figure C11. EC6 Load - Displacement for Service Load Position 3
Figure C12. EC6 Load – Joint Opening for Service Load Position 3
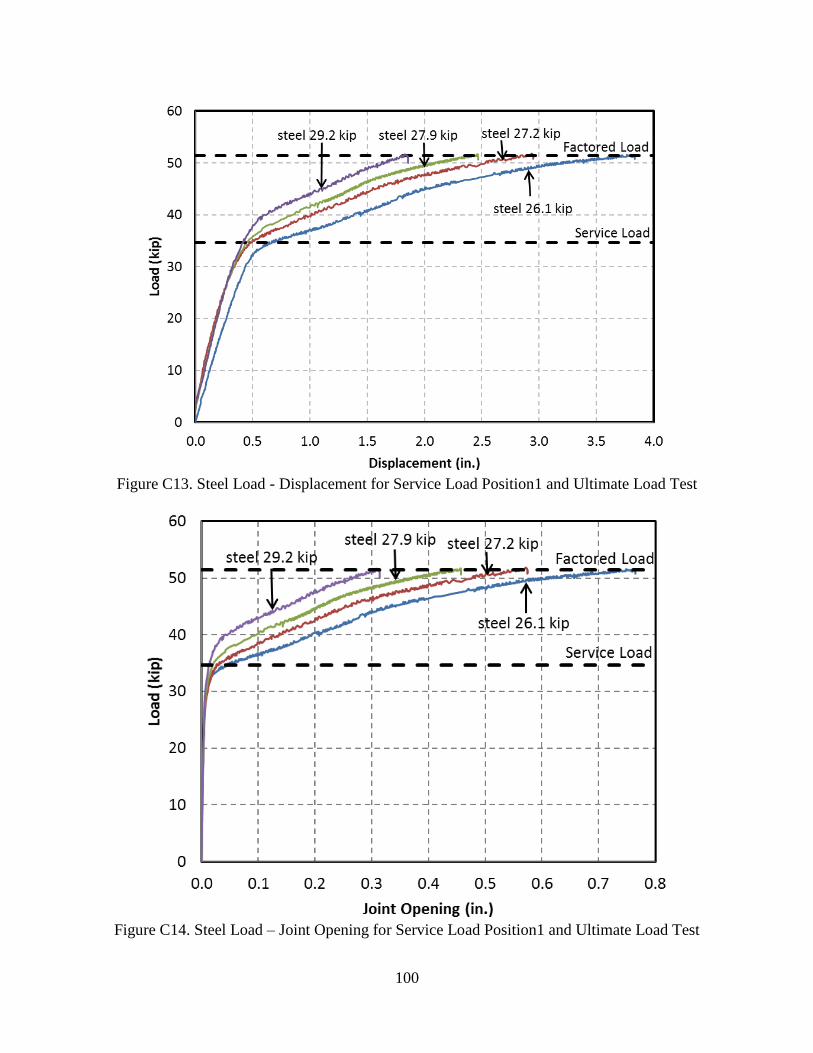
100
Figure C13. Steel Load - Displacement for Service Load Position1 and Ultimate Load Test
Figure C14. Steel Load – Joint Opening for Service Load Position1 and Ultimate Load Test
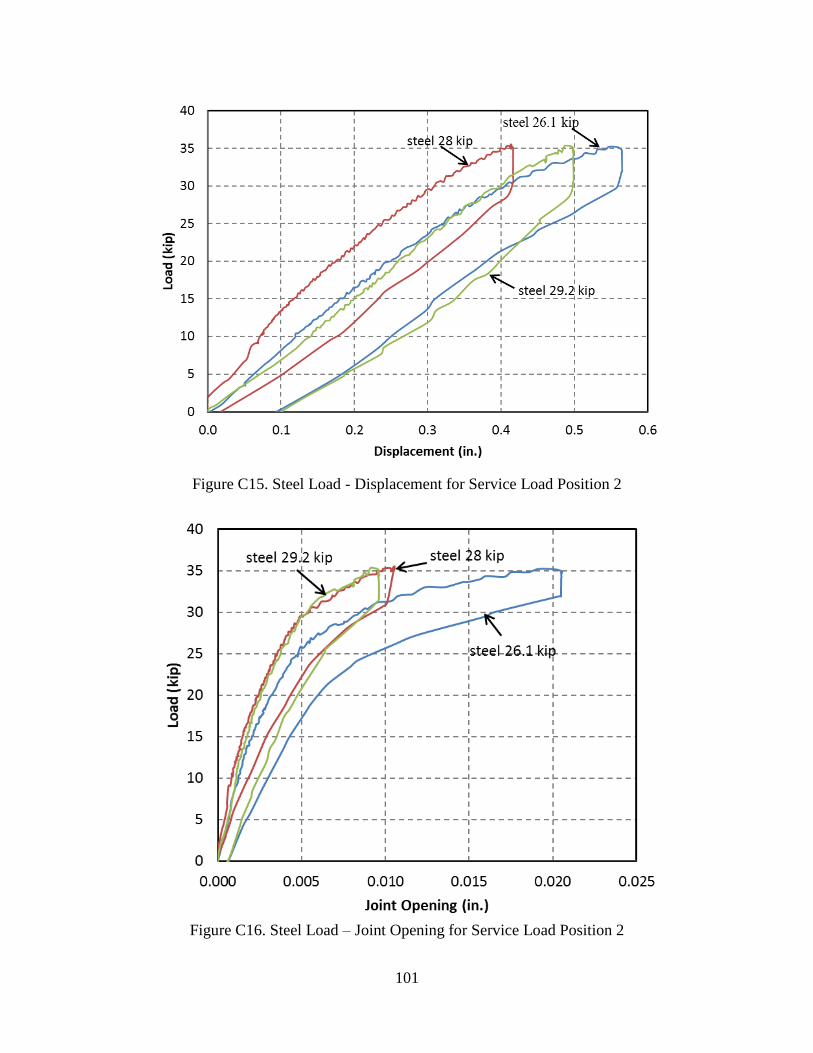
101
Figure C15. Steel Load - Displacement for Service Load Position 2
Figure C16. Steel Load – Joint Opening for Service Load Position 2
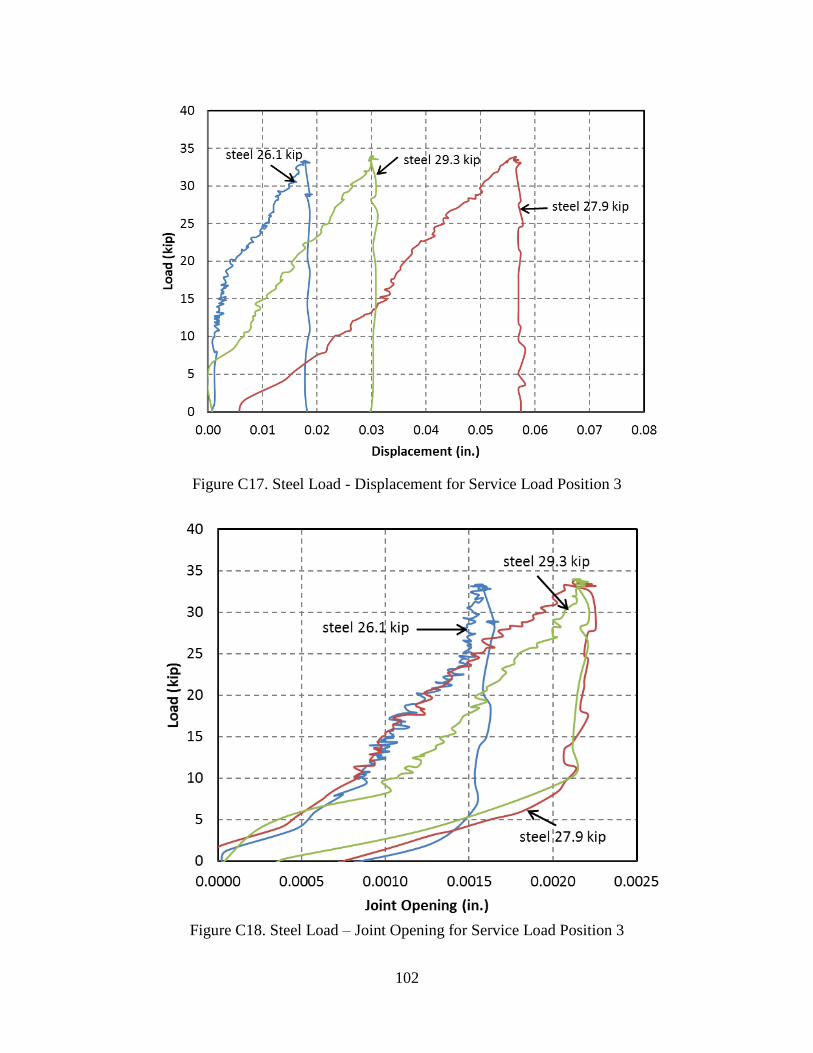
102
Figure C17. Steel Load - Displacement for Service Load Position 3
Figure C18. Steel Load – Joint Opening for Service Load Position 3

103
Appendix D. CFRP Post-Tensioned Pier Cap Model Preparation
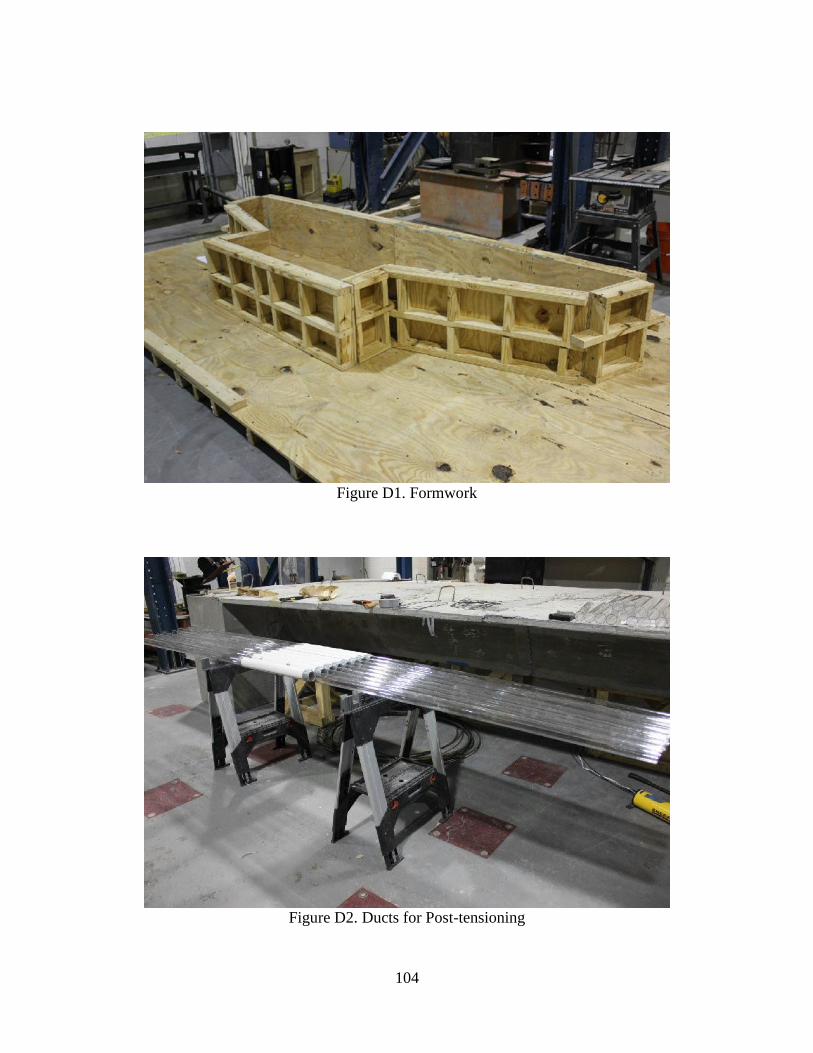
104
Figure D1. Formwork
Figure D2. Ducts for Post-tensioning
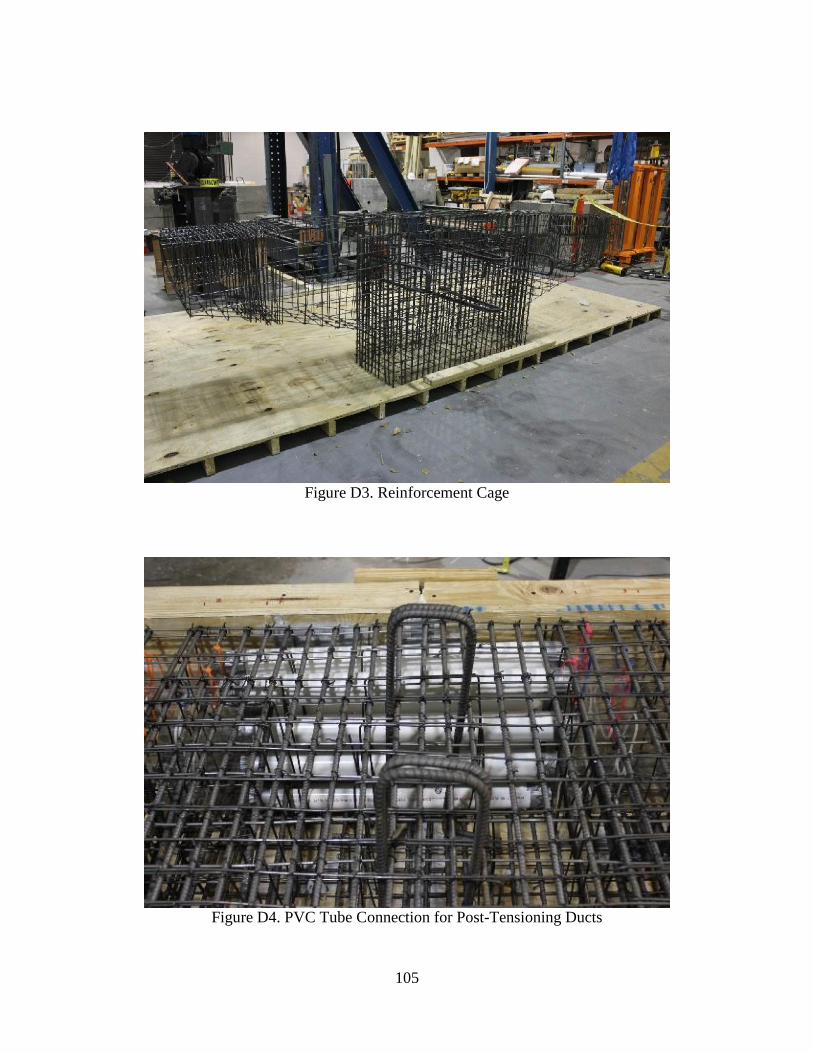
105
Figure D3. Reinforcement Cage
Figure D4. PVC Tube Connection for Post-Tensioning Ducts
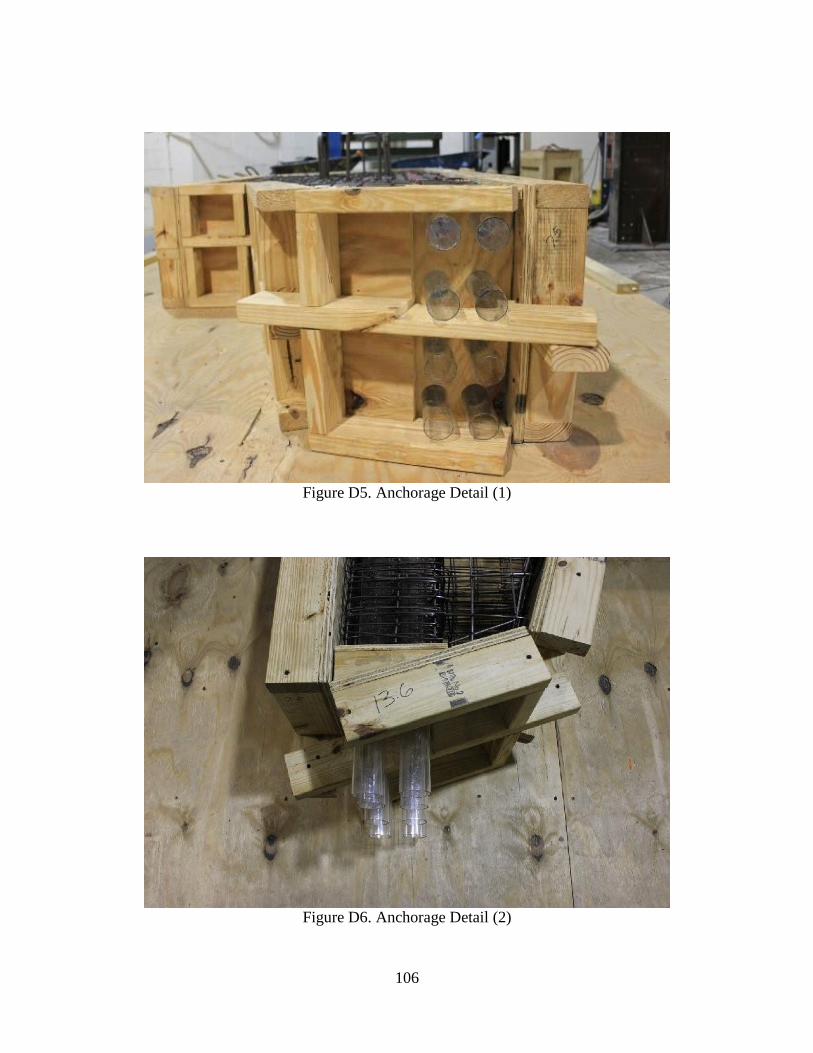
106
Figure D5. Anchorage Detail (1)
Figure D6. Anchorage Detail (2)
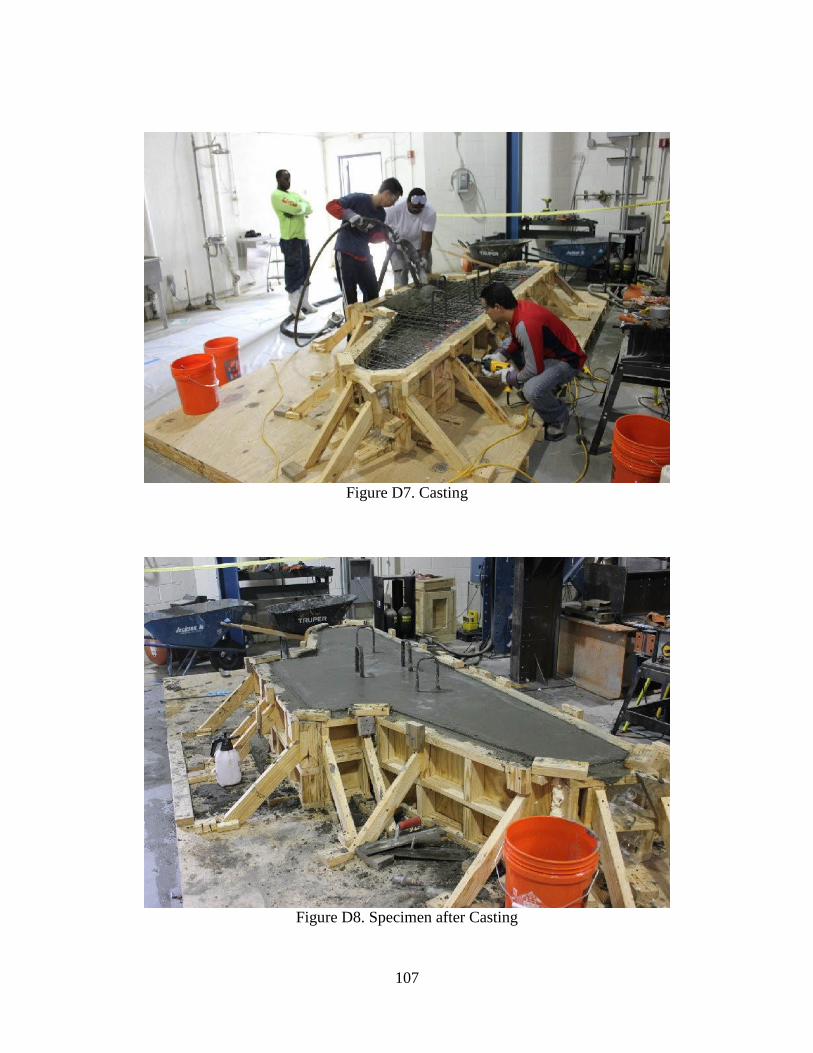
107
Figure D7. Casting
Figure D8. Specimen after Casting
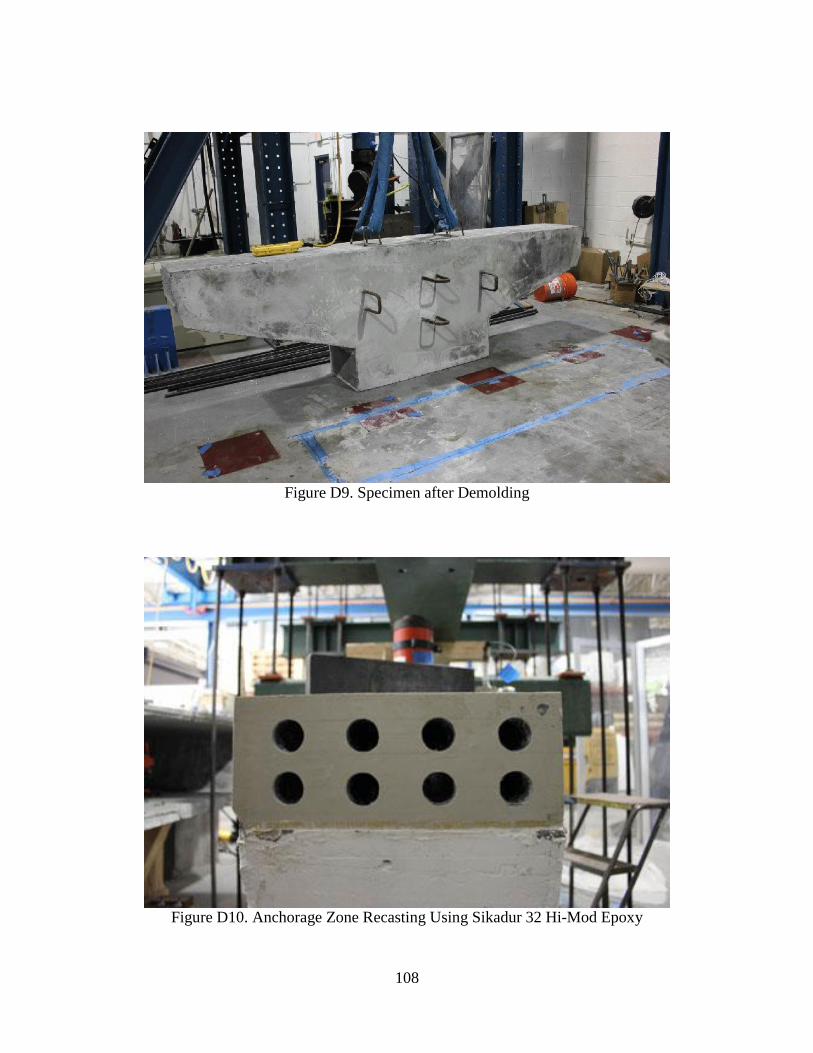
108
Figure D9. Specimen after Demolding
Figure D10. Anchorage Zone Recasting Using Sikadur 32 Hi-Mod Epoxy
109
Appendix E. Technical Data for the Coil Spring

110
111
Appendix F. Detailed Dimensions of Creep Rupture Test Frame
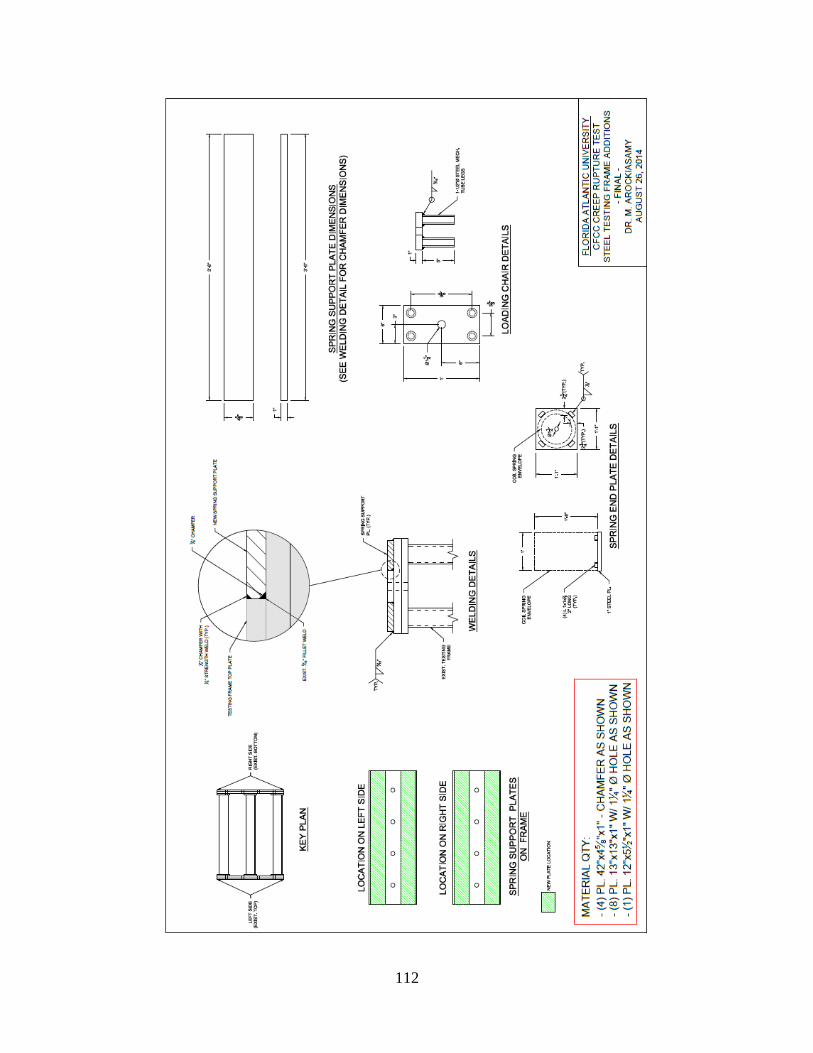
112