USE OF DREDGED MATERIALS - NJ
422
USE OF DREDGED MATERIALS FOR THE CONSTRUCTION OF ROADWAY EMBANKMENTS VOLUME III OF V APPENDICES C-G PREPARED BY : SADAT ASSOCIATES, INC. PRINCETON, NEW JERSEY ON BEHALF OF : OENJ CORPORATION, INC. BAYONNE, NEW JERSEY SUBMITTED TO : NEW JERSEY MARITIME RESOURCES NEW JERSEY DEPARTMENT OF TRANSPORTATION NEW JERSEY DEPARTMENT OF ENVIRONMENTAL PROTECTION NEW JERSEY PORT AUTHORITY OF NEW YORK AND NEW JERSEY NEW JERSEY TRANSIT DECEMBER 2001
Transcript of USE OF DREDGED MATERIALS - NJ
USE OF DREDGED MATERIALS FOR THE
CONSTRUCTION OF ROADWAY EMBANKMENTS
VOLUME III OF V APPENDICES C-G
PREPARED BY:
SADAT ASSOCIATES, INC. PRINCETON, NEW JERSEY
ON BEHALF OF:
OENJ CORPORATION, INC. BAYONNE, NEW JERSEY
SUBMITTED TO:
NEW JERSEY MARITIME RESOURCES NEW JERSEY DEPARTMENT OF TRANSPORTATION
NEW JERSEY DEPARTMENT OF ENVIRONMENTAL PROTECTION NEW JERSEY PORT AUTHORITY OF NEW YORK AND NEW JERSEY
NEW JERSEY TRANSIT
DECEMBER 2001

APPENDIX C
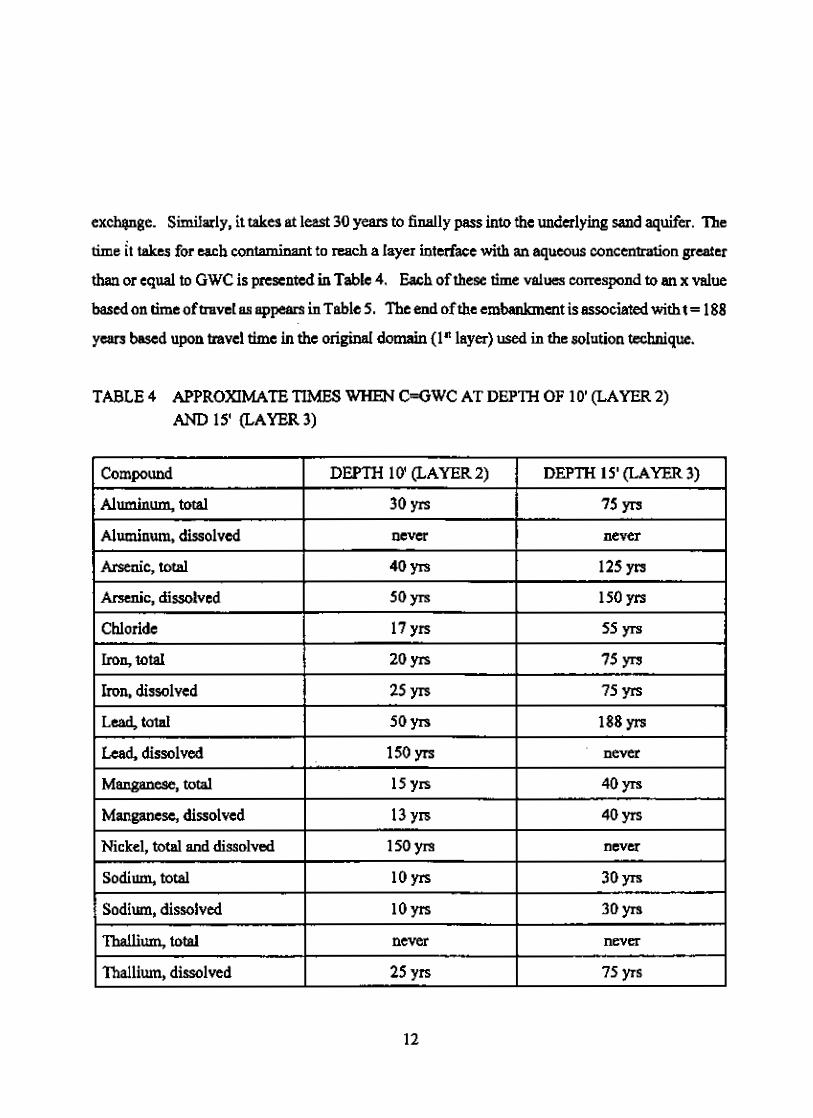
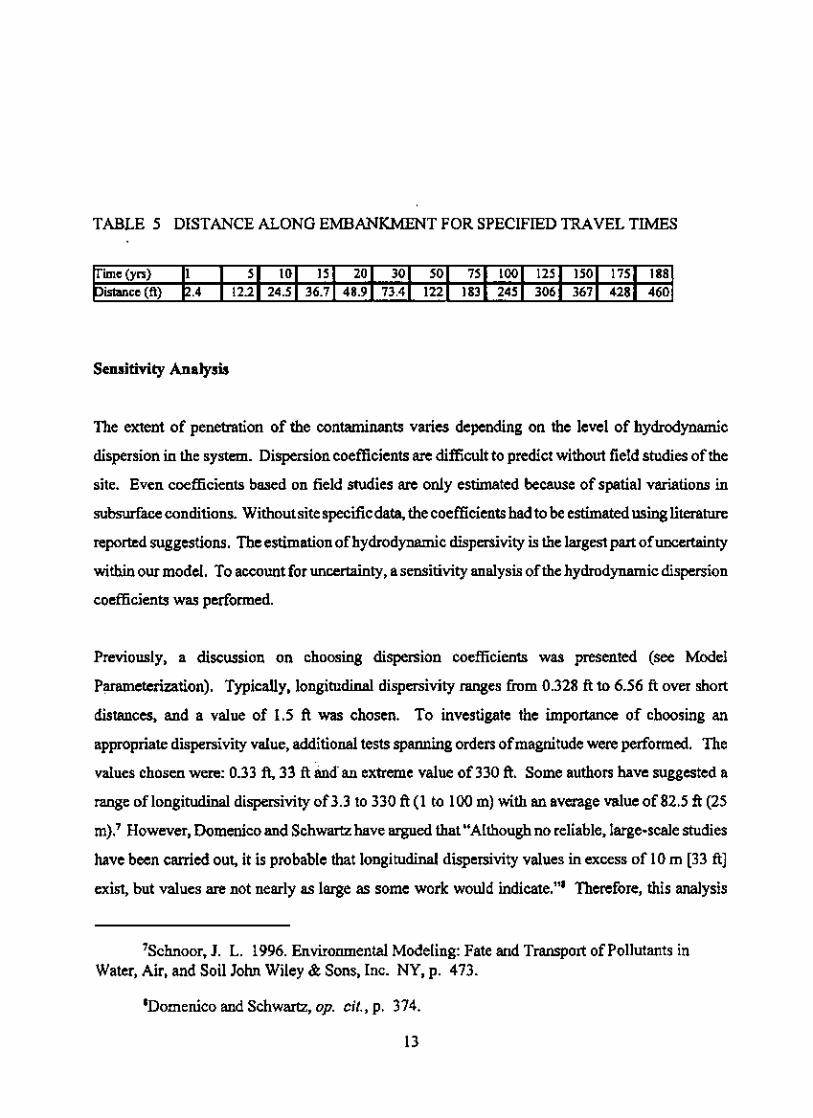
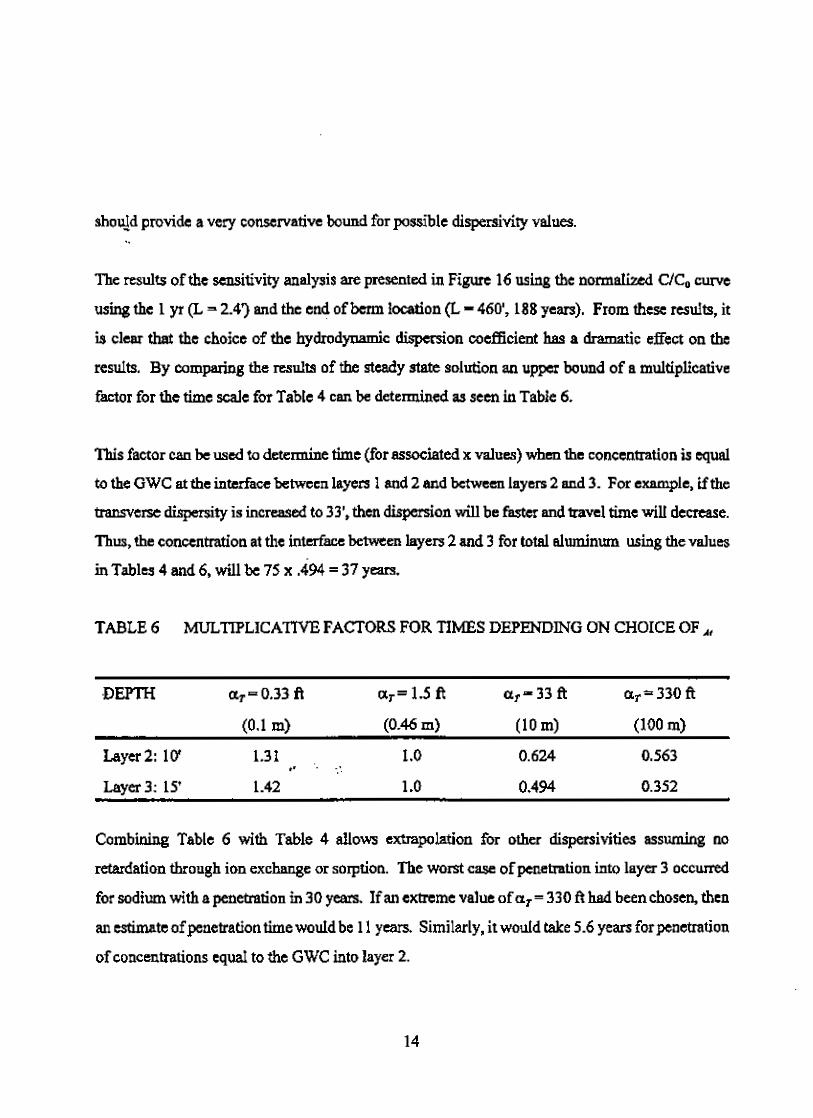
Impact of Embankment Percolate into Underlying Aquifer System Groundwater


APPENDIX D
Final Geotechnical Report

i
FINAL GEOTECHNICAL REPORT
OENJ / NJDOT ROADWAY EMBANKMENT PILOT PROJECT AT PARCEL G OF THE OENJ REDEVELOPMENT SITE
ELIZABETH, UNION COUNTY, NEW JERSEY
Prepared by:
Ali Maher, Ph.D. Soiltek, Inc.
Submitted To:
New Jersey Maritime Resources New Jersey Department of Transportation
Sadat Associates, Inc. OENJ Corp.
December 14, 2001

ii
TABLE OF CONTENTS
1. INTRODUCTION………………………………………………………….1
2. FOUNDATION INVESTIGATION……………………………………….4
2.1 SCOPE OF THE FOUNDATION INVESTIGATION………………4
2.2 SUBSURFACE INVESTIGATION AND SOIL PROFILES………...5
Stratum 1: Mixed refuse fill………………………………...….6
Stratum 2: Soft organic peat(Pt)/elastic silt (MH)……………..6
Stratum 3: Silty sand (SM), Sand with silt (SP-SM)…………..6
2.3 GROUNDWATER……………………………………………………7
2.4 ENGINEERING PROPERTIES OF SOIL STRATA………………...8
2.4.1 Strength Characteristics……………………………………..8
Stratum 1: Refuse Fill…………………………………………..8
Stratum 2: Peat (Pt) and Elastic Silt (MH)……………………..8
Stratum 3: Silt
Sand(SM), Sand with Silt (SP-SM)………………………..…...9
2.4.2 Compressibility Characteristics……………………………..9
Stratum 1: Refuse Fill…………………………………………..9
Stratum 2: Peat (Pt) and Elastic Silt (MH)…………………….11
2.5 ANALYSIS OF SETTLEMENT……………………………………. 11
Profile A at Embankment 1……………………………………..11
Profile B at Embankment 2……………………………………..12
2.6 FOUNDATION RECOMMENDATIONS AND ACTUAL
SETTLEMENTS………………………………………………………13
3. LABORATORY TESTING PROGRAMS………………………..…..15
3.1 RATIONALE AND OBJECTIVE…………………………………….15

iii
3.2 MATERIAL TESTED AND METHODOLOGY……………………..16
TEST RESULTS……………………………………………………….18
3.2.1 Soil Classification………………………………….……18
3.2.2 Moisture-Density Relationship………………………….22
3.2.3 Strength Tests……………………………………………23
Sample Preparation…………………………………………..23
Triaxial Shear Tests………………………………………….23
Test Results………………………………………………….24
Effects of Temperature on SDM Shear Strength…………….27
3.2.4 Permeability……………………………………………..30
Sample Preparation…………………………………………30
Test Procedure………………………………………………30
Results………………………………………………………31
3.2.5 Resilient Modulus……………………………………….33
3.2.6 Consolidation……………………………………………40
3.2.7 Swell Potential……………………..……………………42
3.2.8 Durability………………………………………………..45
Freeze-Thaw Tests…………………………………………45
Wet-dry Tests………………………………………………46
4. FIELD TESTING PROGRAM…………………………..…………………47
4.1 OBJECTIVE………………………………………………………… 47
4.2 FIELD CEMENT CONTENT EVALUATION………………………47
4.3 FIELD COMPACTION TESTS ……………………………………...49
4.4 FIELD SETTLEMENTMONITORING……………………………..55
4.4.1 Settlement Plates………………………………………..55
4.4.2 Horizontal Inclinometers………………………………..61
4.4.3 Magnetic Extensometer…………………………..……..62
4.5 SLOPE DEFORMATION MONITORING………………………..…65
4.6 MONITORING OF STRENGTH GAIN/LOSS…………………….....71
5. CONCLUSIONS………………………………………………………..…..75

iv
6. RECOMMENDATIONS……………………………………………………84
7. REFERENCES………………………………………………………………85

1
1. INTRODUCTION
In 1998, the New Jersey Maritime Resources and the New Jersey Department of
Transportation jointly sponsored a pilot project to study the feasibility of beneficially
reusing Stabilized Dredged Material (SDM) in the construction of road embankments. The
pilot project included the construction of two embankments on the water front parcel
(parcel G) of the OENJ Elizabeth Site (the Site). Between fifty to sixty thousand cubic
yards of dredged material from Union Dry Dock were amended with Portland cement and
placed at the Site for use in the construction of the two embankments. The two
embankments were extensively instrumented to monitor the behavior of the SDM during
and after construction. Laboratory testing was conducted in conjunction with field-testing
and monitoring to better determine the engineering properties of SDM.
In 1996, the United States Environmental Protection Agency (USEPA) banned
ocean disposal of Contaminated Dredged Materials (CDM). Prior to that, CDM was
disposed of in a mud dump approximately 6 miles from Sandy Hook, New Jersey. Since
the 1996 USEPA ruling, the disposal of CDM has become a concern for federal and state
agencies. Several studies have been conducted to further investigate alternatives to ocean
dumping. One of the proposed alternatives is the beneficial reuse of CDM in upland
disposal sites. This entails the stabilization of CDM with pozzolanic admixtures to create
structural fill, or the decontamination of CDM in order to use it as fill material, topsoil or
in other applications.
The process of decontamination and solidification of CDM is more expensive than
ocean dumping. Moreover, decontamination methods have not yet proven sufficiently
effective to economically process the volume of dredge that must be taken from the New
York and New Jersey harbors each year, a volume estimated at 4 million cubic yards. This
estimate does not include deepening projects. The beneficial reuse of stabilized dredge as
structural fill, however, has been demonstrated to be cost effective for high volume usage.

2
For example, approximately, 600,000 cubic yards of SDM were successfully used as
structural fill for the construction of parking areas for the Jersey Garden’s Mall (former
OENJ site, parcels A, B, and C). In this project, dredged material was amended with
pozzolanic admixtures (Portland cement, cement kiln dust, lime kiln dust) to reduce
moisture and increase workability. Once the moisture content approached the optimum
level, SDM was compacted using conventional construction equipment. In-situ testing was
implemented for the SDM to ensure quality control.
The process of stabilizing problematic soils (such as high plastic clays and silts) by
adding lime or cement goes back many decades. However, the natural moisture content of
these soils is not nearly as high as that of dredged material. The use of dredged material as
structural fill requires a significant reduction in moisture content and an increase in
workability. Because of its high moisture content, the strength, compressibility, and
durability of SDM present a major concern. Comprehensive laboratory analyses have been
conducted to determine the engineering properties of SDM. These studies, in conjunction
with full-scale field testing/monitoring of the two embankments in this study, have
produced valuable data regarding the behavior of dredged material, particularly with
respect to its use in roadway embankment applications.
For this pilot project, two embankments, and a road connecting the two
embankments, were constructed using SDM. Approximately eight percent (8%) Portland
cement (on wet weight basis) was added to the raw dredged material to increase its
workability. Prior to construction of the embankments, a subsurface investigation was
conducted to assess the competency of the foundation soil at the footprint of the
embankments. Laboratory and field testing/monitoring were conducted within an 18-
month period beginning in the spring of 1999. Once the subsurface investigation was
completed, it was determined that the foundation soil needed to be improved in order to
eliminate any potential failure, or excessive differential settlement.

3
This report outlines the various tests performed as part of the pilot study, including
the soil study for the embankment foundation, the laboratory testing of SDM, and field
testing and monitoring. Detailed test results are included in the appendices to this report in
the form of Portable Digital Format (PDF) files. On the basis of these tests and subsequent
analyses, this report presents conclusions and recommendations regarding the overall
feasibility of using SDM in roadway embankment projects.
4
2. FOUNDATION INVESTIGATION
Prior to constructing the embankments, it was necessary to investigate the
subsurface conditions and engineering properties of the foundation soils at the two sites
that had been proposed for the construction of the two roadway embankments. The
location of the study area for the foundation of the embankments is described below.
Embankment Location
1 North of parcel G near wetlands transition area – Elizabeth OENJ – Development Site 1
2 Bordering the ditch pipe within Parcel G – Elizabeth OENJ – Development Site 2
2.1 Scope of the Foundation Investigation
The foundation investigation consisted mainly of the following tasks:
1. Data Review: All available data were reviewed, including data collected from
previous investigations conducted by other consultants. This review included data
previously collected by Sadat Associates from settlement plates installed within the
mall project site.
2. Field Investigation: A field exploration program, including Standard Penetration Test
(SPT) borings, and Cone Penetration Test (CPT) soundings, was performed in order
to evaluate the physical properties of the waste, and organic peat/silt layers
(Appendix A.1).
1 The embankment location was proposed by SADAT on 8/98 2 The embankment location was proposed by SADAT on 10/98
5
3. Laboratory Work: Laboratory tests were conducted to determine the physical
properties of the selected soil samples (Appendix A.2).
4. Analysis: The collected data were evaluated and an analysis was performed to assess
the anticipated settlement that would occur within the waste, and the organic peat/silt
layers as a result of the embankment construction.
5. Foundation Recommendations: Recommendations for improving soil within the
proposed embankment footprints were provided.
It should be noted that the settlement estimate provided in this study referred
specifically to the two compressible layers located immediately beneath the foundation
layers: i.e., the waste and organic peat/silt layers.
2.2 Subsurface Investigation and Soil Profiles
The subsurface investigation to determine the required foundation of the
embankments was based on the proposed design and location of the two embankments.
The subsurface investigation was conducted from September 14 through October 20, 1998.
A Soiltek representative observed the explorations and logged the borings.
Specifically, the field investigation included six exploratory borings using Standard
Penetration Testing (SPT), and 14 CPT soundings. Undisturbed soil samples of 2.8-inch
diameter were obtained from these borings using SPT. Soil samples were laboratory tested
for physical properties. The borings and soundings penetrated 25 feet below the original
grades of the landfill. The samples taken from the borings were classified in accordance
with the Unified Soil Classification System. The logs of the SPT borings and CPT
soundings are presented in Appendix A.1.
6
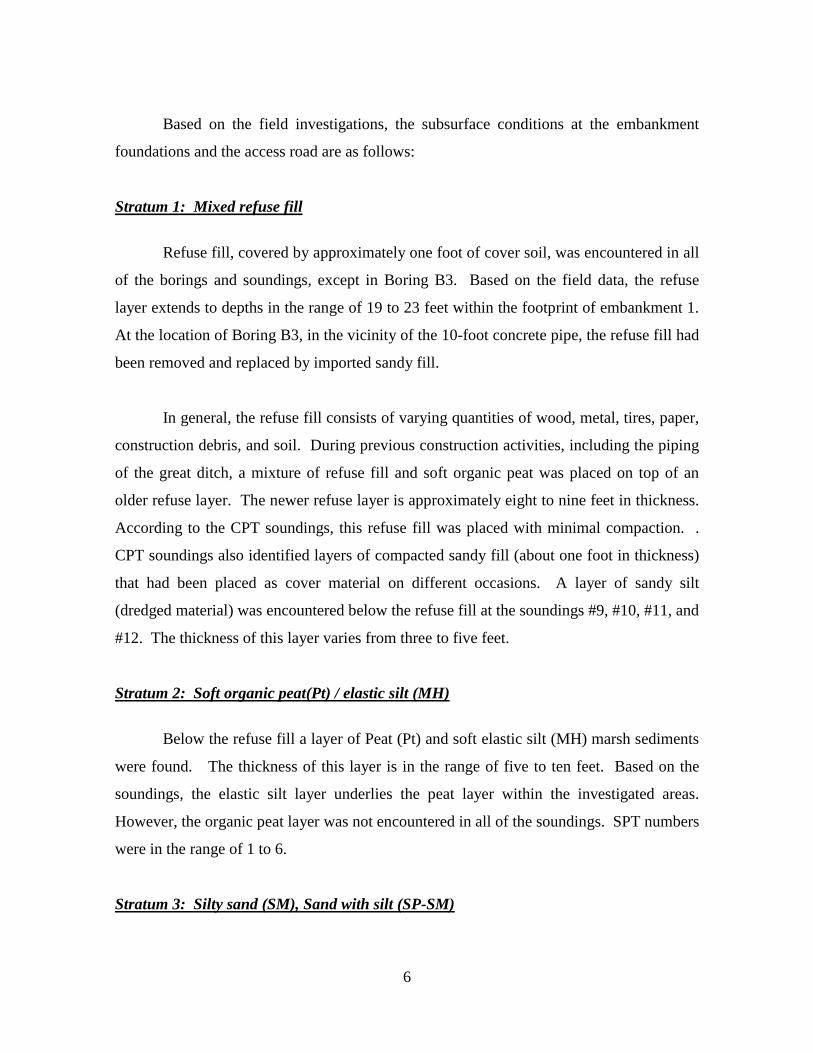
Based on the field investigations, the subsurface conditions at the embankment
foundations and the access road are as follows:
Stratum 1: Mixed refuse fill
Refuse fill, covered by approximately one foot of cover soil, was encountered in all
of the borings and soundings, except in Boring B3. Based on the field data, the refuse
layer extends to depths in the range of 19 to 23 feet within the footprint of embankment 1.
At the location of Boring B3, in the vicinity of the 10-foot concrete pipe, the refuse fill had
been removed and replaced by imported sandy fill.
In general, the refuse fill consists of varying quantities of wood, metal, tires, paper,
construction debris, and soil. During previous construction activities, including the piping
of the great ditch, a mixture of refuse fill and soft organic peat was placed on top of an
older refuse layer. The newer refuse layer is approximately eight to nine feet in thickness.
According to the CPT soundings, this refuse fill was placed with minimal compaction. .
CPT soundings also identified layers of compacted sandy fill (about one foot in thickness)
that had been placed as cover material on different occasions. A layer of sandy silt
(dredged material) was encountered below the refuse fill at the soundings #9, #10, #11, and
#12. The thickness of this layer varies from three to five feet.
Stratum 2: Soft organic peat(Pt) / elastic silt (MH)
Below the refuse fill a layer of Peat (Pt) and soft elastic silt (MH) marsh sediments
were found. The thickness of this layer is in the range of five to ten feet. Based on the
soundings, the elastic silt layer underlies the peat layer within the investigated areas.
However, the organic peat layer was not encountered in all of the soundings. SPT numbers
were in the range of 1 to 6.
Stratum 3: Silty sand (SM), Sand with silt (SP-SM)
7
Under the elastic layer, medium -dense to very-dense sandy soils of glacial origin
were encountered. The soils in this stratum vary, but are predominantly made up of silty
sand (SM). Other soil types, such as poorly, or well-graded, sand with silt (SP-SM) and
(SW-SM), clayey sand (SC), and sandy silt (ML) were also found in this stratum. All of
the borings and soundings were terminated after 10 feet of penetration into the sand
stratum. SPT numbers ranged from 15 to refusal for this stratum. In general, the SPT
numbers (N-values) were higher in the red-brown silty sand layer (SM) than in the gray
sand with silt layer (SP-SM).
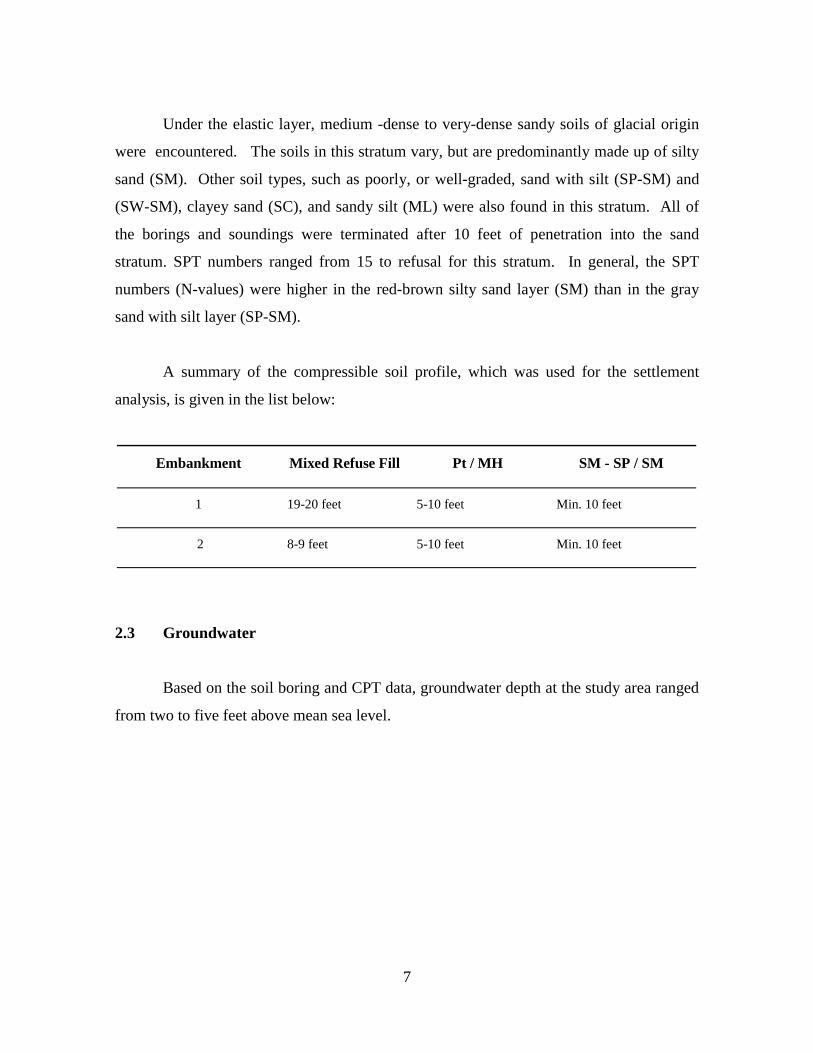
A summary of the compressible soil profile, which was used for the settlement
analysis, is given in the list below:
Embankment Mixed Refuse Fill Pt / MH SM - SP / SM
1 19-20 feet 5-10 feet Min. 10 feet
2 8-9 feet 5-10 feet Min. 10 feet
2.3 Groundwater
Based on the soil boring and CPT data, groundwater depth at the study area ranged
from two to five feet above mean sea level.

8
2.4 Engineering Properties of Soil Strata
2.4.1 Strength Characteristics
Based on the field data obtained during the subsurface investigation, the strength
characteristics of the refuse, peat, and sand layers were evaluated and estimated as follows:
Stratum 1: Refuse Fill
Based on the analysis of SPT and CPT data soil borings and soundings, the friction
angle within the refuse fill can be estimated as approximately 30 degrees to slightly higher.
A nominal value of 30 degrees can be assigned to this layer along with a unit weight of 95
pcf.
Stratum 2: Peat (Pt) and Elastic Silt (MH)
The organic peat and the elastic silt layer have un-drained shear strength ( uS ) in
the range of 325 psf to 604 psf, according to the laboratory triaxial shear tests. The un-
drained shear strength from laboratory tests was utilized to obtain the cone factor ( ktN ) for
piezocone point resistance.
Based on piezocone data, the in-situ un-drained shear strength of the stratum is in
the range of 250 psf to 1,200 psf, although some lower values were recorded in CPT #13
and CPT # 14. Conservatively, an undrained shear strength ( uS ) of 350 psf could be
assigned to the organic peat and elastic silt layer. Based on laboratory tests, the unit
weight of the stratum is approximately 85 pcf.

9
Stratum 3: Silty Sand(SM), Sand with Silt (SP-SM)
Based on SPT results and piezocone data, a friction angle of 33 degrees can be
assigned to this layer. Based on the CPT soundings, the relative density for the stratum is
between 35 to 60 percent, with a dominant range of 40 to 50 percent. CPT results are in
agreement with SPT results, which estimate that the relative density is in the range of 35 to
65 percent. The red-brown silty sand (SM) layer generally has a higher relative density
than does the gray sand with silt (SP-SM) layer. A unit weight of 120 pcf can be assigned
to this stratum.
As mentioned in previous sections of this report, the soundings and borings in the
sand layer were terminated at a depth of ten feet. Therefore, the engineering characteristics
of the sand layer at depths below ten feet cannot be evaluated without any further
investigation.
2.4.2 Compressibility Characteristics
The compressibility of the refuse and peat layers was characterized as follows:
Stratum 1: Refuse Fill
Due to the heterogeneity of refuse fills, it is difficult to predict the short-term and
long-term landfill settlement that would result from the construction of the proposed
embankments. To date, most of the studies conducted on landfill settlements have been
site-specific, and are not easily applied to other sites. Moreover, theories developed for
determining soil settlements (specifically, granular or fine-grained soils) are not directly
applicable to refuse fill.
A model presented by Holtz and Kovacs in 1981 assumes that the settlement
behavior of refuse material is similar to the settlement behavior of a normally consolidated
soil stratum. The model is presented by the following equation:

10
]/)log[( οο σσσ sww CRHH ∆+=∆
Where:
wH∆ = Waste settlement (ft)
wH = Waste thickness (ft)
CR = Compression Ratio, )1/( οeCCR c +=
cC = Compressibility Index,
οe = In-situ void ratio of the waste before loading
οσ = In-situ effective vertical overburden pressure at the mid-height of waste stratum (psf)
sσ∆ =Applied surcharge loading at the mid-height of surcharge loading (psf)
Several investigators, such as Morris and Woods (1990), Landva and Clark (1990),
Oweis and Khera (1998), have applied this model to waste and verified its validity with
field data. The key to predicting settlement for refuse material is in selecting appropriate
values for the compression ratio, the empirical constant (CR ).
To estimate the compression ratio (CR ) for the OENJ-Elizabeth site, all of the
readings from the settlement plates that had been installed at the site prior to this
investigation were reviewed. Based on this information, an average calculated CR value
of 0.15 can be assigned to the refuse fill at the site.
The available data from the settlement plates at the OENJ site were not sufficient to
determine the coefficient of secondary compression ( 'αC ). However, according to the
published literature for similar types of landfills, a coefficient of secondary compression of
0.02 can be assigned to the refuse fill layer. Secondary compression will not occur during
the lifetime of the proposed embankment.

11
Stratum 2: Peat and Elastic Silt Layer
Four one-dimensional consolidation (oedometer) tests were performed on selected
samples of the organic peat and silt to evaluate their compressibility characteristics. The
test results are presented in Appendix B.
Based on the test results, the stratum is normally consolidated and the coefficient of
primary compression for the samples tested is in the range of 0.62 to 0.83, with an average
of 0.71. The compression ratio (CR ) varies from 0.18 to 0.22. The plots of coefficient of
consolidation ( vC @ 90t ), with respect to the application of different stress levels are
shown in Appendix B. According to the vC values, the estimated time within which 90%
of the primary consolidation will be completed is 424 days (1.16 year).
2.5 Analysis of Settlement
Based on the investigations conducted at the proposed embankment locations, two
separate soil profiles (profile A for embankment 1, and profile B for embankment 2) were
developed for use in evaluating settlement.
Profile A at Embankment 1
The thickness of the refuse fill is approximately 20 feet. A 10-foot-thick layer of
organic peat and elastic silt underlies the refuse fill layer. According to the Sadat
Associates drawing, the maximum height of the embankment is 10 feet at the crown, and
the embankment slopes down to the existing ground elevation at the perimeter.
Using both the model and the estimated CR value discussed in the previous section,
the anticipated settlement within the refuse fill for embankment 1, due to placement of 10
feet of compacted, stabilized dredged material ( 105=wγ pcf), will be approximately 12

12
inches. The deformation is likely to be non-uniform due to the heterogeneous nature of the
refuse fill layer.
For the organic peat and elastic silt layer, an average CR value of 0.2 was selected.
Therefore, if the proposed embankment is constructed, the maximum settlement during the
primary consolidation of the stratum will be approximately nine inches. Settlement within
this stratum is likely to be more uniform in nature than is the settlement in the refuse fill
layer.
Profile B at Embankment 2
The refuse fill layer at embankment 2 (south embankment) is approximately eight
feet, and this layer is covered by two feet of compacted, imported fill. The organic peat
and silt layer has the same thickness as profile A (10 feet), according to our most recent
subsurface investigation.
Using the same compression indices for both the refuse fill layer and underlying
layer, the anticipated settlement for the refuse fill will be nine inches, and for the peat/silt
layer it will be approximately 8 inches. A summary of the anticipated settlements within
the proposed sites is given in the table below.
Table 2.1 Predicted settlements within compressible layers
Embankment Refuse Layer Settlement
Peat Layer Settlement
Total Estimated Settlement
1 12 inches 9 inches 21 inches
2 9 inches 8 inches 17 inches
In both cases, the anticipated settlement is excessive for the proposed
embankments. Moreover, the settlement is not likely to be uniform due to the
heterogeneous nature of the refuse fill and the difference in height within various sections

13
of the embankment. Techniques for improving the soil, such as pre-loading or deep
dynamic compaction could significantly reduce final settlements. However, due to limited
construction time and site-specific logistic issues, it was decided that high strength
geosynthetic (SI 4x4 HT) fabric be used to induce uniform settlement and, to some extent,
minimize deformation.
2.6 Foundation Recommendations and Actual Settlements
1) The refuse fill (including old waste and recently placed waste) within the proposed
footprint of the two embankments has been placed with nominal compaction applied.
Therefore that layer shall experience large deformation during and after the
construction of the embankments.
2) The estimated settlement within the refuse fill at Embankment 1 will be approximately
12 inches, assuming that 10 feet of compacted dredge material are placed during
embankment construction. The estimated settlement within the refuse fill at
Embankment 2 will be approximately 9 inches, assuming that 15 feet of compacted
dredge material are placed during embankment construction. Most of the settlement
will occur during construction and in the first four weeks following construction.
Settlement is likely to be non-uniform due to heterogeneity of the refuse fill.
3) Consolidation settlement within the organic peat and silt layer at Embankment 1 is
estimated to be approximately 9 inches. Consolidation settlement within the organic
peat and silt layer at Embankment 2 is estimated to be approximately 8 inches. The
primary consolidation of this layer is estimated to take 424 days.
4) The overall estimated settlement is excessive for the proposed embankment sites.
Therefore, in the absence of more rigorous improvement methods, such as preloading
or dynamic compaction, it was recommended that a layer of high tensile strength

14
geosynthetic material be placed to impose a more uniform settlement and to minimize
deformation.
After construction of the embankments using the recommended foundations,
settlements were measured in the field. The settlement modeling was relatively accurate
in estimating embankment settlement and deformation. Moreover, the results of the field
settlement data also reveal a relatively uniform settlement throughout the embankments,
which indicates the effectiveness of geosynthetic liner in making the settlement more
uniform. A comparison of anticipated and final settlement data is presented in Table 2.2.
Table 2.2 Comparison of Maximum Settlement Data
Embankment 1 2
Anticipated Settlement 21 inches 17 inches
Measured (settlement plates) 15.6 inches 15.8 inches
Measured (horizontal. Inclinometer) 12.7 inches 13.4 inches
It should be noted that the footprint of Embankment 1 underwent partial and
irregular preloading for a period of approximately four months prior to embankment
construction due to heavy vehicular traffic on the site. This reduced the amount of post
construction settlement and accounts for the fact that the discrepancy between the
anticipated settlement and the actual settlement at Embankment 1 is considerably larger
than the discrepancy between these values for Embankment 2.

15
3. LABORATORY TESTING PROGRAM
3.1 Rationale and Objective
Since 1994 ocean dumping of contaminated dredge material (CDM) has been
banned. As a result, CDM has since been placed in confined disposal facilities in either
ocean or upland sites. This is more costly than ocean dumping, but CDM in upland sites
may have the potential for beneficial re-use in structural and non-structural fills, once the
material has been stabilized by the inclusion of pozzolanic admixtures and made workable
for site use. In this project, due to excessively high moisture contents, CDM had to be
stabilized and dewatered for considerable periods of time prior to consideration for
beneficial re-use.
The objectives of the laboratory investigation were two-fold: 1) to determine the
material strength properties of the CDM and its potential for use in the construction of the
proposed embankments, and 2) to determine the geotechnical properties of the CDM to
assess its potential for use in high volume applications, such as fills, embankments, and
roadway base materials. In order to realistically determine the behavior of CDM under
field conditions, the selection of admixtures, the curing time and the placement process
used in laboratory testing approximated field operations.
The controlling parameters for the laboratory investigation were the type, and the
content, of admixtures (cement and fly ash) used in the field, as well as the sequence of
mixing, curing and placement activities specific to the project. The mixing of CDM with
the admixtures was conducted on the OENJ/Cherokee site. After mixing, the stabilized
dredge material (SDM) was placed on various locations at the site for dewatering,
stabilization and curing. Unlike typical soil-cement mixtures in which the soil and cement
are mixed and then immediately compacted, the SDM was placed on holding sites until its
water levels had been reduced to the range of compaction specifications. Following the
dewatering and consequent curing of the cement in the mixture, the SDM was then

16
disturbed and moved to the embankment sites for final placement and compaction. In
other words, the SDM was first cured, and then remolded and compacted to field
specifications. As a result, a direct comparison between the SDM used in this project and
typical soil-cement materials could not be made. However, soil-cement properties are used
in order to provide a point of reference for the evaluation of laboratory results.
3.2 Material Tested and Methodology
The laboratory testing included the preparation of three different mixtures; each
using raw dredged material (RDM), Portland cement and fly ash. The recipes were all
mixed on a wet-weight basis. The three recipes were as follows: 1)RDM with 4%
Portland cement, 2) RDM with 8% Portland cement, and 3) RDM with 8% Portland
cement and 10% fly ash. The following tests were conducted on the mixtures:
!" Unified Soil Classification ASTM D-1140, and D-422
!" Shear Strength (tri-axial), ASTM D-4767, 2850-87
!" Swell Pressure ASTM D-4546
!" Consolidation Test ASTM D-2435
!" Resilient Modulus AASHTO T274
!" Hydraulic Conductivity (Permeability) ASTM D-5084
!" Compaction Test ASTM D-1557
!" Durability ASTM D-559
!" Cement Content Determination ASTM D-806-96
Sample collection and preparation for testing was as follows: 1) RDM was
collected from dredged material scows under OENJ supervision and stored in 5-gallon
plastic containers; 2) The containers were transported to the laboratory for mixing with the
admixtures; 3) RDM was mixed with cement and fly-ash, according to the testing plan, in
laboratory concrete mixers; 4) The mixtures were aerated in 3’x2’ holding pans for

17
moisture reduction and curing; and 5) additional amended RDM was stored under field
conditions outside of the laboratory as part of the six-month testing program. The testing
plan as proposed in the geotechnical proposal is summarized in Table 3.1, which is
repeated for each recipe.
Table 3.1. The Laboratory Geotechnical Testing Plan
(Repeated for 4% and 8% PC, and 8%PC+10% fly ash)
Number of Samples
Laboratory Test Description 85% Proctor - 1 Month Curing Time
90% Proctor – 1 Month Curing Time
85% Proctor – 6 Months Curing Time
90% Proctor - 6 Months Curing Time
Unified Classification (ASTM D-1140, 422, 4318) 3 3 3 3
Strength (Triaxial @ Points) (ASTM D-4767) 3 3 3 3
Swell Pressure (ASTM D-4546) 3 3 3 3
Consolidation (ASTM D-2435) 3 3 3 3
Resilient Modulus (MR AASHTO T74) 3 3 3 3
Permeability (ASTM D-5084) 3 3 3 3
Compaction (ASTM D-1557) 3 3 3 3
Durability (ASTM D-559) 3 3 3 3
The initial, proposed, testing program did not include testing a mixture of RDM
amended with 4% Portland cement. However, this mixture was tested in order to
determine how the SDM would behave if the target percentage of 8% Portland cement was
not achieved. Field determination of cement contents (Figure 4.1.) had indicated values as
low as 2 to 4%. Therefore, by testing SDM with only 4% Portland cement, there would be
an indication of the differences in strength and compressibility between the target 8%
mixture and the 4% mixture.

18
In order to determine the effects of density on the engineering properties of SDM,
samples were compacted to two different densities: 85% and 90% of the material’s
maximum dry density as determined by ASTM D-1557 (Modified Proctor). The rationale
for choosing the Modified Proctor Method for compaction was based on FHWA A-RD-97-
083 “Design Pamphlet for the Determination of Design Subgrade in Support of the 1993
AASHTO Guide for the Design of Pavement Structures.” The pamphlet states that
“AASHTO T99 (Standard) should be used for coarse-grained soils and aggregate
materials, and low plasticity fine-grained soils; whereas, AASHTO T180 (Modified)
should be used for medium to high plasticity fine-grained soils.”
3.3 Test Results
3.3.1 Soil Classification
Particle size distribution tests, including sieve analysis and hydrometer tests, were
conducted on the three mixtures: SDM with 4% Portland cement, SDM with 8% Portland
cement, and SDM with 8% Portland cement plus 10% fly ash. In addition, Atterberg
limits, including plastic limit and liquid limit, were conducted on the same samples. Tests
were conducted in conformance with ASTM D1140 and D422. The detailed laboratory
test results are presented in Appendix B-1.
A summary of gradation test results for three different types of SDM at two
different curing times (1 month and 6 months) are presented in Table 3.2. According to
the results, dredged material is mostly silt with low percentages of fine sand and clay.
Sediments dredged from navigational channels naturally do not contain coarse or medium
sand (although incidental pieces of gravel were found in some samples) because sand will
settle before it reaches still waters. Nor can these sediments contain high percentages of
clay, because clay particles will stay in suspension. However, in dredged material
excavated from deepening projects the material could contain significant amounts of gravel
and rock mixed with fine material.

19
The average SDM samples consisted of 66% silt, 14% clay and 16% fine and
medium sand (12.1% fine, 3.9% medium). Gravel content was negligible except for one
sample, which contained 6.5% gravel. The percentage of clay size particles was higher for
those SDM samples that had been mixed with fly ash. This is due to the fine nature of fly
ash particles. The organic content of the raw dredge material was determined to be around
8% according to ASTM D2974 from previous OENJ data.
Table 3.2 Gradtaion Results
Grain Size Summary (Sieve + Hydrometer Data)
% Gravel % Sand % Fines D50
Sample Type Stockpiling Time Sample # Coarse Fine Coarse Medium Fine Silt Clay (mm)4% PC 1 Month 1 0 0.8 0.8 3.3 9.4 71.6 14.1 0.0573
2 0 1.8 0.8 3.4 5.9 74.1 14 0.03433 0 0.7 0.7 2.9 10 73 12.7 0.0433
Average 0 1.1 0.7667 3.2 8.4333 72.9 13.6 0.0454% PC 6 Months 1 0 1.4 1.2 4.2 10.1 67.4 15.7 0.0355
2 0 1.9 1.2 3.3 7.9 65.8 19.9 0.02613 0 1.7 1.2 2.7 6.7 72.3 15.4 0.0348
Average 0 1.6667 1.2 3.4 8.2333 68.5 17 0.03218% PC 1 Month 1 0 0 0.3 0.9 18.7 59.1 21 0.0146
2 0 0 0.3 0.9 16.1 69.5 13.2 0.02343 0 0 0.3 1.1 13.7 73.7 11.2 0.027
Average 0 0 0.3 0.96667 16.167 67.433 15.133 0.02178% PC 6 Months 1 0 0.6 1.7 4.4 27.5 60.6 5.2 0.0556
2 0 0.7 1.6 2.8 33.4 56 5.5 0.6513 0 0.5 1.8 3.1 25.6 62.7 6.3 0.0379
Average 0 0.6 1.7 3.43333 28.833 59.767 5.6667 0.24828% PC + 10% FA 1 Month 1 3.8 6.7 5.4 6.6 5.4 64.1 8 0.0716
2 0 10.4 8.8 9.2 7.3 56.8 7.5 0.06183 3.4 2.5 4.2 5.5 4.5 70.2 9.7 0.0577
Average 2.4 6.5333 6.1333 7.1 5.7333 63.7 8.4 0.06378% PC + 10% FA 6 Months 1 0 0.5 1.3 2.9 5.3 63.7 26.3 0.0289
2 0 0.5 1 2.2 5.3 68.1 22.9 0.02513 0 0.7 1.5 3.1 5.3 58.5 30.9 0.0147
Average 0 0.5667 1.2667 2.73333 5.3 63.433 26.7 0.0229Raw Dredge N/A 1 0 0.9 1.1 1.6 4.5 66.7 25.2 0.0107
2 0 0.8 0.7 2.6 6.3 68.4 21.2 0.0127Average 0 0.85 0.9 2.1 5.4 67.55 23.2 0.0117
20
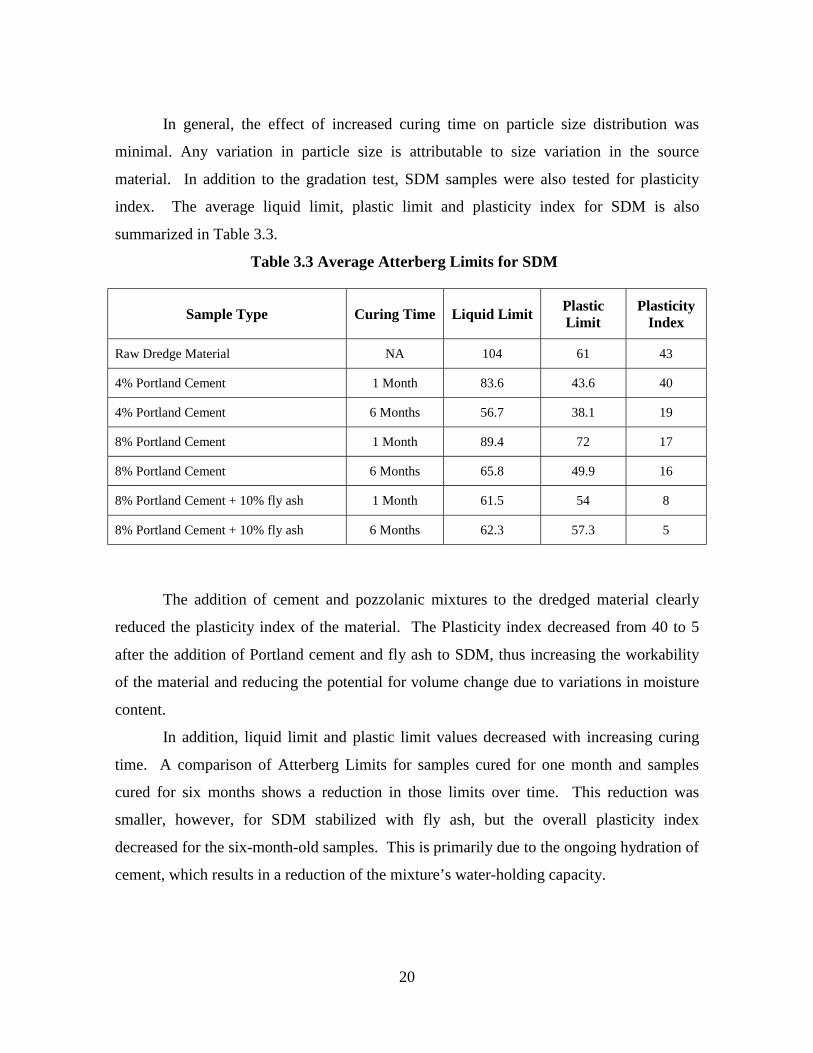
In general, the effect of increased curing time on particle size distribution was
minimal. Any variation in particle size is attributable to size variation in the source
material. In addition to the gradation test, SDM samples were also tested for plasticity
index. The average liquid limit, plastic limit and plasticity index for SDM is also
summarized in Table 3.3.
Table 3.3 Average Atterberg Limits for SDM
Sample Type Curing Time Liquid Limit Plastic Limit
Plasticity Index
Raw Dredge Material NA 104 61 43
4% Portland Cement 1 Month 83.6 43.6 40
4% Portland Cement 6 Months 56.7 38.1 19
8% Portland Cement 1 Month 89.4 72 17
8% Portland Cement 6 Months 65.8 49.9 16
8% Portland Cement + 10% fly ash 1 Month 61.5 54 8
8% Portland Cement + 10% fly ash 6 Months 62.3 57.3 5
The addition of cement and pozzolanic mixtures to the dredged material clearly
reduced the plasticity index of the material. The Plasticity index decreased from 40 to 5
after the addition of Portland cement and fly ash to SDM, thus increasing the workability
of the material and reducing the potential for volume change due to variations in moisture
content.
In addition, liquid limit and plastic limit values decreased with increasing curing
time. A comparison of Atterberg Limits for samples cured for one month and samples
cured for six months shows a reduction in those limits over time. This reduction was
smaller, however, for SDM stabilized with fly ash, but the overall plasticity index
decreased for the six-month-old samples. This is primarily due to the ongoing hydration of
cement, which results in a reduction of the mixture’s water-holding capacity.

21
Based on the Atterberg Limits, all the samples tested are below the A-line and to
the right of the LL=50 line on the Plasticity Chart, as shown in Figure 3.1. Therefore, the
SDM could be classified as Elastic Silt (MH).
Atterburg Limit Data
Sample No. Liquid Limit Plastic Limit Plasticity Index Symbol4% PC ( 1 Month) 83.6 43.6 40.0
4% PC (6 Months) 56.7 38.1 18.6
8% PC (1 Month) 89.4 72.0 17.4
8% PC (6 Months) 65.8 49.9 15.9
8% PC + 10% FA (1 Month) 61.1 54.0 7.1
8% PC + 10% FA (6 Months) 62.3 57.3 5.0
Virgin Dredge Material 104.1 61.0 43.1
Figure 3.1. Atterberg limits for RDM and SDM
0
10
20
30
40
50
60
70
0 10 20 30 40 50 60 70 80 90 100 110LIQUID LIMIT, %
PLA
STIC
ITY
IND
EX, %
CL
CL- ML MLorCL
MHorOH
CH
A-LINEor OL
orOHU-LINE

22
3.3.2 Moisture-Density Relationship
The three different mixtures of SDM were tested for moisture-density relationship.
For each recipe, some samples were cured in the laboratory for one month and some for six
months. The tests were conducted in accordance with ASTM D-1557 (Modified Proctor).
For each recipe, several samples were tested with moisture contents on the wet and dry
side of the optimum. Test results are presented in Appendix B-2. A summary of the test
results is presented in Table 3.4.
Table 3.4 Compaction Data Summary
Optimum Values 90% of Optimum 85% of Optimum Sample Type
Stockpiling
Time γγγγd max (pcf)
w% OPT (%)
γγγγd (pcf)
w% (%)
γγγγd (pcf)
w% (%)
4% PC 1 Month 78.7 28.5 70.8 44.0 66.9 47.3
4% PC 6 Months 77.4 26.0 69.7 36.0 65.8 41.0
8% PC 1 Month 78.5 31.0 70.7 48.3 66.7 52.8
8% PC 6 Months 76.6 31.5 69.0 48.5 65.2 52.0
8% PC + 10% FA 1 Month 78.8 28.0 70.9 45.0 67.0 47.5
8% PC + 10% FA 6 Months 78.4 29.3 70.6 46.7 66.6 51.4
Sandy Silt+8%PC* 1 Month 119.2 10.5
Fine Sand+8% PC* 1 Month 113.5 15.4
* PCA, 1991
As described in section 3.2, the preparation of samples varied slightly from the
conventional methods. Specifically, after mixing, the SDM samples generally contained
high moisture contents and needed to be air-dried prior to compaction. Once the moisture
content approximated the optimum moisture content, one sample was compacted while the
remaining samples were further air-dried. This process continued until several samples
were compacted at moisture contents below the optimum. To establish the moisture-

23
density curve for each recipe, eight points, or more, were used. The maximum point on a
parabola, which connects the test points, determines the maximum dry density and the
optimum moisture content. Dry-density values at 85% and 90% of the maximum were
used in the preparation of samples for other laboratory tests.
According to the test results, maximum dry densities ranged from 76.6 pcf to 78.8
pcf, and optimum moisture contents ranged from 26% to 31.5%. A slight reduction in
maximum dry density was observed when the percentage of cement and the curing time
were increased prior to compaction of the material. This is similar to findings made by
Kezdi (1979) where the maximum dry densities of cement-treated silts were found to
decrease slightly with increasing cement content.
3.3.3 Strength Tests
Sample Preparation
One-month-old samples and six-month-old samples of the three different recipes
for SDM were also tested for shear strength characteristics. The samples were compacted
to 85% and 90% of their modified maximum dry density and then tested for strength
parameters under triaxial shear conditions. The summary of test results is presented in
Appendix B.3.
Chapter 2
Triaxial Shear Tests
The shear strength parameters, C and φ, were determined under both drained and
undrained conditions to: 1) calculate the stability of the two embankments; and 2) to
evaluate the effect of admixtures on shear strength parameters, thereby determining the
suitability of SDM for re-use applications. A series of UU and CU tests were performed in
accordance with ASTM D4767 and D-2850-87. The results of UU tests were used to
determine the material’s effective strength parameters, including the effective angle of
internal friction (φ′) and the effective cohesion intercept (C′).

24
The long-term behavior of SDM under load conditions is better modeled with
effective stress parameters. In order to determine the effective stress parameters, CU tests
were conducted on saturated SDM samples. Stress was applied to the material and the
resulting pore pressures were measured. The difference between the total applied stress
and the resulting pore pressure determines the level of effective stress. Soil samples were
sheared approximately 24 hours after the samples were consolidated inside the triaxial
chamber. In general, soils tend to show frictional behavior over the long term, as the pore
pressure tends to dissipate.
Test Results
A summary of the UU test results is presented in Table 3.3, and a summary of the
CU test results in Table 3.4. A close examination of the data reveals no significant change
or trend in the magnitude of the frictional angle, ϕ, as a result of the addition of
admixtures. For both cases, an average value of approximately 32o may be considered a
good estimate for the stability analysis of slopes and embankment. This finding
corroborates previous findings by Balmer (1958), Clough, et al. (1981) and Van Riessen
and Hansen (1992); where different soil types, amended with varying cement contents,
were extensively tested and showed no significant change in frictional angle as a function
of the varying amount of cement.
A general comparison of SDM with typical soil-cement and cement-modified soils
shows that with the same percentage of added cement, and similar compaction efforts
(90% of optimum for SDM, and optimum for soil-cement) cement-modified soils are
denser than SDM, have slightly higher friction angles, and have a much higher cohesion
intercept under triaxial shear conditions. Table 3.5 summarizes these differences between
SDM and typical soil-cement and cement-modified soils. One reason the SDM in less
cohesive than soil-cement is that during the process of remolding the SDM for compaction,
parts of cementitious bonds between hydrated cement particles and the soil matrix become

25
broken. With typical soil-cement or cement-modified soils hydration and curing take place
immediately after compaction, in part because compaction prior to curing causes soil
grains to be forced into direct contact with cement grains resulting in an "agglomeration of
soil-cement grains interspersed in the soil mass" (Cotton, 1962). In comparison, with
SDM, the sequence of sample preparation is reversed and some of the previously gained
strength is lost during the break-up upon compaction (see figure 3.2).
Table 3.5 UU Triaxial Test Summary
Sample Type Stockpiling Time Compaction Friction Angle Cohesion (psf)
85% 28 1,958 4% PC
1 Month 90% 31 3,312
85% 26 1,915 4% PC
6 Months 90% 33 2,664
85% 12* 4,464 8% PC
1 Month 90% 32 4,939
85% 30 3,643 8% PC
6 Months 90% 35 4,744
85% 30 2,030 8% PC + 10% FA
1 Month 90% 33 2,721
8% PC + 10% FA 85% 23 1,195
* error 6 Months
90% 34 2,203
Before compactionCement Modified Soil
After CompactionCompacted Soil-Cement
Soil
Cement
Before compactionCement Modified Soil
After CompactionCompacted Soil-Cement
Soil
Cement
Figure 3.2. Effect of compaction on soil-cement mixtures
26
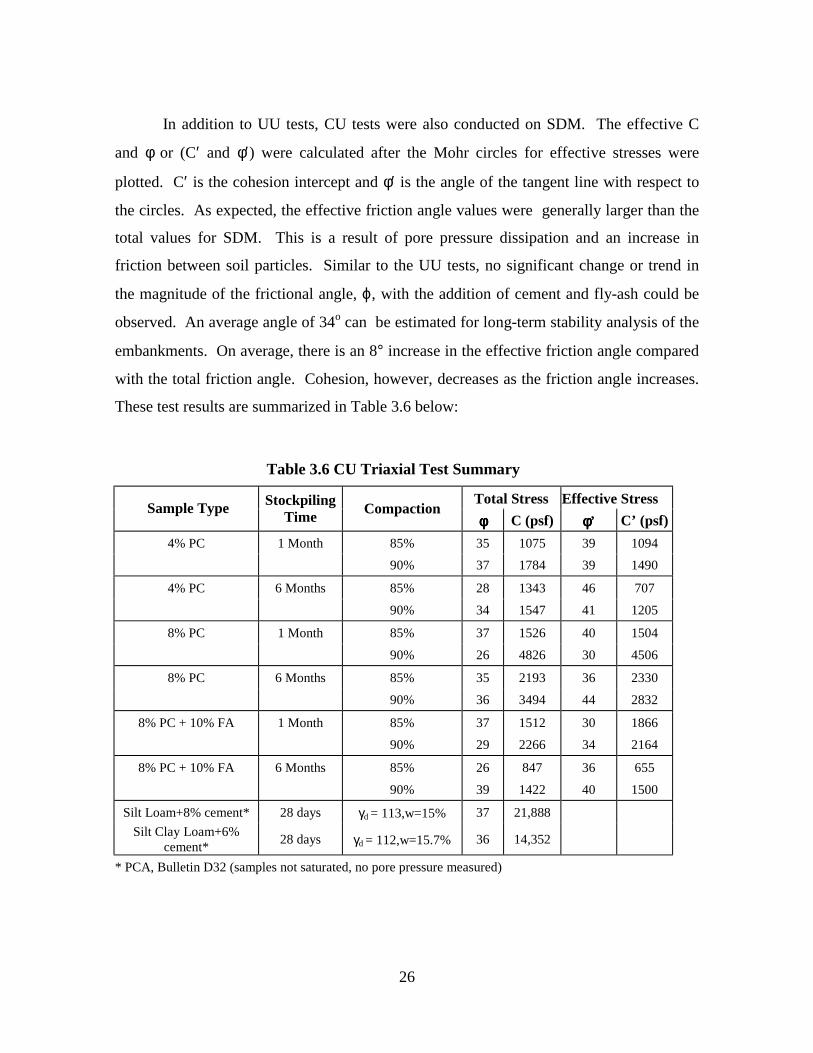
In addition to UU tests, CU tests were also conducted on SDM. The effective C
and φ or (C′ and φ′) were calculated after the Mohr circles for effective stresses were
plotted. C′ is the cohesion intercept and φ′ is the angle of the tangent line with respect to
the circles. As expected, the effective friction angle values were generally larger than the
total values for SDM. This is a result of pore pressure dissipation and an increase in
friction between soil particles. Similar to the UU tests, no significant change or trend in
the magnitude of the frictional angle, ϕ, with the addition of cement and fly-ash could be
observed. An average angle of 34o can be estimated for long-term stability analysis of the
embankments. On average, there is an 8° increase in the effective friction angle compared
with the total friction angle. Cohesion, however, decreases as the friction angle increases.
These test results are summarized in Table 3.6 below:
Table 3.6 CU Triaxial Test Summary
Total Stress Effective Stress Sample Type Stockpiling Time Compaction
φφφφ C (psf) φφφφ’ C’ (psf) 4% PC 1 Month 85% 35 1075 39 1094
90% 37 1784 39 1490
4% PC 6 Months 85% 28 1343 46 707
90% 34 1547 41 1205
8% PC 1 Month 85% 37 1526 40 1504
90% 26 4826 30 4506
8% PC 6 Months 85% 35 2193 36 2330
90% 36 3494 44 2832
8% PC + 10% FA 1 Month 85% 37 1512 30 1866
90% 29 2266 34 2164
8% PC + 10% FA 6 Months 85% 26 847 36 655
90% 39 1422 40 1500
Silt Loam+8% cement* 28 days γd = 113,w=15% 37 21,888 Silt Clay Loam+6%
cement* 28 days γd = 112,w=15.7% 36 14,352
* PCA, Bulletin D32 (samples not saturated, no pore pressure measured)

27
The SDM samples were compacted to 85% and 90% of their maximum dry density,
as determined by Modified Proctor (ASTM D1557). For all of the samples tested, a 5%
increase in dry density resulted in increased strength. On average, the un-drained φ and C
values increased by 32% and 35%, respectively. Moreover, the average increases in φ′ and
C′ were 1 % and 50%, respectively. On this basis, it can be concluded that compaction is
the most effective method of increasing the strength of SDM.
Effects of Temperature on SDM Shear Strength
The hydration of pozzolanic materials, including Portland cement, is a temperature
dependent reaction. At temperatures below 40° F, the pozzolanic reactions between the
cement and soil particles slow down. As a result, the improvements associated with the
addition of cement, i.e., moisture content reduction and improved strength, are minimized.
Therefore, it may be prudent to limit the placement of SDM to warm seasons (April
through October). The processing and curing of the material, however, can take place
throughout the year.
To quantify the effects of low temperatures on the curing Portland cement and on
the strength gain/moisture reduction of SDM, samples of RDM were amended with
different percentages of Portland cement and fly ash and then tested for shear strength and
moisture content. For sample preparation, RDM was mixed with 4%, 6%, and 8%
Portland cement and with 4% Portland cement and 5% fly ash. Immediately after mixing,
the samples were placed in molds and minimum compaction was applied. Half of the
samples cured at (70° F) and the other half were kept at 40° F. The samples were tested
for their Unconfined Compressive strength at different intervals: after 24 hours, 7 days, 14
days and 28 days. In addition to strength tests, the moisture content of the samples was
calculated to determine the effects of pozzolanic additives in reducing moisture The
temperature effect data are presented in Table 3.7 and in Figures 3.3 And 3.4.

28
Table 3.7 Effect of Temperature on Shear Strength of SDM
Sample Type
Curing Temperature
in F
Strength (psi) 1 day
Curing
Strength (psi) 7 Day
Curing
Strength (psi) 14 Day
Curing
Strength (psi) 28 Day
Curing
RDM+4%PC 40 -- -- -- --
RDM+4%PC 70 1.5 3.8 5.95 8.2
RDM+6%PC 40 1.1 2.5 4.6 4.3
RDM+6%PC 70 2.7 8.5 12.3 12.4
RDM+8%PC 40 1.8 3.5 3.9 4.2
RDM+8%PC 70 2.7 8.6 12.3 12.4
RDM+4%PC/ 5% FA 40 0.7 3.4 2.5 3.0
Chapter 3
0
2
4
6
8
10
12
14
16
0 5 10 15 20 25 30
Time (days)
Max
imum
Dev
iato
ric
Stre
ss (p
si)
Series1
Series2
Series3
Series4
Series8
Series9
Series10
4% PC
6% PC
8% PC
4% PC + 5% FA
4% PC + 5% FA(Cold)
6% PC(Cold)
8% PC(Cold)
Figure 3.3. Effect of temperature on strength gain during curing period

29
0.4
0.5
0.6
0.7
0.8
0.9
1
0.001 0.01 0.1 1 10 100
Time (Days)
Nor
mal
ized
Wat
er C
onte
nt (W
@t/W
initi
al)
Series1
Series2
Series3
Series4
Series8
Series9
Series10
4% PC
6% PC
8% PC
4% PC + 5% FA
4% PC + 5% FA(cold)
6% PC(Cold)
8% PC(Cold)
Figure 3.4. Effect of temperature on moisture reduction
According to the test results, temperature plays a significant role in the amount and
rate of strength gain in dredged material that has been amended with cement and fly ash.
Therefore, if economically feasible, dredged material should be amended during the warm
seasons of the year. Moreover, temperature affects the rate and degree of moisture
reduction in SDM. According to figure 3.4, this reduction can vary from 45% to 80% of
initial the water content as temperature increases from to 40° to 70°. At low temperatures,
moisture reduction occurs immediately after the mixing, whereas at 70°, cement hydration
takes place over a longer period of time, resulting in further moisture reduction.
All three of the SDM recipes, once they had been compacted to 85% of their
maximum dry density, were able to meet the slope stability requirements (F.S.>1.5) for the
two embankments.

30
During construction of the two embankments, the SDM had to be aerated using a
set of disks, pulled by a bulldozer, which scraped and overturned the SDM. This helped
expose the SDM to sun and air and reduce the moisture content. Sometimes, this process
had to be repeated several times before the moisture content had reached the minimum
required dry density. When the SDM was compacted and disked several times, some or
most of the bonds between the cement crystals and the soil particles tended to break. As a
result, the cementation failed to yield any additional strength gain. It should be noted
again, however, that temperature plays a major role in the hydration of Portland cement
and in the strength gain of SDM.
3.3.4 Permeability
Sample Preparation
Twenty-four samples were prepared and tested for permeability (hydraulic
conductivity). Three different recipes for amending RDM were used in the sample
preparation: 4% Portland cement, 8% Portland cement, and 8% Portland cement with 10%
fly ash. The three different recipes were sampled at one month and at six months. Half of
the samples were compacted to 85% and the other half were compacted to 90% of their
maximum dry density, as determined by Modified Proctor (ASTM D-1557).
Test Procedure
For permeability testing, the ASTM D-5084, or flexible wall, method was used. In
this method, a prepared sample, surrounded by a flexible membrane, is placed in a
watertight chamber in which water pressure or air pressure is applied as confining pressure.
Water is pushed through the sample from the top. Once the inflow and outflow rates are
equal, the sample is considered saturated and readings are taken. During the test, the cell
pressure and the hydraulic gradient remain constant. The hydraulic gradient is the ratio of
difference between the applied hydraulic head at the top and the bottom of sample over the
total length of the sample. According to the ASTM, the gradient should not exceed 30.

31
Results
The results of permeability tests are presented in Table 3.8. A summary of all test
results is provided in Appendix B.4. The permeability results ranged from 1.25*10-6
cm/sec to 4.38*10 –7 cm/sec. The lowest values were recorded for samples of RDM
amended with 8% Portland cement and 10% fly ash. Also, samples amended with 4%
Portland cement generally had lower permeability than did samples amended with 8%
Portland cement. This may be due to the apparent effect of cementation on imposing a
flocculated fabric arrangement in SDM.

32
Table 3.8. Permeability Results
Final Permeability (k) Results from Constant Head Tests
k = [(V(t1, t2)) x L)/(PB x A x t)]
V (t1, t2) = Volume of Flow from t1 to t2 (cm3) A = Area of Sample (cm2)
L = Length of Sample (cm) t = time from t1 to t2 (seconds)PB = Bias Pressure (cm - H2O)
Sample Type Stockpiling Time Compaction Sample # L A V (t1, t2) PB t (seconds) k (cm/sec)4% PC 1 Month 85% 1 14.68 40.73 4.5 70.4 28810 8.00E-07
2 14.73 41.16 3.0 63.3 29050 5.84E-07Average = 6.92E-07
4% PC 1 Month 90% 1 14.73 40.58 3.0 77.4 24300 5.79E-072 14.76 40.87 2.5 70.4 24480 5.24E-07
Average = 5.52E-074% PC 6 Months 85% 1 14.64 40.73 5.0 84.4 29040 7.33E-07
2 14.73 41.01 5.5 77.4 29340 8.70E-07Average = 8.02E-07
4% PC 6 Months 90% 1 14.73 41.30 3.0 63.3 33180 5.09E-072 14.73 41.16 5.5 84.4 33480 6.96E-07
Average = 6.03E-078% PC 1 Month 85% 1 14.61 41.16 7.0 77.4 31080 1.03E-06
2 14.63 40.87 10.0 77.4 31320 1.48E-06Average = 1.25E-06
8% PC 1 Month 90% 1 14.61 41.16 7.0 70.4 30600 1.15E-062 14.63 40.87 5.0 84.4 30300 7.00E-07
Average = 9.27E-078% PC 6 Months 85% 1 14.61 41.16 5.0 70.4 25920 9.73E-07
2 14.57 41.16 4.0 84.4 26160 6.41E-07Average = 8.07E-07
8% PC 6 Months 90% 1 14.86 41.74 3.5 63.3 28440 6.92E-072 15.01 41.45 3.0 70.4 28680 5.38E-07
Average = 6.15E-07
Sample Type Stockpiling Time Compaction Sample # L A V (t1, t2) PB t (seconds) k (cm/sec)8% PC + 10% FA 1 Month 85% 1 14.99 40.87 5.0 70.4 30960 8.42E-07
2 14.76 40.58 3.5 63.3 31440 6.39E-07Average = 7.40E-07
8% PC + 10% FA 1 Month 90% 1 14.76 41.01 3.0 70.4 41120 3.73E-072 14.73 40.58 4.5 70.4 42420 5.47E-07
Average = 4.60E-078% PC + 10% FA 6 Months 85% 1 14.76 41.01 4.5 84.4 28260 6.79E-07
2 14.73 40.87 3.0 63.3 28560 5.98E-07Average = 6.38E-07
8% PC + 10% FA 6 Months 90% 1 14.86 41.74 3.0 70.4 43920 3.46E-072 15.04 41.45 5.0 77.4 44160 5.31E-07
Average = 4.38E-07

33
A comparison between those samples compacted to 85% of the maximum dry
density and those samples compacted to 90% of the maximum dry density indicates that
with an increase in compaction there is a reduction in permeability ranging from 25% to
60%. For SDM amended with 4% Portland cement, the reduction in permeability ranged
from 25% to 36%. For SDM amended with 8% Portland cement and for SDM amended
with 8% Portland cement plus 10% fly ash, the reduction in permeability averaged from
33% to 53% respectively. Samples tested at one month when compared with samples
tested at six months, indicate that there is no significant difference in permeability as a
result of curing time.
In general, tests results indicate that SDM could be considered for use as a low
permeability layer in landfill cap applications. For roadway applications, however,
building roadways on SDM would be similar to building on compacted fine-grained sub-
grades, such as those used in arid regions like Arizona, Texas, etc. Proper coverage must
be provided through base or sub-base materials. The coverage provided over the SDM
sub-grade that lies under the Jersey Garden’s Mall in Elizabeth, NJ, is a good example of
such measures.
3.3.5 Resilient Modulus
In order to determine the feasibility of using SDM as a base in roadway
applications, it was necessary to evaluate resilient modulus values for all the SDM
mixtures considered in this study. Resilient modulus is a dynamic soil property, which is
used in the mechanistic design of pavement systems. The resilient modulus is the ratio of
axial cyclic stress to the recoverable strain. For base, sub-base and sub-grade materials, it
is determined by repeated load triaxial tests on unbound material specimens. In order to
determine the resilient modulus of unbound materials, a cyclic stress of fixed magnitude
must be applied to the material for a duration of 0.1 second, followed by a rest period of
0.9 seconds. During the test, the material is subjected to a confining stress provided by
means of a triaxial pressure chamber (AASHTO T307).
34
The resilient modulus test provides a means of characterizing base, sub-base and
sub-grade materials for the design of pavement systems. These materials can be tested
under a variety of conditions, some of which include stress state, moisture content,
temperature, gradation and density.
Specimen preparation is accomplished in accordance with AASHTO TP46-94
Standard Test Method for Determining the Resilient Modulus of Soils and Aggregate
Materials. This test method classifies sub-grade soils in two categories. Type 1 soil is
classified by the following criteria: less than 70% of the material passes the number 2.00
mm sieve and less than 20% passes the 75-µm, and the material has a plasticity index of 10
or less. These soils are compacted in a 152-mm-diameter mold. Type 2 soils include all
materials that do not meet the criteria for type 1. These soils, such as SDM, are compacted
in 71-mm-diameter mold. The sample preparation procedure for SDM is as follows:
1. Approximately 1,500 g. of SDM were compacted in five equal layers, each
measuring 28.5 mm with a diameter of 71 mm and a height of 142 mm.
The weight of each layer was determined in order to produce the required
density.
2. A plunger was placed into the specimen mold prior to the addition of the
SDM.
3. After the SDM was added, a second plunger was inserted into the
compaction mold. The compaction mold and plungers were then placed
into the loading frame. A load was placed on one of the plungers to
compact the layer until the plungers rested firmly on the compaction mold.
The load was then decreased and the compaction mold was removed from
the loading frame.
4. One of the plungers was removed and the top of the compacted layer was
scarified to ensure integration of the next layer.

35
5. The next layer of SDM was added to the compaction mold. A spacer equal
to the height of the previous layer was placed on top of the compaction
mold before the insertion of the plunger, as shown in Figure 3.5.
6. Steps 4 and 5 were repeated until all five layers were compacted.
7. Using the extrusion ram, the compacted specimen was pressed out of the
compaction mold.
8. The specimen was then placed on the bottom platen of the triaxial chamber.
Using a vacuum membrane expander, a membrane was placed over the
specimen and rolled over the top and bottom platens. O-rings were used to
secure the membrane to the platens to ensure an air-tight seal.
9. A vacuum was applied to the sample. A bubble chamber was used to check
for leaks in the membrane.
10. The triaxial chamber was assembled and a confining pressure of 41.4 kPa
was applied.
11. The triaxial chamber was then placed into the loading frame for the resilient
modulus test.
Compaction Mold
Plunger
Spacer
Extrusion Ram
Figure 3.5 - Compaction Mold, Plungers, Spacers, and Extrusion Ram

36
The testing sequence for evaluating the resilient modulus of sub-grade soils is
presented in Table 3.9.
First, the cyclic load is applied a haversine shape form of (1-cos Θ)/2. The
maximum axial stress is defined as the cyclic stress plus the contact stress, where the
contact stress is 10% of the maximum axial stress. A contact stress on the specimen is
necessary to insure thorough contact between the specimen and platens throughout the
cyclic process. If thorough contact between the loading platens and the specimen is not
achieved, an inaccurate measurement of resilient modulus may result. The cyclic stress is
90% of the maximum applied axial stress. The cyclic stress pulse has a duration of 0.1
second with a rest period of 0.9 seconds. During the rest period a contact stress is
maintained to ensure contact between the loading platens and the specimen.
Table 3.9 - Testing Sequence for Sub-grade Materials
Sequence Number
Confining Pressure, σσσσ3
(kPa)
Maximum Axial Stress, σσσσd
(kPa)
Cyclic Stress, σσσσcd
(kPa)
Contact Stress, σσσσd
(kPa)
Number of Load
Applications
Conditioning 41.4 27.6 24.8 2.8 500-1000
1 41.4 13.8 12.4 1.4 100
2 41.4 27.6 24.8 2.8 100
3 41.4 41.4 37.3 4.1 100
4 41.4 55.2 49.7 5.5 100
5 41.4 68.9 62.0 6.9 100
6 27.6 13.8 12.4 1.4 100
7 27.6 27.6 24.8 2.8 100
8 27.6 41.4 37.3 4.1 100
9 27.6 55.2 49.7 5.5 100
10 27.6 68.9 62.0 6.9 100
11 13.8 13.8 12.4 1.4 100

37
Sequence Number
Confining Pressure, σσσσ3
(kPa)
Maximum Axial Stress, σσσσd
(kPa)
Cyclic Stress, σσσσcd
(kPa)
Contact Stress, σσσσd
(kPa)
Number of Load
Applications
12 13.8 27.6 24.8 2.8 100
13 13.8 41.4 37.3 4.1 100
14 13.8 55.2 49.7 5.5 100
15 13.8 68.9 62.0 6.9 100
Results
The resilient modulus of a soil cannot be represented as a single value. As shown
in Figure 3.6, the resilient modulus of a soil depends on the state of applied stress that the
soil is undergoing, and for sub-grade soils, the state of stress is defined using the bulk
stress (θ) and the applied deviatoric stress (σd);
Mr = k1Pa (θ/Pa)k2 * (σd/Pa)k
3
where;
θ = Bulk Stress = (3σ3 + σd)
σd = Applied Deviatoric Stress
σ3 = Confining Pressure.
Also shown in the figure is the regression equation as well as the material constants
typically used to define the resilient modulus of the tested soil. The regression equation
that was used for all of the testing is referred to as the Universal model. Uzan (1985)
demonstrated that the bulk stress model could not precisely describe nonlinear soil
characteristics; therefore it was modified to more precisely model the nonlinear
characteristics of granular soils. The Universal model may also be used to predict the
nonlinear characteristics of fine-grained and cohesive soils. Fine grained and cohesive
soils are influenced only slightly by confining stresses, but are greatly influenced by

38
deviatoric stresses. Therefore since the Universal model integrates both of these factors, it
is well suited for these soils as shown in the equation, where k1,k2,k3 are material and
physical parameters, Pa is the atmospheric pressure, θ is the bulk stress (σd + 3σ3), and σd
is the deviatoric stress.
0
2,500
5,000
7,500
10,000
12,500
15,000
17,500
0 2 4 6 8 10Applied Deviator Stress (psi)
Res
ilien
t Mod
ulus
(psi
)
Series1
Series2
Series3
Series4
Series5
Series6
MR = (433.4 x Pa) x (θθθθ/Pa)0.6982 x (σσσσd/Pa)-0.3497
6 psi
4 psi
2 psi
Confining Pressure
Figure 3.6 – Typical Resilient Modulus Results for a New Jersey Sub-grade Soil
The plotted results for the regression equation are shown as the dotted line with
hollow symbols, while the actual values are shown as the solid line with solid symbols.
For comparison purposes, a typical pavement section (Figure 3.7) was developed
and analyzed using the elastic-layered theory to determine the bulk stress and the
deviatoric stress that would result from an 18 kip applied axle load. The results were as
follows:
Bulk Stress (θ) = 9.1 psi
Applied Deviatoric Stress (σd) = 5.0 psi
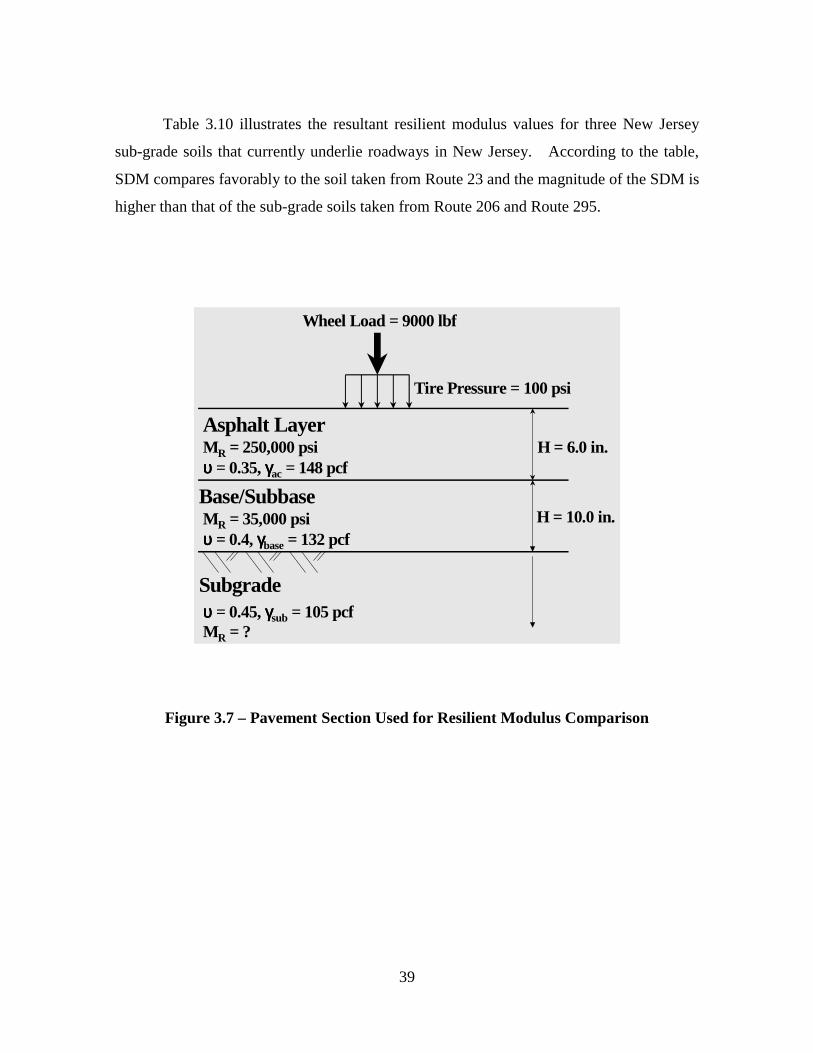
39
Table 3.10 illustrates the resultant resilient modulus values for three New Jersey
sub-grade soils that currently underlie roadways in New Jersey. According to the table,
SDM compares favorably to the soil taken from Route 23 and the magnitude of the SDM is
higher than that of the sub-grade soils taken from Route 206 and Route 295.
Wheel Load = 9000 lbf
Asphalt LayerH = 6.0 in.MR = 250,000 psi
υυυυ = 0.35, γγγγac = 148 pcf
Subgradeυυυυ = 0.45, γγγγsub = 105 pcfMR = ?
Tire Pressure = 100 psi
Base/SubbaseMR = 35,000 psiυυυυ = 0.4, γγγγbase = 132 pcf
H = 10.0 in.
Figure 3.7 – Pavement Section Used for Resilient Modulus Comparison

40
Table 3.10. Comparison of resilient modulus values between SDM and typical NJ base materials
Sample Type Stockpiling Time Compaction Resilient Modulus (psi)4% PC 1 Month 85% 4827.5
90% 7720.24% PC 6 Months 85% 5167.9
90% 87528% PC 1 Month 85% 11,911
90% 12.326.48% PC 6 Months 85% 8432.3
90% 8945.48% PC + 10% FA 1 Month 85% 5610.4
90% 9254.38% PC + 10% FA 6 Months 85% 1498
90% 6601.3Rt. 23
(Medium to Fine Max. Dry 9633.5Sand) Density
Rt. 295(Medium to Fine Max. Dry 6405.8
Silty Sand) DensityRt. 206
(Silt with Fine Max. Dry 6554.3Sand) Density
3.3.6 Consolidation
Laboratory consolidation tests were conducted according to the ASTM D-2435
method. The samples were prepared using RDM amended with 4% Portland cement, 8%
Portland cement, and 8% Portland cement with 10% fly ash. The SDM mix was remolded
into a consolidometer with different compaction efforts applied. To determine the level of
compaction achieved with each sample, a compaction test conforming to ASTM D-1557
was conducted for each recipe. According to the test results, samples were compacted to
varying degrees ranging from 59% to 90% of their maximum dry density.

41
The moisture contents used when the test samples were remolded were chosen to
represent the site’s average and approved layers that did not meet the 85% Modified
Proctor criteria. Except for two, the samples were all remolded at moisture contents well
above their optimum moisture content. According the Geotechnical Testing Report on
Compacted SDM, prepared by Converse Consultants for the Jersey Garden’s Mall project
in Elizabeth, NJ, SDM samples compacted at, or slightly above, their optimum moisture
content would experience almost no deformation, even when subjected to severe loading.
Therefore it was decided that the water content during remolding be increased to account
for cases where the compaction criteria were not met.

42
Table 3.11. Consolidation Test Results
Sample Type Curing Time Moisture Content% Dry Density*(psf)/ Pc (tsf) Cc Cr e0 Cc/(1+eo)
Saturated Remolded Max. Dry Density
SDM (4% PC) 1 month 69.1 68.4 (46.8/ 78.7)=59% 0.88 0.87 0.03 2.691 0.236SDM (4% PC) 1 month 89.4 87.9 (47.7/ 78.7)=61% 4.14 0.88 0.04 2.674 0.240SDM (4% PC) 6 month 89.8 55.7 (64.3/ 77.4)=83% 2.54 0.44 0.03 1.687 0.164SDM (4% PC) 6 month 91.2 53.9 (67.6/ 77.4)=87% 8.7 0.39 0.02 1.608 0.150SDM (4% PC) 6 month 70.6 40.6 (69.6/ 77.4)=90% 2.19 0.49 0.03 1.565 0.191SDM (8% PC) 1 month 95.1 74.4 (53.7/ 78.5)=68% 2.51 0.51 0.02 2.057 0.167SDM (8% PC) 1 month 92.9 63.3 (58.8/ 78.5)=75% 6.4 0.51 0.02 1.793 0.183SDM (8% PC) 1 month 89 53.5 (63.6/ 78.5)=81% 7.45 0.22 0.02 1.582 0.085SDM (8% PC) 6 month 62.1 64.4 (46/ 76.6)= 60% 1.41 0.9 0.03 2.717 0.242SDM (8% PC) 6 month 82.7 76.7 (48.8/ 76.6)=64% 2.38 0.83 0.02 2.431 0.242SDM (8% PC) 6 month 89.2 86.5 (47.8 76.6)=62% 2.83 0.83 0.02 2.542 0.234
SDM (8% PC,10% FA) 1 month 64.1 60 (50.7/ 78.8)=64% 2.64 0.72 0.03 2.623 0.199SDM (8% PC,10% FA) 1 month 81.4 69.6 (53.8/ 78.8)=68% 1.92 0.54 0.02 2.397 0.159SDM (8% PC,10% FA) 1 month 85.2 79.3 (52.9/ 78.8)=67% 0.97 0.58 0.03 2.605 0.161SDM (8% PC,10% FA) 6 month 93 54.9 (64.2/78.4)=82% 7 0.33 0.02 1.546 0.130SDM (8% PC,10% FA) 6 month 89.1 56 (67.9/78.4)=87% 8.27 0.41 0.02 1.766 0.148SDM (8% PC,10% FA) 6 month 73.2 46 (67.4/ 78.4)=86% 1.32 0.43 0.02 1.766 0.155
Organic Silt, Bayonne, NJ* 75.1 58.9 pcf 0.15 0.54 1.86 0.189Organic peat, Elizabeth, NJ* 90 46.5 pcf 1.38 0.7 2.6 0.194
Elastic Silt, Elizabeth, NJ* 70.4 54.3 pcf 1.17 0.69 2.14 0.220Organic Silt, Woodbridge, NJ 158.8 27.3 pcf 0.89 3.5 6.08 0.494
*Remolded Dry Density (before consolidation) * Obtained from OENJ Cherokee, Inc.

42
Samples were tested after one month of curing and after six months of curing. .
All consolidation test results are presented in Appendix B.5. As previously mentioned, the
energy applied for remolding the sample prior to the test plays a major role in the
consolidation behavior of the material. Test results indicate pre-consolidation stresses (Pc)
as high as 8.7 tsf, once the sample is compacted to 87% of its modified maximum dry
density. This means that the compacted material will compress before experiencing 8.7 tsf
of overburden (equivalent to approximately 170 feet of SDM, unit weight of 100 pcf, or
133 feet of compacted granular fill unit weight of 130 pcf). However, Pc as low as 1.32 tsf
was recorded for a sample compacted to 86% of its modified maximum dry density. The
average value of Pc, for samples compacted from 81% to 90% of their modified maximum
dry density, is higher than 5 tsf.
The compression index (Cc) values range from 0.22 to 0.9. Both of these values
were recorded for SDM with 8% Portland cement. In general, for all recipes tested, once
compaction reaches 81%, the compression index will not exceed 0.5. In that case, a Pc of 2
tsf or more should be expected. The compression ratio (CR =Cc/1+e0) varied from 0.085 to
0.24. This value did not exceed 0.19 for samples compacted to 83% or above.
Based on the results presented in Table 3.11, it can be concluded that SDM
embankments could be constructed to a height of 50 feet with a minimum of settlement
taking place within the SDM fill. This conclusion is supported by the results of the field
settlement program (section 4.3). In the case of the two embankments in this study, and in
similar cases where construction is proposed on marginal foundation soils, settlement is
primarily a function of the foundation soil and its consolidation characteristics.
3.3.7 Swell Potential
Samples of SDM were also tested for swell pressure in order to determine if SDM
could be used in applications where the material would be in contact with structures
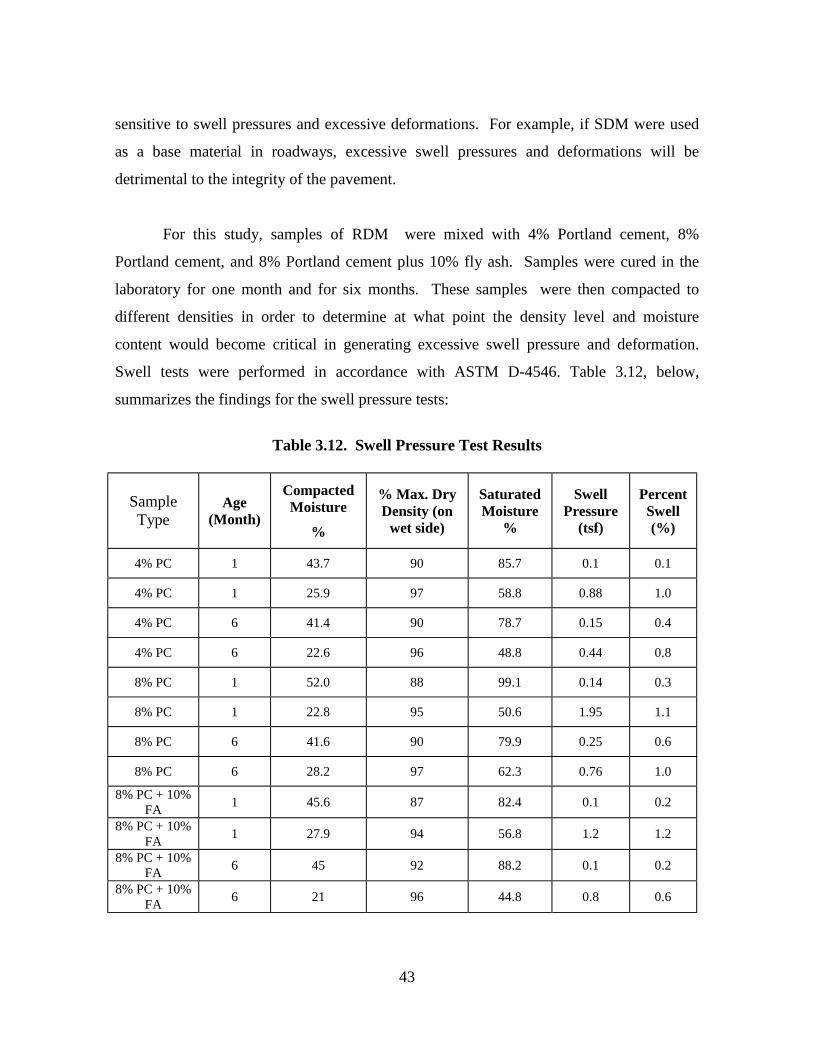
43
sensitive to swell pressures and excessive deformations. For example, if SDM were used
as a base material in roadways, excessive swell pressures and deformations will be
detrimental to the integrity of the pavement.
For this study, samples of RDM were mixed with 4% Portland cement, 8%
Portland cement, and 8% Portland cement plus 10% fly ash. Samples were cured in the
laboratory for one month and for six months. These samples were then compacted to
different densities in order to determine at what point the density level and moisture
content would become critical in generating excessive swell pressure and deformation.
Swell tests were performed in accordance with ASTM D-4546. Table 3.12, below,
summarizes the findings for the swell pressure tests:
Table 3.12. Swell Pressure Test Results
Sample Type
Age (Month)
Compacted Moisture
%
% Max. Dry Density (on
wet side)
Saturated Moisture
%
Swell Pressure
(tsf)
Percent Swell (%)
4% PC 1 43.7 90 85.7 0.1 0.1
4% PC 1 25.9 97 58.8 0.88 1.0
4% PC 6 41.4 90 78.7 0.15 0.4
4% PC 6 22.6 96 48.8 0.44 0.8
8% PC 1 52.0 88 99.1 0.14 0.3
8% PC 1 22.8 95 50.6 1.95 1.1
8% PC 6 41.6 90 79.9 0.25 0.6
8% PC 6 28.2 97 62.3 0.76 1.0
8% PC + 10% FA 1 45.6 87 82.4 0.1 0.2
8% PC + 10% FA 1 27.9 94 56.8 1.2 1.2
8% PC + 10% FA 6 45 92 88.2 0.1 0.2
8% PC + 10% FA 6 21 96 44.8 0.8 0.6

44
A detailed summary of test results is given in Appendix B.6. As noted in the table
above, samples were compacted with moisture contents on the wet side and the dry side of
optimum. Higher compaction was achieved for the samples compacted with moisture
contents on the dry side of optimum.
The laboratory data indicate several trends. The strain or percent swell was not
significant for any of the samples tested. The strain values ranged from 0.1 to 1.2 percent,
with an average of 0.6. The maximum strain belonged to the sample amended with 8%
Portland cement plus10% fly ash (1.2%). This magnitude of volume change is considered
low and, therefore, not detrimental to adjacent structures. These laboratory results counter
the probable expansion information provided by Holtz and Novak (1981), and referenced
in Table 3.13. The swell pressure, however, was high for samples compacted to 94% or
higher of their maximum dry density with moisture contents on the dry side of optimum.
For these samples, the overall average swell pressure was 1.005 tsf. The average for one-
month old samples was slightly higher at 1.34 tsf, with an average strain of 1.1%.
Table 3.13. Probable expansion estimated from Classification Data
(Adopted after Holtz and Kovacs, 1981)
Degree of Expansion Probable Expansion as a % of the total volume change (dry to saturated condition)
Very High > 30
High 20-30
Medium 10-20
Low <10
* After Holtz (1959) and USBR 1974
** Under a surcharge of 6.9 kPa (1psf)
Although strains were not high for any of the samples tested, the swell pressure
generated was moderate. For SDM that was mixed with 8% Portland cement and
compacted to 95% of its maximum dry density, the swell pressure was measured as high as

45
1.96 tsf. However, considering low associated strains, SDM would not have any
detrimental effect on adjacent structures.
For samples compacted on the wet side of their optimum moisture content, much
lower swell pressures and strains were measured. The average swell pressure for those
samples was 0.14 tsf, and the average strain was 0.3%. This results from the fact that
fine-grained soils have a flocculated structure at low moisture contents (below optimum
moisture content). At moisture contents above optimum, the structure of the soil particles
becomes more dispersed and layered. For these structures, additional moisture does not
result in significant volume changes.
3.3.8 Durability
Freeze-Thaw Tests
The major durability concerns regarding SDM include potential strength loss due to
freeze-thaw cycles and moisture variation. The freeze-thaw test simulates the internal
expansive forces that result from the moisture in fine-grained soils. The freeze-thaw test
avoids the accelerated cement hydration that is necessary to perform the wet-dry test.
During freeze-thaw cycles, SDM experiences an increase in volume and a loss in strength.
Some soil-cement mixtures have the ability to regain strength under certain conditions;
specifically, the availability of reactive Calcium Oxide, adequate temperature and a high
pH environment. For SDM, these conditions do not exist; therefore, any strength loss will
be permanent.
To study the effects of freeze-thaw cycles on SDM, samples were prepared from
the three different recipes. The testing was performed in accordance with ASTM D560.
Samples were compacted to 85 and 90% of their maximum dry density, as determined by
Modified Proctor. To provide a point of reference, a natural clay sample was also tested

46
for its behavior during freeze-thaw cycles. The results of the freeze-thaw test are
summarized in Appendix B.8.
According to the test results, none of the samples could withstand more than three
freeze-thaw cycles before failing. Significant volume change (ranging from 1.8% to 58%)
was experienced during testing. Considering that the average volume change for the
natural clay sample was 2%, it may be concluded that the freeze-thaw effect is several
times more severe for SDM than it is for natural clay. As a result, all SDM should be
protected against frost in order to maintain the cement contents within the percentages used
for this project. Frost depth in New Jersey is approximately 2.5 to 3 feet. Under these
conditions, SDM should be kept at least three feet below the surface. This should apply to
both pavements and embankment slopes.
Wet-dry Tests
Wet-dry tests are conducted to simulate shrinkage forces in cement-modified or
soil-cement specimens. Wet-dry cycle tests were conducted on the three different recipes
of SDM. Tests were conducted according to ASTM D-559. All of the samples with the
exception of one (8% PC @ 90% Modified Proctor) collapsed before experiencing 12 wet-
dry cycles. Volume changes were in the range of 10% to 48% of the original volume.
Therefore, SDM should be protected against frequent wet-dry cycles. However, if SDM is
compacted at moisture contents below the shrinkage limit, the potential for the
development of tensile cracks and a consequent loss in strength could be minimized.
47
4. FIELD TESTING PROGRAM
4.1 Objective
The primary objectives of the field-testing program were as follows:
1) To check the uniformity of the mix by evaluating field cement contents during the
mixing process.
2) To perform rapid in-situ compaction tests, such as Humboldt and Clegg hammer,
for comparison with nuclear density gauge.
3) To instrument and monitor the embankments with settlement plates, horizontal and
vertical inclinometers and extensometers in order to evaluate settlement and
horizontal slope deformation.
4) To evaluate the long-term effects of cement/lime curing on the strength gain of the
SDM. This was done using CPT sounding within the crown of the embankment on
a monthly basis for an initial period of six months, which was later extended to
nine months
4.2 Field Cement Content Evaluation
In order to evaluate the quality of the mixing procedure at the OENJ Elizabeth
facility, the cement content of samples collected from the site was measured for
approximately six weeks: from September 29 to November 10, 1998. Grab samples of the
SDM were collected on a daily basis and transferred to the laboratory for cement content
determination using the Standard Test Method for Cement Content of Soil-Cement
Mixtures (ASTM D 806 – 96). The target cement content of 8% was used the basis for
evaluating the test results.
48
As a quality assurance measure, laboratory samples were also tested for cement
content. These samples were prepared from a representative sample of RDM amended
with Portland cement. The pug mill operator, E. E. Cruz, had provided the sample.
The test procedure requires that the level of CaO be determined in the raw soil, the
cement, the soil-cement mixture and a blank sample. The blank sample required 0 ml of
KMnO4. Titration of the Portland cement sample required 45 ml of KmnO4, yielding a
CaO content of 63%. Raw soil was determined to contain 0.868% CaO. For the soil-
cement sample, 33.5 ml of KMnO4 was required for titration, yielding a cement content of
9.38%. All the reported values are for percentage by weight of soil with hydrated cement.
If values for dry cement are desired, ASTM D-806, note 12, suggests multiplying these
values by 1.04.
The cement content test results are presented in Figure 4.1. As the figure indicates,
there is considerable variation with respect to the target cement content of 8%. Most of the
variation can be attributed to problems associated with the original design of the
processing plant. Specifically, the system was deficient in regulating the flow of cement
into the pug mill. The system was later modified and properly instrumented with flow-
meters and aerators placed near the input orifice of the pug-mill. This modification, which
was implemented primarily as a result of this study, will help to better achieve the target
cement contents.

49
OENJ/Elizabeth Cement Content
0
5
10
15
20
25
30
35
40
0 5 10 15 20 25 30 35 40 45Days
Cem
ent C
onte
nt (%
)
8% cement content
SmplesTested from 9/29/98 to 11/10/98ASTMD806-96
Figure 4.1- Field cement content data
4.3 Field Compaction Tests
The purpose of the testing program was to attempt to determine the dry density of
portland cement stabilized dredge material in-situ by utilizing the Humboldt Stiffness
Gauge (HSG) and the Clegg Impact Hammer (CIH) test. Traditional methods of dry
density determination via the Nuclear Density Gauge (Troxler test) may not accurately
determine the dry density of cement stabilized soils in-situ due to a problem with the
device determining the moisture content of the material (Figure 4.2). Therefore, tests
utilizing the Troxler test must first determine the wet density of the material and then
require a minimum of 12 to 16 hours to oven dry the cement stabilized soil samples for
moisture content determination (ASTM D2216 – Laboratory Determination of Water
(Moisture) Content of Soil and Rock). However, if a methodology could be developed to
utilize either the HSG or the CIH for dry density determination, results could be achieved
instantaneously, instead of the “next day” minimum of the Troxler test.

50
Figure 4.2 – Nuclear Gauge Determined Moisture Content versus Oven Dried
The testing methodology used in this study was to use the manufacturer’s
procedures for the HSG and current standards for the CIH to predict the dry density of the
portland cement stabilized dredge material after field placement. Then, compare the
predicted results to the dry density results determined by the Troxler tests, essentially
making the Troxler tests the benchmark for comparison.
Humboldt Stiffness Gauge (HSG)
The Humboldt Stiffness Gauge (HSG) acts as a miniature plate load test. The
stiffness is determined by the ratio of the force to displacement (K=P/δ). The HSG does
not measure the deflection that results from the weight of the HSG instrument itself.
Instead, the HSG vibrates and produces small changes in the applied force that, in turn,
produces small deflections that are measured.
y = 19.607e0.0324x
R2 = 0.6256
0
10
20
30
40
50
60
70
80
90
100
0 10 20 30 40 50
Nuclear Gauge Determined Moisture Content (%)
Lab
orat
ory
Det
erm
ined
Moi
stur
e C
onte
nt (%
)
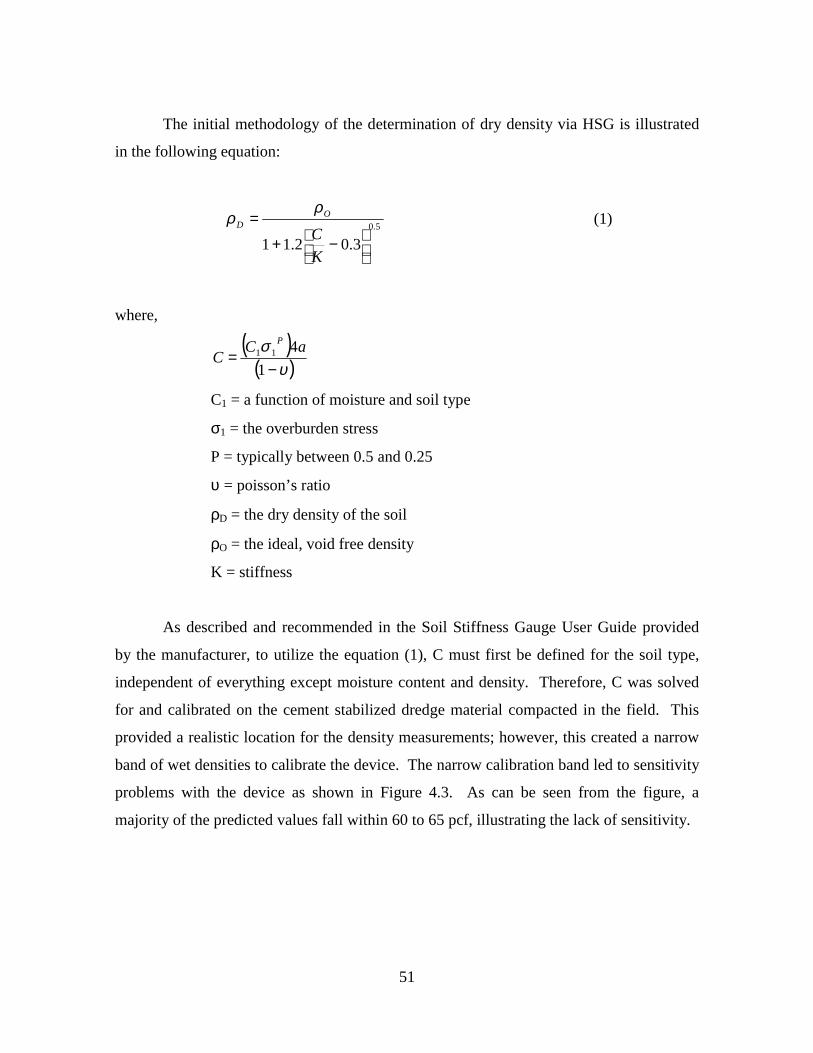
51
The initial methodology of the determination of dry density via HSG is illustrated
in the following equation:
5.0
3.02.11
−+
=
KC
OD
ρρ (1)
where,
( )
( )υσ−
=1
411 aCC
P
C1 = a function of moisture and soil type
σ1 = the overburden stress
P = typically between 0.5 and 0.25
υ = poisson’s ratio
ρD = the dry density of the soil
ρO = the ideal, void free density
K = stiffness
As described and recommended in the Soil Stiffness Gauge User Guide provided
by the manufacturer, to utilize the equation (1), C must first be defined for the soil type,
independent of everything except moisture content and density. Therefore, C was solved
for and calibrated on the cement stabilized dredge material compacted in the field. This
provided a realistic location for the density measurements; however, this created a narrow
band of wet densities to calibrate the device. The narrow calibration band led to sensitivity
problems with the device as shown in Figure 4.3. As can be seen from the figure, a
majority of the predicted values fall within 60 to 65 pcf, illustrating the lack of sensitivity.

52
Figure 4.3 – HSG Predicted Dry Density versus Nuclear Gauge
Clegg Impact Hammer (CIH)
The Clegg Impact Hammer (CIH) is a cylindrical hammer of similar shape to a
proctor compaction hammer. Inside the hammer is an accelerometer that measures the
deceleration of the hammer falling from a designated drop height of 18 inches. The
deceleration is then interpreted as a Clegg Impact Value (CIV). It is this CIV parameter
that can be correlated to dry density of soil using the following assumptions:
1) The stiffer (more dense) the soil is, the faster the cylindrical hammer will stop;
and
2) The softer (less dense) the soil is, the slower the cylindrical hammer will stop.
50
55
60
65
70
75
80
50 55 60 65 70 75 80
Dry Density from Troxler (pcf)
Dry
Den
sity
from
Hum
bold
t (pc
f)
Number of Data Points = 412

53
The correlation of the CIV to dry density for portland cement stabilized dredge
material was conducted in the laboratory. Dredge material was first compacted in
compaction molds and once the wet density of the soil was determined, a CIH test was
conducted. Soil was then taken from the compaction mold and placed into an oven for 48
hours. After the 48-hour drying period had expired, the moisture content was determined,
and, in turn, the dry density. The regression equation from the laboratory correlation is
shown as equation (2).
281.54))(ln(222.5 += CIVDρ (2)
where,
ρD = dry density in pounds per cubic feet
CIV = Clegg Impact Value
Figure 3 shows the results of 383 field tests where the Clegg Impact Hammer test was used
in conjunction with the Troxler test. As shown in the figure, the Clegg Impact Hammer
also has sensitivity problems, even more so than the Humboldt Stiffness Gauge. A
majority of the points occurred between 63 to 66 pcf.
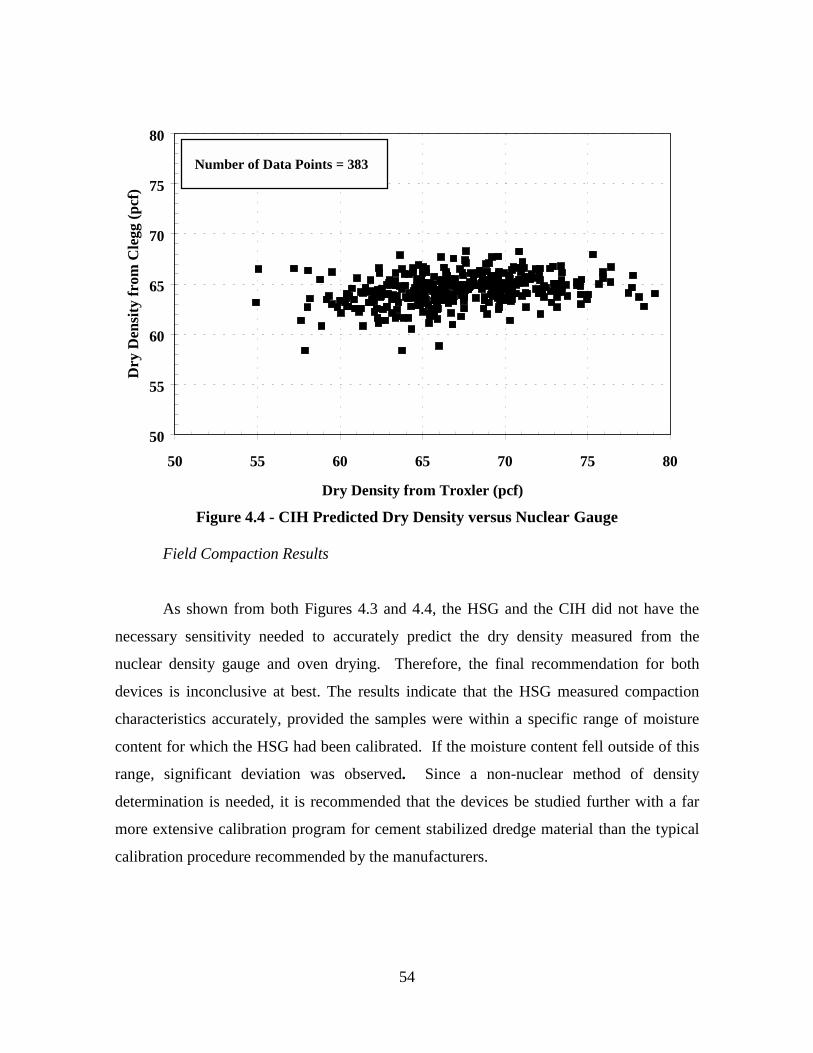
54
Figure 4.4 - CIH Predicted Dry Density versus Nuclear Gauge
Field Compaction Results
As shown from both Figures 4.3 and 4.4, the HSG and the CIH did not have the
necessary sensitivity needed to accurately predict the dry density measured from the
nuclear density gauge and oven drying. Therefore, the final recommendation for both
devices is inconclusive at best. The results indicate that the HSG measured compaction
characteristics accurately, provided the samples were within a specific range of moisture
content for which the HSG had been calibrated. If the moisture content fell outside of this
range, significant deviation was observed. Since a non-nuclear method of density
determination is needed, it is recommended that the devices be studied further with a far
more extensive calibration program for cement stabilized dredge material than the typical
calibration procedure recommended by the manufacturers.
50
55
60
65
70
75
80
50 55 60 65 70 75 80
Dry Density from Troxler (pcf)
Dry
Den
sity
from
Cle
gg (p
cf)
Number of Data Points = 383

55
4.4 Field Settlement Monitoring
4.4.1 Settlement Plates
A total of 15 settlement plates were installed to monitor the settlement of the
foundation soil at the footprint of each embankment as well as the settlement within the
SDM that had been used in the construction of the embankments. Settlement plates are 3’
by 3’ steel plates with 10-foot steel riser rods welded to the center of the plate.
Of the 15 settlement plates, nine were installed within Embankment 2 (plates 1 to
9), and six were installed within Embankment 1 (plates 10 to 15). Within Embankment 2,
Plates 1 to 6 were installed at the base, plates 7 and 8 were installed five feet above the
base and plate 9 was installed ten feet above the base. The height of the embankment was
13 feet at the summit.
Within Embankment 1, settlement plates 10 to 15 were installed at the base to
monitor the embankment’s differential settlement. Approximately 10 feet of SDM was
placed at the summit of embankment # 2.
Settlement plates 1 - 6 and 10 - 15 monitored settlement within the foundation soil
at the footprint of the two embankments. Non-uniform settlement within the foundation
soil, resulting from the heterogeneous nature of waste material and the nominal
compaction of the fill, could produce soil failure. To mitigate this problem, a high strength
geosynthetic fabric was installed at the base of each embankment. The use of the
geosynthetic fabric has resulted in a more uniform settlement throughout the entire foot
print area of the embankments, thereby preventing foundation soil failure.
At Embankment 2, settlement plates 7 and 8 were installed five feet above the base
and 20 feet to the west of plates 3 and 4, respectively. As a result, any differential

56
settlement measured between plates 7 and 3 or between plates 8 and 4 could only be
attributed to the settlement within the SDM, irrespective of base settlement. Additionally,
plate 9 was installed ten feet above the base and 20 feet to the east of plate 3 to monitor the
settlement within the bottom ten feet of the SDM.
The settlement of the embankments was monitored during a 500-day period: May,
1999 to October, 2000. During that time, 18 sets of readings, at various intervals, were
taken by McCutcheon Associates, P.A., Secaucus, New Jersey. The elevations of the inner
rods were recorded in reference to a benchmark within the Jersey Garden’s Mall site.
Readings were taken to within 0.01-foot accuracy. A summary analysis of the monitoring
program is presented in Figure 4.8 through 4.13.
According to Figure 4.8, the base settlement for Embankment 2 ranged from 1 to
1.32 feet, not including plate 4. Foundation soil at the location of plate 4 included
controlled fill that had been placed over the Great Ditch pipe. This resulted in lower
settlement measurements (0.7 feet) relative to the rest of the embankment. The maximum
settlement was measured at plates 2 and 3, where the largest amount of SDM had been
placed. An increase in the rate of settlement was due to the placement of additional soil
layers during construction. The implementation of a high strength geosynthetic fabric
limited the amount of differential settlement to 0.32 feet, or 3.8 inches, along the
longitudinal axes of the embankment. The transverse differential settlement was 6.5
inches, as measured between plates 3 and 4. None of these settlements is considered
excessive and they did not result in soil failure as the majority of the settlement happened
during construction.
The report entitled, “Site Investigation & Foundation Analysis for NJDOT
Embankment Demonstration Project,” November 1998, predicted that the maximum
settlement that would result from the placement of 20 feet of SDM at the location of
Embankment 2 was 1.8 ft, or 22 inches. Using the primary consolidation model, assigning
a compression ratio of 0.15 for refuse and 0.2 for the organic layer, and adjusting the
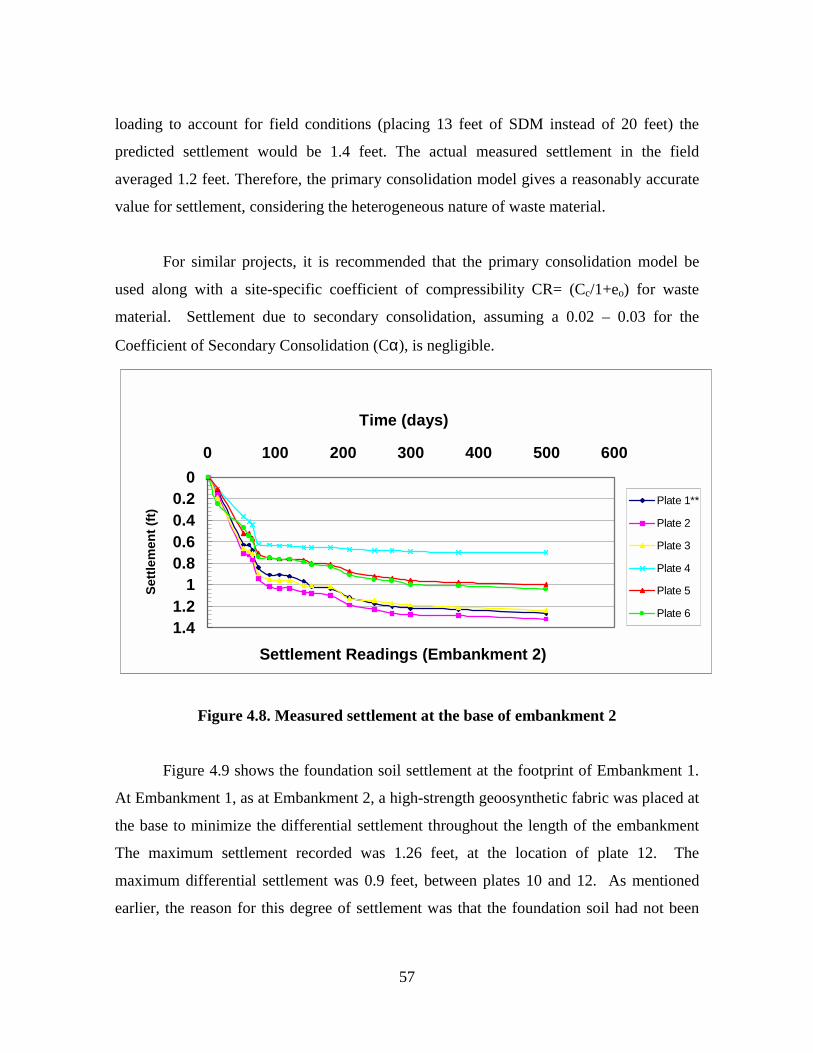
57
loading to account for field conditions (placing 13 feet of SDM instead of 20 feet) the
predicted settlement would be 1.4 feet. The actual measured settlement in the field
averaged 1.2 feet. Therefore, the primary consolidation model gives a reasonably accurate
value for settlement, considering the heterogeneous nature of waste material.
For similar projects, it is recommended that the primary consolidation model be
used along with a site-specific coefficient of compressibility CR= (Cc/1+eo) for waste
material. Settlement due to secondary consolidation, assuming a 0.02 – 0.03 for the
Coefficient of Secondary Consolidation (Cα), is negligible.
Settlement Readings (Embankment 2)
00.20.40.60.8
11.21.4
0 100 200 300 400 500 600
Time (days)
Settl
emen
t (ft)
Plate 1**
Plate 2
Plate 3
Plate 4
Plate 5
Plate 6
Figure 4.8. Measured settlement at the base of embankment 2
Figure 4.9 shows the foundation soil settlement at the footprint of Embankment 1.
At Embankment 1, as at Embankment 2, a high-strength geoosynthetic fabric was placed at
the base to minimize the differential settlement throughout the length of the embankment
The maximum settlement recorded was 1.26 feet, at the location of plate 12. The
maximum differential settlement was 0.9 feet, between plates 10 and 12. As mentioned
earlier, the reason for this degree of settlement was that the foundation soil had not been
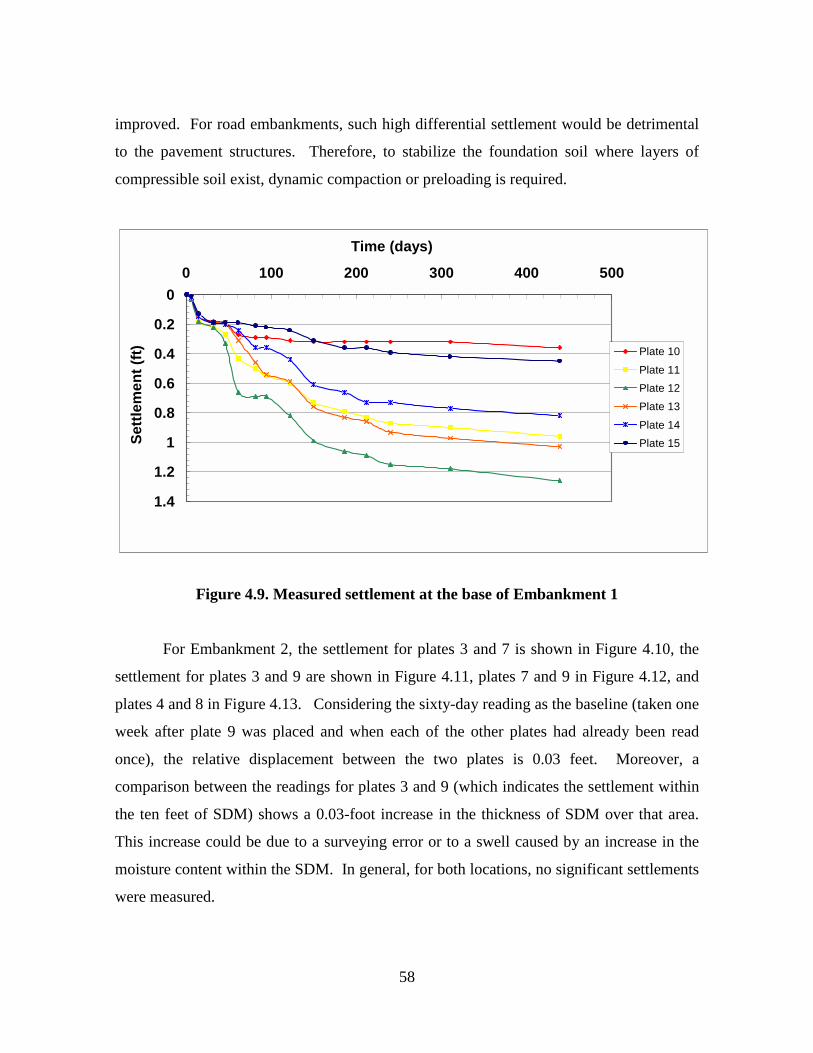
58
improved. For road embankments, such high differential settlement would be detrimental
to the pavement structures. Therefore, to stabilize the foundation soil where layers of
compressible soil exist, dynamic compaction or preloading is required.
0
0.2
0.4
0.6
0.8
1
1.2
1.4
0 100 200 300 400 500
Time (days)
Settl
emen
t (ft) Plate 10
Plate 11Plate 12Plate 13Plate 14Plate 15
Figure 4.9. Measured settlement at the base of Embankment 1
For Embankment 2, the settlement for plates 3 and 7 is shown in Figure 4.10, the
settlement for plates 3 and 9 are shown in Figure 4.11, plates 7 and 9 in Figure 4.12, and
plates 4 and 8 in Figure 4.13. Considering the sixty-day reading as the baseline (taken one
week after plate 9 was placed and when each of the other plates had already been read
once), the relative displacement between the two plates is 0.03 feet. Moreover, a
comparison between the readings for plates 3 and 9 (which indicates the settlement within
the ten feet of SDM) shows a 0.03-foot increase in the thickness of SDM over that area.
This increase could be due to a surveying error or to a swell caused by an increase in the
moisture content within the SDM. In general, for both locations, no significant settlements
were measured.

59
Settlement Readings (plates #3 & #7)
0
0.2
0.4
0.6
0.8
1
1.2
1.4
0 100 200 300 400 500 600
Time (days)
Sett
lem
ent (
ft)
Plate 3
Plate 7
P7-P3
Figure 4.10. Settlement comparison for plates #3 and #7 – Embankment 2
Settlement Readings (plates #3 & #9)
0
0.2
0.4
0.6
0.8
1
1.2
1.4
0 200 400 600
Time (days)
Sett
lem
ent (
ft)
Plate 3
Plate 9
P9-P3
Figure 4.11. Settlement comparison for plates #3 and #9 – Embankment 2
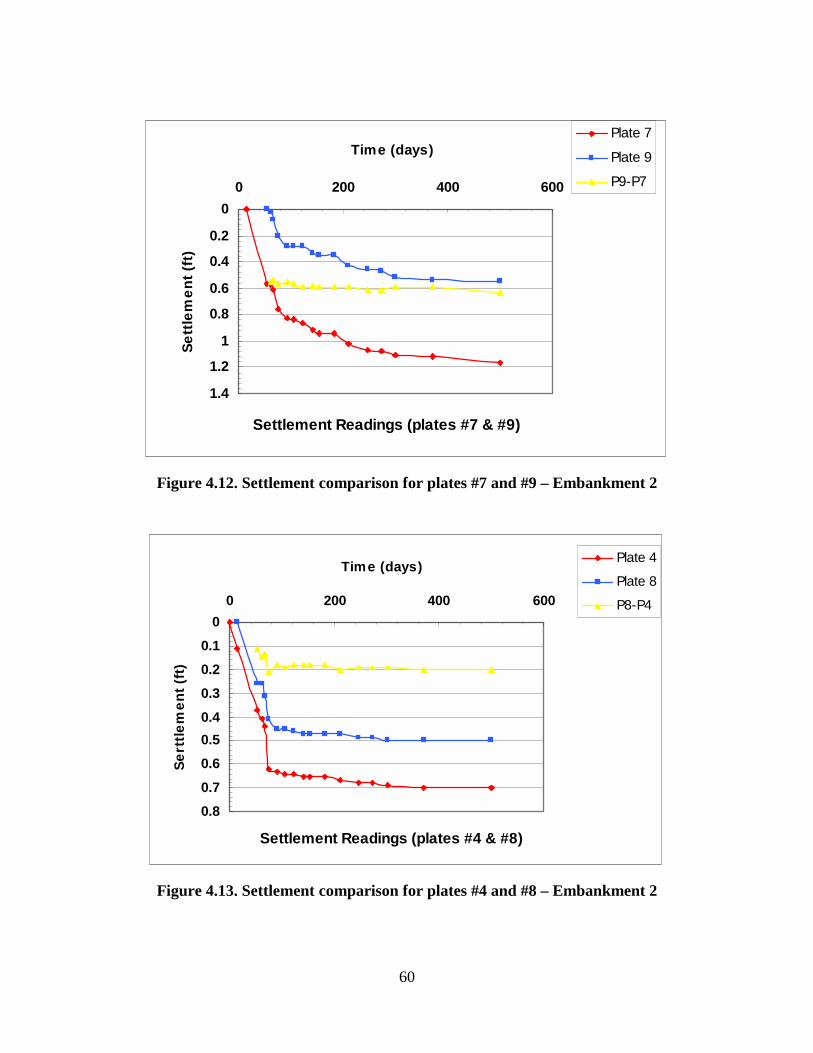
60
Settlement Readings (plates #7 & #9)
0
0.2
0.4
0.6
0.8
1
1.2
1.4
0 200 400 600
Time (days)
Sett
lem
ent (
ft)
Plate 7
Plate 9
P9-P7
Figure 4.12. Settlement comparison for plates #7 and #9 – Embankment 2
Settlement Readings (plates #4 & #8)
00.10.20.30.40.50.60.70.8
0 200 400 600
Time (days)
Sert
tlem
ent (
ft)
Plate 4
Plate 8
P8-P4
Figure 4.13. Settlement comparison for plates #4 and #8 – Embankment 2

61
According to the laboratory consolidation tests, SDM amended with 8% Portland
cement and compacted to 60% - 81% of its modified maximum dry density has a
Compression Ratio (Cc) in the range of 0.22 to 0.9. Void ratios range from 1.282 to 2.717.
It should be notes that these values are highly dependent on the compaction applied during
the remolding of laboratory samples. If the samples are compacted to 75% or more of their
modified maximum dry density (as they were in the field), the pre-consolidation ratio will
be higher than 6.4. This is equal to a surcharge twelve times greater than what the placed
SDM experienced in the field. The Cc for the initial portion of the consolidation curve is
approximately 0.08. Using this value and the applied load equivalent of 10/2=5 feet of
SDM, or 0.25 tsf (5x10² pcf), the anticipated settlement is 0.01 feet, (0.12 inch). The field
settlement measurement is in keeping with laboratory test results.
In addition to its own weight, the SDM used in embankments will experience the
weight of overlying pavement and vehicular loads. These loads will add approximately 0.4
tsf to the applied loads, and will add 0.0075 ft (0.08 inches) to the settlement. Therefore,
the anticipated total settlement would be 0.2 inches, assuming that ten feet of SDM were
used. If, however, 20 or 30 feet of SDM were used, the total anticipated settlements could
increase to 0.4 inches and 0.6 inches, respectively.
4.4.2 Horizontal Inclinometers
In addition to settlement plates, horizontal inclinometers were used to obtain high-
resolution profiles of the settlement under Embankments 1 and 2. The position of the
inclinometers is shown in Figure 4.14. A detailed explanation of the measurements and
inclinometer testing is provided in Appendix C.3. A summary of the relative deflection
readings for both embankments is given in table 4.1.

62
Table 4.1- Measured vertical settlement
Embankment 1 Max. Cumulative Displacement.[in] Embankment 2 Max. Cumulative
Displacement.[in]
1 10/01/99 “Zero level” 10/08/99 “Zero level”
2 11/23/99 2.5 11/25/00 Not successful
3 01/04/00 3.0 01/06/00 3.7
4 03/16/00 4.25 03/18/00 Not successful
5 05/16/00 4.75 05/19/00 5.1
6 09/02/00 5.5 10/26/00 5.9
There was also settlement for both reference points of approximately 7.2” for
embankment 1 and 7.5” for embankment 2. So the maximum total settlement values were
12.7 and 13.4 inches for embankments 1 and 2, respectively
4.4.3 Magnetic Extensometer
In order to determine the degree to which fill and foundation soils affected the total
settlement values, a magnetic extensometer was installed on the crown of Embankment 1,
as shown in Figure 4.13.

63
Figure 4.13. Installation of magnetic extensometer on Embankment 1
A detailed explanation of the extensometer and of the installation procedure is
provided in Appendix C.3. The extensometer was installed on March 16, 2000 and
readings were taken until September 2, 2000. Based on the readings, taken from the
location of three spider magnets within the borehole, no noticeable settlement was
observed within the fill of Embankment 1. This suggests that the foundation soils are
primarily responsible for the overall settlements.

64
Ver
tical
QC
cas
ings
0 ' 50'
Newark Bay
Nor
th
Em
bank
men
t 2
HorizontalQC casning
HorizontalQC casing
Fig. 11 The schematic of embankments and installed casings
7.5'
25.0'26.0'
Em
bank
men
t 1
A A
Section A-A
Figure 4.14. The schematic of the embankments and installed casings
Elevation contour interval at approximately 2.5 feet
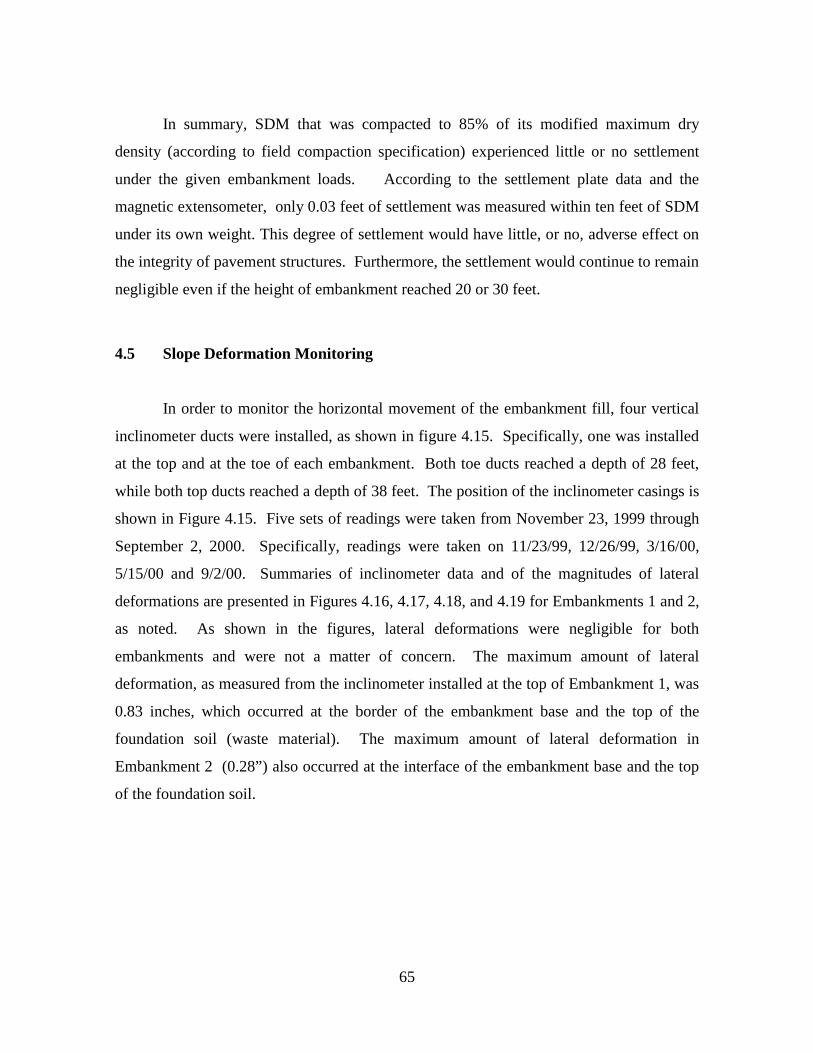
65
In summary, SDM that was compacted to 85% of its modified maximum dry
density (according to field compaction specification) experienced little or no settlement
under the given embankment loads. According to the settlement plate data and the
magnetic extensometer, only 0.03 feet of settlement was measured within ten feet of SDM
under its own weight. This degree of settlement would have little, or no, adverse effect on
the integrity of pavement structures. Furthermore, the settlement would continue to remain
negligible even if the height of embankment reached 20 or 30 feet.
4.5 Slope Deformation Monitoring
In order to monitor the horizontal movement of the embankment fill, four vertical
inclinometer ducts were installed, as shown in figure 4.15. Specifically, one was installed
at the top and at the toe of each embankment. Both toe ducts reached a depth of 28 feet,
while both top ducts reached a depth of 38 feet. The position of the inclinometer casings is
shown in Figure 4.15. Five sets of readings were taken from November 23, 1999 through
September 2, 2000. Specifically, readings were taken on 11/23/99, 12/26/99, 3/16/00,
5/15/00 and 9/2/00. Summaries of inclinometer data and of the magnitudes of lateral
deformations are presented in Figures 4.16, 4.17, 4.18, and 4.19 for Embankments 1 and 2,
as noted. As shown in the figures, lateral deformations were negligible for both
embankments and were not a matter of concern. The maximum amount of lateral
deformation, as measured from the inclinometer installed at the top of Embankment 1, was
0.83 inches, which occurred at the border of the embankment base and the top of the
foundation soil (waste material). The maximum amount of lateral deformation in
Embankment 2 (0.28”) also occurred at the interface of the embankment base and the top
of the foundation soil.

66
San
d
Ref
use
Fill
Pit/
Silt
Slope 2:1
Figure 4.15. Schematic diagram of vertical inclinometer casings
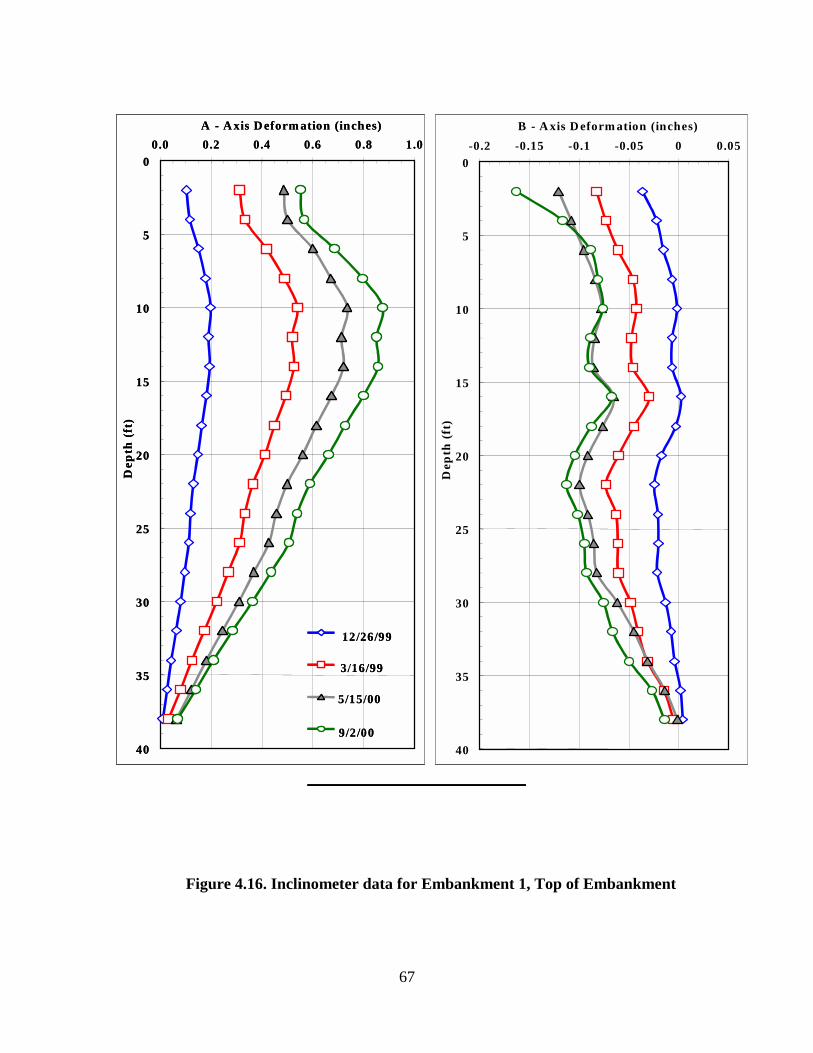
67
0
5
10
15
20
25
30
35
40
0.0 0.2 0.4 0.6 0.8 1.0A - A xis D eform ation (inches)
Dep
th (
ft)
Series1
Series2
Series3
Series4
12/26/99
3/16/99
9/2/00
5/15/00
0
5
10
15
20
25
30
35
40
-0.2 -0.15 -0.1 -0.05 0 0.05B - A xis D eform ation (inches)
Dep
th (
ft)
0
5
10
15
20
25
30
35
40
0.0 0.2 0.4 0.6 0.8 1.0A - A xis D eform ation (inches)
Dep
th (
ft)
Series1
Series2
Series3
Series4
12/26/99
3/16/99
9/2/00
5/15/00
0
5
10
15
20
25
30
35
40
0.0 0.2 0.4 0.6 0.8 1.0A - A xis D eform ation (inches)
Dep
th (
ft)
Series1
Series2
Series3
Series4
12/26/99
3/16/99
9/2/00
5/15/00
0
5
10
15
20
25
30
35
40
-0.2 -0.15 -0.1 -0.05 0 0.05B - A xis D eform ation (inches)
Dep
th (
ft)
Figure 4.16. Inclinometer data for Embankment 1, Top of Embankment

68
0
5
10
15
20
25
30
-1.0 -0.8 -0.6 -0.4 -0.2 0.0
A - Axis Deformation (inches)
Dep
th (f
t)
Series1
Series2
Series3
Series4
12/26/99
3/16/99
9/2/00
5/15/00
0
5
10
15
20
25
30
-0.1 -0.05 0 0.05
B - Axis Deformation (inches)
Dep
th (f
t)
0
5
10
0
5
10
15
20
25
30
-1.0 -0.8 -0.6 -0.4 -0.2 0.0
A - Axis Deformation (inches)
Dep
th (f
t)
Series1
Series2
Series3
Series4
12/26/99
3/16/99
9/2/00
5/15/00
0
5
10
15
20
25
30
-0.1 -0.05 0 0.05
B - Axis Deformation (inches)
Dep
th (f
t)
15
20
25
30
-1.0 -0.8 -0.6 -0.4 -0.2 0.0
A - Axis Deformation (inches)
Dep
th (f
t)
Series1
Series2
Series3
Series4
12/26/99
3/16/99
9/2/00
5/15/00
15
20
25
30
-1.0 -0.8 -0.6 -0.4 -0.2 0.0
A - Axis Deformation (inches)
Dep
th (f
t)
Series1
Series2
Series3
Series4
12/26/99
3/16/99
9/2/00
5/15/00
0
5
10
15
20
25
30
-0.1 -0.05 0 0.05
B - Axis Deformation (inches)
Dep
th (f
t)
Figure 4.17. Inclinometer data for Embankment 1, Bottom of Embankment
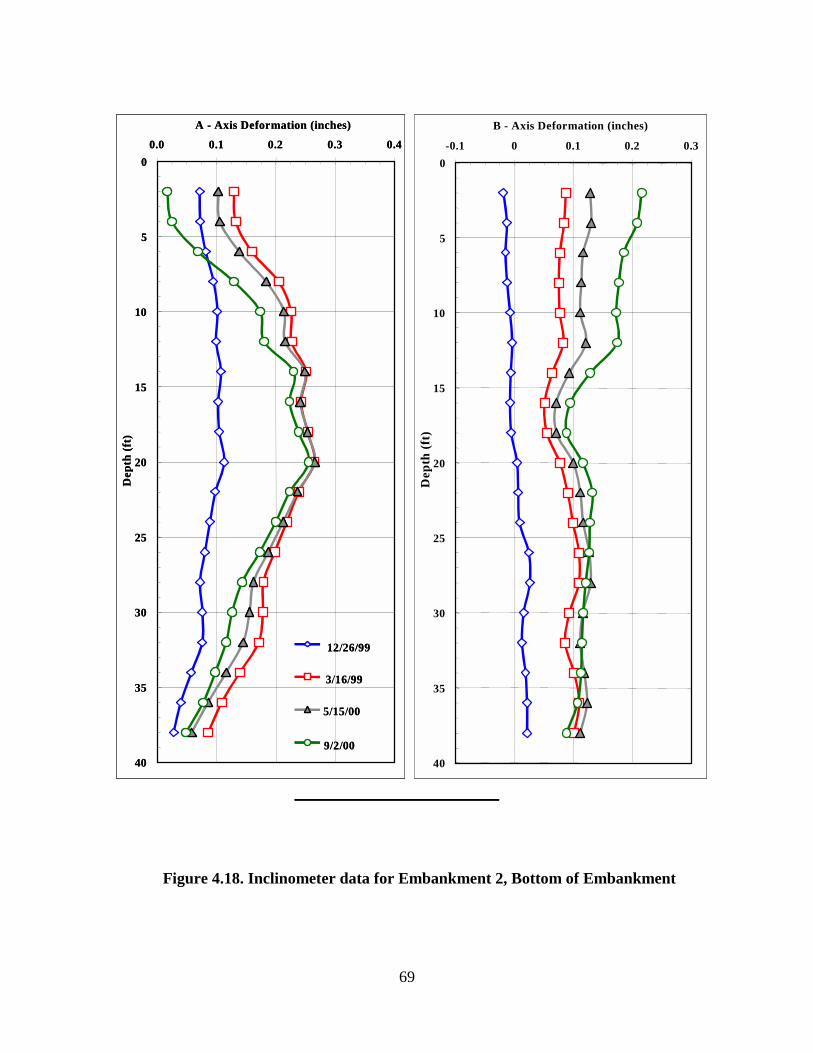
69
0
5
10
15
20
25
30
35
40
0.0 0.1 0.2 0.3 0.4
A - Axis Deformation (inches)D
epth
(ft)
Series1
Series2
Series3
Series4
12/26/99
3/16/99
9/2/00
5/15/00
0
5
10
15
20
25
30
35
40
-0.1 0 0.1 0.2 0.3
B - Axis Deformation (inches)
Dep
th (f
t)
0
5
10
15
20
25
30
35
40
0.0 0.1 0.2 0.3 0.4
A - Axis Deformation (inches)D
epth
(ft)
Series1
Series2
Series3
Series4
12/26/99
3/16/99
9/2/00
5/15/00
0
5
10
15
20
25
30
35
40
0.0 0.1 0.2 0.3 0.4
A - Axis Deformation (inches)D
epth
(ft)
Series1
Series2
Series3
Series4
12/26/99
3/16/99
9/2/00
5/15/00
0
5
10
15
20
25
30
35
40
-0.1 0 0.1 0.2 0.3
B - Axis Deformation (inches)
Dep
th (f
t)
Figure 4.18. Inclinometer data for Embankment 2, Bottom of Embankment
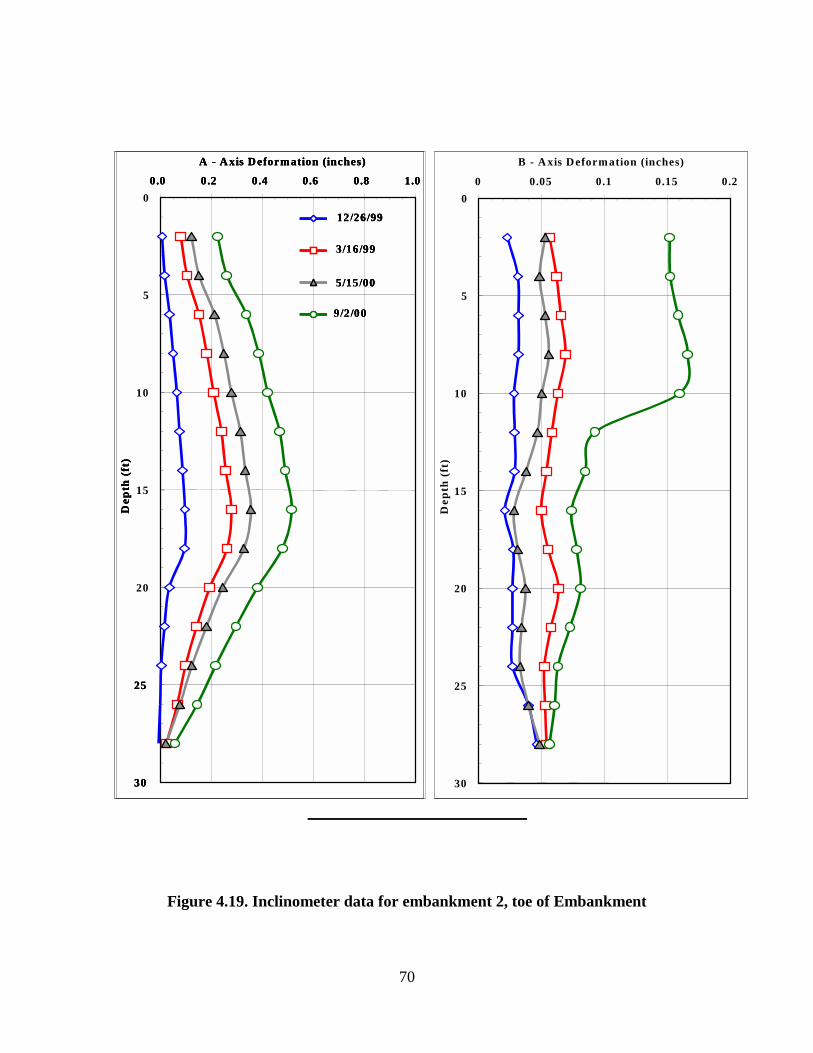
70
0
5
10
15
20
0
5
10
15
20
25
30
0.0 0.2 0.4 0.6 0.8 1.0
A - A xis Deformation (inches)
Dep
th (
ft)
Series1
Series2
Series3
Series4
12/26/99
3/16/99
9/2/00
5/15/00
0
5
10
15
20
25
30
0 0.05 0.1 0.15 0.2
B - A xis Deformation (inches)
Dep
th (
ft)
25
30
0.0 0.2 0.4 0.6 0.8 1.0
A - A xis Deformation (inches)
Dep
th (
ft)
Series1
Series2
Series3
Series4
12/26/99
3/16/99
9/2/00
5/15/00
25
30
0.0 0.2 0.4 0.6 0.8 1.0
A - A xis Deformation (inches)
Dep
th (
ft)
Series1
Series2
Series3
Series4
12/26/99
3/16/99
9/2/00
5/15/00
0
5
10
15
20
25
30
0 0.05 0.1 0.15 0.2
B - A xis Deformation (inches)
Dep
th (
ft)
Figure 4.19. Inclinometer data for embankment 2, toe of Embankment

71
4.6 Monitoring of Strength Gain/Loss
In order to monitor the integrity of the embankments over time, CPT soundings
were taken at various intervals throughout the course of the project. The details of the
equipment used and the data obtained from the different readings are given in Appendix
C.4.
After embankment construction was completed, CPT soundings were taken at
various times to determine whether or not the material experienced a gain or loss in
strength over time. Soundings were conducted one month, three months, six months, and
12 months after the embankment construction was completed. The CPT soundings were
conducted on top of each of the embankments in order to achieve the maximum possible
penetration depth. For comparison purposes, soundings were taken from numerous
locations within each embankment. These locations were within a 15-foot diameter region,
shown in figure 4.15. The rationale for the 15-foot diameter region is the disturbed soil
zone left by each penetration. To avoid the possibility of a CPT sounding being influenced
by a previous test, the 15-foot diameter region was implemented.
The CPT was set-up specifically to measure tip resistance and side friction, since
the location of the water table was well below the base of the embankments. Appendix C
contains all of the CPT results, and individual CPT plots for the respective embankments at
various times.
Analysis of CPT Results
For the purpose of monitoring the integrity of the SDM over time, the information
concerning both the soil classification and soil profiling was not required. However, the
CPT tip resistance and friction ratio data indicate that the material may be consistently
classified as a silt mixture (clayey silt to sandy silt). This was consistent with the results of
laboratory tests.
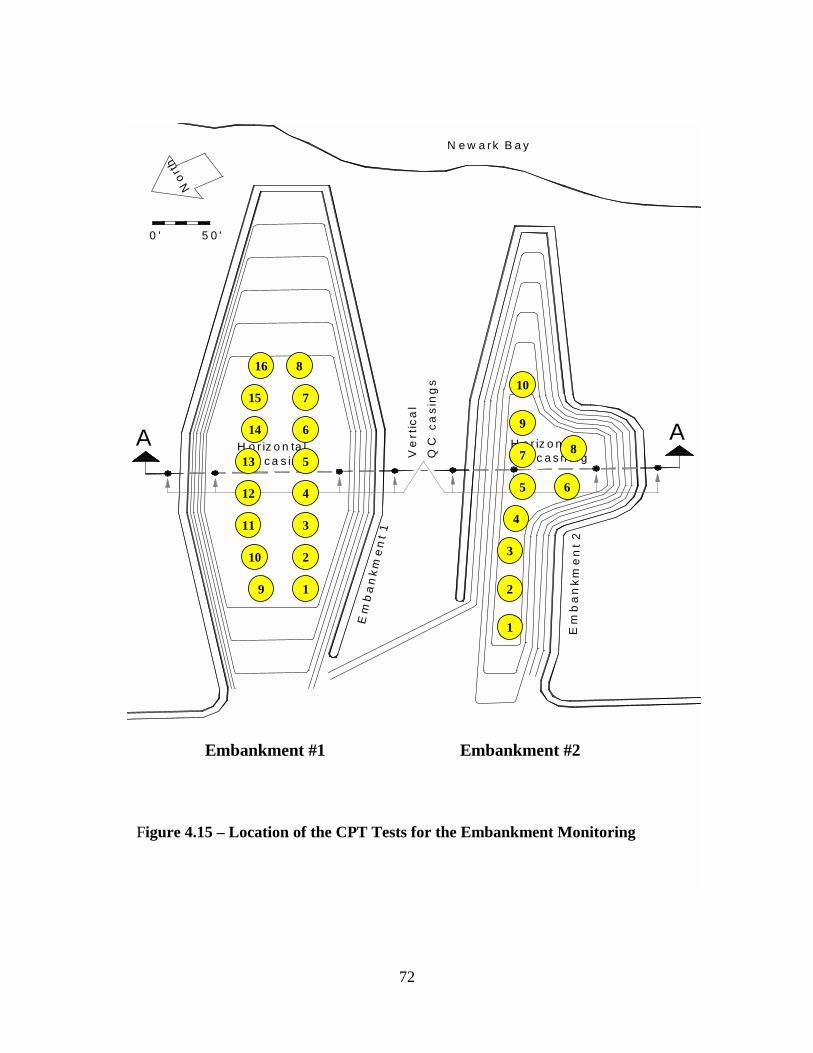
72
Ve
r tic
al
QC
ca
s in
gs
0 ' 5 0 '
N e w a r k B a y
Nor
th
Em
ba
nkm
en
t 2
H o r iz o n ta lQ C c a s n in g
H o r iz o n ta lQ C c a s in g
F ig . 1 1 T h e s c h e m a tic o f e m b a n k m e n ts a n d in s ta lle d c a s in g s
7 .5 '
2 5 .0 '2 6 .0 '
Em
ba
nkm
en
t 1
A A
S e c tio n A -A
1
2
3
4
5
6
710
816
15
14
13
12
11
10
9
9
7 8
65
4
3
2
1
Embankment #1 Embankment #2
Figure 4.15 – Location of the CPT Tests for the Embankment Monitoring

73
The CPT tip resistance provides an excellent parameter for measuring strength gain
or loss. To monitor strength gain/ loss, CPT soundings were conducted for a period of one
year. Figure 4.16 presents a comparison between the CPT soundings at one month and the
soundings at twelve months. For all of the comparative plots, the one-month CPT is
represented by a black line, and the comparative time data are represented by the gray line.
As indicated in Figure 4.16 and in the data in Appendix C.4, there is no evidence of a
significant strength gain or loss in the embankment. This was true for all of the locations
at each embankment.
Figure 4.16
Sounding Name: Location #1 Depth to Water: Client: OENJ/NJDOT
Date: Oct. - Oct. Comparison (1 Year) Project: Dredge Embankment #2 Project Location: Elizabeth, NJ
Soil
Profile
0
1
2
3
4
5
6
7
8
9
10
11
12
13
14
15
0 25 50 75 100 125Tip Resistance (tsf)
Dep
th (f
t)
0
1
2
3
4
5
6
7
8
9
10
11
12
13
14
15
0 1 2 3 4
Local Side Friction (tsf)
Dep
th (f
t)
0
1
2
3
4
5
6
7
8
9
10
11
12
13
14
15
0 3000 6000 9000
Su (psf) - Nk = 15
Dep
th (f
t)
0
1
2
3
4
5
6
7
8
9
10
11
12
13
14
15
02468
Friction Ratio (%)
Dep
th (f
t)
74
In addition, for comparison purposes, the results of the SPT soundings were
measured against the un-drained shear strength (SU) of the material. The Nkt method, as
described in Appendix C.4, was used to determine the un-drained shear strength of the
material. An Nkt value of 15 was used for the analysis and the results were in good
agreement with the Unconsolidated, Undrained, Triaxial shear strength results determined
in the laboratory (see Appendix C). Therefore, it can be concluded, based on the tip
resistance and the un-drained shear strength analyses, that the SDM, once placed,
experiences no significant loss or gain in strength over the course of one year.
75
5. CONCLUSIONS
As part of a project to evaluate the potential for beneficially re-using SDM in
transportation applications, two embankments were successfully constructed at the OENJ
Elizabeth site using SDM as construction material. The project had two main objectives:
1) to assess the feasibility of using SDM as structural fill material for the construction of
roadway embankments, and 2) to evaluate the geotechnical characteristics of SDM, i.e.,
workability, strength and durability, under service loads. The project began in the spring
of 1999 and was completed by October 2000.
The project consisted of field evaluations and laboratory testing. The field
component consisted of: 1) work related to the design of the embankment foundations, and
2) field monitoring of the construction and performance of the embankments for
approximately one year after construction had been completed. The laboratory testing,
which began before field construction and was not completed until January of 2001,
assessed the strength, compressibility, workability and durability of SDM according to
ASTM and AASHTO standards.
Overall, the geotechnical properties of SDM were satisfactory for the construction
of the two embankments. Similarly, both the analysis and subsequent field monitoring
indicated that the stability of the embankment slopes was satisfactory. There were,
however, concerns about the durability of the material under service conditions. The
laboratory freeze-thaw and wet-dry cycles indicated that SDM is susceptible to a loss of
material integrity under these conditions.
Following is a summary of conclusions and recommendations for the different
phases of the project.

76
5.1 Embankment Foundation Investigation
Both embankments were placed on consecutive layers of refuse fill, 19’ to 23’ of
peat and elastic silt, and 5’ to 10’ of sand. The initial settlement estimates indicated
excessive settlements; up to 21’’ for Embankment 1, and up to 17” for Embankment 2,
each with the potential for differential settlements.
The results of the field settlement monitoring program, which included settlement
plates, horizontal inclinometers and a magnetic extensometer, showed settlement values of
approximately 15.6” for Embankment 1, and 15.8” Embankment 2. The extensometer data
showed no noticeable settlement within the SDM fill and thus attributed most of the
settlement to foundation soil. Settlement plate data indicated minimal differential
settlement for both embankments, and thereby demonstrated the geotechnical benefits of
using a geosynthetic fabric at the interface of the SDM and foundation soil.
In conclusion, SDM fills, with the size and specifications of this project, can be
successfully constructed on marginal foundation soils if proper soil improvement is
performed prior to the placement of such fills. Placement of a geosynthetic fabric is one
option that worked successfully for this project, but other improvement techniques, such as
preloading or deep dynamic compaction, could also have been considered.
77
5.2 Laboratory Investigation
The objectives of the laboratory investigation were two-fold: 1) to determine the
material strength properties of the CDM and its potential for use in the construction of the
proposed embankments, and 2) to determine the geotechnical properties of the CDM to
assess its potential for use in high volume applications, such as fills, embankments, and
roadway base materials. In order to realistically determine the behavior of CDM under
field conditions, the selection of admixtures, the curing time and the placement process
used in laboratory testing approximated, to the extent possible, field operations The
laboratory investigations mainly consisted of standard ASTM and AASHTO tests for
classification, strength (including resilient modulus evaluation under dynamic loads),
compressibility and durability.
The rationale and the methodologies used for selection of admixtures, curing time
and placement process followed the sequence of field operations in order to determine the
behavior of CDM in a more realistic manner. A detailed account of the preparation of test
samples and on the laboratory testing is presented in Section 3 of this report. Following is
a summary of the results.
Classification
The SDM used in this project is characterized as elastic silt (MH) with a moderate
organic content (8% average). It also contains low percentages of fine sand and clay.
With respect to the Plasticity Chart, SDM lies below the A-line and to the right of the
LL=50 line.
Compaction
The moisture content of dredged material is highly variable, however RDM is, on
average, one third solids and two-thirds liquid. In order to solidify the dredged material for
78
structural fills, it is recommended that pozzolanic admixtures be added to increase
workability and improve engineering properties.
Compaction greatly improved the engineering properties of SDM. A comparison
between samples compacted to 85% and 90% of their maximum dry density showed a
considerable increase in shear strength. Moreover, samples amended with 4% Portland
cement and compacted to 85% of their maximum dry density had shear strength sufficient
for embankment slope stability. A slope stability analysis indicated safety factors were all
above 2, even for 1V: 1.5H slopes. Inclinometers reading also indicated only minimal
movement or instability within the slopes.
Shear Strength
The addition of admixtures produced no significant change or trend in the
magnitude of frictional angle, ϕ. A general comparison of SDM with typical soil-cement
and cement-modified soils indicated that for the same amount of cement, and approximate
compaction effort (90% of optimum for SDM, and at optimum for soil-cement) soil-
cement or cement-modified soils are denser than SDM, have a slightly a higher friction
angle, and have a much higher cohesion intercept under triaxial shear conditions. One
reason for the reduced cohesion of SDM is that, during the process of remolding for
compaction, parts of cementitious bonds between hydrated cement particles and the soil
matrix become broken. Unlike typical soil-cement or cement-modified soils where
hydration and curing take place immediately after compaction, and where compaction prior
to curing causes soil grains to be forced into direct contact with the cement grains, the
sequence of sample preparation in the case of SDM is reversed and some of the previously
gained strength is lost during the break-up upon compaction.
Temperature had a major effect on the curing process of SDM. At temperatures
below 40°F, pozzolanic reactions slow down and, as a result, the rate and amount of
moisture reduction and strength gain became insignificant. Therefore, it is recommended
79
that SDM be placed during warm seasons (e.g., April through October in New Jersey).
Adding high percentages of Portland cement to reduce the effects of low temperatures is
not economically feasible, as the additional cement would not result in significant
improvements in engineering properties.
Resilient Modulus
Resilient modulus measures the strength of sub-grade soils under dynamic
vehicular loads. The resilient modulus values for all of the samples tested compared well
with three sub-grade soils that are currently under New Jersey roadways. The test results
indicated that SDM compares well with the sub-grade soil used on Route 23 and that SDM
has a slightly higher modulus than the sub-grade soils in Route 206 and Route 295.
Consolidation
The compression index (Cc) values for SDM ranged from 0.22 to 0.9. In general,
the compression index did not exceed 0.5 for any of the samples, once the samples had
been compacted to 81%. Therefore, a Pc of 2 tsf or more should be expected. The
compression ratio (CR =Cc/1+e0) varied from 0.085 to 0.24. This value did not exceed 0.19
for samples compacted to 83% or above.
Based on the compaction testing, and on subsequent field-testing, it can be
concluded that SDM embankments up to 30 feet in height could be constructed with only
minimal settlement within the SDM fill. As demonstrated, settlement is primarily a
function of the foundation soil and its consolidation characteristics.
Permeability
The permeability of the compacted SDM was typically less than 10-7 cm/sec. On
the wet side of the optimum, additional compaction further reduced the permeability of

80
SDM. Additional fly ash also helped in reducing permeability. Based on this study, SDM
could be used for impermeable caps in landfills or other contaminated sites.
Swell Potential
The strain or swell percentage was not significant for any of the samples tested.
The strain values ranged from 0.1% to 1.2% , with an average of 0.6%. This magnitude of
volume change is considered to be low and, therefore, not detrimental to adjacent
structures. The maximum strain (1.2%) was recorded for the samples amended with 8%
Portland cement and 10% fly ash. The swell pressure, however, was high for samples
compacted to 94% or higher of their maximum dry density with moisture contents on the
dry side of optimum. For these samples, the average swell pressure was 1.005 tsf. The
average for one-month old samples was slightly higher, at 1.34 tsf, with average strain of
1.1%. Although strains were not high for any of the samples tested, the swell pressure
generated was moderate. For SDM that was mixed with 8% Portland cement and
compacted to 95% of its maximum dry density, the swell pressure was measured as high as
1.96 tsf. However, considering low associated strains, SDM would not have any
detrimental effect on adjacent structures.
However, for samples compacted on the wet side of optimum moisture content,
much lower swell pressures and strains were measured. The average swell pressure for
these samples was 0.14 tsf, and the average strain 0.3%.
Durability
The three different recipes of SDM were subjected to durability (freeze-thaw) tests.
The results from these tests indicate that SDM is extremely susceptible to frost (several
times more susceptible than natural clay) and should be placed below frost line. The three
SDM recipes were also subjected to wet-dry tests to evaluate the material’s potential for
shrinkage. Based on the wet-dry tests, proper soil cover needs to be provided at all times

81
to minimize strength loss and erosion. Compacting SDM at moisture contents below the
shrinkage limit would minimize the potential for tensile cracks and thereby minimize any
further strength loss in the material.
5.3 Field Investigation
The main objective of the field investigation was to monitor the integrity of the
embankments over a period of one year and to record changes in settlement, horizontal
deformation, and strength gain/loss over time. The filed investigation also included testing
and evaluation of Humboldt Stiffness Gauge and Clegg Hammer device as compaction
control tools for large-scale placement of SDM.
Field Determination of Cement Content
SDM samples were collected during processing and tested for cement content,
which ranged from 4% to 20%. Although the target cement content was 8%, samples with
4% were laboratory tested to determine how the SDM would behave if the target cement
content was not achieved. The overall engineering characteristics of the mix were
satisfactory for road embankment applications. However, it is recommended that the
stabilization plant be better instrumented to more precisely control percentages of additives
mixed with the RDM.
Field Compaction Control
Field compaction tests were performed in order to determine the dry density of in-
situ SDM amended with Portland cement. The nuclear density gauge is commonly used
for density control. For cement-stabilized soils, however, the nuclear gauge underestimates
moisture contents resulting in overestimating dry density and strength parameters. For this
82
study in addition to nuclear gauge, Humboldt Stiffness Gauge (HSG) or the Clegg Impact
Hammer to determine dry density was evaluated. The objective was to determine whether
these tests could provide rapid and accurate estimates of SDM’s moisture content and dry
density.
The results indicate that the HSG measured compaction characteristics accurately,
provided the samples were within a specific range of moisture content for which the HSG
had been calibrated. If the moisture content fell outside of this range, significant deviation
was observed. Therefore it is recommended that, prior to using the HSG in the field,
samples of SDM with a wide range of densities and moisture contents should be prepared.
The HSG should be calibrated for all of these pre-determined densities and moisture
contents. It is also recommended that the manufacturer’s formula for calculating density
be overlooked, as the empirical factors in the formula were calculated for conventional
structural fill (sandy fill). These factors should be recalculated for SDM.
The data analysis from CIH test was inconclusive and no specific recommendations
can be made regarding the use of this device in SDM applications.
Settlement and Lateral deformation Monitoring
The field settlement-monitoring program consisted of installing settlement plates,
horizontal inclinometers and extensometers for measuring vertical deformations in
Embankments 1 and 2. The results of the monitoring program and an analysis of the data
are presented in Chapter 4. For both embankments, the measured vertical settlement was
in the range of 15 to 16 inches from settlement plates, and 12 to 14 inches from horizontal
inclinometers (transverse centerline). These were lower than the predicted values estimated
from initial foundation investigation study, which ranged from 17 to 21 inches for
embankments, 1 and 2, respectively. The differential settlement was minimal, for both
cases. It ranged from 1 to 2 inches, thus showing the effectiveness of placing geosynthetic
fabric at the interface of the SDM fill and the foundation soil. The extensometer reading
83
and settlement plate data indicated negligible vertical deformation within the SDM itself,
which demonstrates that the foundation soil is the primary cause of vertical settlement. .
Vertical inclinometer ducts were installed to monitor the lateral movement of the
embankments. The inclinometer readings indicate that lateral deformations were
negligible for both embankments and were of no concern. The maximum lateral
deformation (approximately 0.83") was at the top of Embankment 1 and had no impact on
the stability of the slope.
Strength Gain/Loss Monitoring
In order to monitor the integrity of the embankments over time, a series of CPT
soundings were taken at various intervals during the course of the project. The monitoring
data were used to provide evidence of either a gain or loss of strength over time. The
CPT soundings were conducted on top of each of the embankments in order to achieve the
maximum possible penetration depth.
Based on the CPT soundings, there was no significant strength loss or gain within
the embankments over the course of one year. This was observed for all locations on
both embankments. In addition, for comparison purposes, the results of the SPT soundings
were measured against the un-drained shear strength (SU) of the material. Based on these
comparisons, it can be concluded that the SDM, once placed, experiences no significant
loss or gain in strength over the course of one year.
This was expected due to the fact that the SDM had been disturbed during the
process of excavation and transfer to the embankment sites from the holding sites where
the material had achieved most of its strength gain as a result of cement addition. Cement
treated soils and naturally cemented soils are sensitive to disturbance, as shown by
Mitchell (1983), and the SDM that was compacted on these locations had already gained
its strength prior to partial break-up and movement to the site.

84
It is therefore, recommended that in future applications, SDM processing and
placement follow these steps: 1) Add enough cement, lime, cement kiln dust, fly-ash
and/or other admixtures that are needed for workability and stabilization, and place the
SDM on designated holding or storage sites for potential beneficial re-use. 2) Following
the reduction of water content to appropriate levels, move the material to the designated
project site, and then add the appropriate cement (or other admixtures) needed for strength
prior to compaction. In other words, the placement and compaction procedure should be
similar to the process used in soil-cement or cement-modified soils applications.
6.0 RECOMMENDATIONS
The work performed in this demonstration project needs to be continued to include the
evaluation of the test structure under field dynamic loads, and especially evaluate the effect
of moisture on durability under field conditions. It is, therefore, recommended that an
additional demonstration project incorporating SDM with different admixtures and
coverage designs be initiated, similar to those performed for soils mixed with shredded
tires (Humphrey, 1993). This project should include at least 1000 linear feet of low traffic
roadway with a minimum depth of six feet of SDM to be tested and monitored under
vehicular load. The results of the study presented here and those to be determined under
vehicular loads could provide the basis for practical usage of SDM in roadway
applications.
85
7. REFERENCES Balmar, G. G., “Shear Strength and Elastic Properties of Soil-Cement Mixtures Under Triaxial Loading,” PCA, Bulletin# D32, 1958. Clough, G. W., Sitar, N., Bachus, R. C., and Rad, N., “ Cemented sand under Static Loading,” JGED, ASCE, Vol. 107, No. GT6, 1981, pp. 799-817. Cotton, M. D., “ Soil-Cement Technology – A Resume,” Journal of the PCA research and Development laboratories, Vol.4, No.1, 1962, pp. 13-21. Holtz, R. D., and Kovacs, W. D., “An Introduction to Geotechnical Engineering,” Prentice-Hall, 1981. Humphrey, D. N. and Eaton, R.A., “Tire Chips as Insulation Beneath Gravel Surface Roads.” Cold regions Research and Engineering Laboratory, Hanover, New Hampshire, 1993. Kezdi, A., “Handbook of Soil Mechanic,” VEB Verlag fur Bawsen, Berlin, 1970. Landva, A., and Clark, J. I., “Geotechnics of Waste Fills,” ASTM STP 1070, 1990, pp. 86-106. Morris, D. V., and Woods, C. E., “Settlement and Engineering Consideration in Landfill and Final Cover Design,” ASTM STP 1070, 1990. Oweis, I.A., and Khera, R. P., “Geotechnology of Waste Management,” PWS Publishers, 1998. Uzan, J., “Characteristics of Granular Material, “TRB record 1022, TRB, National Research Council, Washington, D. C., 1985, pp. 52-59. Van Riessen, G. J., and Hansen, K., “Cement-Stabilized Soil for Coal retaining Berms,” ASCE, Geotechnical STP # 30, 1992, pp. 981-992.

86

APPENDIX E
Air Study
APPENDIX E-1
Report by Dr. Clifford P. Weisel and Dr. Paul J. Lioy, University of Medicine and Dentistry of New Jersey. for Sub-Contract Agreement for OENJ / NJDOT
Roadway Embankment Pilot Project dated January 5, 2000
Report to
Sadat Associates, Inc.
for Sub-Contract Agreement for
OENJ/NJDOT Roadway Embankment Pilot Project
Prepared by
Clifford P. Weisel, Ph.D. Paul J. Lioy, Ph.D. University of Medicine and Dentistry of New Jersey Environmental & Occupational Health Sciences Institute 170 Frelinghuysen Road Piscataway, NJ 08854 May 16, 2000

1
PURPOSE
Area and personal samples were collected during the placement of dredge material at
ONEJ Metromall roadway embankment test construction site in Port Elizabeth, NJ during late
April/May 1999 (spring sampling) and June/July 1999 (summer sampling) to ascertain if the use
of contaminated dredge material would potentially lead to exposing the surrounding community
and workers to elevated airborne levels of dust, heavy metals, polynuclear aromatic
hydrocarbons (PAH), pesticides or polychorobiphenyls (PCB).
METHODOLOGY
Personal samples were collected from workers operating heavy equipment (bulldozers,
dump trucks and rollers), supervisors and workers on the ground manipulating the soil/sludge
manually. Specific individuals wore samplers that were analyzed for priority trace metals
(NIOSH Method 7300), priority pesticides and polychorobiphenyls (NIOSH Method 5503) and
polynuclear aromatic hydrocarbons (NIOSH Method 5506/5515), during an entire working day,
exclusive of lunch. Respirable dust (NIOSH Method 0600) was sampled for two hours based on
sampling volume limitation of NIOSH Method 0600. The personal air samples were analyzed
by Princeton Analytical Laboratories, Princeton, NJ. Area samples were collected during active
construction between 7am and 4pm using high volume area samples (EPA 1983, NJ DEP
personal communication). During the spring sampling period, upwind and downwind area filter
samples were collected for five or six days using a single quartz fiber filter (Schleicher and
Schuell No. 25, 20x25cm). During the summer sampling period, upwind and downwind quartz
fiber filter, with a polyurethane foam (PUF) plug (0.049 g/cm3 density), and crosswind filter
samples were collected for two or three days. The filter or filter with the PUF backup samples

2
were stored covered with plexiglass sheet while mounted in their holders in a refrigerator or ice
chest containing blue ice between sample collection. This was done to minimize any
contamination or losses of volatile species between sampling. After weighing, the filter was split
into two portions. One portion of the filter and the PUF sample was analyzed for polynuclear
aromatic hydrocarbons using gas chromatography-mass spectrometry and for
polychlorinatedbyphenyls and selected pesticides by gas chromatography with 63Ni electron
capture detector (Franz and Eisenreich 1998; Simcik et al 1998) at the Department of
Environmental Sciences at Rutgers University, New Brunswick, NJ, under the direction of Dr. S.
Eisenreich and the second for metals using a modification of EPA Method 200.8 for Inductively
Coupled Plasma-Mass Spectrometry analysis of metals at the Environmental and Occupational
Health Sciences Institute, Piscataway, NJ, under the direction of Dr. B. Buckley.
The area samplers (Graseby General Metals Works High Volume Samplers, two of which
were borrowed from NJ DEP and all of which are the type used within the NJ DEP ambient air
particulate monitoring network) were placed between 20 and 50 meters from the edge of the
active work area in the designated wind direction relative to the construction site. The wind
direction was ascertained each morning from the meteorological station located on site. If the
wind direction shifted during the sampling day the sample collection was either discontinued for
that day or the samplers were moved to the proper orientation to the wind relative to the
construction site. Most days had a constant wind direction, so no adjustment to the sampling
location was necessary after the initial placement of the sampler. (Appendix A). The flow rates
(nominally between 10 and 30 cubic feet per minute) were checked each day before and after

3
sampling and at other times of the day, using a Magnehelic, which had been calibrated using a
Rootsmeter (EPA 1983).
The personal samplers, except the respiratory-size particle sampler, were placed on the
workers at approximately 7:00 am and returned to the field personal prior to the lunch time
break. The same samplers were replaced on the same workers after lunch and were retrieved at
the end of the work day. The respirable particle sampler was placed on a worker for a two hour
time period when the worker was going to be actively working at the site. All personal air
sample pumps were constant flow pumps (SKC Aircheck or Ametek Model MG-4) were
calibrated before and after sampling to be within the NIOSH specified range using a bubble flow
meter. Nominal flow rates were respirable - 2.2l/m; PAH - 1.9 l/m; elemental 1.9l/m; and PCB
80cc/min. The activity of each person wearing a pump was recorded.
RESULTS
Almost all metals, PCB, pesticides and PAHs were below detection in the personal air
samples (Tables 1- 3). Measurable levels of chromium, lead, thallium, zinc, anthracene,
benzo(e)pyrene, and naphthalene, were obtained but these air concentrations are well below any
occupational standards indicating that no adverse health impact to the workers would be
expected due to the activities performed by the workers. The personal respirable particle levels
were below detection during the spring sampling, but measurable levels were found in the
summer samples (Table 4). Complaints were registered by one of the workers about the high
levels of the dust in the work area. During the summer the soil was dryer resulting in the
generation of greater airborne dust. The respirable air concentrations, however, were below the

4
NIOSH standard and action level. It is recommended that during future activities of the type
encountered by the workers at this site, actions be taken to decrease the airborne dust levels.
One possible and routinely used method is periodically wetting the surface during the day.
The area samples had measurable concentrations of metals, PCBs and PAHs in all of the
samples (Tables 5-7). The area samples had measurable concentrations while the personal
samples did not because of the greater volume of air collected by the high volume area sampler
over several days of sampling at a higher flow rate than the personal samples and the lower
detection limits that could be achieved by analytical procedures used for the high volume area
samples. The same method was used for the respirable dust samples for both the personal and
area samples. The additional metals reported in Table 6a resulted from an unusually stable
response obtained from the hot plasma ICP/MS the day that series of samples were run. On that
day, a series of metals which usually do not meet the quality control criteria for quantification
had quality control criteria within the acceptable range. Thus, they are reported in Table 6a.
More typical responses were obtained when the second set of samples were run, so a smaller
target list of metals are reported. Pesticides were only analyzed in the second set of samples
collected and concentrations are provided for all of the compounds measured by the GC/ECD
method used.
Overall the concentrations measured at the site downwind from the construction was
similar to the concentrations measured at the upwind or crosswind to the sites indicating that the
construction activities were not a major sources of airborne heavy metals, PAHs, and pesticides.
However, while no differences among the sites are evident for the particulate PCBs, the
5
downwind site vapor phase concentrations of PCBs were approximately twice that of the upwind
site. The overall concentrations of the particulate and vapor phase PCBs were of the same order
of magnitude as reported recently in Chicago, also during the summer (Simcik et al 1998) (Table
10).
During the spring, the respirable and total dust samples were actually higher at the
upwind site than at the downwind site, which appears to be counterintuitive. However, a number
of different construction activities were occurring at the OENJ Metromall during this time period
and not just the building of a test roadway embankment. It is likely that the higher dust loadings
at the upwind site were due to these other construction activities near the upwind site and not
associated with the placement of the sludge material occurring site during the spring. During
sampling, the dust from these other construction activities was seen to be blown towards the
sampler that was upwind of the roadway embankment site. The total dust samples were
collected using the high volume sampler for 5 to 6 days while the respirable dust samples were 2
hour low flow samples collected on several of the days next to the total dust sampler. Even with
these two different time frames for collection, the respirable dust samples values were within a
factor of 2 to 4 of the total dust concentrations. The results indicate that a significant portion of
the particulate matter in the air at the construction site was in the respirable size range. During
the sample collection period July 14 to 15, 1999, construction and traffic not associated with the
use of the dredge matter, generating visible air borne dust near the cross wind site A. These
activities resulted in high particulate loadings on the sample collected at cross wind site A, but
high levels were not seen at the other cross wind, downwind or upwind samplers during those
days. Exclusive of the cross wind site A for the July 14 to 15, 1999 sample, little difference was

6
observed among the levels measured at all sites during the summer sampling for all of the
particulate organic compounds and metals.
The target particulate pollutants and vapor phase concentrations measured at the OENJ
Metromall roadway embankment site are similar to concentrations of each pollutant measured
previously or currently in NJ and other locations in the United States (Figure 1, Table 9-11).
(Sweet et al, 1993, Gigliotti, 1999). The results indicate that using the dredge material in the
manner done at the OENJ site has a deminitus effect on the air concentrations of the compounds
measured in this study on the surrounded work place and community environment.
REFERENCES
Cari Lavorgna Gigliotti, Environmental Sciences, APolycyclic Aromatic Hydrocarbons In
The New Jersey Coastal Atmosphere,@ Thesis submitted January, 1999.
EPA, July 1983, APTI Course 435 - Atmospheric Sampling, US Environmental
Protection Agency, Air Pollution Training Institute, MD 20, Environmental Research Center,
Research Triangle park, NC 27711, 1983, EPA 450/2-80-005.
Franz, T.P., and Eisenreich, S., ASnow Scavenging of Polychlorinated Byphenyls and
Polycyclic Aromatic Hydrocarbons in Minnesota@, Environ. Sci. Technol., 1998, 32 (12), 1771-
1778.
Simcik, M..F., Franz, T.P., Zhang, H., Eisenreich, S., AGas-Particle Partitioning of PCBs
and PAHs in the Chicago Urban and Adjacent Coastal Atmosphere: States of Equilibrium@,
Environ. Sci. Technol., 1998, 32 (2), 251-257.

7
Sweet, C.W., Vermette, S.J, ASources of Toxic Trace Elements in Urban Air in Illinois@,
Environ. Sci. Technol., 1993, 27 (12), 2502-2510.

Appendix A
Wind Data for Sample Collection Days

The following four tables provide the dates and time periods that the area samples were collected
during the spring and the summer. The upwind sampler was placed more than 50 meters upwind
and the downwind sampler more than 50 meters downwind of the active work area associated
with the use of the dredge material. However, other truck activity and construction work being
done on site could be closer to the samplers than 50 meters at various time periods. The column
marked >Wind Direction in degrees= is the range of the recorded wind directions by the on site
meteorological station, as provided in the charts in this Appendix. Wind directions of "60E from
the center of the site to the sampler was used to determine that sampler was appropriately place
upwind or downwind of the construction activities being sampled. Short duration wind shifts,
particularly at low wind speeds (<4mph) did not result in changing the sampler location. A
consistent shift in wind direction did. Days that resulted in changing the location of the sampler
are indicated in >Action taken= column. Changes included: stopping the sampling, moving of the
entire sampler and generator, when the wind shift was 90E, or switching the filter heads between
the upwind and downwind sampling pumps, when the wind shift was approximately 180E.
First Pair of Spring Samples Date
Approx. Time of Operation
Wind Direction in degrees
Actions taken if any
4-14-99
10:55-13:30
275-315
4-15-99
8:07-15:48
215-315
4-19-99
7:50-15:05
160-305
4-21-99
8:40-15:20
not available
On site visual observation of wind indicated that no action was needed
4-28-99
8:10-15:10
10-110
Sampler shut off for 1.5 hrs when wind shifted
4-29-99
7:45-15:25
345-60

Second Pair of Spring Samples Date
Approx. Time of Operation
Wind Direction in degrees
Actions taken if any
4-30-99
7:55-15:30
20-120
Moved samplers for wind shift
5-6-99
7:50-10:15
80-250
Wind very light in am so stopped sampling
5-10-99
10:00-15:50
290-20
5-11-99
7:30-15:00
not available
On site visual observation of wind indicated that no action was needed
5-12-99
7:50-14:30
0-140
Sampler shut off when wind shifted
5-13-99
7:55-15:00
45-90
First Set of Summer Samples Date
Approx. Time of Operation
Wind Direction in degrees
Actions taken if any
7-14-99
7:00-17:00
260-330 & 110-160
Upwind & downwind samplers changed when wind shifted
7-15-99
7:00-16:30
250-330 & 120-150
Upwind & downwind samplers changed when wind shifted.
Second Set of Summer Samples Date
Approx. Time of Operation
Wind Direction in degrees
Actions taken if any
7-19-99
7:45-15:10
150-170 with brief excursions above 250
7-20-99
7:00-16:30
25-150
Upwind & downwind samplers changed with wind shift
7-21-99
9:30-14:30
not available
On site visual observation of wind indicated that no action was needed

Appendix B
Blank Values
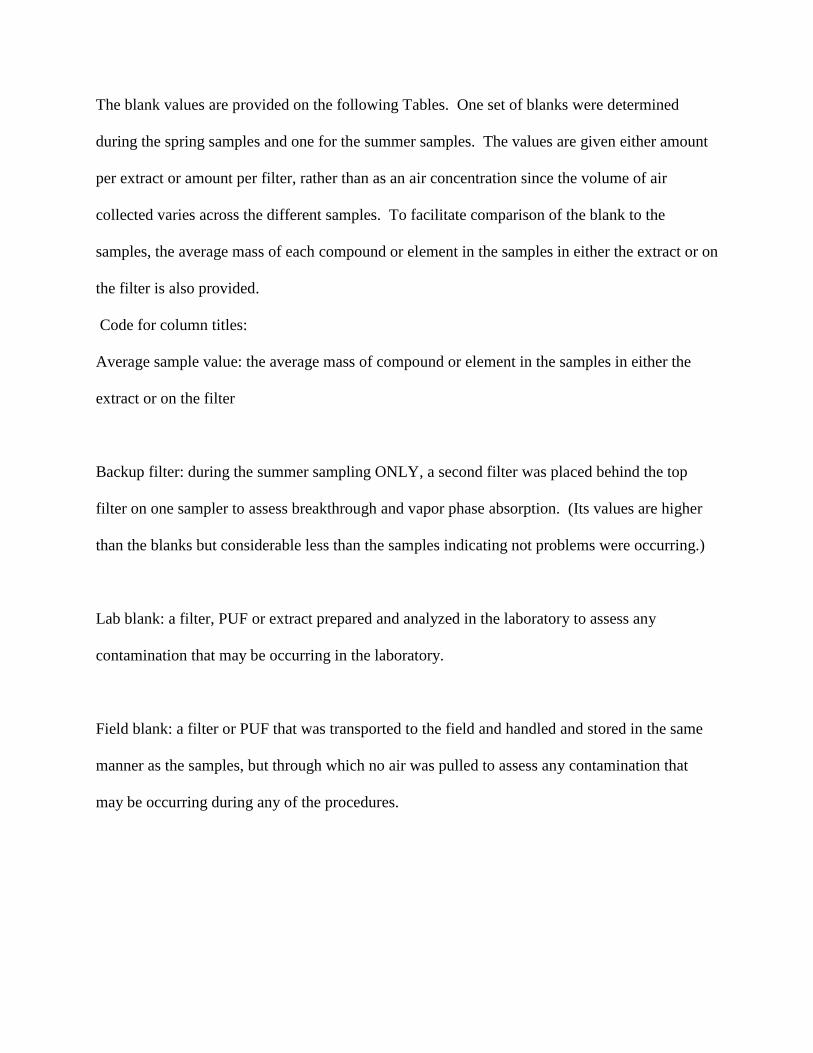
The blank values are provided on the following Tables. One set of blanks were determined
during the spring samples and one for the summer samples. The values are given either amount
per extract or amount per filter, rather than as an air concentration since the volume of air
collected varies across the different samples. To facilitate comparison of the blank to the
samples, the average mass of each compound or element in the samples in either the extract or on
the filter is also provided.
Code for column titles:
Average sample value: the average mass of compound or element in the samples in either the
extract or on the filter
Backup filter: during the summer sampling ONLY, a second filter was placed behind the top
filter on one sampler to assess breakthrough and vapor phase absorption. (Its values are higher
than the blanks but considerable less than the samples indicating not problems were occurring.)
Lab blank: a filter, PUF or extract prepared and analyzed in the laboratory to assess any
contamination that may be occurring in the laboratory.
Field blank: a filter or PUF that was transported to the field and handled and stored in the same
manner as the samples, but through which no air was pulled to assess any contamination that
may be occurring during any of the procedures.


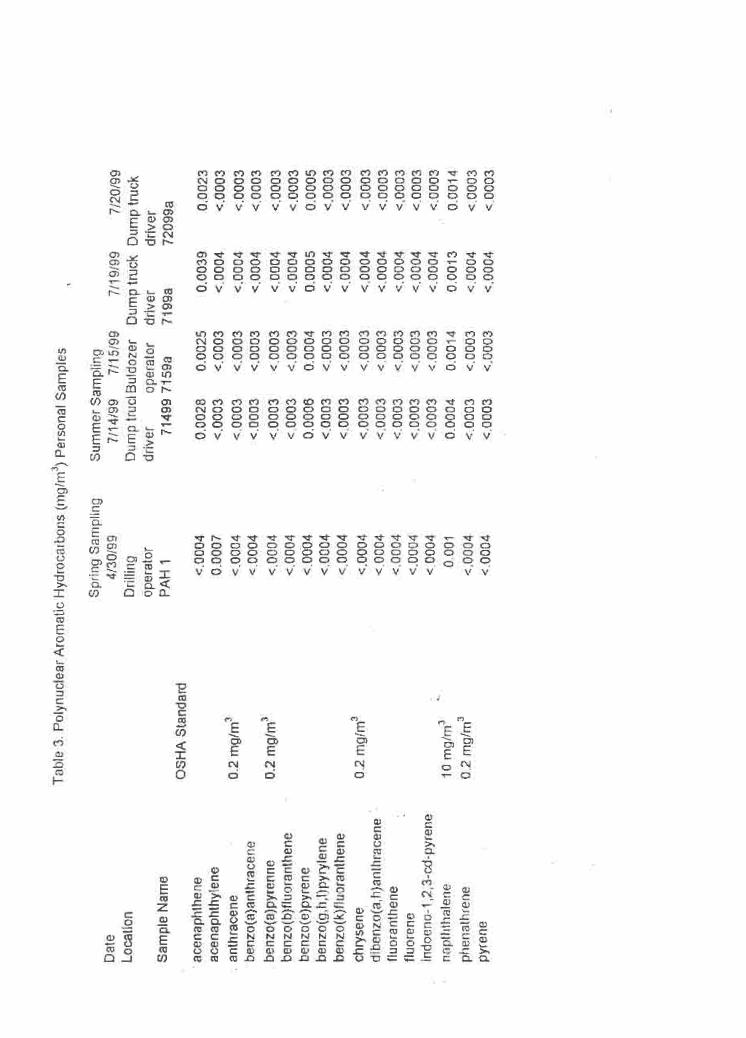

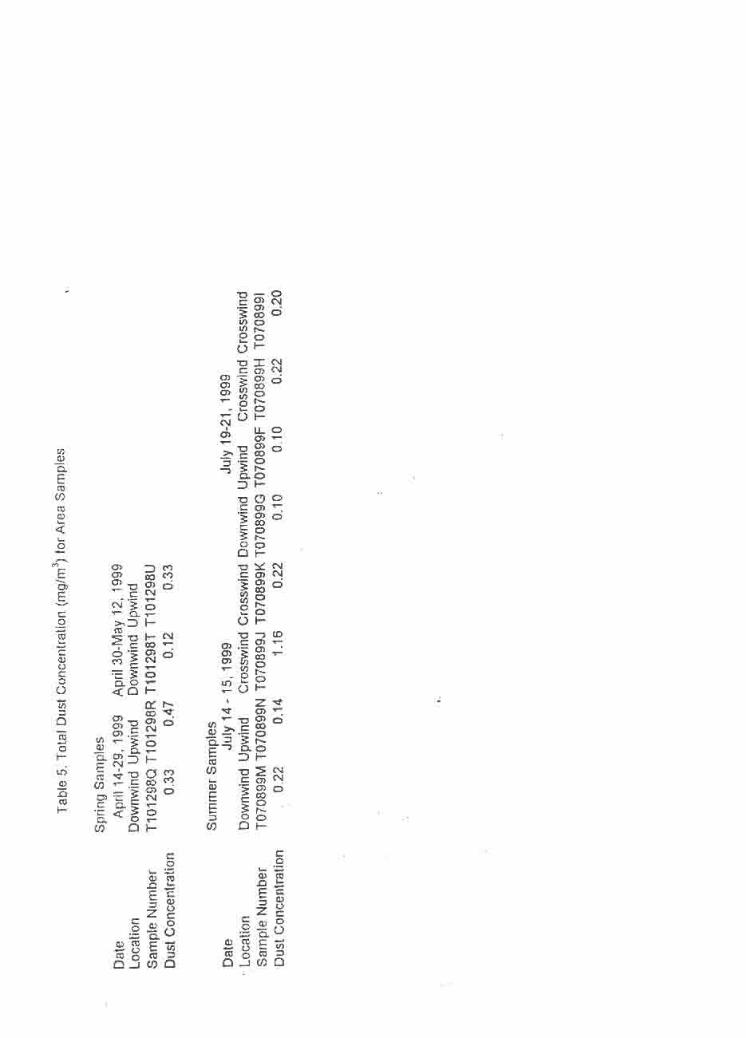


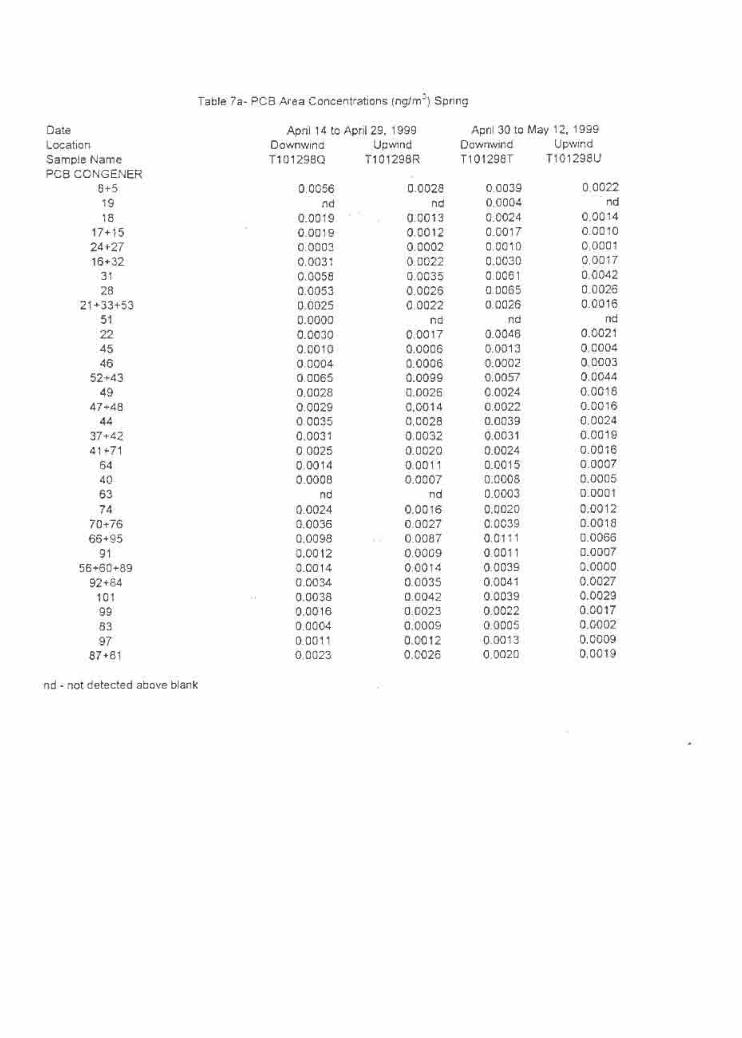
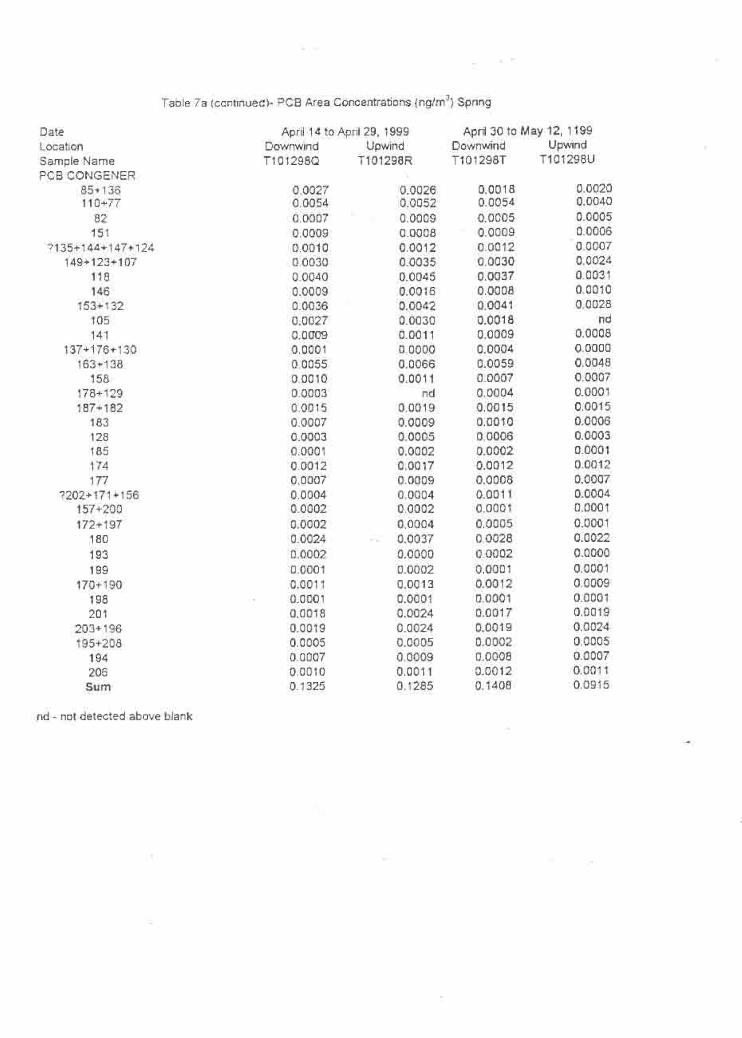


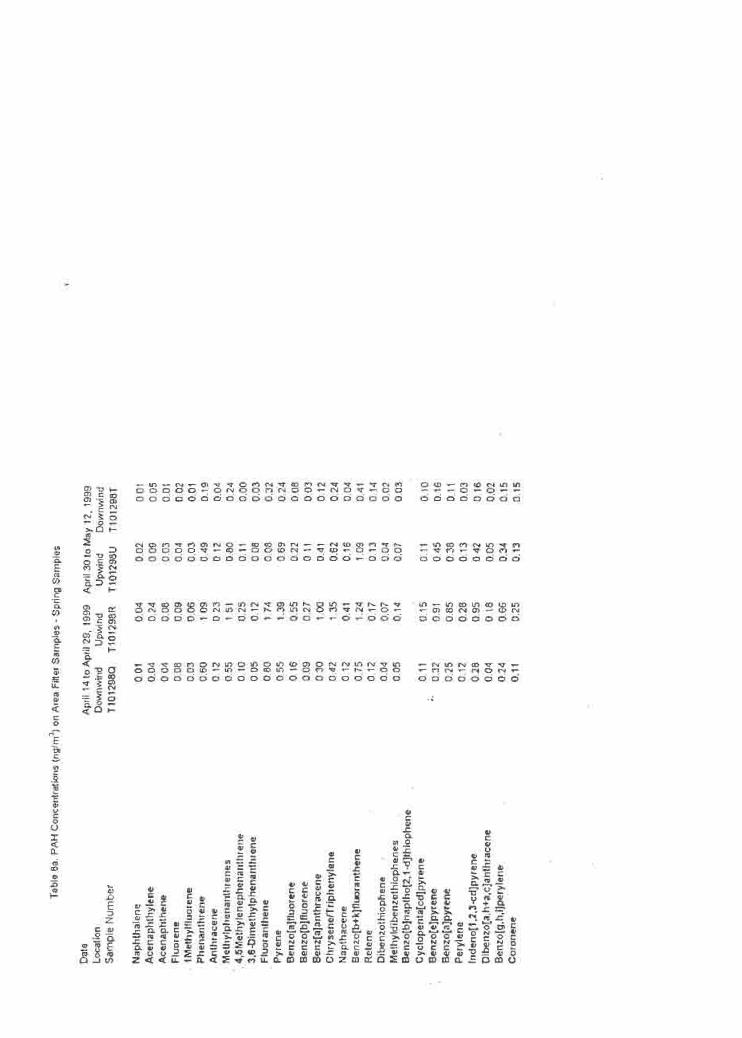


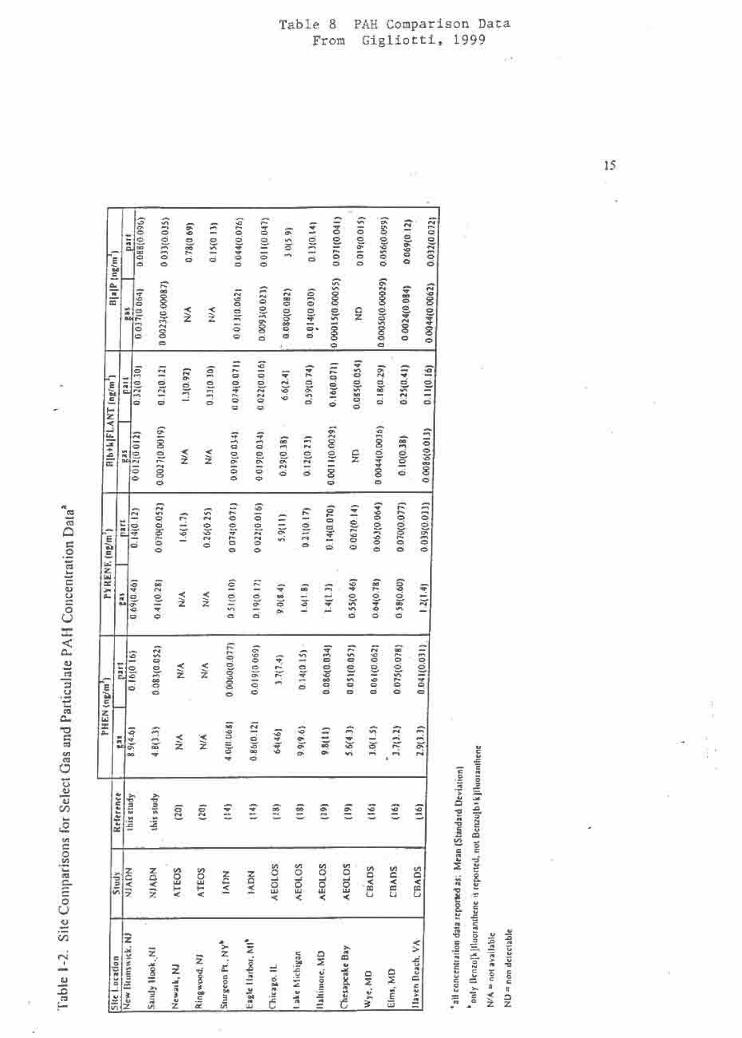

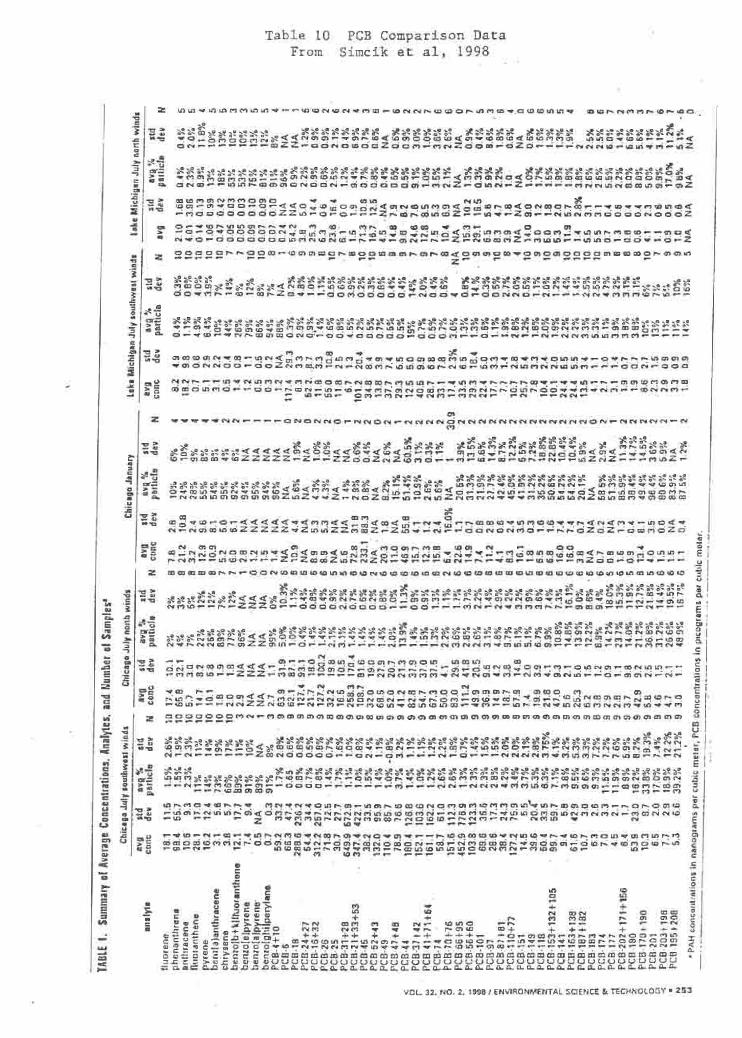


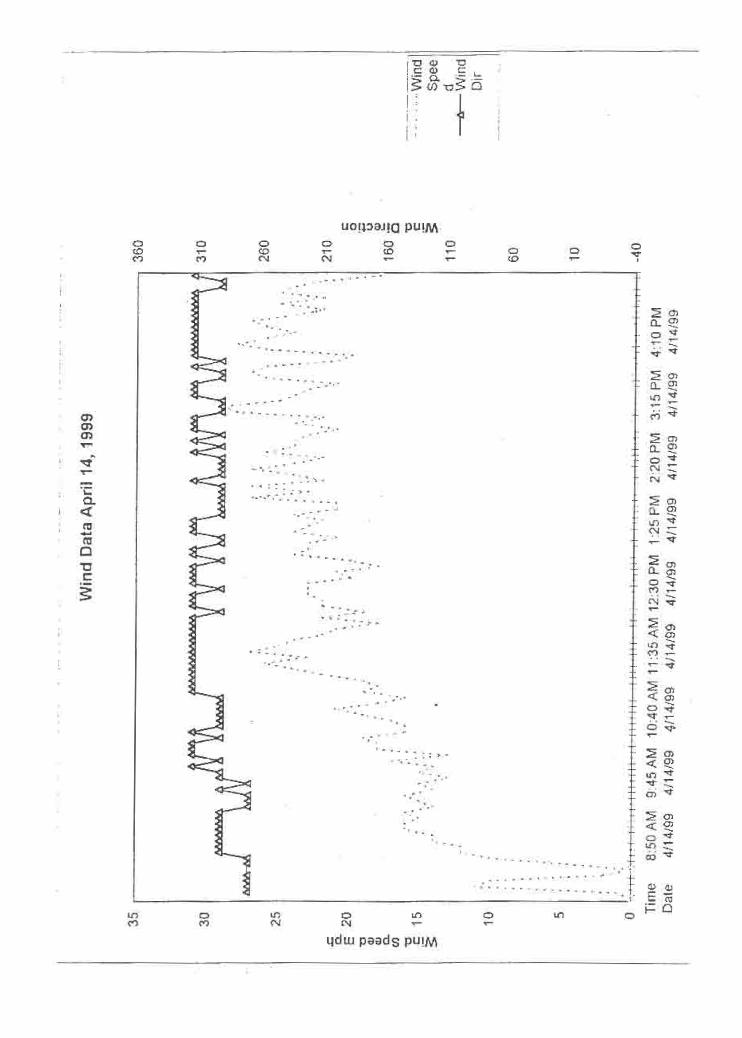

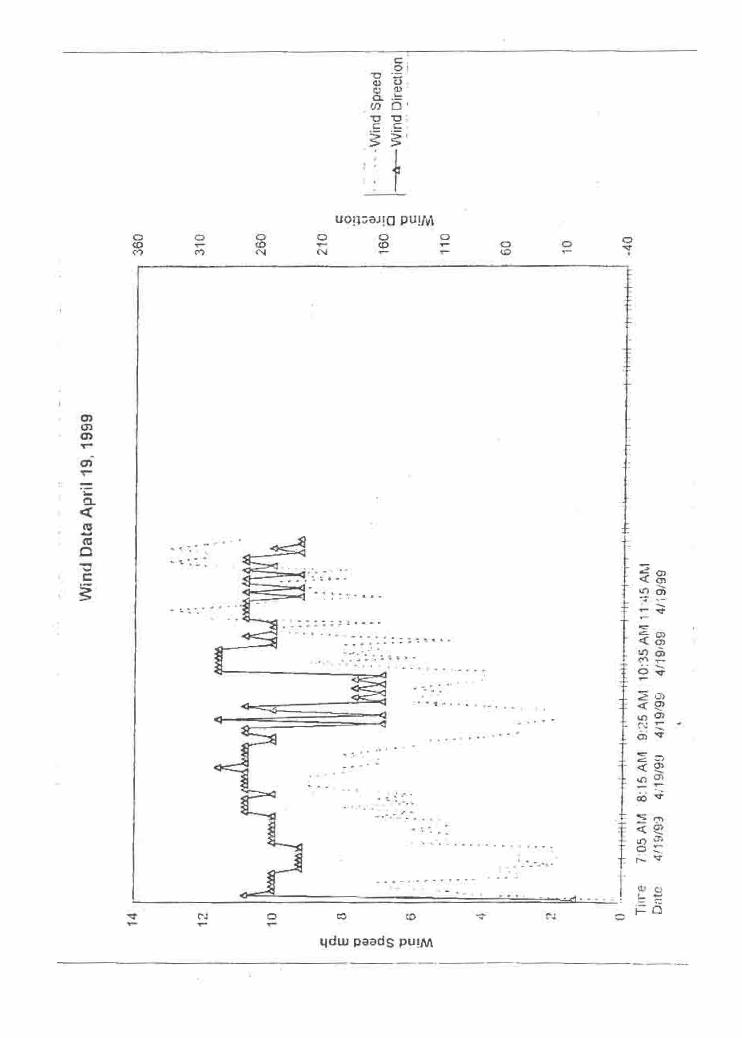

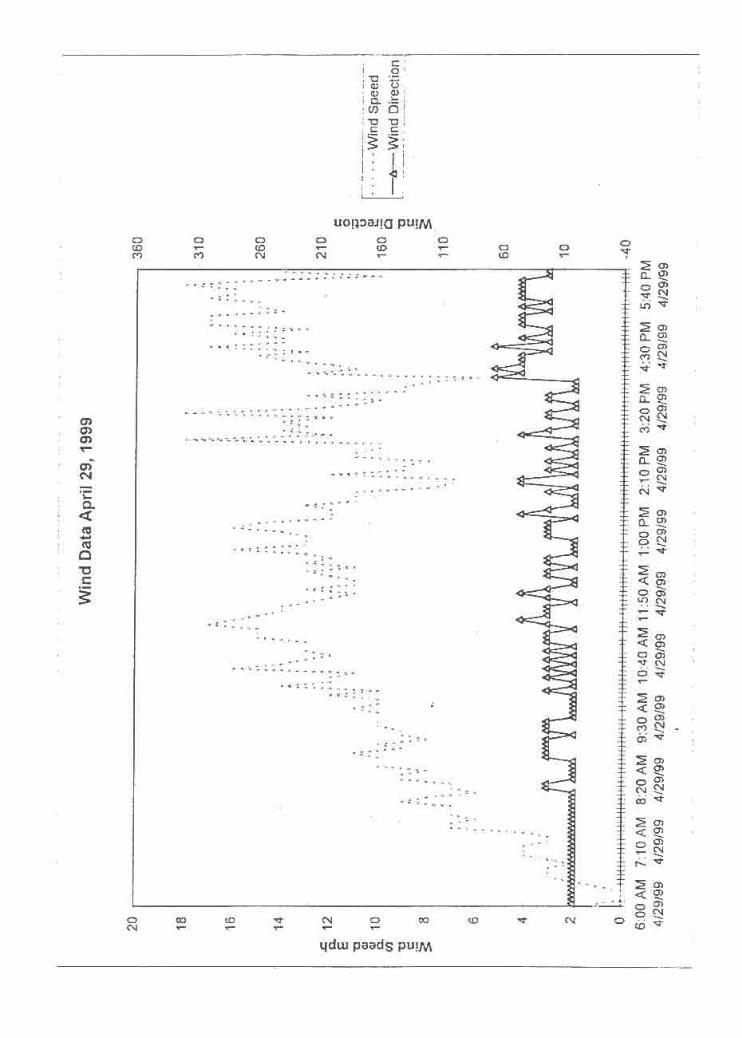


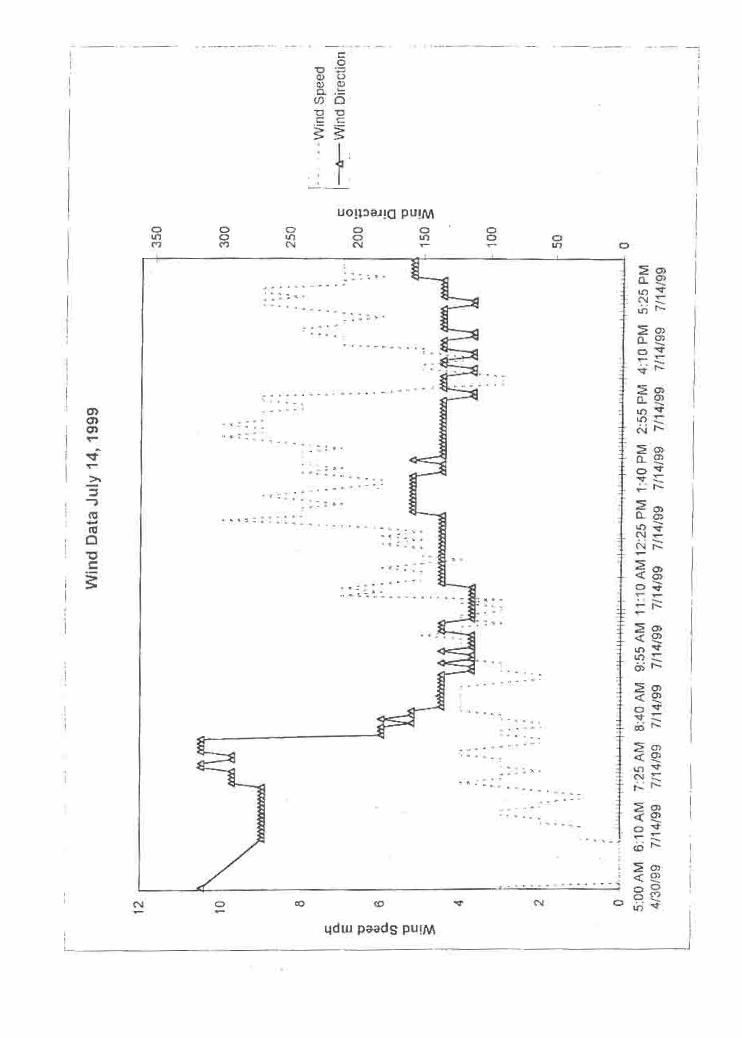


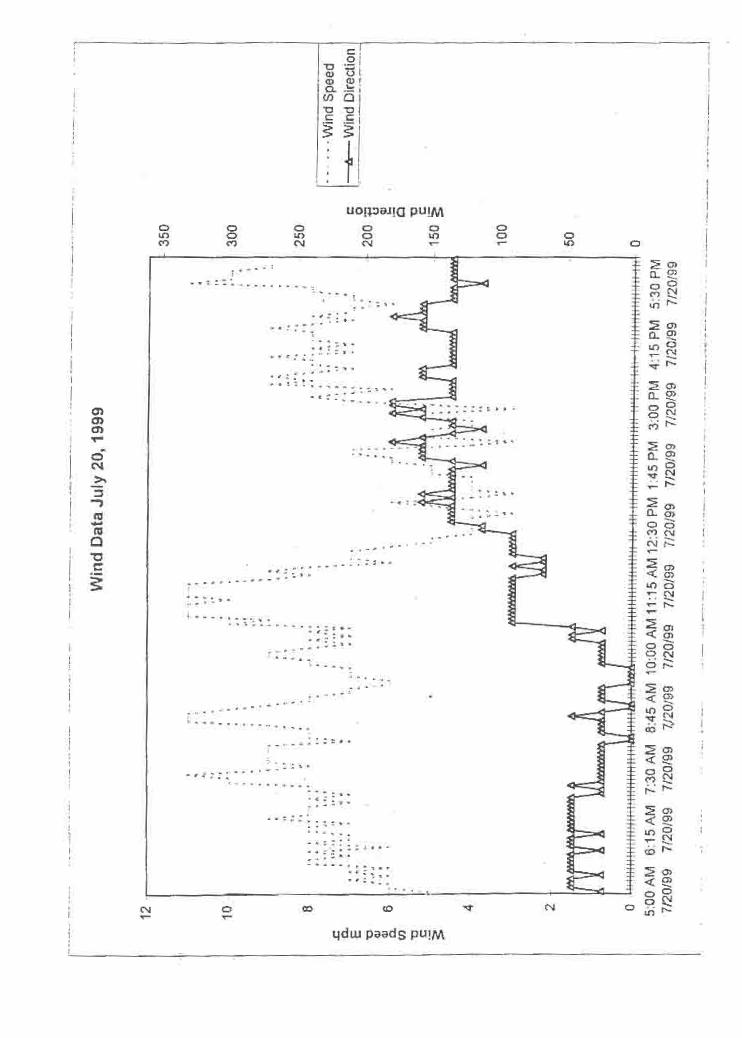


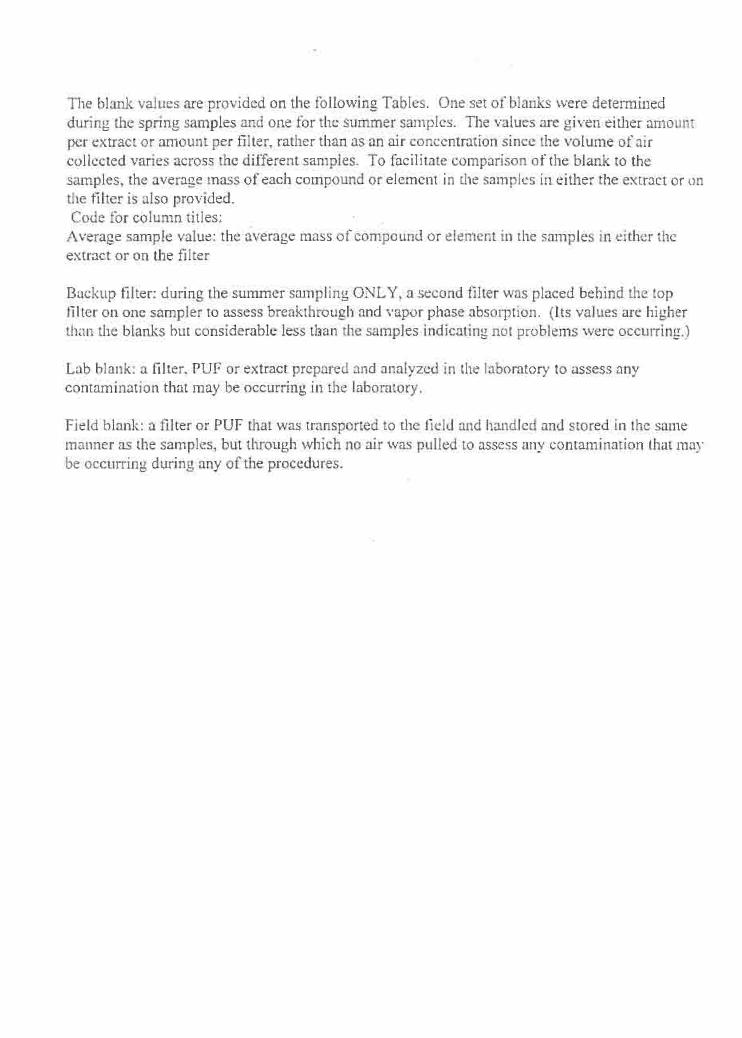
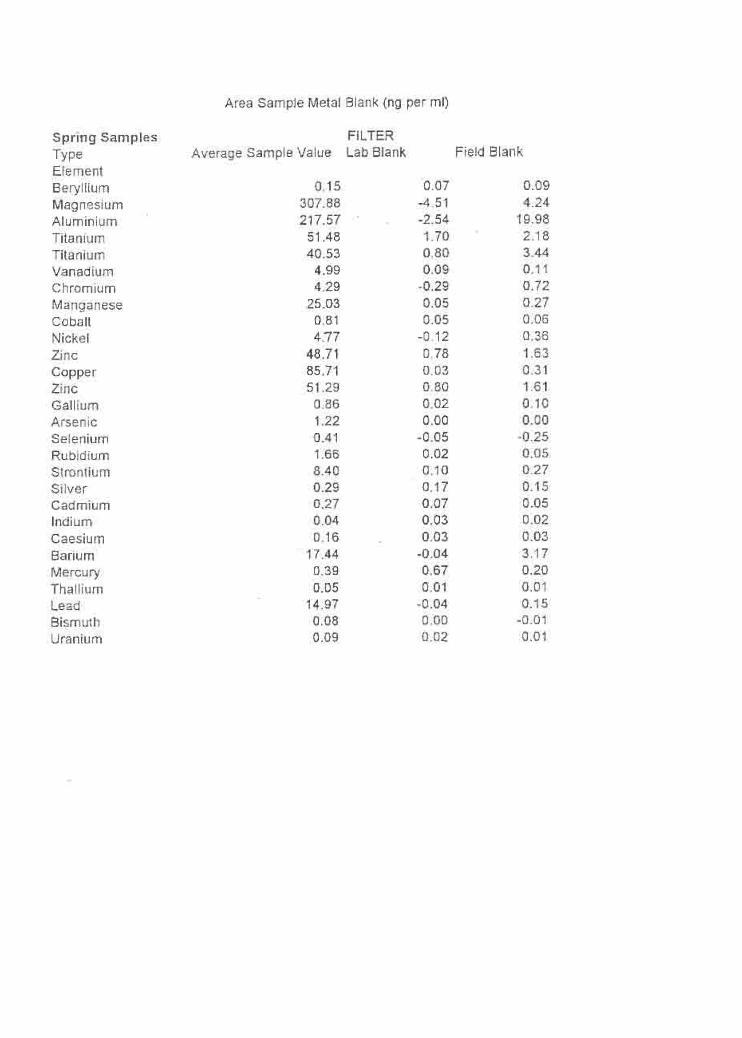

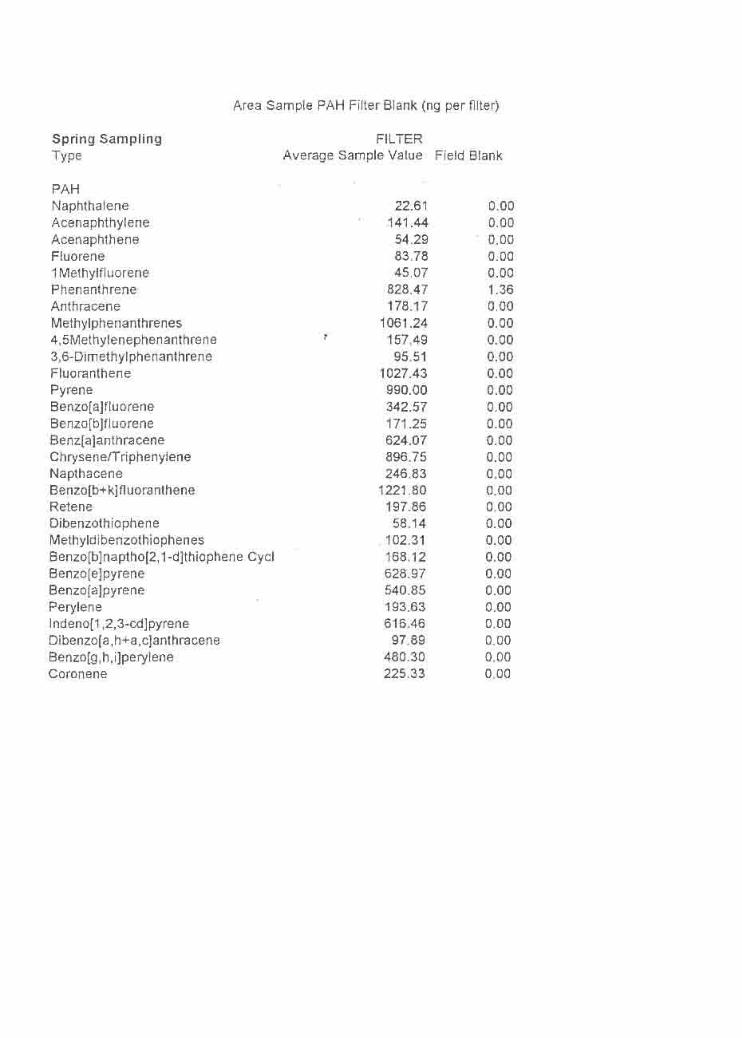


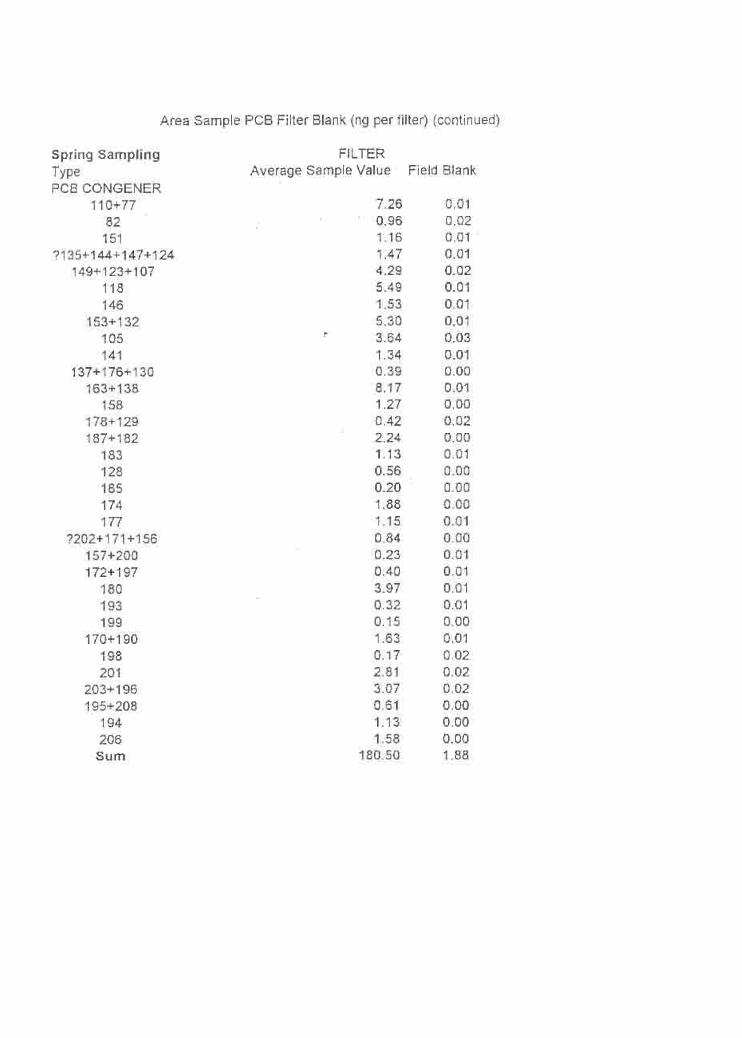

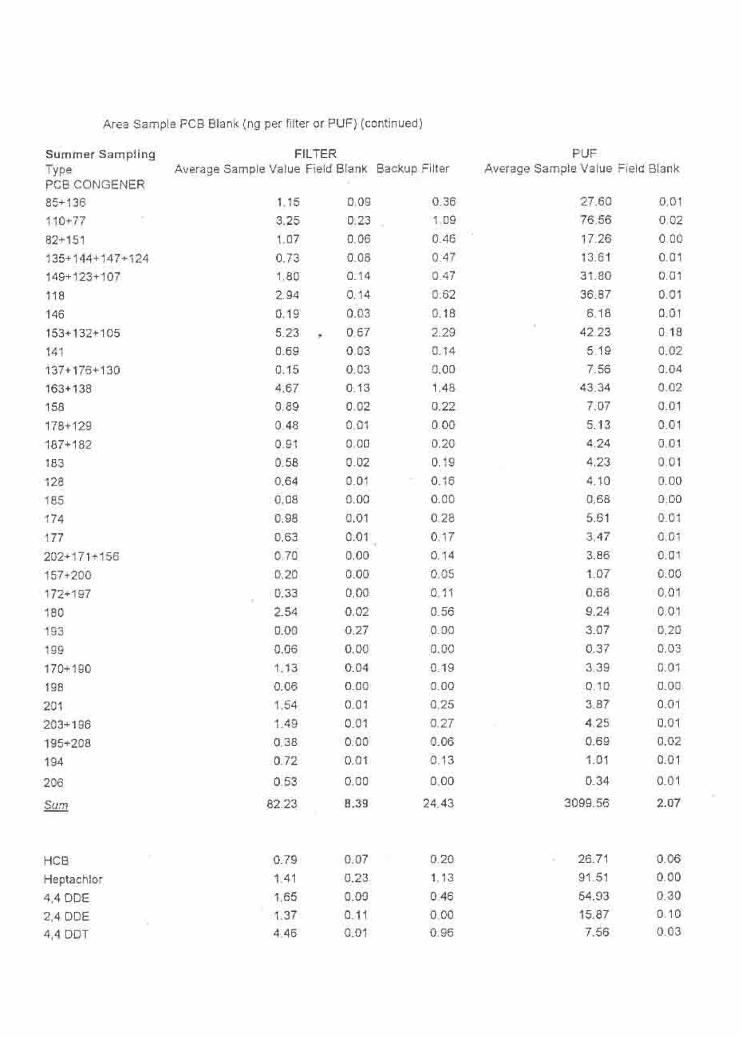

APPENDIX E-2
Tables on Air Quality Data
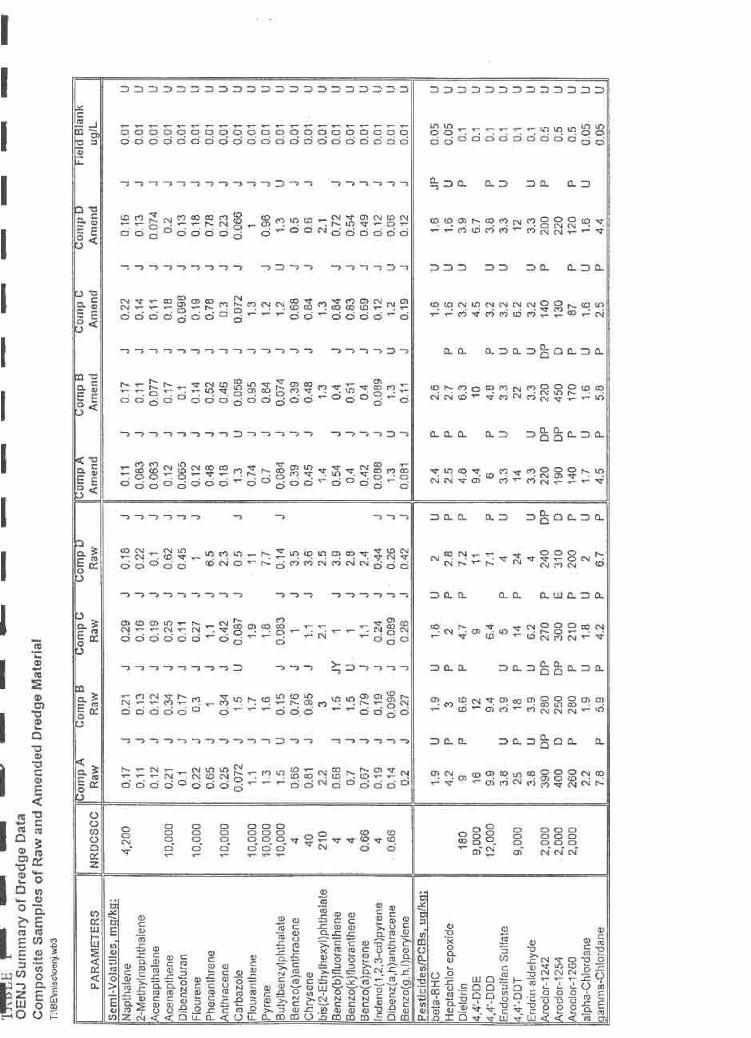
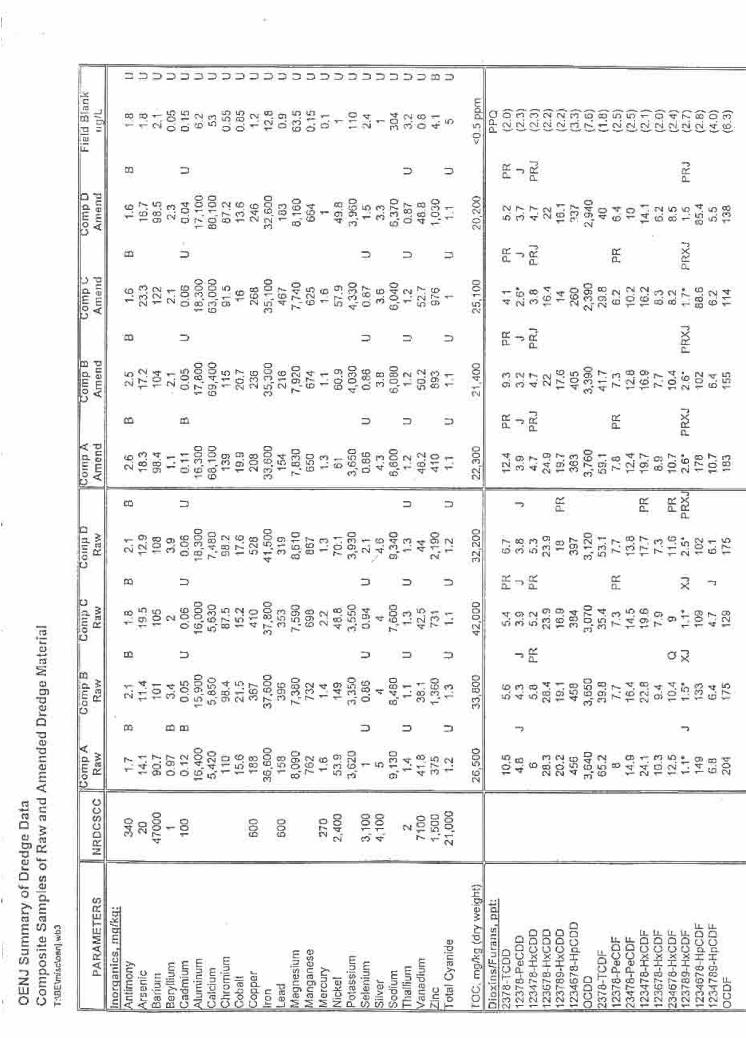


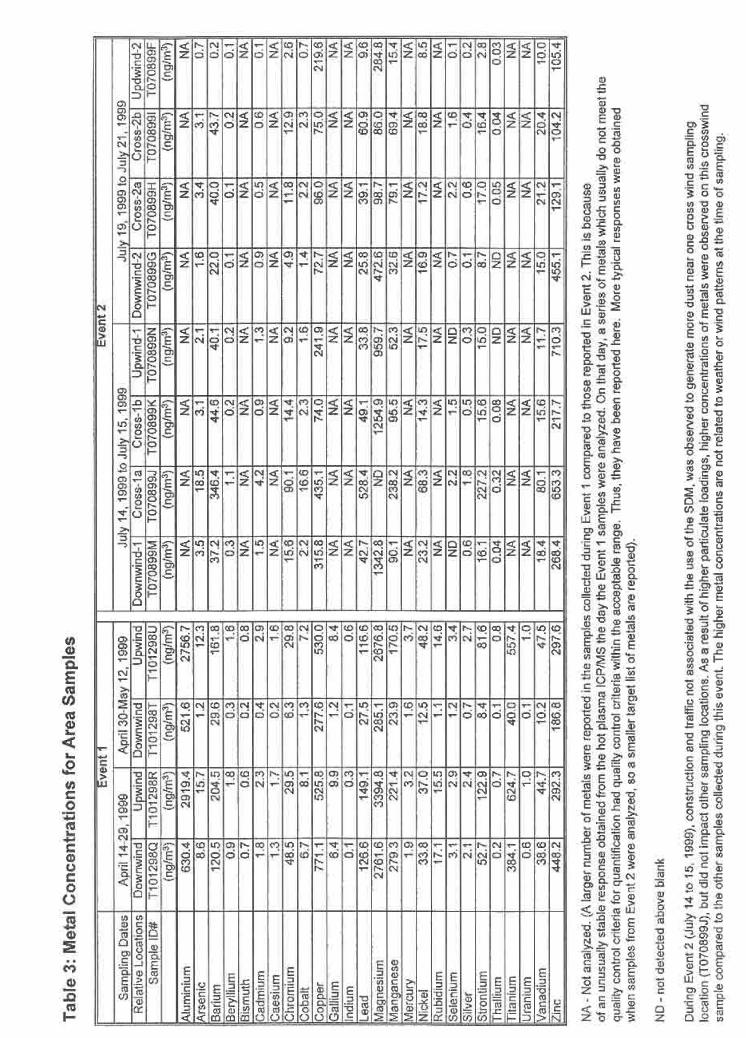


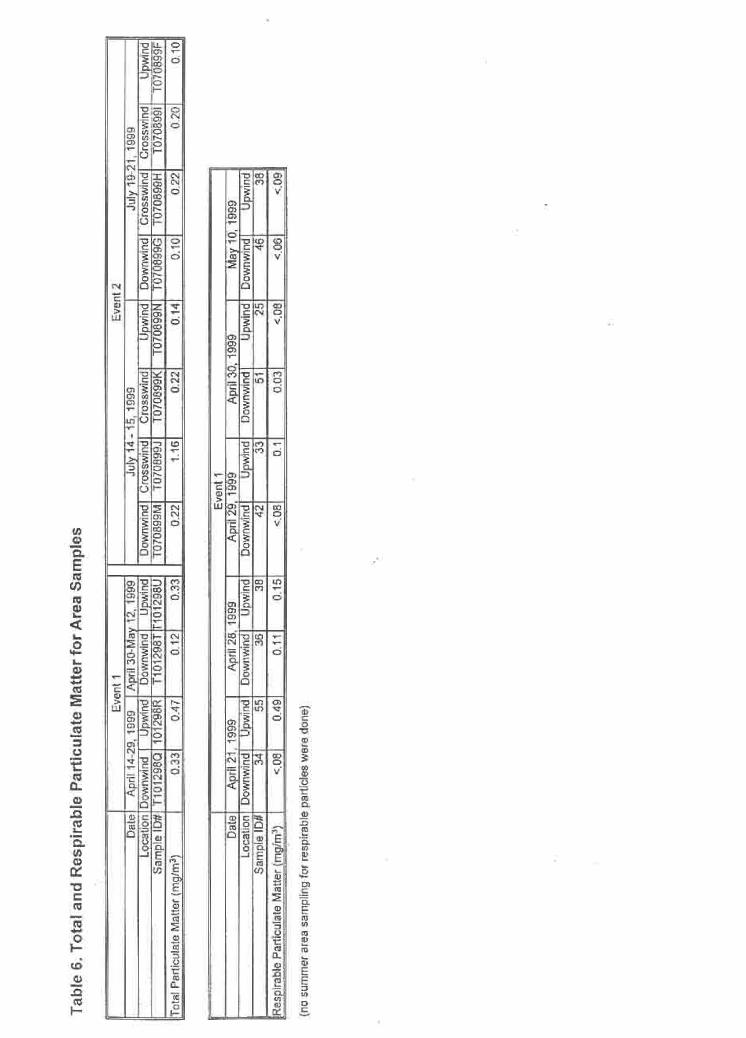

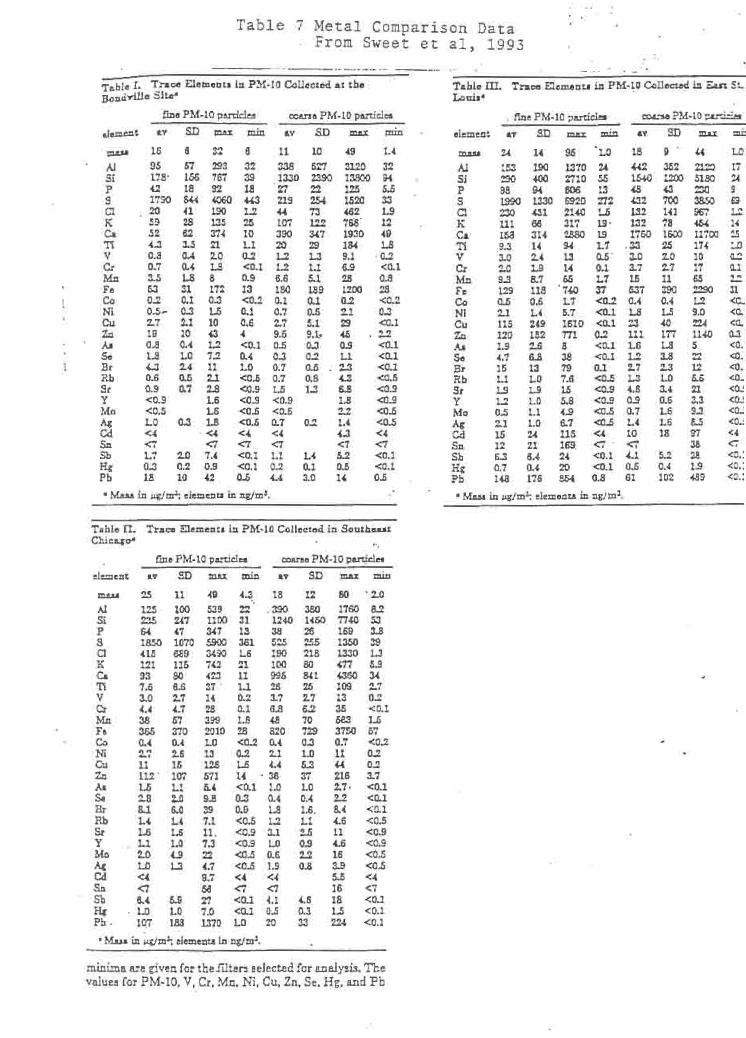
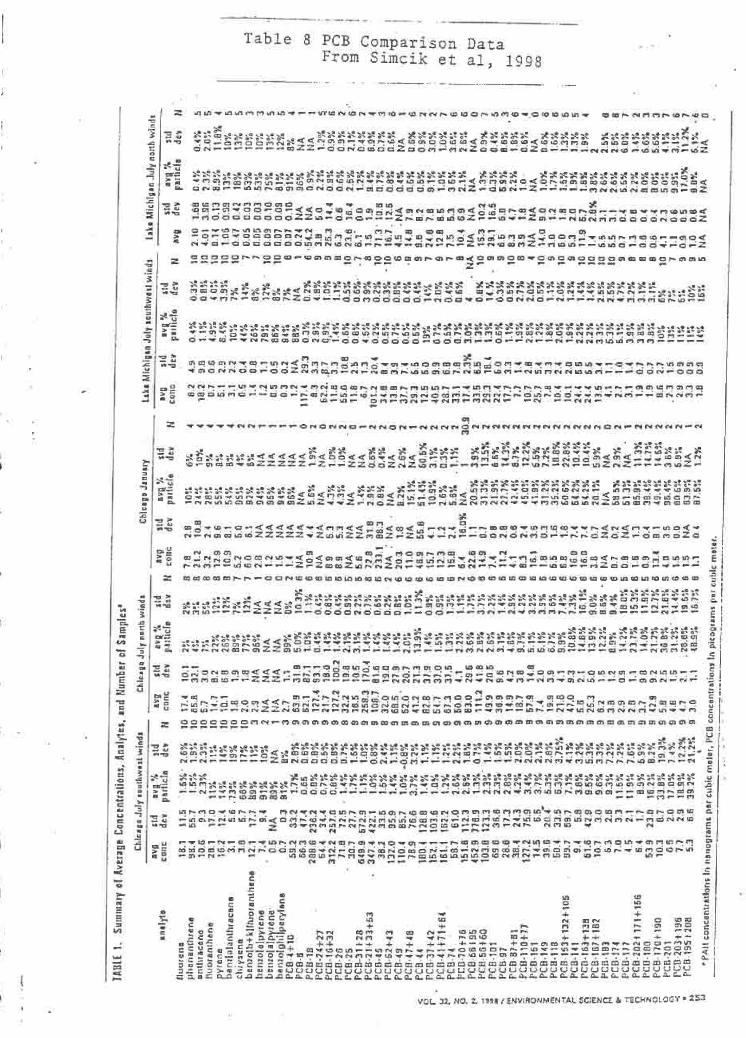


APPENDIX E-3
Wind Data for Sample Collection Days

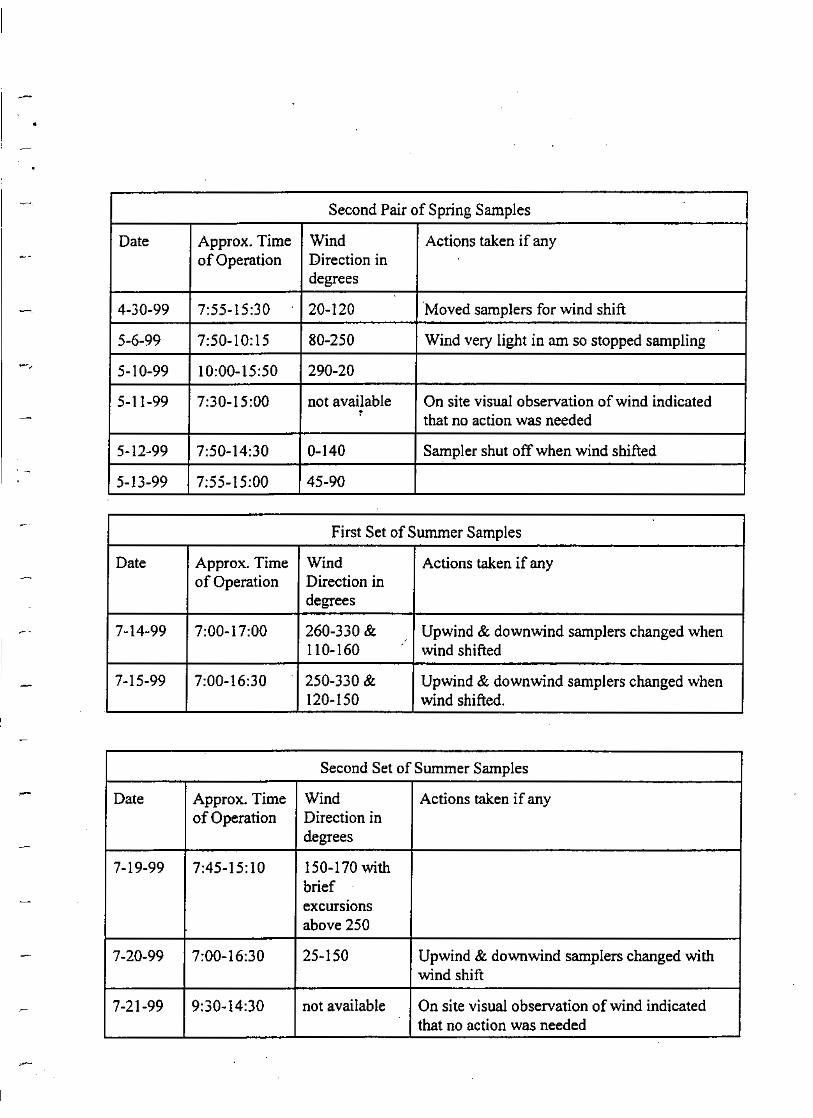
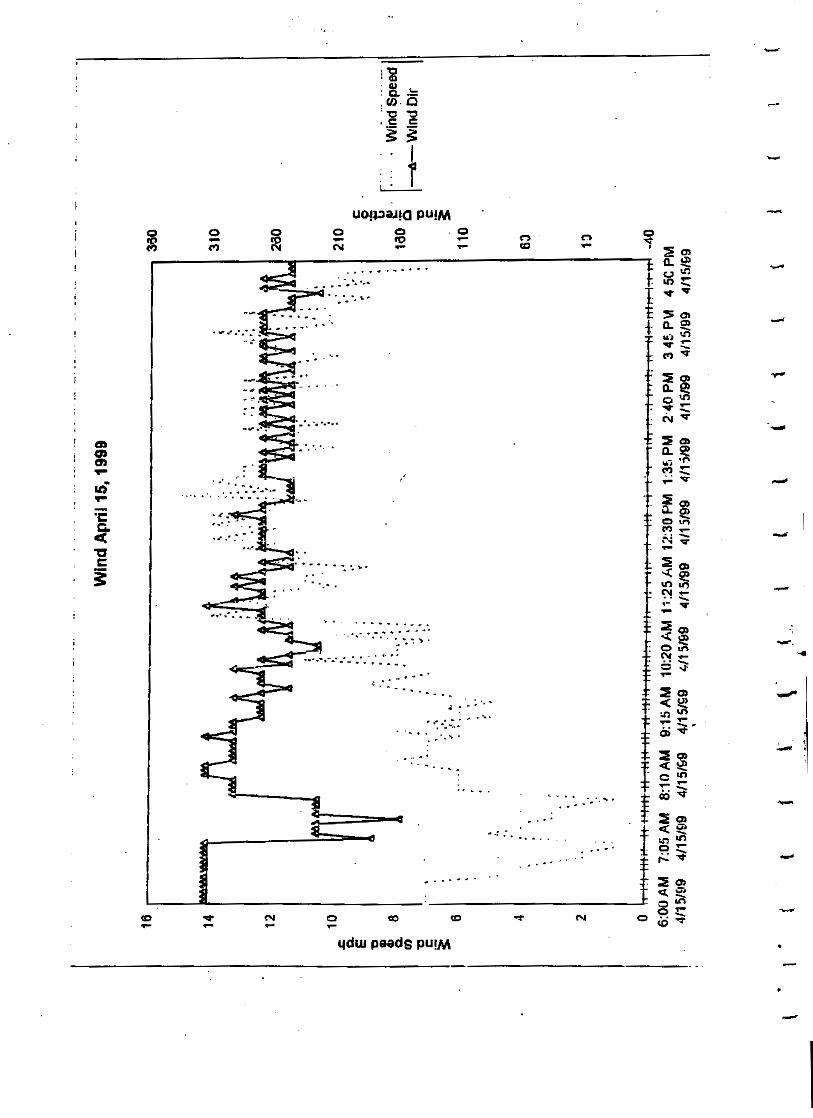
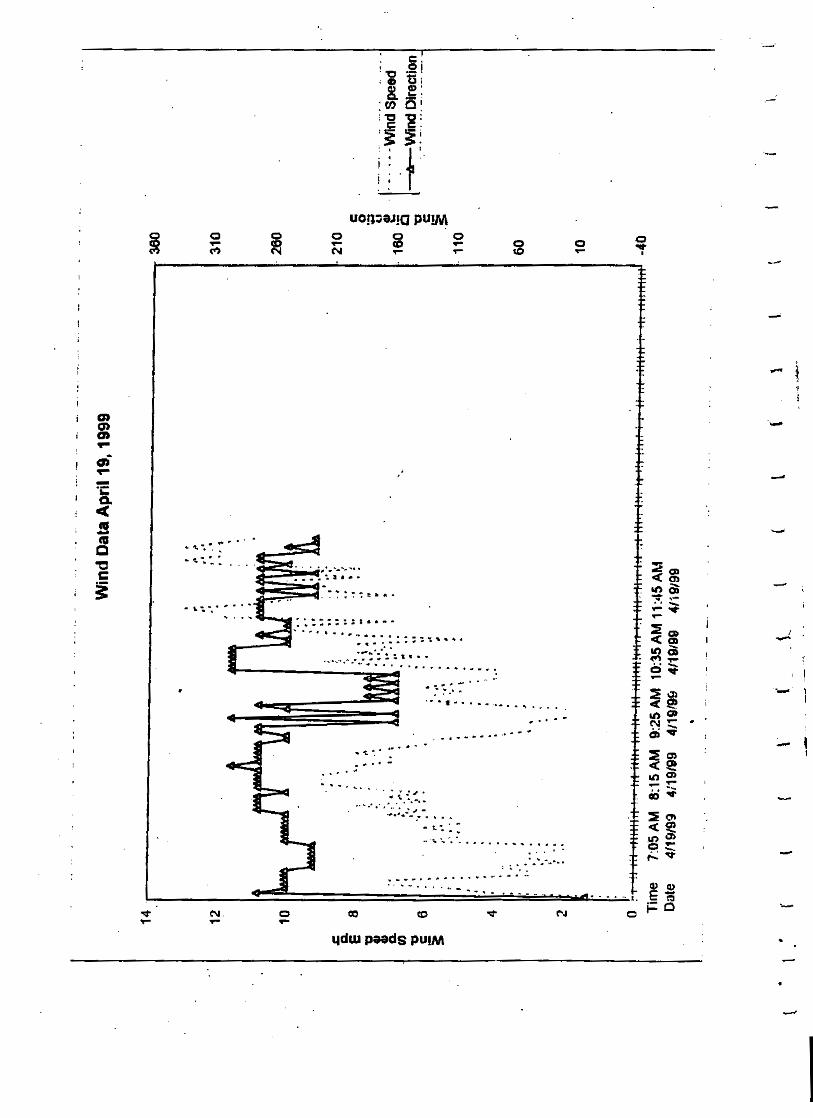

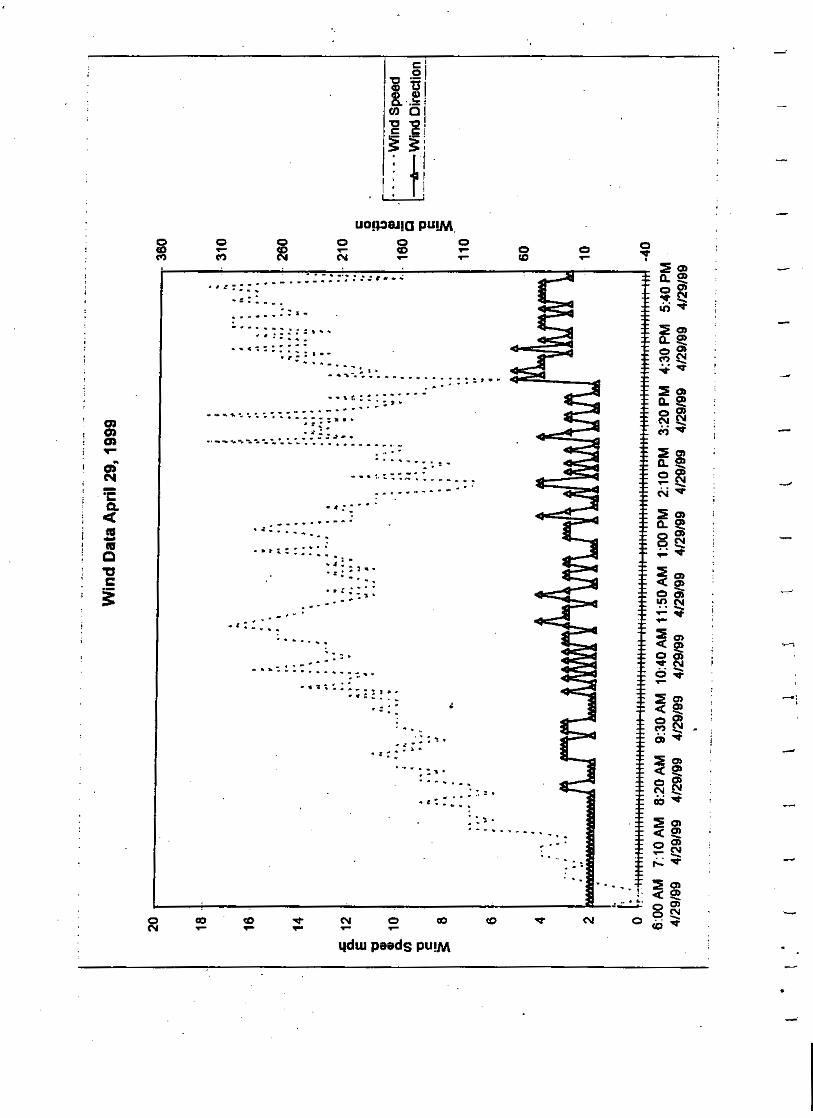
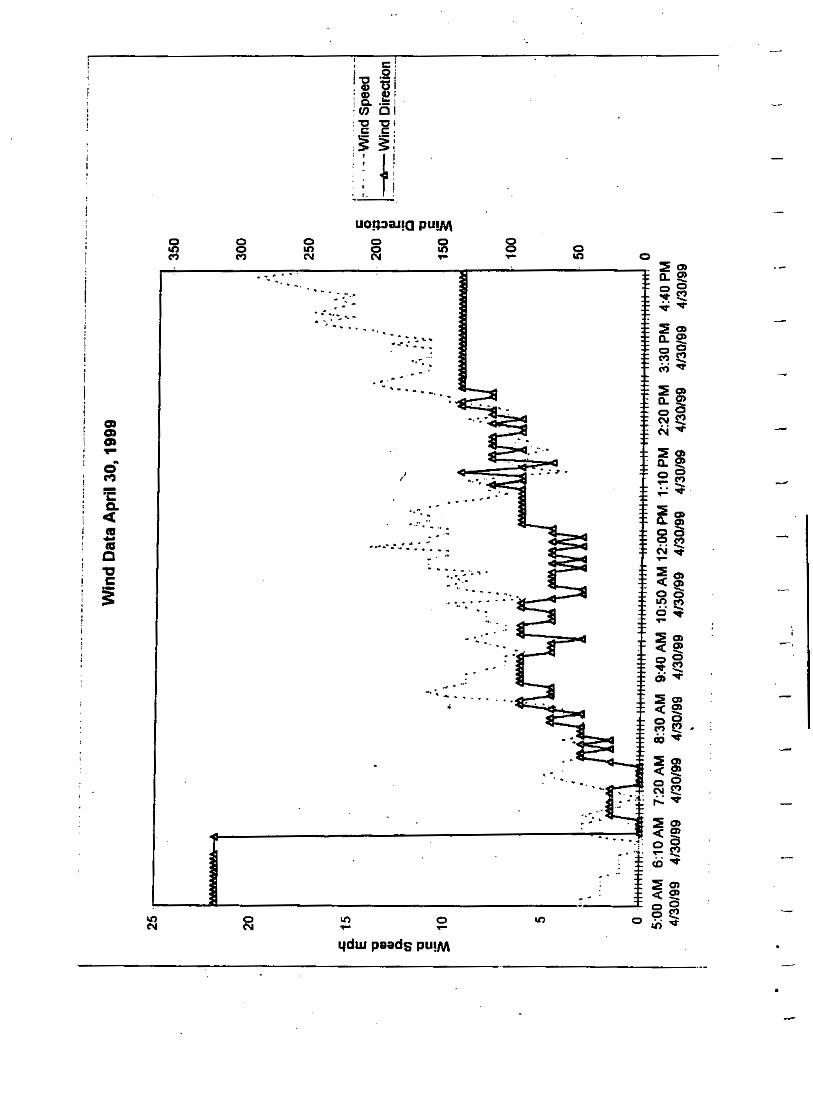

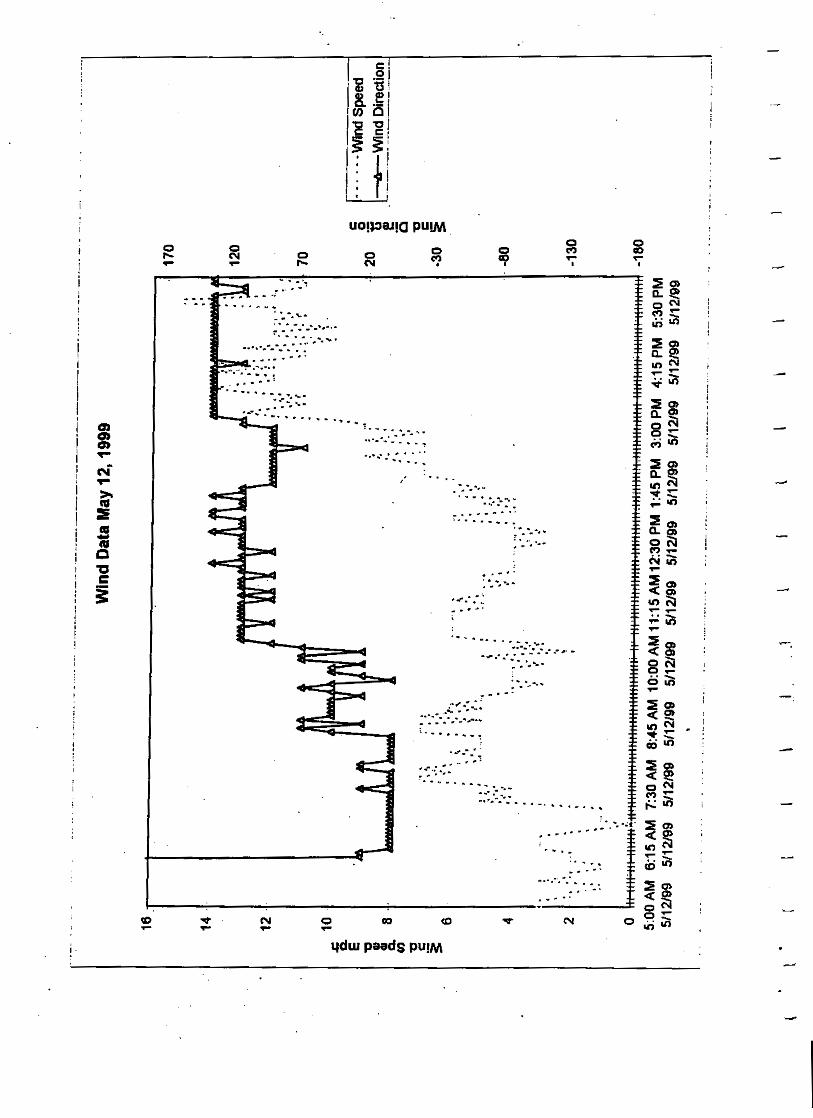
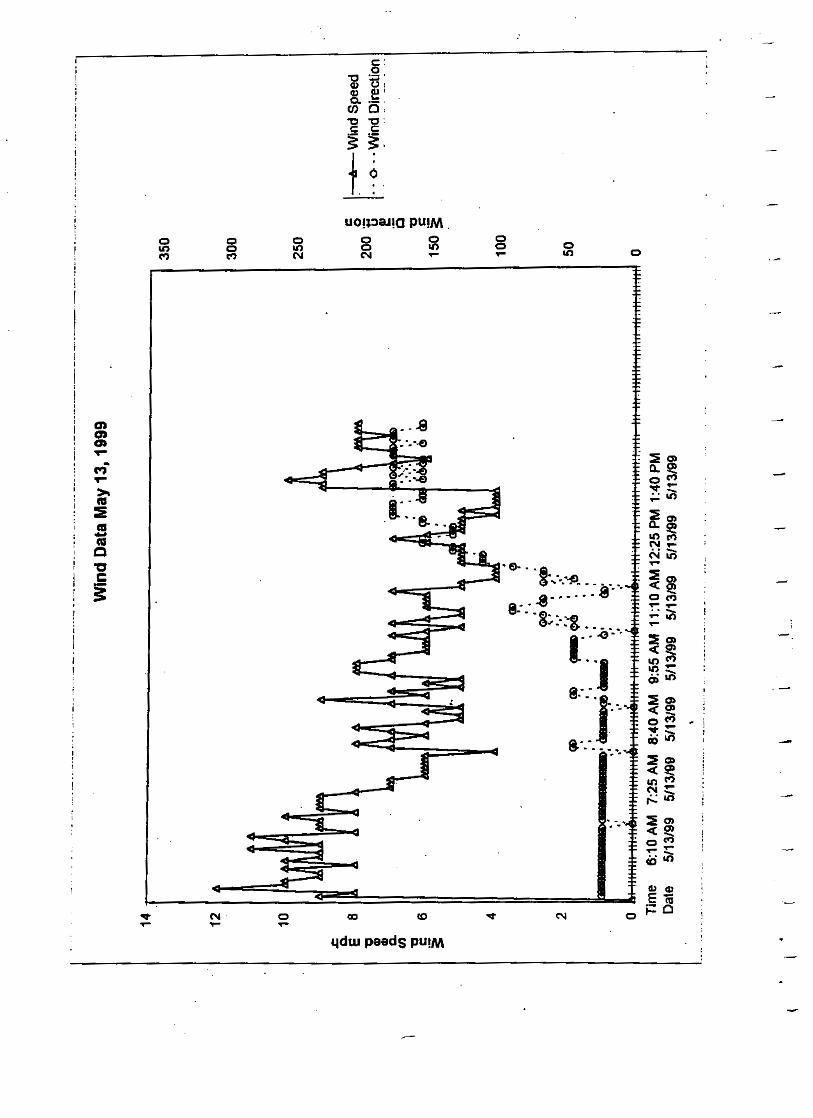
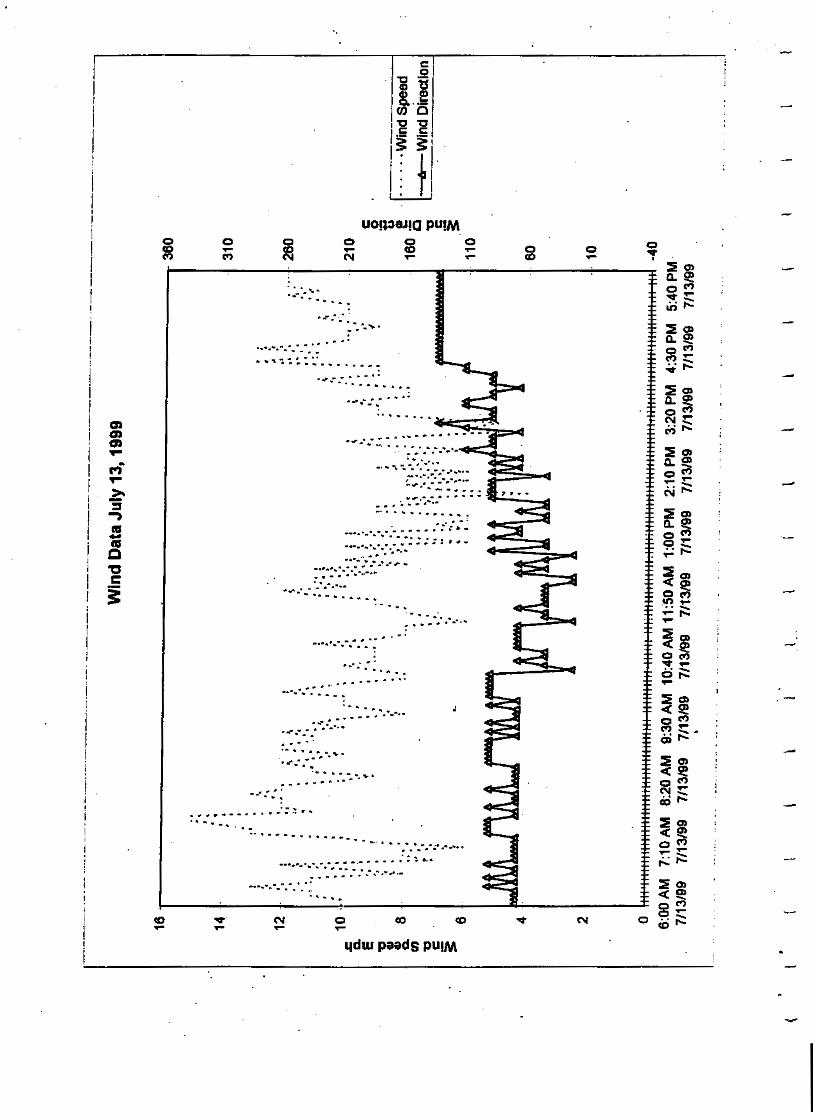

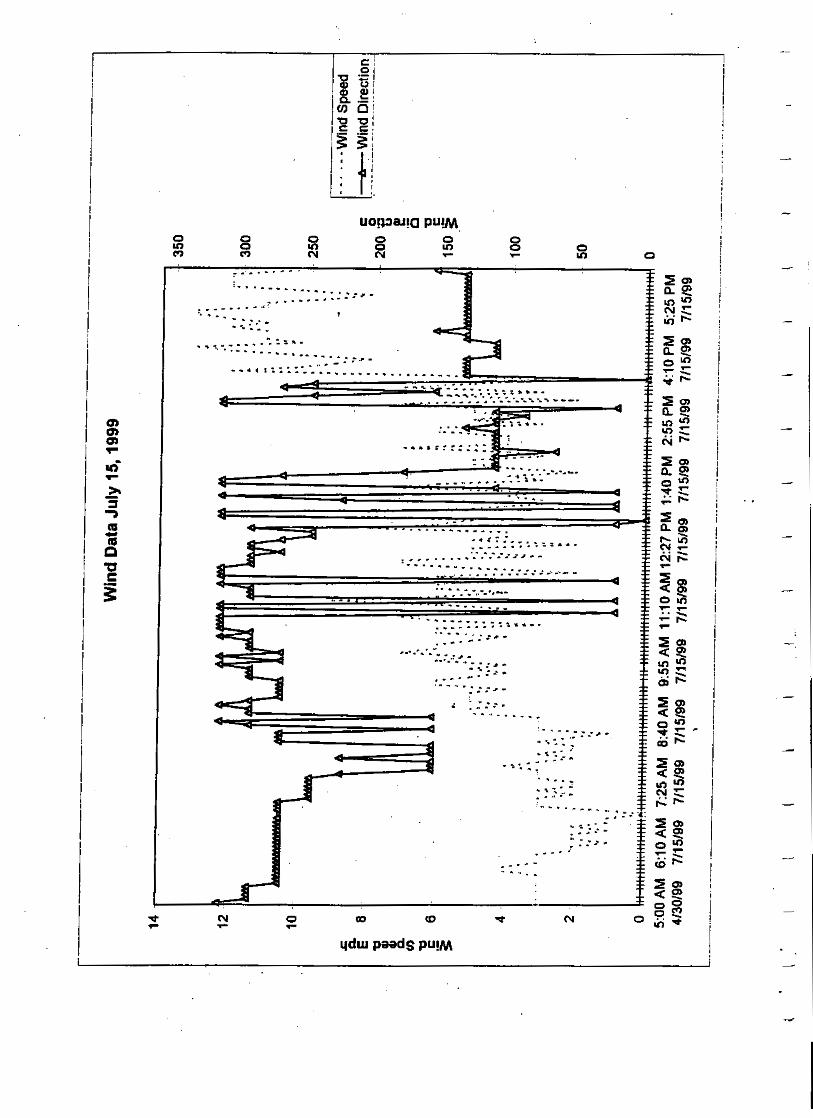
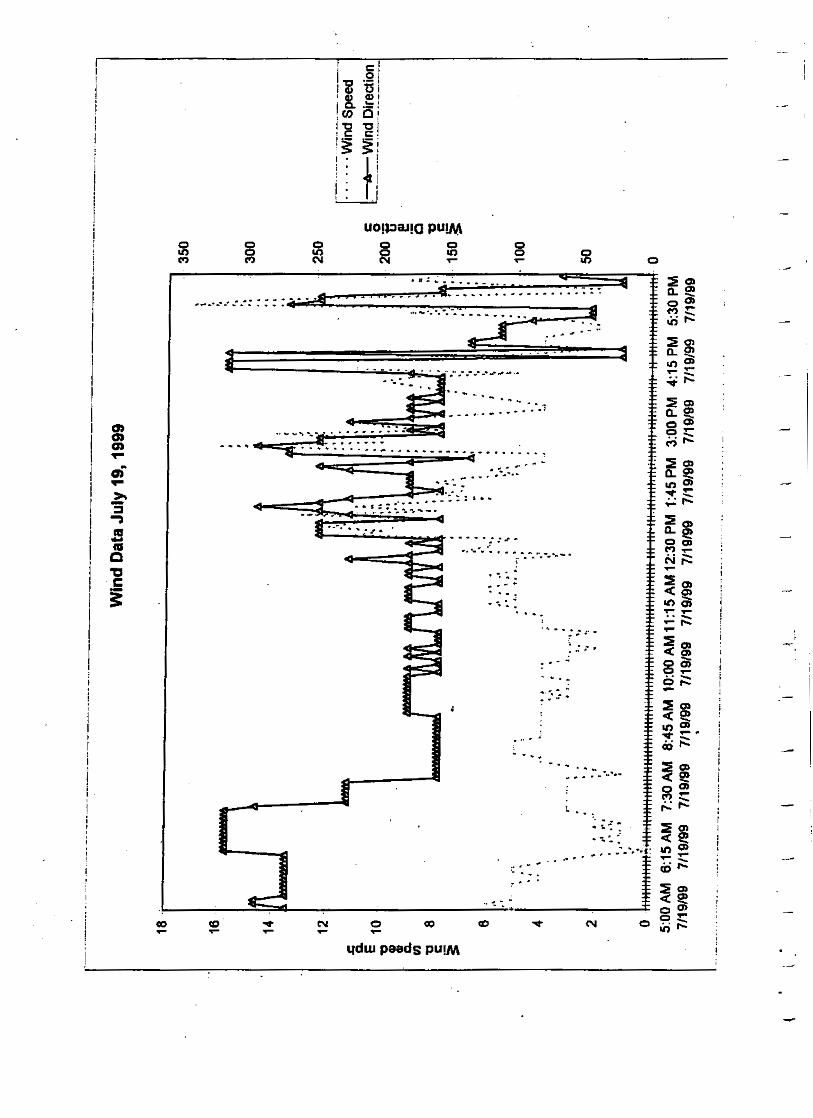


APPENDIX F
March 2000 Progress Report “Use of Dredged Materials in the Construction of Roadway Embankments”

PROGRESS REPORT
DEMONSTRATION PROJECT ON THE USE OF DREDGED MATERIALS
FOR CONSTRUCTION OF ROADWAY EMBANKMENTS
PREPARED BY:
SADAT ASSOCIATES, INC. PRINCETON, NEW JERSEY
& SOILTEK, INC.
PRINCETON, NEW JERSEY
ON BEHALF OF:
OENJ CORPORATION, INC. BAYONNE, NEW JERSEY
SUBMITTED TO:
NEW JERSEY MARITIME RESOURCES
NEW JERSEY DEPARTMENT OF TRANSPORTATION
NEW JERSEY DEPARTMENT OF ENVIRONMENTAL PROTECTION
NEW JERSEY PORT AUTHORITY OF NEW YORK AND NEW JERSEY
NEW JERSEY TRANSIT
MARCH 2000

TABLE OF CONTENTS SECTION PAGE 1.0 .........................................................................................................................INTRODUCTION
..........................................................................................................................................................1 1.1 Project Objective and Project Team ................................................................................2 1.2 Site Location ......................................................................................................................4 1.3 Project History...................................................................................................................6 1.4 General Project Description .............................................................................................6
2.0 ............................................................................PROJECT TEAM AND SUBCONTRACTORS........................................................................................................................................................11 2.1 Demonstration Project Personnel ..................................................................................11 2.2 Laboratories Utilized for the Project .............................................................................12 2.3 Documentation.................................................................................................................14 2.4 Health and Safety Requirements ...................................................................................15
3.0 ......................................................................................... PRE-CONSTRUCTION ACTIVITIES........................................................................................................................................................16 3.1 Workplans and Preliminary Design ..............................................................................16 3.2 Initial Sampling of the Raw and Amended Dredged Material....................................17 3.3 Foundation Analysis and Final Design ..........................................................................18
4.0 ..................................................................................................CONSTRUCTION ACTIVITIES........................................................................................................................................................21 4.1 Stabilization of the Raw Dredged Material (AAAARDM@@@@)...................................................22 4.2 Construction of Embankments No. 1, No. 2 and Access Roadway .............................22 4.3 Installation of Geotechnical Monitoring Devices ..........................................................28 4.3 Installation of Air Monitoring Devices ..........................................................................32 4.5 Installation of Collection Systems for Percolating Water ............................................32 4.6 Installation of Stormwater Conveyance System ...........................................................33 4.7 Environmental Sampling and Geotechnical Monitoring During Construction.........34 4.8 Construction Cost Estimation ........................................................................................35
5.0 ....................................................................... GEOTECHNICAL MONITORING ACTIVITIES........................................................................................................................................................36 5.1 Cement Content Monitoring ..........................................................................................37 5.2 Geotechnical Laboratory Investigation .........................................................................38 5.3 Geotechnical Field Monitoring.......................................................................................40
5.3.1 Field Compaction Monitoring ...........................................................................41 5.3.2 Settlement Monitoring .......................................................................................42 5.3.3 Embankment Field Monitoring ........................................................................43 5.3.4 Field Curing Evaluation - Cone Penetration Testing .....................................44
5.4 Preliminary Data Analysis..............................................................................................44 6.0 ...............................................................................................AIR MONITORING ACTIVITIES
........................................................................................................................................................45 6.1 Introduction .....................................................................................................................46
6.1.1 Overview of SDM Processing and Construction Activities.............................47 6.1.3 Parameters Selected for Analyses .....................................................................48
6.2 Methods and Materials ...................................................................................................49 6.2.1 Meteorological Monitoring ................................................................................49 6.2.2 Area Samples .........................................................................................49 6.2.3 Personal Samples................................................................................................51
6.3 Area and Personal Sample Collection ...........................................................................52
6.3.1 Area Samples ......................................................................................................52 6.3.2 Personal Samples................................................................................................53
6.4 Results and Data Evaluation ..........................................................................................54 6.4.1 Meteorological Data ...........................................................................................54 6.4.2 Background Conditions and Potential Interferences ......................................54 6.4.3 Area Samples ......................................................................................................55
6.4.3.1 TSP and PM10 .....................................................................................55 6.4.3.2 Metals ..................................................................................................56 6.4.3.3 PCBs/Pesticides ..................................................................................57 6.4.3.4 PAHs ...................................................................................................58
6.4.4 Overview of Area Sampling Results .................................................................59 6.4.5 Personal Samples................................................................................................59
6.4.5.1 Respirable Particulate Matter...........................................................60 6.4.5.2 Metals ..................................................................................................60 6.4.5.3 PCBs and Pesticides ...........................................................................60 6.4.5.4 PAHs ...................................................................................................61
6.4.6 Overview of the Personal Sampling Results.....................................................61 6.5 Conclusions and Recommendations ..............................................................................61
7.0 ........................................................ ENVIRONMENTAL FIELD MONITORING ACTIVITIES........................................................................................................................................................62 7.1 Introduction .....................................................................................................................62 7.2 Environmental Sampling ................................................................................................64
7.2.1 Environmental Sampling of the RDM..............................................................64 7.2.2 Environmental Sampling of SDM.....................................................................71 7.2.3 Environmental Sampling of Percolated Groundwater ...................................77 7.2.4 Environmental Sampling of Stormwater .........................................................78
7.3 Post-Construction Environmental Sampling ................................................................79 7.4 Data Processing and Basis for Data Screening .............................................................81
7.4.1 Data Base System ...............................................................................................81 7.4.1 Environmental Standards used for Data Screening ........................................82
7.4.1.1 Soil Samples ...........................................................................................82 7.4.1.2 MMEP Leachates and Percolated Groundwater Samples ................83 7.4.1.3 Stormwater Samples ..........................................................................83 7.4.1.4 Dioxins Analysis.....................................................................................84
7.5 Screening Evaluation of Analytical Data ......................................................................87 7.5.1 Raw Dredged Material - RDM ..........................................................................89
7.5.1.1 Residential Soil Cleanup Criteria for RDM.....................................89 7.5.1.2 Nonresidential Soil Cleanup Criteria for RDM...............................90 7.5.1.3 Impact to Groundwater Soil Cleanup Criteria for RDM...............90 7.5.1.4 Dioxins for RDM ...................................................................................91
7.5.2 Stabilized Dredged Material - SDM..................................................................92 7.5.2.1 TCLP Characterization of SDM.......................................................92 7.5.2.2 Residential Soil Cleanup Criteria for SDM .....................................93 7.5.2.3 Nonresidential Soil Cleanup Criteria for SDM ...............................94 7.5.2.4 Impact to Groundwater Soil Cleanup Criteria for SDM ...............94 7.5.2.5 Dioxins for SDM.................................................................................94
7.5.3 SDM Leachates ...................................................................................................96 7.5.3.1 Groundwater Quality Standards for SDM Leachates ....................96 7.5.3.2 Dioxins for SDM Leachate ................................................................98
7.5.4 Percolated Groundwater Samples ....................................................................99 7.5.4.1 Groundwater Quality Standards for Percolated Groundwater......99 7.5.4.2 Dioxins for Percolated Groundwater ..............................................102
7.5.5 Stormwater Samples ........................................................................................103 7.5.5.1 Surface Water Criteria for Stormwater Samples.............................103 7.5.5.2 Dioxin Analysis of Stormwater Samples ........................................105
7.6 Preliminary Findings of the Screening Evaluation.....................................................106 7.6.1 RDM and SDM .................................................................................................106 7.6.2 SDM Leachate and Percolated Groundwater................................................107 7.6.3 Stormwater .......................................................................................................109
8.0 ............................................................................................. Summary and Preliminary Findings......................................................................................................................................................111 8.1 Overview of the Contents of the Progress Report ......................................................111 8.2 Objectives .......................................................................................................................111 8.3 Project Team..................................................................................................................112 8.4 Main Construction and Monitoring Activities Performed to Date ...........................112 8.4 Preliminary Evaluations and Findings ........................................................................116
8.4.1 Construction Cost Estimation .........................................................................116 8.4.2 Geotechnical Preliminary Data Analysis........................................................117 8.4.3 Air Monitoring Data Evaluation .....................................................................119 8.4.4 Screening Evaluation for Environmental Sampling .....................................119
8.5 Remaining Activities for Project Completion .............................................................124


LIST OF APPENDICES Appendix A Drawings Appendix B Field Data During Construction Appendix B-1 Daily Construction Reports Appendix B-2 Construction Photographs Appendix B-3 Troxler Results and Locations Appendix B-4 Construction Cost Estimates Appendix C OENJ / NJDOT Embankment Demonstration Project, Site
Investigation and Foundation Study, dated November 6, 1998, by Dr. Ali Maher, Ph.D., Geotechnical Consultant
Appendix D Cement Content Determination of OENJ Amended Dredge in Elizabeth, New Jersey,
dated January 25, 1999, by Soiltek Appendix E Air Study Appendix E-1 Report by Drs. Clifford P. Weisel and Paul J. Lioy, University of Medicine
and Dentistry of New Jersey for Sub-Contract Agreement for OENJ / NJDOT Roadway Embankment Pilot Project, dated January 5, 2000.
Appendix E-2 Tables on Air Quality Data Appendix E-3 Wind Data for Sample Collection Days Appendix F Status of Geotechnical Investigation NJDOT / OENJ Embankment Project, dated
January 31, 2000, by Soiltek Appendix G Screening Evaluation and Environmental Data Appendix H Tabulated Analytical Data Appendix I Screening Evaluation of Non-Detects

LIST OF DRAWINGS Drawing No. 1 Final System Configuration - Grading Plan Drawing No. 2 Final System Configuration - Percolated Water and Stormwater Drainage Plan Drawing No.3 Final System Configuration - Construction Details Drawing No.4 Final System Configuration - Cross Sections Drawing No.5 Final System Configuration - Geotechnical Monitoring Plan

MARCH 2000 PROGRESS REPORT.DOC 1
1.0 INTRODUCTION This progress report on the Demonstration Project on the Use of Dredged Materials in the Construction of Roadway Embankments (ADemonstration Project@) has been prepared by Sadat Associates, Inc. (ASadat Associates@) and Dr. Ali Maher, Geotechnical Consultant, at Rutgers, the State University of New Jersey (ASoiltek@)[1] on behalf of OENJ Corporation Inc. (AOENJ@) for the New Jersey Maritime Resources (ANJMR@). This project was established to assess the suitability of using dredged materials in roadway construction. The project mainly involves the construction of two roadway embankments and an access road using stabilized dredged materials (ASDMs@) at a site located near the Newark Bay in New Jersey. Geotechnical and environmental conditions have been evaluated during the preparation of the construction materials (i.e., dredging and material stabilization), and during construction of roadway embankments (i.e. material transport, drying, spreading, and compaction). Geotechnical and environmental monitoring are being conducted after construction. This report presents a description of the main construction and monitoring field activities performed as of December 1, 1999 for the Demonstration Project. The main activities performed during this time period included: $ the dredging and transportation of sediments from the Newark Bay to the
processing/stabilization facility;
$ the stabilization of the raw dredged material using Portland cement and its transport to the construction Site;
$ the construction of two roadway embankments and an access roadway using the SDM which
were designed to simulate typical highway configurations;
[1] The geotechnical consulting services provided by Dr. Ali Maher are rendered through Soiltek, Inc.
(ASoiltek@), a geotechnical consulting firm.
$ the installation of geotechnical monitoring devices, air monitoring equipment, collection systems for percolating water and stormwater conveyance systems; and,
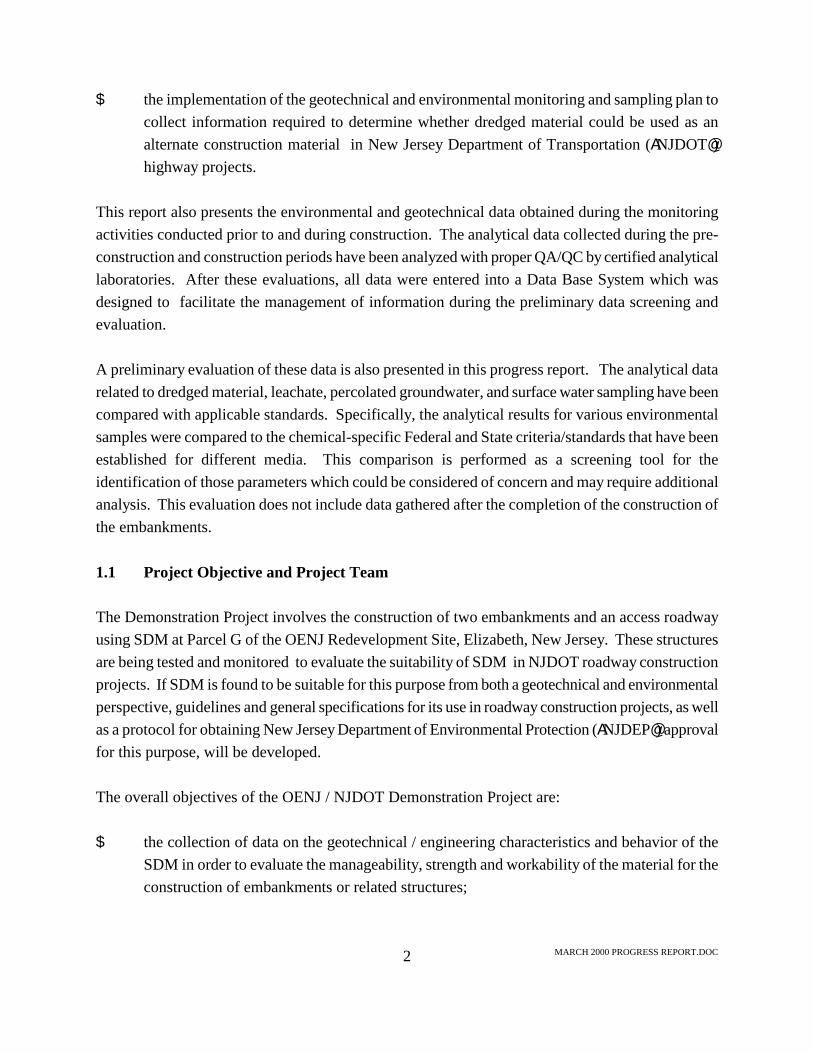
MARCH 2000 PROGRESS REPORT.DOC 2
$ the implementation of the geotechnical and environmental monitoring and sampling plan to collect information required to determine whether dredged material could be used as an alternate construction material in New Jersey Department of Transportation (ANJDOT@) highway projects.
This report also presents the environmental and geotechnical data obtained during the monitoring activities conducted prior to and during construction. The analytical data collected during the pre-construction and construction periods have been analyzed with proper QA/QC by certified analytical laboratories. After these evaluations, all data were entered into a Data Base System which was designed to facilitate the management of information during the preliminary data screening and evaluation. A preliminary evaluation of these data is also presented in this progress report. The analytical data related to dredged material, leachate, percolated groundwater, and surface water sampling have been compared with applicable standards. Specifically, the analytical results for various environmental samples were compared to the chemical-specific Federal and State criteria/standards that have been established for different media. This comparison is performed as a screening tool for the identification of those parameters which could be considered of concern and may require additional analysis. This evaluation does not include data gathered after the completion of the construction of the embankments. 1.1 Project Objective and Project Team The Demonstration Project involves the construction of two embankments and an access roadway using SDM at Parcel G of the OENJ Redevelopment Site, Elizabeth, New Jersey. These structures are being tested and monitored to evaluate the suitability of SDM in NJDOT roadway construction projects. If SDM is found to be suitable for this purpose from both a geotechnical and environmental perspective, guidelines and general specifications for its use in roadway construction projects, as well as a protocol for obtaining New Jersey Department of Environmental Protection (ANJDEP@) approval for this purpose, will be developed. The overall objectives of the OENJ / NJDOT Demonstration Project are: $ the collection of data on the geotechnical / engineering characteristics and behavior of the
SDM in order to evaluate the manageability, strength and workability of the material for the construction of embankments or related structures;

MARCH 2000 PROGRESS REPORT.DOC 3
$ the collection and analysis of chemical data for the evaluation of the potential contaminant migration pathways and potential environmental impacts; and,
$ the development of guidelines for the use of SDM in NJDOT roadway construction projects. The field testing and monitoring activities for this Demonstration Project consist of the performance of: $ an environmental testing and monitoring program for air, soils, percolated groundwater and
stormwater; and,
$ a geotechnical testing and monitoring program. The procedures for the performance of the environmental testing and monitoring programs followed the guidelines set forth in the following: $ NJDEP Manual entitled, ANew Jersey Department of Environmental Protection and Energy -
Field Sampling Procedures Manual,@ dated May 1992.
$ NJDEP Manual entitled, AThe Management and Regulation of Dredging Activities and Dredged Material in New Jersey Tidal Waters,@ dated October 1997.
$ US Army Corps of Engineers= Technical Note DOER-C2 entitled, ADredged Material Screening Tests for Beneficial Use Suitability,@ dated February 1998.
Finally, the procedures for performing the geotechnical monitoring program followed the NJDOT guidelines and the American Society of Testing Materials (AASTM@) standards and requirements. The construction activities were implemented by the Project Team consists of OENJ, Sadat Associates and Soiltek. OENJ is the owner of the Demonstration Project site and General Contractor. Sadat Associates is the Project Manager and is responsible for the overall supervision of the construction activities and the performance of the environmental monitoring and evaluation of the environmental data. Soiltek is responsible for the installation of geotechnical instrumentation, as well as the performance of the geotechnical monitoring and evaluation of the geotechnical data. All phases of the project have been submitted for review and comments to members of the following agencies and their consultants:

MARCH 2000 PROGRESS REPORT.DOC 4
$ New Jersey Maritime Resources (ANJMR@) $ New Jersey Department of Transportation (ANJDOT@) - Stevens Institute of Technology,
consultant to NJDOT $ New Jersey Department of Environmental Protection (ANJDEP@) $ Port Authority of New York and New Jersey (APANY/NJ@) $ New Jersey Transit (ANJ Transit@) - Dames & Moore, consultant to NJ Transit These agencies and consultants are referred to as Ainterested agencies@ in this report. 1.2 Site Location Thre different sites were used for the development of the Demonstration Project: Dredging Site
The Union Dry Dock site in Hoboken, New Jersey, was the source of the dredged sediments transported to the Sealand Facility for stabilization.
Stabilization Site
The mixing of the sediments with cement (stabilization) was conducted at the Sealand Facility in Elizabeth, New Jersey. After stabilization of the dredged material, the material was transported to Parcel G of the OENJ Redevelopment site in Elizabeth, New Jersey, where air drying and compaction took place during the construction of the embankments and the access roadway.
Construction Site
Activities for the construction of the embankments were conducted in Parcel G of the OENJ Redevelopment Site. This parcel comprises the eastern portion of the OENJ Site and is situated adjacent to Newark Bay in Elizabeth, New Jersey. Parcel G encompasses approximately 15 acres.
Figure 1 shows the locations of the Union Dry Dock area, the Sealand Facility and Parcel G.

MARCH 2000 PROGRESS REPORT.DOC 5
Figure 1 – Site Location Plan

MARCH 2000 PROGRESS REPORT.DOC 6
1.3 Project History Between 1996 and 1998, stabilized dredged material (ASDM@) was used at the OENJ Redevelopment Site as fill and/or capping material for the closure of a former landfill. In addition, SDM was used as structural fill to provide sub-grade support for vehicle access roadways and parking lots for the Jersey Gardens Mall. The SDM was used at the Site with NJDEP=s approval following the site specific Protocol for Use of Recyclable Materials. On September 19, 1997, OENJ submitted a request for funding and a preliminary scope of work for the Demonstration Project to the NJMR. After several technical discussions with the NJMR and the NJDOT, the Demonstration Project was approved and funding was granted. In August of 1998, a ADraft Geotechnical and Environmental Testing Workplan for the OENJ/NJDOT Roadway Embankment Pilot Project at Parcel G of the OENJ Redevelopment Site, Elizabeth, Union County, New Jersey@ (ADraft Workplan@) was prepared. This document included the proposed scope of the field monitoring activities. The Draft Workplan was presented to and discussed with representatives from the NJDOT, PANY/NJ, NJMR, Dames and Moore (consultant to NJ Transit), and Stevens Institute of Technology (consultant to NJDOT) during a meeting which was held on September 8, 1998. Comments, questions and concerns related to the issues presented in this workplan were discussed and resolved during that meeting. Several other meetings were held with the interested agencies and parties to discuss technical and regulatory issues related to this project. Based on the decisions made during these meetings and further evaluation of the various technical issues, a second version of the workplan (the AFinal Workplan@) was prepared and submitted to the interested agencies and parties on February 22, 1999. On April 9, 1999, the NJDEP provided comments to the February 1999 Final Workplan. These comments were addressed and incorporated in the revised version of the Final Workplan (referred to herein as the ARevised Final Workplan@), which was submitted to the interested agencies and parties on June 11, 1999. 1.4 General Project Description The project involved the construction of two embankments (Embankment No. 1 and Embankment No. 2) and an access roadway using SDM at Parcel G of the OENJ Redevelopment Site. Environmental and geotechnical field monitoring and testing have been conducted prior to, during and after construction of the two embankments and the access roadway. The location and configuration of these two embankments and the access roadway are shown in the Grading Plan

MARCH 2000 PROGRESS REPORT.DOC 7
(Drawing No. 1 of Appendix A). Additional field monitoring and testing are currently being conducted for the post-construction phase of the project. Figure 2 presents a flow chart indicating the main aspects of the construction phase of the project and summarizes the environmental and geotechnical testing performed prior to, during, and after construction. The construction and monitoring/sampling activities can be summarized as follows: Construction The preparation of the dredged material, conducted before the actual construction of the embankments, consisted mainly of the following activities: $ dredging at the Union Dry Dock site; $ material stabilization at the Sea-Land facility; and, $ transport and stockpiling of the SDM at the construction site. The actual embankment construction activities mainly included: $ preparation of a platform and a foundation for construction of the embankments; $ construction of the embankments and access roadway; $ installation of geotechnical monitoring devices such as inclinometers and settlement plates;
and, $ installation of the collection system for percolating water and the stormwater conveyance
system. Monitoring Geotechnical monitoring conducted prior to, during, and after construction, mainly included: $ cement content testing; $ subsurface investigation for design of the foundation; $ laboratory testing of SDM strength parameters; $ field compaction monitoring; $ settlement monitoring; $ inclinometer monitoring; and,

MARCH 2000 PROGRESS REPORT.DOC 8
$ cone penetrometer testing for long-term strength evaluation. Environmental monitoring activities mainly included the sampling and characterization of: $ Solids:
Raw Dredged Material (RDM) Stabilized Dredged Material (SDM)
$ Liquids
Leachate generated from SDM samples Stormwater Runoff Percolated Groundwater
$ Air
Airborne / dust samples collected during construction Sampling has been performed at different phases of the project for various parameters in order to characterize the materials involved in the construction and to assess potential adverse environmental conditions.
Figure 3 defines the main engineering activities related to the performance of the project. At the present time, all design and construction activities have been completed. Remaining activities are related to collection of additional data, data analysis, final assessment and preparation of a final report.
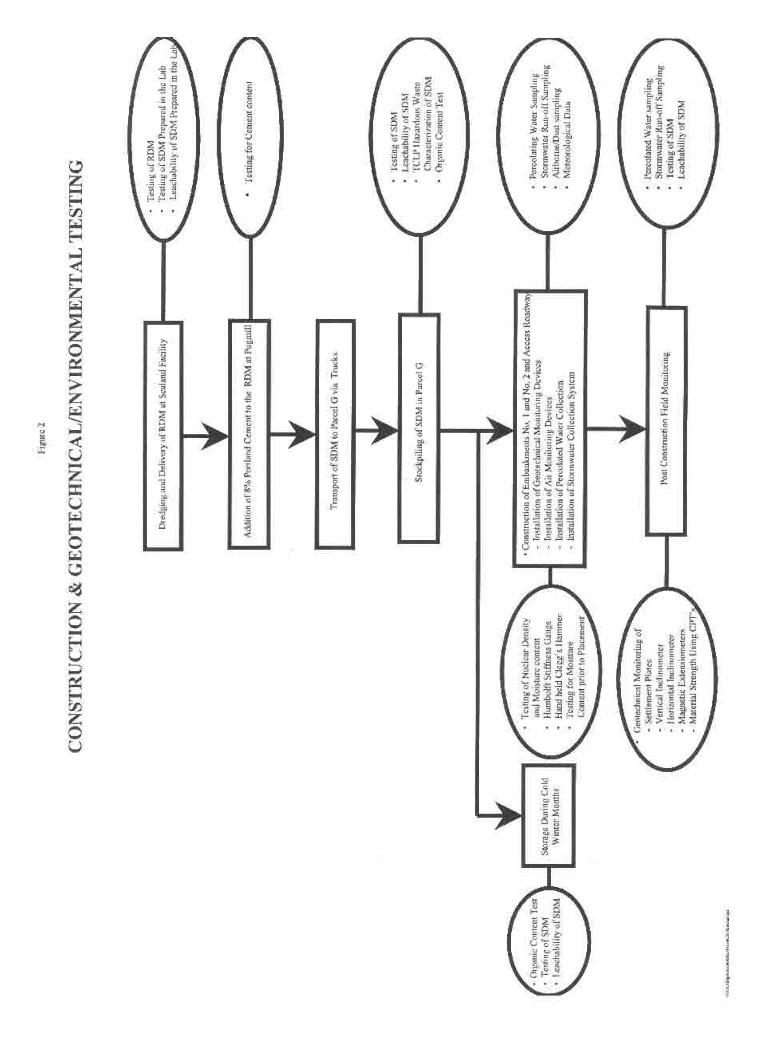
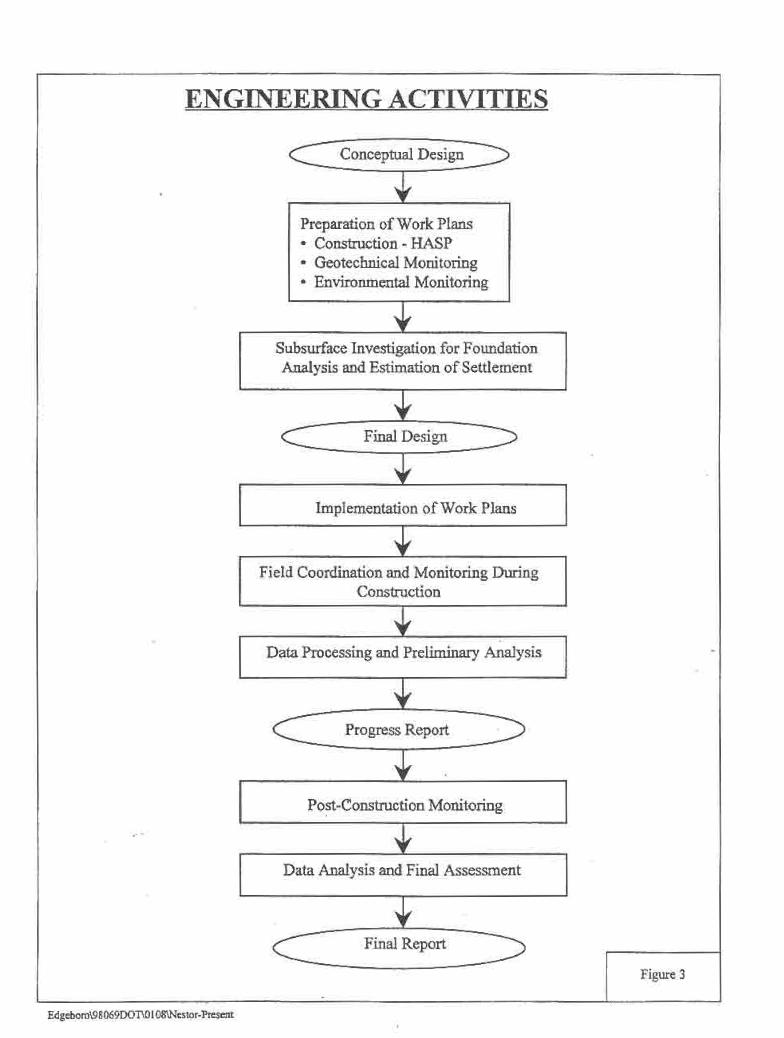

MARCH 2000 PROGRESS REPORT.DOC 11
2.0 PROJECT TEAM AND SUBCONTRACTORS 2.1 Demonstration Project Personnel The Project Team involved in the construction and monitoring activities of the Demonstration Project included the following: $ Project Manager: Sadat Associates - responsible for the overall preparation and
development of the Workplan(s), the management of the team, the overall coordination of the construction and monitoring activities, the proper documentation and maintenance of all records pertaining to geotechnical and environmental monitoring programs and the preparation of the final report(s).
$ Geotechnical Consultant : Soiltek - Dr. Ali Maher - responsible for the oversight, installation,
management and execution of all the geotechnical testing, monitoring, and evaluation activities.
$ Air Monitoring and Evaluation Consultant : Dr. Paul Lioy and Dr. Clifford Weisel
(Environmental and Occupational Health Sciences Institute (AEOHSI@)[1]) - responsible for the execution of the air monitoring activities and evaluation of the air quality data in conjunction with Sadat Associates.
$ Field Coordinator and Health and Safety Officer: Sadat Associates - responsible for the management and oversight of the construction and field monitoring activities and for the implementation of the Health and Safety Plan (AHASP@) dated February 23, 1999.
$ Construction Contractors :
E.E. Cruz Company, Inc. - responsible for the stabilization of the raw dredged material delivered to the OENJ Site, as well as for the construction of a portion of Embankment No. 1, the entire Embankment No. 2, the access roadway, and all associated appurtenances. E.E. Cruz performed the work from September 29, 1998 until July 31, 1999.
[2] Environmental and Occupational Health Sciences Institute (AEOHSI@) is a joint venture of Rutgers-The
State University of New Jersey and The University of Medicine and Dentistry of New Jersey.

MARCH 2000 PROGRESS REPORT.DOC 12
KMC - responsible for the completion of the construction activities (and associated appurtenances) for the remaining construction activities initiated by E.E. Cruz. KMC started working at the Site on August 1, 1999 and completed the construction phase of the Demonstration Project on October 19, 1999.
$ Surveying Subcontractor : McCutcheon Associates, P.A. - responsible for all surveying activities and collection of elevation readings from the settlement plates installed in the embankments.
$ Subcontractors for the Installation of Geotechnical Monitoring Devices : Warren George, Inc. - responsible for the performance drilling activities, under the supervision of Soiltek, E.E. Cruz responsible for the installation of settlement plates and horizontal inclinometer, and Converse East Consultants responsible for the installation of the vertical inclinometers.
$ Laboratory Subcontractors:
Aqua Survey, Inc. - responsible for the collection and testing of the environmental samples until June 26, 1999. During this time, Aqua Survey was responsible for the collection of the environmental samples. Testing of the samples was conducted by laboratories subcontracted by Aqua Survey, Inc. (i.e., Intertek Testing Services[1], Environmental Testing Laboratories and Triangle Laboratories).
Environmental Testing Laboratories (AETL@) - has been responsible for the collection and testing of the stabilized dredge, percolated groundwater and stormwater samples since June 26, 1999.
2.2 Laboratories Utilized for the Project
[3] Intertek Testing Services performed some of the analyses on the raw and laboratory SDM collected/created
in April 1998 for the evaluation of the RDM and SDM for uplands beneficial use. These analyses were conducted for the Port Authority of New York and New Jersey to determine if the material was suitable for use at the OENJ Redevelopment Site, prior to the conception of the NJDOT Embankment Project.
MARCH 2000 PROGRESS REPORT.DOC 13
The following laboratories have been utilized during the various phases of the project: (1) Analysis of raw and SDM, percolated groundwater and stormwater samples for
environmental parameters:
Aqua Survey, Inc. (until June 26, 1999) 499 Point Breeze Road Flemington, New Jersey 08822 NJDEP Certification #10309
Intertek Testing Services (April 1998 Samples only) 55 South Park Drive Colchester, Vermont 05446 NJDEP Certification # 85972
Environmental Testing Laboratories, Inc. 208 Route 109 Farmingdale, New York 11735 NJDEP Certification #73812
Triangle Laboratories (for Dioxin / Furans Analysis only) 801 Capitol Drive Durham, North Carolina 27713 NJDEP Certification #67851
(2) Analysis of airborne particulate samples from personal monitoring program:
Princeton Analytical 47 Maple Avenue Flemington, New Jersey 08822 AIHA Certification #509 NJDEP Certification #10003 NYDOH ELAO Certification #11586 NIOSH PAT Certification #7021
(3) Analysis of airborne particulate samples from area monitoring program:

MARCH 2000 PROGRESS REPORT.DOC 14
Environmental and Occupational Health Sciences Institute, Rutgers University Laboratories 170 Frelinghuysen Road Piscataway, New Jersey 08855-1179 Research Institute[1]
(4) Analysis of the engineering geotechnical properties of soil samples:
Geotechnical Laboratory Civil and Environmental Engineering Rutgers, The State University of New Jersey
2.3 Documentation The team member(s) performing a particular field monitoring program kept detailed field records in the daily field logs (see Appendix B-1). The daily field logs included records of: $ sampling / monitoring particulars; $ daily weather conditions; $ field measurements; $ name of individual responsible for the monitoring / sampling, as well as activities being
performed at the Site; $ on-site personnel; $ site specific observation; $ type of equipment used; $ condition of the dredged material; and, $ required efforts to achieve the required density and moisture content. It also contained any deviations from the protocol, and visitors= names or community contacts during the construction activities. Furthermore, representative photographs of the different activities during the construction phase of the Demonstration Project are presented herein as Appendix B-2.
[4] EOHSI Laboratories were selected for the performance of the analyses, since very low detection limits were
required for certain parameters.

MARCH 2000 PROGRESS REPORT.DOC 15
2.4 Health and Safety Requirements The project team and subcontractors have performed all field activities in conformance to site-specific health and safety plans. Sadat Associates= Health and Safety Plan (AHASP@) was developed in accordance with the most recently adopted and applicable general industry (29 CFR 1910) and construction (29 CFR 1926) standards of the Federal Occupational Safety and Health Administration (AOSHA@), US Department of Labor, as well as other applicable Federal, State and Local statutes and regulations. The Final HASP was submitted to the NJDEP on February 23, 1999. The HASP was developed for use by Sadat Associates personnel during the performance of the construction, as well as the monitoring / sampling activities. All other members of the project team and its subcontractors were required to develop and follow their own HASPs, which followed the general guidelines of the Sadat Associates= February 23, 1999 HASP.

MARCH 2000 PROGRESS REPORT.DOC 16
3.0 PRE-CONSTRUCTION ACTIVITIES Prior to the initiation of the construction activities, some preliminary investigations and activities were deemed necessary. These investigations consisted of: $ preparation of workplan(s) and a preliminary design; $ characterization of the raw and SDM to be used for the project;
$ a foundation study for the evaluation of the physical and engineering characteristics of the
subbase to be used for the two embankments; and, $ final design and workplan. 3.1 Workplans and Preliminary Design Initial planning of the project involved the preparation of a preliminary design and development of the workplans for construction and monitoring. The preliminary design was prepared to estimate work quantities, evaluate the configuration of the embankments and determine the type and quantity of monitoring activities. The preliminary design was submitted to the Interested Parties for review. In August of 1998, based on the preliminary design, a ADraft Geotechnical and Environmental Testing Workplan for the OENJ/NJDOT Roadway Embankment Pilot Project at Parcel G of the OENJ Redevelopment Site, Elizabeth, Union County, New Jersey@ (ADraft Workplan@) was prepared. This document was presented to and discussed with representatives from the NJDOT, PANY/NJ, NJMR, Dames and Moore (consultant to NJ Transit), and Stevens Institute of Technology (consultant to NJDOT) during a meeting which was held on September 8, 1998. Comments, questions and concerns related to the issues presented in this workplan were discussed and resolved during that meeting. The Revised Final Workplan included the final design for construction which incorporated the results of the foundation analysis. Activities related to the foundation analysis and the final design are included in subsequent sections of this report. Several other meetings were held with the interested agencies and parties to discuss technical and regulatory issues related to the Demonstration Project. Based on the decisions made during these

MARCH 2000 PROGRESS REPORT.DOC 17
meetings and further evaluation of the various technical issues, a second version of the workplan (the AFinal Workplan@) was prepared and submitted to the interested agencies and parties on February 22, 1999. On April 9, 1999, the NJDEP provided comments to the February 1999 Final Workplan. These comments were addressed and incorporated in the revised version of the Final Workplan (referred to herein as the ARevised Final Workplan@), which was submitted to the interested agencies and parties on June 11, 1999. Originally, the design for the Demonstration Project consisted of the construction of two embankments (Embankment No. 1 and Embankment No. 2) at Parcel G of the OENJ Site. Embankment No. 1 was to be constructed at the northernmost portion of the parcel, while Embankment No. 2 was to be situated at the southern portion of the site. The area between the two embankments was to be used for the temporary stockpilling of the SDM. During a meeting with all the interested parties and agencies on September 8, 1998, the NJDOT requested that some of the dredged material be used for the construction of an access roadway. This item was added to the original design of the Demonstration Project. In addition, material excavated during the installation of utilities at the OENJ Site and during the wetlands mitigation activities was placed at the southern portion of Parcel G. Hence, the southern embankment (AEmbankment No. 2) was relocated towards the middle part of Parcel G. This new location for Embankment No. 2 had less compressible material thickness than the original location, thereby reducing expected settlements. A portion of Embankment No. 2 was constructed on top of competent sand which was placed for the installation of a 10-foot reinforced concrete pipe that discharges stormwater to the Newark Bay. This issue was presented to NJMR and the NJDOT during the meeting of November 13, 1998. Minor refinements and changes were made to the final design since then in order to accommodate various comments and concerns of the Interested Agencies. The final design of the Demonstration Project was presented in the Revised Final Workplan of June 11, 1999. 3.2 Initial Sampling of the Raw and Amended Dredged Material Sampling of the raw dredged material (ARDM@) and of the SDM is fully discussed in Section 7.0 of this report. The environmental sampling prior to construction consisted of the following:
MARCH 2000 PROGRESS REPORT.DOC 18
$ Analytical sampling of RDM, SDM prepared in the laboratory, and leachate from SDM generated in the laboratory. The sampling was conducted prior to dredging as required for material acceptance at the site.
$ Analytical sampling of SDM and leachate generated from SDM from samples collected at
stockpiles in Parcel G. This sampling was conducted after the actual stabilization of the material.
$ TCLP Hazardous Waste Characterization of SDM stockpiled at Parcel G. $ Organic Content tests of SDM. The geotechnical testing and monitoring prior to actual construction mainly included the following: $ Collection of RDM to evaluate geotechnical characteristics of different admixtures in the
laboratory. $ Testing of cement content in RDM. $ Extensive subsurface investigation to specify the foundation of the embankment structures
(as presented in Section 3.3 of this report). 3.3 Foundation Analysis and Final Design Pursuant to previous field investigations at Parcel G, conducted as part of the closure activities of the OENJ Redevelopment Site, the surface of Parcel G mainly consists of one foot of soil cover over 8 to 23 feet of refuse material, which overlay a 5 to 10 foot thick peat layer. The peat layer rests on sands which overlay 30 to 40 feet of clay. Due to the thickness of the compressible refuse layer, a suitable foundation was considered necessary to minimize settlements in the substrata. Furthermore, measures had to be implemented to differentiate between settlements in the substrata (foundation settlements) and settlements within the embankments. The testing requirements for this investigation are summarized in Table 7 of Appendix A of the Revised Final Workplan. Field activities needed for the foundation analysis were conducted during the months of September

MARCH 2000 PROGRESS REPORT.DOC 19
and October 1998 by Warren George, Inc. under the supervision of Soiltek. The results of the foundation study are detailed in the report entitled, AOENJ / NJDOT Embankment Demonstration Project - Site Investigation and Foundation Analysis,@ dated November 6, 1998 (referred to herein as AFoundation Geotechnical Report@), which has already been submitted to all interested parties and agencies. For ease of reference, a copy of this report can be found in Appendix C of this report. The foundation investigations mainly involved the performance of the Cone Penetration Test (ACPT@) at 15 locations. The information from the CPT was used in the determination of the site suitability for embankment load. In addition, correlation of Standard Penetration Test (ASPT@) with for soil strength correlation was conducted using data from four soil borings which were drilled to hardpan. All holes were throughly grouted and sealed after the completion of the work. Continuous soil samples were collected from each of the four borings for unified classification tests (as per ASTM D-1140, 422 and 4318) and for determining the engineering properties (strength and consolidation) of the strata. In addition, samples were subjected to triaxial tests (as per ASTM D-4767 / ASTM D-2850-87) and for consolidation tests (as per ASTM D-2435). During the performance of the CPTs, mixed refuse material covered by approximately one foot of soil cover was encountered almost throughout Parcel G. The thickness of the refuse layer varied from 8 to 23 feet. At the particular locations of the originally proposed Embankments No. 1 and No. 2, the thickness of the refuse layer was found to be approximately 19 to 20 feet and 8 to 9 feet, respectively. The refuse material consisted primarily of wood, metal, tires, paper, construction debris and soil. Some waste material excavated during various closure activities at other areas of the OENJ Redevelopment Site was also found at the southern portion of Parcel G. Common sandy fill, rather than waste material, was encountered in the vicinity of the 10-foot reinforced concrete pipe (ARCP@) that runs through Parcel G. This RCP replaced the Great Ditch as part of the OENJ Redevelopment Site=s closure activities. Peat and soft elastic clay silt were found below the refuse layer. The thickness of this soil stratum was found to range from 5 to 10 feet. Based on the CPT soundings performed, the silt layer underlay the peat layer, and consisted of silty sands to sandy silts with occasional clay. Previous investigations conducted at the OENJ Redevelopment Site encountered very stiff to hard red lean clay (approximately 30 to 40 feet thick) and hard red decomposed shale beneath the sandy formation. Finally, red brown (bedrock) of the Brunswick Formation was encountered at depths of 65 to 83 feet below ground surface[1].
[5] AReport of Preliminary Geotechnical and Foundation Study, Kapkowski Road Site@, prepared by Converse

MARCH 2000 PROGRESS REPORT.DOC 20
More information on the types of materials encountered and their engineering and physical characteristics can be found in the Soiltek Foundation Geotechnical Report in Appendix C of this report. This information will be included in the final report.
According to the Foundation Geotechnical Report: $ settlement of approximately ten inches was estimated within the refuse layer after
construction of Embankment No. 2, and,
$ settlement of approximately 18 inches within the refuse fill layer was estimated after construction of Embankment No. 1.
Based on the geotechnical analysis, it was recommended that a reinforced synthetic fabric should be placed at the base (one foot above the actual toe elevation) of Embankment No. 2 to potentially minimize the anticipated settlement of this embankment and allow for a more uniform settlement. Pre-loading was originally selected as an alternative to improve the foundation for Embankment No. 1. As a result of time limitations and field conditions, it was concluded that a reinforced synthetic fabric should also be placed at the foundation of Embankment No. 1 to potentially minimize some of the anticipated settlement and to allow even settlement. Based on the results of the foundation analysis and on the comments made by the Interested Parties during the development of the workplans, the final design was prepared and submitted. Appendix A presents the final construction drawings.
Consultants East, dated January 29, 1993; and, AReport of Geotechnical Investigation Pipe Support - Great Ditch, Metromall Site, Elizabeth, New Jersey@, prepared by Converse Consultants East, dated May 31, 1995.
MARCH 2000 PROGRESS REPORT.DOC 21
4.0 CONSTRUCTION ACTIVITIES The construction activities performed for the Demonstration Project were initiated on September 14, 1998 and completed on October 16, 1999. As previouly mentioned, the activities mainly included: $ the stabilization of the raw dredged material originated from the Union Dry Dock site;
$ the construction of the two roadway embankments (Embankment No. 1 and Embankment
No. 2) and an access roadway which were designed to simulate typical highway configurations;
$ the installation of geotechnical and environmental monitoring devices;
$ the installation of a collection system for percolating water; and,
$ the construction of a stormwater conveyance system. Environmental monitoring, sampling and testing were conducted during the stabilization of the dredged materials and also during the construction of the embankments. During construction, the monitoring activities included the collection and analysis of air, dredged material, percolated groundwater and stormwater samples. The environmental monitoring / sampling activities conducted during construction are presented briefly in this section and more extensively in Sections 6.0 and 7.0 of this report. The evaluation of the air monitoring data obtained during the construction phase is also included in Section 6.0 of this document. In addition, geotechnical testing and monitoring was performed to obtain information on the physical and engineering behavior of the material and the structures. Descriptions of the geotechnical activities are summarized in Section 5.0 of this report as presented by Soiltek Status Reports included in Appendix F. Daily reports were prepared during the construction activities. Each of these reports included the following information: $ sampling / monitoring particulars; $ daily weather conditions; $ field measurements; $ name of individual responsible for the monitoring / sampling, as well as activities being

MARCH 2000 PROGRESS REPORT.DOC 22
performed at the Site; $ on-site personnel; $ site specific observations; $ type of equipment used; $ condition of the dredged material; and, $ required efforts to achieve the required density and moisture content. A copy of the daily field reports during the actual construction of the two embankments and the access roadway from February 16 to October 19, 1999 are included in Appendix B-1. In addition, representative photographs of the construction activities are presented in Appendix B-2 of this report. 4.1 Stabilization of the Raw Dredged Material (AAAARDM@@@@) The material used for the construction of the Demonstration Project structures was dredged from the Union Dry Dock Site by the Great Lakes Dredging Company. The activities which involved the dredging of a total of approximately 81,000 cubic yards of sediments, were initiated on September 14, 1998 and were completed on November 13, 1998. Upon dredging, the RDM was loaded on a barge and transported to the pugmill at the Sealand processing facility, where it was stabilized by mixing it with 8% by wet weight Type II cement in a pugmill. The addition of cement to the RDM enhanced the workability of the material by decreasing its water content and creating a material which is easier to transport, spread, grade, compact, and disk. The SDM was then loaded onto trucks and transported to the designated areas at Parcel G. At Parcel G, the dredged material was stockpiled from October 1998 to February 1999, when the actual construction of the embankments began. 4.2 Construction of Embankments No. 1, No. 2 and Access Roadway The construction of Embankment No. 1 was initiated on June 23, 1999 with the preparation of the structure=s platform and was completed on September 30, 1999. The construction of Embankment No. 2 was initiated on February 19, 1999 and was completed on June 28, 1999. The construction of the access roadway started on June 1, 1999 and finished on July 16, 1999. The location and final configuration of the embankments and the access roadway are presented in Drawing No. 1 of Appendix A of this report.
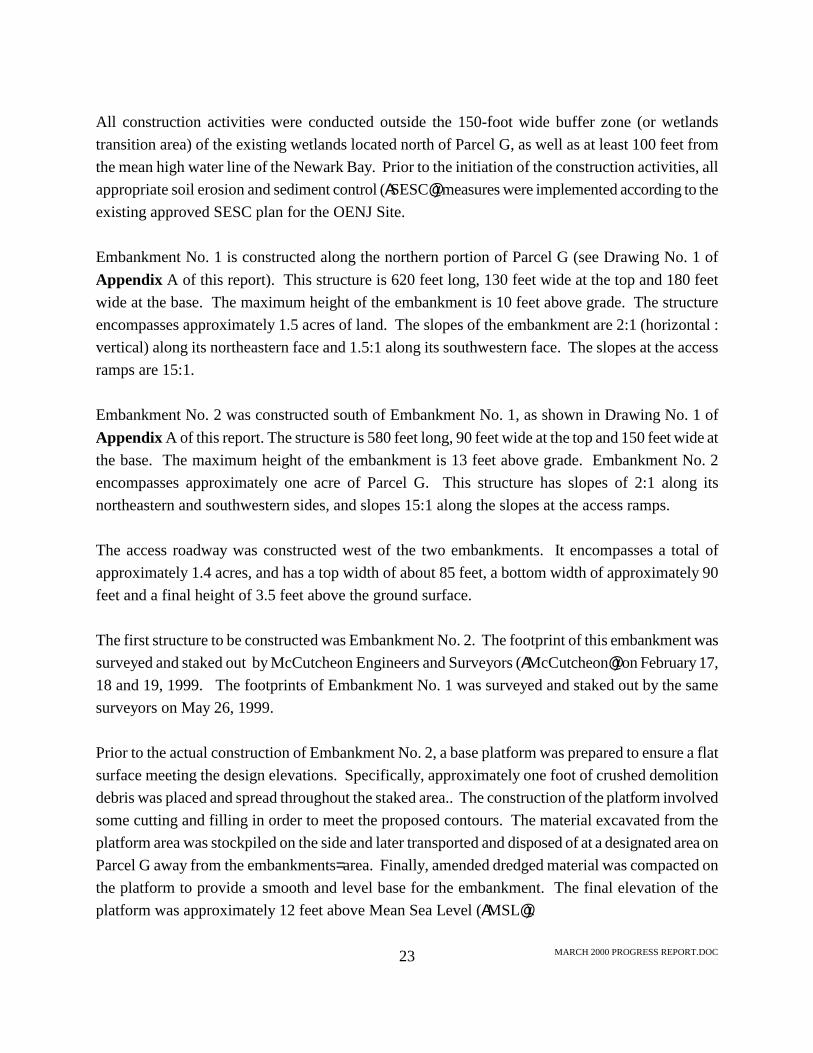
MARCH 2000 PROGRESS REPORT.DOC 23
All construction activities were conducted outside the 150-foot wide buffer zone (or wetlands transition area) of the existing wetlands located north of Parcel G, as well as at least 100 feet from the mean high water line of the Newark Bay. Prior to the initiation of the construction activities, all appropriate soil erosion and sediment control (ASESC@) measures were implemented according to the existing approved SESC plan for the OENJ Site. Embankment No. 1 is constructed along the northern portion of Parcel G (see Drawing No. 1 of Appendix A of this report). This structure is 620 feet long, 130 feet wide at the top and 180 feet wide at the base. The maximum height of the embankment is 10 feet above grade. The structure encompasses approximately 1.5 acres of land. The slopes of the embankment are 2:1 (horizontal : vertical) along its northeastern face and 1.5:1 along its southwestern face. The slopes at the access ramps are 15:1. Embankment No. 2 was constructed south of Embankment No. 1, as shown in Drawing No. 1 of Appendix A of this report. The structure is 580 feet long, 90 feet wide at the top and 150 feet wide at the base. The maximum height of the embankment is 13 feet above grade. Embankment No. 2 encompasses approximately one acre of Parcel G. This structure has slopes of 2:1 along its northeastern and southwestern sides, and slopes 15:1 along the slopes at the access ramps. The access roadway was constructed west of the two embankments. It encompasses a total of approximately 1.4 acres, and has a top width of about 85 feet, a bottom width of approximately 90 feet and a final height of 3.5 feet above the ground surface. The first structure to be constructed was Embankment No. 2. The footprint of this embankment was surveyed and staked out by McCutcheon Engineers and Surveyors (AMcCutcheon@) on February 17, 18 and 19, 1999. The footprints of Embankment No. 1 was surveyed and staked out by the same surveyors on May 26, 1999. Prior to the actual construction of Embankment No. 2, a base platform was prepared to ensure a flat surface meeting the design elevations. Specifically, approximately one foot of crushed demolition debris was placed and spread throughout the staked area.. The construction of the platform involved some cutting and filling in order to meet the proposed contours. The material excavated from the platform area was stockpiled on the side and later transported and disposed of at a designated area on Parcel G away from the embankments= area. Finally, amended dredged material was compacted on the platform to provide a smooth and level base for the embankment. The final elevation of the platform was approximately 12 feet above Mean Sea Level (AMSL@).

MARCH 2000 PROGRESS REPORT.DOC 24
Similar activities were conducted for the preparation of the base of Embankment No. 1. Based on four test pits excavated by E.E. Cruz on May 1 and May 14, 1999, the interface between the waste and the soil cover was found at a higher elevation than expected (16' above MSL). Hence, it was decided that the originally recommended base elevation of 14' MSL be changed to 16' MSL in order to avoid major cuts within the base of the embankment. Waste excavated from the outlined base of the structure were transported to the restaging area in Parcel G, south of the Great Ditch pipeline. The base of the embankment was leveled to the appropriate elevation before construction of the embankments began. The footprints for the access roadway were cleared by E.E. Cruz on May 26, 1999. Construction on the southern portion of the access road started on June 1, 1999. The platform grades were cleared by OENJ, while E.E. Cruz rolled and leveled the platform top prior to hauling the dredged material for the construction. The cuts at the southern portion averaged 6 to 8 feet. Two big concrete slabs, located at the northern side of the access roadway, were left in place. These structures were sitting on piles previously used by Walsh during other dredge process activities in this area. According to the results of the Foundation Study conducted by Soiltek, it was estimated that the total long term settlement for Embankment No. 1 and Embankment No. 2 would be 27 inches and 22 inches, respectively. Taking into consideration the site and schedule constraints, it was recommended that a reinforced geosynthetic fabric be installed at the base of each of the embankments to arrest some of the anticipated settlements and allow for a more uniform settlement. The selected reinforced geosynthetic fabric was PET GEOTEX 6x6 GEOTEXTILE, which was provided by Synthetic Industries, Inc. The fabric was installed according to the manufacturer=s specifications, under the supervision of Soiltek, in Embankment No. 1 on July 9, 1999 at elevation 18' MSL and in Embankment No. 2 on April 27, 1999 at elevation 14' MSL. The placement of the first 12-inch lift for Embankment No. 2 started on March 29, 1999. The initiation of the construction activities experienced some delays due to extensive rain, snow and cold conditions. All the lifts of Embankment No. 2 were 12-inch thick, with the exception of the third lift (14' - 15.5') which was 18 inches to further protect the installed reinforcing fabric during the disking and compacting procedures. The placement of the first 12-inch lift for the access roadway started on June 1 at elevation 15' MSL. All lifts were 12-inch thick. The placement of the first 12-inch lift for Embankment No. 1 started on June 23, 1999 at elevation 16' MSL. All the lifts of Embankment No. 1 were 12-inch thick with the exception of the third lift
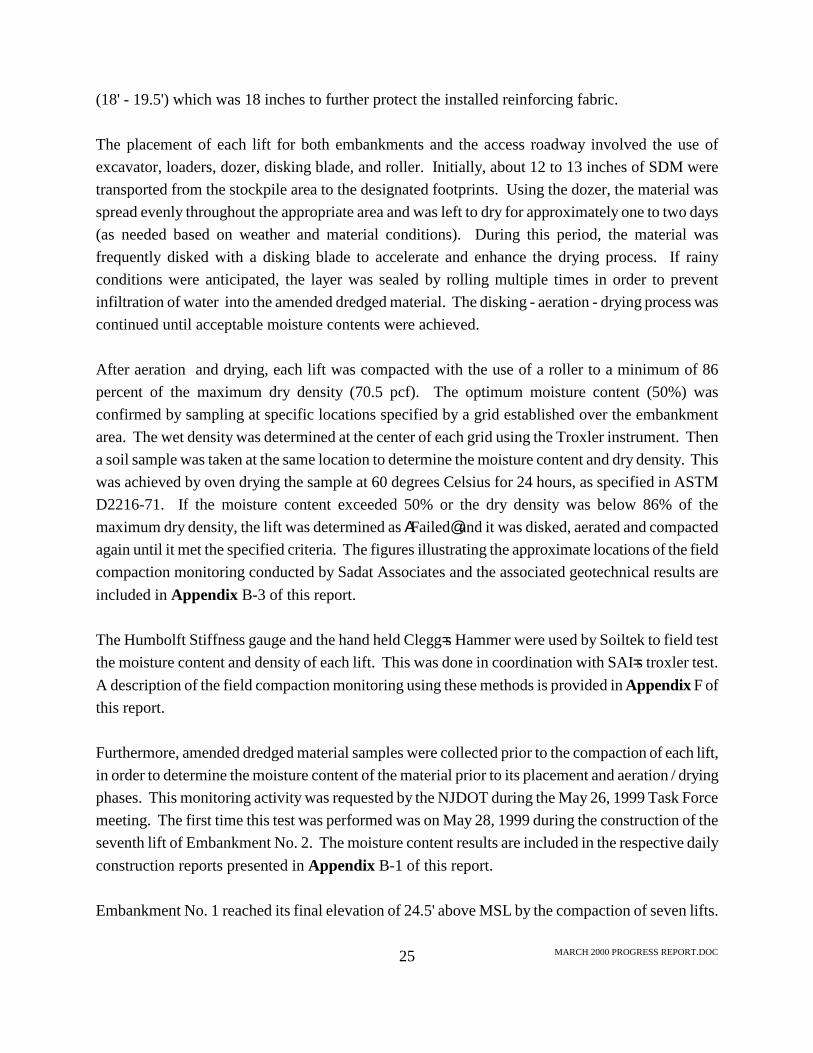
MARCH 2000 PROGRESS REPORT.DOC 25
(18' - 19.5') which was 18 inches to further protect the installed reinforcing fabric. The placement of each lift for both embankments and the access roadway involved the use of excavator, loaders, dozer, disking blade, and roller. Initially, about 12 to 13 inches of SDM were transported from the stockpile area to the designated footprints. Using the dozer, the material was spread evenly throughout the appropriate area and was left to dry for approximately one to two days (as needed based on weather and material conditions). During this period, the material was frequently disked with a disking blade to accelerate and enhance the drying process. If rainy conditions were anticipated, the layer was sealed by rolling multiple times in order to prevent infiltration of water into the amended dredged material. The disking - aeration - drying process was continued until acceptable moisture contents were achieved. After aeration and drying, each lift was compacted with the use of a roller to a minimum of 86 percent of the maximum dry density (70.5 pcf). The optimum moisture content (50%) was confirmed by sampling at specific locations specified by a grid established over the embankment area. The wet density was determined at the center of each grid using the Troxler instrument. Then a soil sample was taken at the same location to determine the moisture content and dry density. This was achieved by oven drying the sample at 60 degrees Celsius for 24 hours, as specified in ASTM D2216-71. If the moisture content exceeded 50% or the dry density was below 86% of the maximum dry density, the lift was determined as AFailed@ and it was disked, aerated and compacted again until it met the specified criteria. The figures illustrating the approximate locations of the field compaction monitoring conducted by Sadat Associates and the associated geotechnical results are included in Appendix B-3 of this report. The Humbolft Stiffness gauge and the hand held Clegg=s Hammer were used by Soiltek to field test the moisture content and density of each lift. This was done in coordination with SAI=s troxler test. A description of the field compaction monitoring using these methods is provided in Appendix F of this report. Furthermore, amended dredged material samples were collected prior to the compaction of each lift, in order to determine the moisture content of the material prior to its placement and aeration / drying phases. This monitoring activity was requested by the NJDOT during the May 26, 1999 Task Force meeting. The first time this test was performed was on May 28, 1999 during the construction of the seventh lift of Embankment No. 2. The moisture content results are included in the respective daily construction reports presented in Appendix B-1 of this report. Embankment No. 1 reached its final elevation of 24.5' above MSL by the compaction of seven lifts.
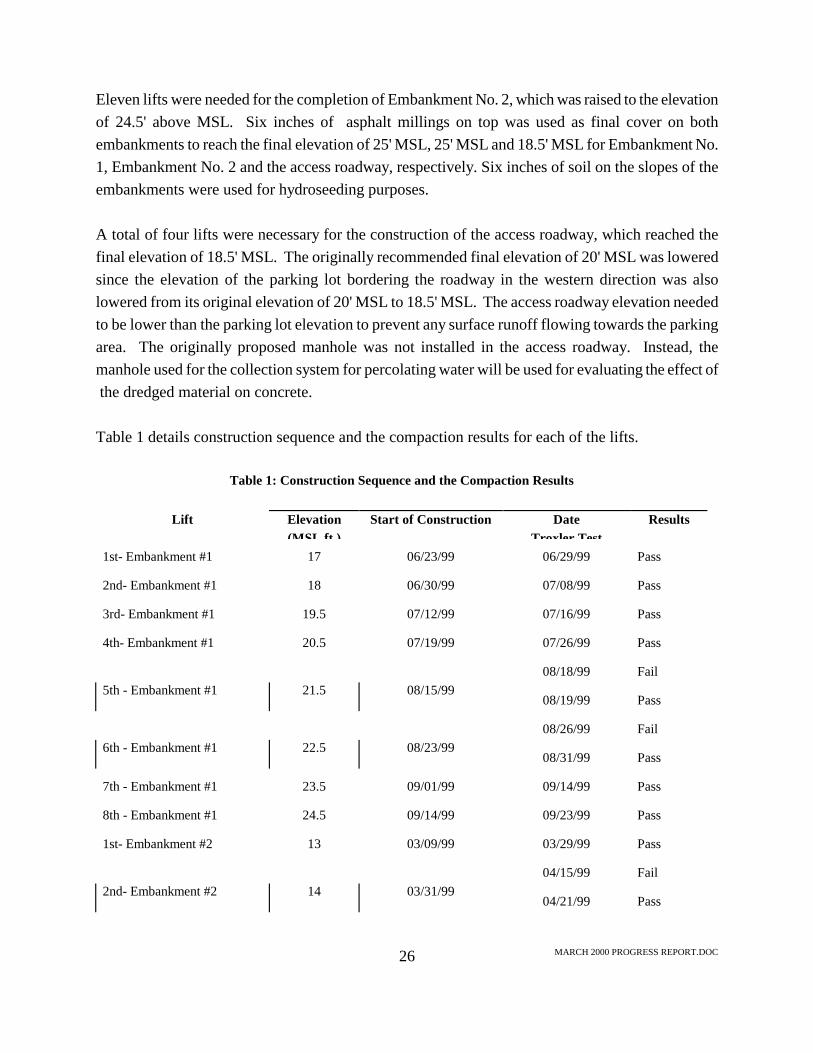
MARCH 2000 PROGRESS REPORT.DOC 26
Eleven lifts were needed for the completion of Embankment No. 2, which was raised to the elevation of 24.5' above MSL. Six inches of asphalt millings on top was used as final cover on both embankments to reach the final elevation of 25' MSL, 25' MSL and 18.5' MSL for Embankment No. 1, Embankment No. 2 and the access roadway, respectively. Six inches of soil on the slopes of the embankments were used for hydroseeding purposes. A total of four lifts were necessary for the construction of the access roadway, which reached the final elevation of 18.5' MSL. The originally recommended final elevation of 20' MSL was lowered since the elevation of the parking lot bordering the roadway in the western direction was also lowered from its original elevation of 20' MSL to 18.5' MSL. The access roadway elevation needed to be lower than the parking lot elevation to prevent any surface runoff flowing towards the parking area. The originally proposed manhole was not installed in the access roadway. Instead, the manhole used for the collection system for percolating water will be used for evaluating the effect of the dredged material on concrete. Table 1 details construction sequence and the compaction results for each of the lifts.
Table 1: Construction Sequence and the Compaction Results
Lift Elevation
(MSL ft )Start of Construction Date
Troxler TestResults
1st- Embankment #1
17 06/23/99 06/29/99
Pass
2nd- Embankment #1
18 06/30/99 07/08/99
Pass
3rd- Embankment #1
19.5 07/12/99 07/16/99
Pass
4th- Embankment #1
20.5 07/19/99 07/26/99
Pass
08/18/99 Fail
5th - Embankment #1
21.5
08/15/99 08/19/99
Pass
08/26/99 Fail
6th - Embankment #1
22.5
08/23/99 08/31/99
Pass
7th - Embankment #1
23.5 09/01/99 09/14/99
Pass
8th - Embankment #1
24.5 09/14/99 09/23/99
Pass
1st- Embankment #2
13 03/09/99 03/29/99
Pass
04/15/99 Fail
2nd- Embankment #2
14
03/31/99 04/21/99
Pass

MARCH 2000 PROGRESS REPORT.DOC 27
Table 1: Construction Sequence and the Compaction Results
Lift Elevation (MSL ft )
Start of Construction Date Troxler Test
Results
3rd- Embankment #2
15.5 04/28/99 05/05/99
Pass
05/11/99 Fail
4th- Embankment #2
16.5
05/06/99 05/12/99
Pass
5th- Embankment #2
17.5 05/13/99 05/17/99
Pass
05/21/99 Fail
6th- Embankment #2
18.5
05/18/99 05/27/99
Pass
06/02/99 Fail
7th- Embankment #2
19.5
05/28/99 06/07/99
Pass
06/09/99 Fail
8th- Embankment #2
20.5
06/07/99 06/11/99
Pass
9th- Embankment #2
21.5 06/14/99 06/16/99
Pass
10th- Embankment #2
22.5 06/17/99 06/23/99
Pass
11th- Embankment #2
23.5 06/25/99 06/30/99
Pass
12th- Embankment #2
24.5 07/06/99 07/19/99
Pass
1st- Access Roadway
15 06/08/99 06/28/99
Pass
2nd- Access Roadway
16 06/28/99 07/06/99
Pass
3rd- Access Roadway
17 07/07/99 07/13/99
Pass
4th- Access Roadway
18 07/14/99 07/26/99
Pass
Upon completion of the construction of the two embankments and the access roadway, the contractor concentrated on regrading and finishing the slopes of the structures. As previously mentioned, approximately six to eight inches of topsoil were placed on the slopes of the embankments. This material had already been chemically analyzed and met the protocol requirements established for acceptance as recyclable material at the OENJ Redevelopment Site. In addition, recycled asphalt milling was spread on top of the access roadway and the embankments to simulate the actual roadway conditions. Topsoil was also placed in the wetlands transition area, as well as in the stormwater ditches. The construction of the Demonstration Project was completed on October 19, 1999.
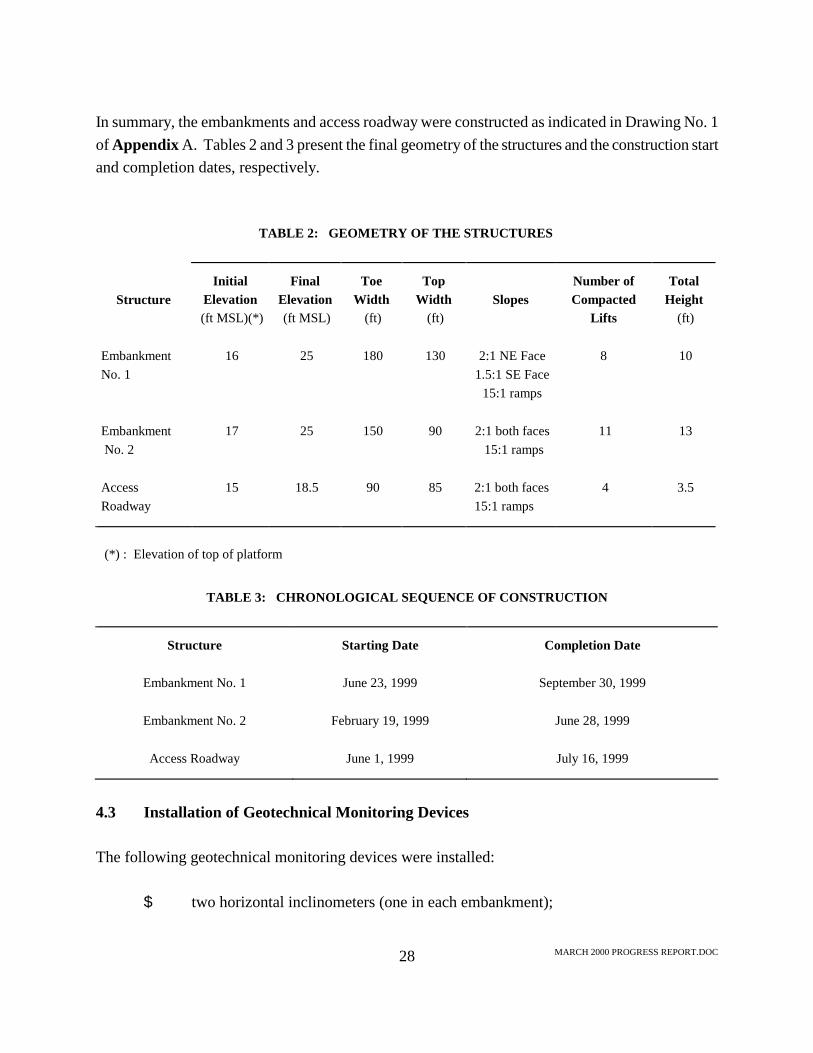
MARCH 2000 PROGRESS REPORT.DOC 28
In summary, the embankments and access roadway were constructed as indicated in Drawing No. 1 of Appendix A. Tables 2 and 3 present the final geometry of the structures and the construction start and completion dates, respectively.
TABLE 2: GEOMETRY OF THE STRUCTURES
Structure
Initial
Elevation (ft MSL)(*)
Final
Elevation (ft MSL)
Toe
Width (ft)
Top
Width (ft)
Slopes
Number of Compacted
Lifts
Total
Height (ft)
Embankment No. 1
16
25
180
130
2:1 NE Face
1.5:1 SE Face 15:1 ramps
8
10
Embankment No. 2
17
25
150
90
2:1 both faces 15:1 ramps
11
13
Access Roadway
15
18.5
90
85
2:1 both faces 15:1 ramps
4
3.5
(*) : Elevation of top of platform
TABLE 3: CHRONOLOGICAL SEQUENCE OF CONSTRUCTION
Structure
Starting Date
Completion Date
Embankment No. 1
June 23, 1999
September 30, 1999
Embankment No. 2
February 19, 1999
June 28, 1999
Access Roadway
June 1, 1999
July 16, 1999
4.3 Installation of Geotechnical Monitoring Devices The following geotechnical monitoring devices were installed:
$ two horizontal inclinometers (one in each embankment);

MARCH 2000 PROGRESS REPORT.DOC 29
$ four vertical inclinometers (two in each embankment); and, $ fifteen (15) settlement plates (six in Embankment No. 1 and nine in Embankment No.
2) The monitoring equipment was installed under the supervision of Soiltek and Sadat Associates. The installation of the horizontal inclinometers, which was conducted under the supervision of Soiltek, involved the opening of a trench in the middle of each embankment=s footprint and the placement of a 3-inch sand layer at the bottom of the trench. The horizontal inclinometer was placed in the middle of the trench. The trench was backfilled with 4" of sand overlain by dredged material. The horizontal inclinometers for Embankment No. 2 and Embankment No. 1 were installed on April 26, 1999 at elevation 13' MSL, and on July 8, 1999 at elevation 17' MSL, respectively. On September 23, 1999, 6-foot diameter pipe sections were installed as protective casings for the exposed sections of the horizontal inclinometers in order to prevent any mud from flowing into the trenches. The approximate locations of the horizontal inclinometers are presented in Drawing No.5 of Appendix A of this report. The vertical inclinometers were installed under the supervision of Soiltek on November 1 and 2, 1999. The approximate locations of these inclinometers are illustrated in Drawing No.5 of Appendix A of this report. The locations of the settlement plates were flagged by McCutcheon on various dates. The installation was performed under the supervision of Sadat Associates. A total of fifteen settlement plates (#1 through #15) were installed at both the embankments (see Drawing No. 5 of Appendix A). The purpose of the settlement plates was to differentiate settlements which may occur in the foundation of the embankments from those occurring within the embankments. In order to evaluate the latter, three additional settlement plates were installed within Embankment No. 2. The settlement base and support plates were manufactured of carbon steel meeting ASTM A36 standards. The telltale pipe was one of standard weight, Schedule 40, and carbon steel meeting ASTM A53, Grade B standards. The protective floating casing had a Schedule 80 and was made of Polyvinyl Chloride (PVC) meeting ASTM D1784, Type 1, Grade 1 standards. The telltale pipe was welded to the base of the settlement plates by E.E. Cruz. The protective casings were installed around the telltale pipe to provide frictionless and free vertical movement of the settlement plates. Every precaution was taken during the construction of subsequent lifts to protect the settlement plates. The material surrounding the settlement plate riser was placed to prevent any damage and to avoid
MARCH 2000 PROGRESS REPORT.DOC 30
moving the riser pipe. On April 27, 1999, the six settlement plates (#1 through #6) in Embankment No. 2 were installed at elevation 14' MSL above the reinforcing fabric. On May 28, 1999, settlement plates #7 and #8 were installed in the same embankment at elevation 18.5' MSL. On July 6, 1999, settlement plate #9 was installed in Embankment No. 2 at elevation 23.5' MSL. On July 13, 1999, all six settlement plates (#10 through #15) were installed in Embankment No. 1 at elevation 18' MSL. The first readings on the settlement plates of Embankment No. 2 were taken by McCutcheon on May 17, 1999. The first readings on the settlement plates of Embankment No. 1 were taken by the same surveyors on July 13, 1999. So far, monitoring data of the settlement plates have been collected on the following dates: May, 17, 1999, June 1, 1999, July 9, 1999, July 14, 1999, July 21, 1999, July 30, 1999, August 16, 1999, August 30, 1999, September 13, 1999, October 4, 1999, October 18, 1999, November 15, 1999, December 15, 1999 and January 21, 2000. The readings have been submitted to Soiltek for review and evaluation. Further information on the installation of the geotechnical monitoring devices and the associated monitoring data is provided in Appendix F of this report. The location of the geotechnical monitoring devices are shown in Drawing No.5 of Appendix A. A summary on the information associated with the geotechnical monitoring equipment installed for the Demonstration Project is presented in Table 4.

MARCH 2000 PROGRESS REPORT.DOC 31
TABLE 4: SUMMARY DATA OF GEOTECHNICAL MONITORING DEVICES Geotechnical
Device
Date of
Installation
Location
Bottom
Elevation (ft MSL)
Horizontal Inclinometer No. 1
April 26, 1999
Embankment No. 2
13
Horizontal Inclinometer No. 2
July 8, 1999
Embankment No. 1
17
Vertical Inclinometer VI-1
November 1, 1999
Embankment No. 2
Vertical Inclinometer VI-2
November 1, 1999
Embankment No. 2
Vertical Inclinometer VI-3
November 2, 1999
Embankment No. 1
Vertical Inclinometer VI-1
November 2, 1999
Embankment No. 1
Settlement Plate #1
April 27, 1999
Embankment No. 2
14
Settlement Plate #2
April 27, 1999
Embankment No. 2
14
Settlement Plate #3
April 27, 1999
Embankment No. 2
14
Settlement Plate #4
April 27, 1999
Embankment No. 2
14
Settlement Plate #5
April 27, 1999
Embankment No. 2
14
Settlement Plate #6
April 27, 1999
Embankment No. 2
14
Settlement Plate #7
May 28, 1999
Embankment No. 2
18.5
Settlement Plate #8
May 28, 1999
Embankment No. 2
18.5
Settlement Plate #9
July 6, 1999
Embankment No. 2
23.5
Settlement Plate #10
July 13. 1999
Embankment No. 1
18
Settlement Plate #11
July 13. 1999
Embankment No. 1
18
Settlement Plate #12
July 13. 1999
Embankment No. 1
18
Settlement Plate #13 July 13. 1999 Embankment No. 1
18
Settlement Plate #14
July 13. 1999
Embankment No. 1
18

MARCH 2000 PROGRESS REPORT.DOC 32
Geotechnical
Device
Date of
Installation
Location
Bottom
Elevation (ft MSL)
Settlement Plate #15
July 13. 1999
Embankment No. 1
18
4.3 Installation of Air Monitoring Devices As part of the air monitoring program, a meteorological (weather) station was installed by E.E. Cruz in April of 1999 in Parcel G of the OENJ Redevelopment Site. Daily meteorological data were recorded for temperature, wind speed and wind direction using a Weather Monitor II meteorological station. The Weather Monitor was initially installed 30 feet above the ground surface near the footprint of Embankment No. 2. However, the final height of the Weather Monitor was approximately 22 feet above ground due to successive regrading of Parcel G. The weather station was used primarily to determine site-specific upwind and downwind directions for the positioning of area samplers, as well as to correlate the sampling data with site-specific meteorological events. After the air sampling program was completed, the Weather Monitor was disassembled and removed from the Site. 4.5 Installation of Collection Systems for Percolating Water Water collection systems were installed at the base of Embankment No. 1 and Embankment No. 2 to collect any liquid that could percolate through the embankments. Each of these systems consists of lateral 3/8-inch crushed stone trenches that direct the percolated groundwater into the main 4-inch PVC perforated pipe. The collection systems for percolating water were designed and constructed to run along the length of each of the embankments to a manhole and then to an existing 6-inch HDPE leachate cleanout pipe. On April 6, 1999, McCutcheon laid out the locations of the collection system for percolating water for Embankment No. 2. The installation of the collection system for percolating water for Embankment No. 2 started on April 16, 1999 at the elevation of 14' MSL and was completed on April 26, 1999. A slope of 0.15 % was maintained both for the lateral trenches and the main pipeline.
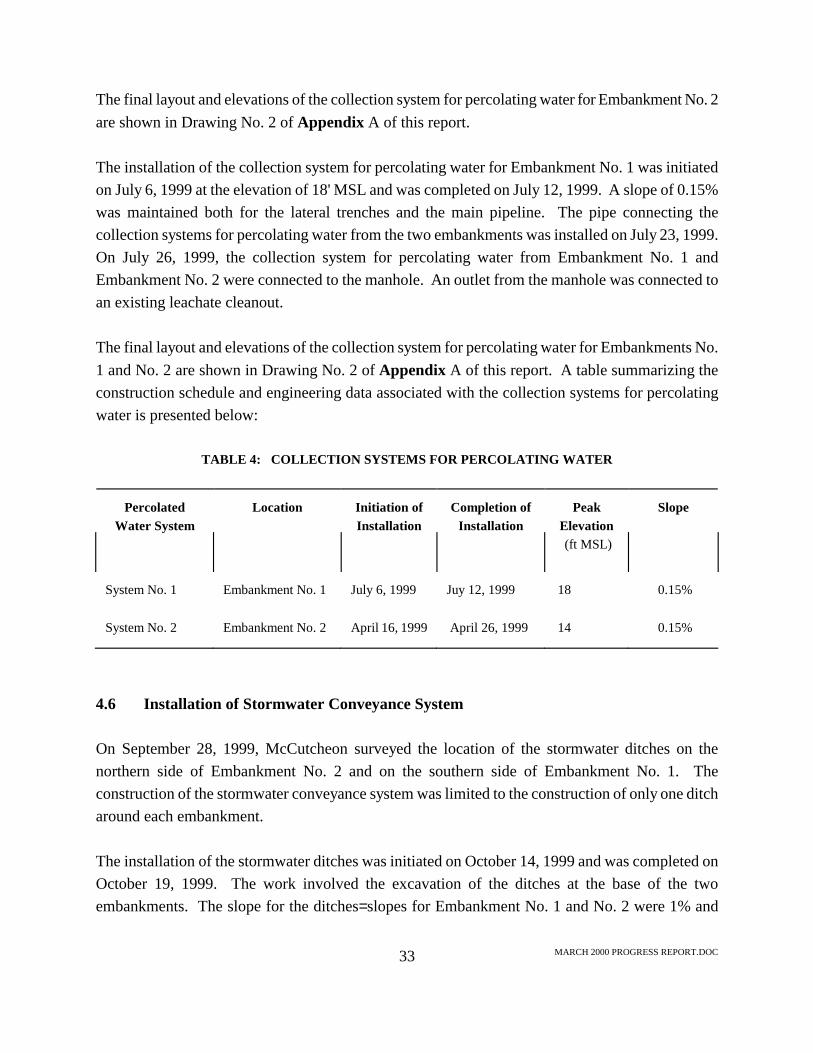
MARCH 2000 PROGRESS REPORT.DOC 33
The final layout and elevations of the collection system for percolating water for Embankment No. 2 are shown in Drawing No. 2 of Appendix A of this report. The installation of the collection system for percolating water for Embankment No. 1 was initiated on July 6, 1999 at the elevation of 18' MSL and was completed on July 12, 1999. A slope of 0.15% was maintained both for the lateral trenches and the main pipeline. The pipe connecting the collection systems for percolating water from the two embankments was installed on July 23, 1999. On July 26, 1999, the collection system for percolating water from Embankment No. 1 and Embankment No. 2 were connected to the manhole. An outlet from the manhole was connected to an existing leachate cleanout. The final layout and elevations of the collection system for percolating water for Embankments No. 1 and No. 2 are shown in Drawing No. 2 of Appendix A of this report. A table summarizing the construction schedule and engineering data associated with the collection systems for percolating water is presented below:
TABLE 4: COLLECTION SYSTEMS FOR PERCOLATING WATER
Percolated
Water System
Location
Initiation of Installation
Completion of
Installation
Peak
Elevation (ft MSL)
Slope
System No. 1
Embankment No. 1
July 6, 1999
Juy 12, 1999
18
0.15%
System No. 2
Embankment No. 2
April 16, 1999
April 26, 1999
14
0.15%
4.6 Installation of Stormwater Conveyance System On September 28, 1999, McCutcheon surveyed the location of the stormwater ditches on the northern side of Embankment No. 2 and on the southern side of Embankment No. 1. The construction of the stormwater conveyance system was limited to the construction of only one ditch around each embankment. The installation of the stormwater ditches was initiated on October 14, 1999 and was completed on October 19, 1999. The work involved the excavation of the ditches at the base of the two embankments. The slope for the ditches= slopes for Embankment No. 1 and No. 2 were 1% and
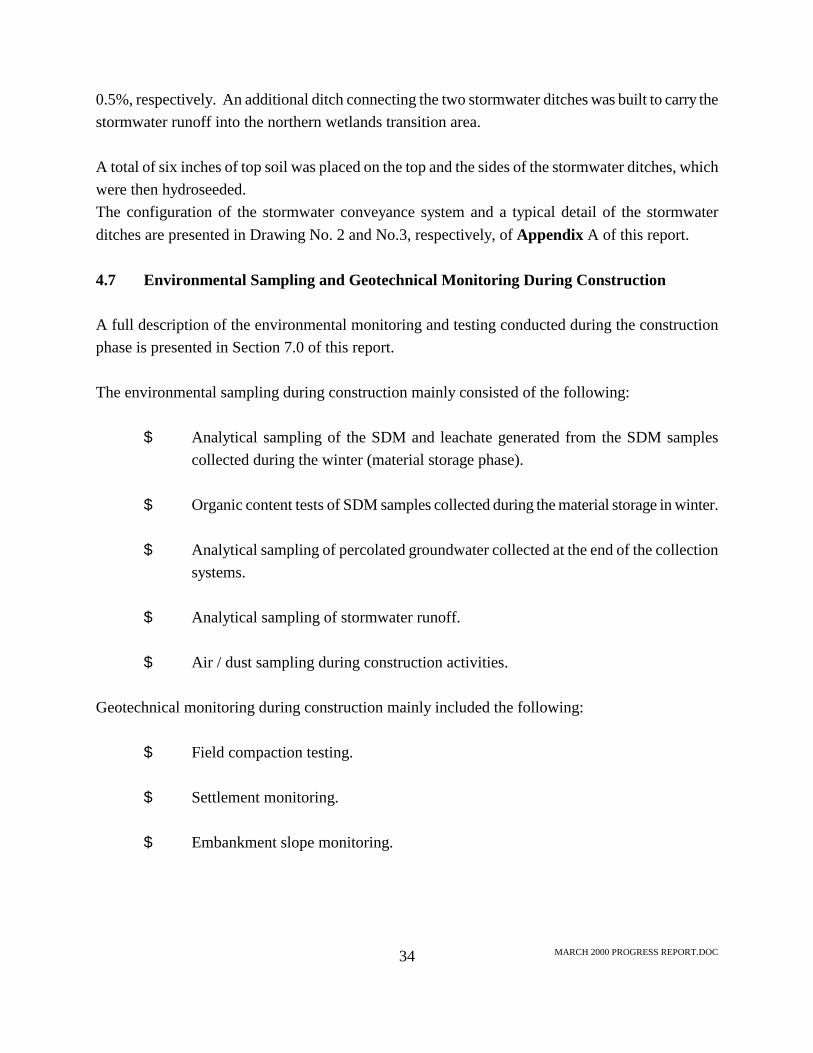
MARCH 2000 PROGRESS REPORT.DOC 34
0.5%, respectively. An additional ditch connecting the two stormwater ditches was built to carry the stormwater runoff into the northern wetlands transition area. A total of six inches of top soil was placed on the top and the sides of the stormwater ditches, which were then hydroseeded. The configuration of the stormwater conveyance system and a typical detail of the stormwater ditches are presented in Drawing No. 2 and No.3, respectively, of Appendix A of this report. 4.7 Environmental Sampling and Geotechnical Monitoring During Construction A full description of the environmental monitoring and testing conducted during the construction phase is presented in Section 7.0 of this report. The environmental sampling during construction mainly consisted of the following:
$ Analytical sampling of the SDM and leachate generated from the SDM samples collected during the winter (material storage phase).
$ Organic content tests of SDM samples collected during the material storage in winter.
$ Analytical sampling of percolated groundwater collected at the end of the collection
systems.
$ Analytical sampling of stormwater runoff.
$ Air / dust sampling during construction activities. Geotechnical monitoring during construction mainly included the following:
$ Field compaction testing.
$ Settlement monitoring.
$ Embankment slope monitoring.

MARCH 2000 PROGRESS REPORT.DOC 35
4.8 Construction Cost Estimation As presented in the geotechnical section of this report, the SDM is sensitive to moisture. If the dredge material failed the compaction criteria at a general location, it most likely failed the criteria due to excessive moisture content, rather than not reaching the criteria for maximum dry density. Consequently, a great portion of the construction activities was dedicated to drying the SDM to acceptable water content levels. Some concerns about the efforts and costs associated with this activity have been raised by the NJDOT. In fact, during the Task Force meeting of May 26, 1999, NJDOT suggested that SAI monitor the moisture contents of the SDM before construction of the embankments. The objective of the water content monitoring was to compare the efforts and costs associated with handling of the dredged material to those associated with handling of conventional materials used for the construction of subbase in roadway projects. On May 28, 1999, SAI began collecting samples to determine initial moisture content. At least two SDM samples from each stockpile were collected before construction. The following construction activities were initially considered for the evaluation of the construction efforts: $ trucking and hauling; $ spreading; $ disking and drying; and $ compaction. Timing for the performance of these activities was monitored for each 12-inch lift. In addition, ambient temperature, rain events, and other associated factors, such as equipment downtime and HASP implementation, were observed and monitored. The following assumptions were made in preparing the cost estimate. $ Material costs were not considered since the purpose of this evaluation was to assess
incremental costs due to material workability. In addition, costs for trucking and hauling were not considered since these costs are generally similar to those associated with conventional materials.
$ The equipment and labor cost for spreading, disking and compaction were included in the
cost estimation since these costs are directly associated with the handling of SDM exhibiting

MARCH 2000 PROGRESS REPORT.DOC 36
high water content. The costs of the equipment and labor are the actual charges by the subcontractors.
$ No additional costs for geotechnical and environmental testing, engineering supervision,
construction management, and overhead and profit were considered because these activities were considered similar to other construction activities (i.e., compaction testing) or project-specific.
On an average, each lift of SDM was spread in two days. Disking and compacting generally took two to four days before meeting construction specifications. The number of days for the drying, aerating and compacting efforts depended on the initial moisture content and weather conditions. The cost estimation is summarized in Table B-4-1 of Appendix B-4. The overall construction cost for one cubic yard of the dredged material was estimated to be approximately $8.10. As expected, the cost per cubic yard varied for each lift depending on the volume of the dredged material, initial moisture content, and the weather conditions. During rain events, the construction of each lift took longer. A measurable correlation can be established between the construction cost and rain events. Based on the construction periods of rain events and no rain events, the cost analysis was further divided into two groups as presented in Tables B-4-2 and B-4-3 of Appendix B-4, respectively. The cost associated with the lift which experienced rain events during the construction period was estimated as $8.60 per cubic yard as compared to the $7.50 per cubic yard of the lift which experienced no rain event. The costs associated with spreading and compacting a conventional material used for the construction of subbase in the roadway projects were estimated using MEANS CostWorks 1999 for a project site in Elizabeth Township, New Jersey. The costs for handling one cubic yard of a conventional material were estimated to be approximately $2.00. The costs associated with the handling of dredged material are three to four times higher than the costs associated with the handling of a conventional material. The high costs associated with the dredged materials can be possibly reduced by using different drying methods during the mixing and stabilization of the RDM. The temporary storing of the dredged material during periods of dry and warm weather will help reduce the initial moisture content by minimizing the use of equipment and labor for the on-site aerating and drying of SDM. 5.0 GEOTECHNICAL MONITORING ACTIVITIES

MARCH 2000 PROGRESS REPORT.DOC 37
Geotechnical monitoring has been conducted to confirm or obtain new information on the engineering characteristics and behavior of the SDM when used in the construction of embankments. As indicated in Section 2 of this report, geotechnical monitoring and evaluation are being conducted by Soiltek, Inc., under the direction of Dr. Ali Maher. Geotechnical monitoring conducted prior to, during, and after construction mainly include: $ cement content testing; $ subsurface investigation for design of the foundation; $ laboratory testing of SDM strength parameters; $ field compaction monitoring; $ settlement monitoring; $ inclinometer monitoring; and, $ cone penetrometer testing for long-term strength evaluation. The project scedule at which these tests and evaluations have been performed is indicated in the Project Flow Chart presented in Section 1.4 of this report. Prior to construction, a subsurface investigation was conducted to specify the foundation improvement needed to assure stability of the embankments and to ascertain that the foundation settlements would not interfere with the structural analysis of the embankments. The recommendations made in the foundation analysis were incorporated in the final design for construction. This investigation is considered site-specific and is not directly relevant to evaluating engineering properties of the SDM when used in construction of embankments. This section summarizes the geotechnical activities related to characterizing the SDM and the structural behavior of the embankments. A complete description of the status of the geotechnical investigations has been presented by Soiltek, Inc., in a separate report entitled AStatus of Geotechnical Investigations@ dated January 31, 2000 (Soiltek Status Report). A copy of the Soiltek Status Report is included in Appendix F of this report. 5.1 Cement Content Monitoring Field investigations to confirm the cement content in the cement-SDM mixed at the Sealand processing facility was initiated on September 29 and was completed on November 10, 1998. These

MARCH 2000 PROGRESS REPORT.DOC 38
activities were conducted in order to evaluate the homogeneity of the mixture. Stabilized dredged samples were collected at a frequency of one sample for every 1,000 cubic yards of SDM (almost on a daily basis). The cement content was determined in the laboratory using the Standard Test Method for Cement Content of Soil - Cement Mixtures (ASTM D 806-96). The targeted cement content of 8% was used as the basis for the comparison of the results. A detailed description of the work conducted and the results obtained is presented in the report entitled, ACement Content Determination of OENJ Amended Dredge in Elizabeth, New Jersey@, prepared by Soiltek, and dated January 25, 1999. Generally, the results indicate that the cement content ranged from 1% to 21% with an average cement content of more than 8%. A copy of this report is attached in Appendix D. 5.2 Geotechnical Laboratory Investigation Laboratory testing needed to determine construction specifications was previously presented in the Revised Final Workplan. The status of the laboratory investigations is presented in the Soiltek Status Report included in Appendix F. When the pilot project was first developed, the use of three different mixtures of SDM was proposed in the construction of the Embankments and temporary access roadway. Each mixture was to contain different percentages of cement and fly ash. Conceptually, it was anticipated that it would be necessary to add both cement and flyash to the raw dredged material to obtain the optimum workability of the dredged material when long term storage was needed. However, experience with the 8% cement-SDM during the stabilization, stockpiling, and aeration phases revealed that the SDM behaves comparably to typical soils when stored for long periods of time. As such, the addition of fly ash to the mixture in the field to enhance its workability was not considered necessary. Based on the results of the preliminary laboratory tests, past experience with the SDM, and the project logistics, it was decided that the Demonstration Project would be performed using a single admixture, containing 8% cement and no fly ash. However, to obtain additional information on the properties of different admixtures, a geotechnical laboratory investigation is being performed on the following admixtures (which may be considered for use in future projects or comparison purposes when evaluating the structural integrity of the embankments):
(a) Mix A consisting of dredged material with 8% cement;

MARCH 2000 PROGRESS REPORT.DOC 39
(b) Mix B consisting of dredged material with 8% cement and 10% fly ash; and
(c) Mix C consisting of dredged material with 4% cement. The purpose of this investigation is to evaluate the engineering behavior of each mixture when the percent cement is reduced and determine any potential additional benefits (workability and/or strength) resulting from the addition of fly ash to the SDM. According to the Revised Workplan, the geotechnical laboratory work would consist of the following tests and frequencies: Round A: Lab Tests at 85% of the Modified Proctor between 2 and 1 Month Curing Time (for
Mixes A, B & C) Unified Classification (ASTM D-1140, 422, 4318) 3 samples per mix Strength (Triaxial @ Points) (ASTM D-4767) 3 samples per mix Swell Pressure (ASTM D-4546) 3 samples per mix Consolidation (ASTM D-2435) 3 samples per mix Resilient Modulus (MR AASHTO T74) 3 samples per mix Permeability (ASTM D-5084) 3 samples per mix Compaction (ASTM D-1557) 3 samples per mix Durability (ASTM D-559) 3 samples per mix
Round B: Lab Tests at 90% of the Modified Proctor between 2 and 1 Month Curing Time (for
Mixes A, B & C) Unified Classification (ASTM D-1140, 422, 4318) 3 samples per mix Strength (Triaxial @ Points) (ASTM D-4767) 3 samples per mix Swell Pressure (ASTM D-4546) 3 samples per mix Consolidation (ASTM D-2435) 3 samples per mix Resilient Modulus (MR AASHTO T74) 3 samples per mix Permeability (ASTM D-5084) 3 samples per mix Compaction (ASTM D-1557) 3 samples per mix Durability (ASTM D-559) 3 samples per mix
Round C: Lab Tests at 85% of the Modified Proctor between 4 and 6 Months Curing Time (for
Mixes A, B & C) Unified Classification (ASTM D-1140, 422, 4318) 3 samples per mix Strength (Triaxial @ Points) (ASTM D-4767) 3 samples per mix

MARCH 2000 PROGRESS REPORT.DOC 40
Swell Pressure (ASTM D-4546) 3 samples per mix Consolidation (ASTM D-2435) 3 samples per mix Resilient Modulus (MR AASHTO T74) 3 samples per mix Permeability (ASTM D-5084) 3 samples per mix Compaction (ASTM D-1557) 3 samples per mix Durability (ASTM D-559) 3 samples per mix
Round D: Lab Tests at 90% of the Modified Proctor between 4 and 6 Months Curing Time (for
Mixes A, B & C) Unified Classification (ASTM D-1140, 422, 4318) 3 samples per mix Strength (Triaxial @ Points) (ASTM D-4767) 3 samples per mix Swell Pressure (ASTM D-4546) 3 samples per mix Consolidation (ASTM D-2435) 3 samples per mix Resilient Modulus (MR AASHTO T74) 3 samples per mix Permeability (ASTM D-5084) 3 samples per mix Compaction (ASTM D-1557) 3 samples per mix Durability (ASTM D-559) 3 samples per mix
The determination of the appropriate compaction criteria for the construction of the roadway and embankments was based on the results of geotechnical testing performed on the mixes. Specifically, laboratory tests at 85% and 90% of the Modified Proctor were conducted to determine moisture and density requirements for the compaction of the SDM. By evaluating the results of the laboratory work conducted in Rounds A and B, the optimum dry density for the 8% cement SDM was determined to be 70.5 pcf. For the construction of the roadway and the embankments a minimum dry density of 86% of the optimum dry density and a maximum allowable moisture content of 50% were established to ensure proper compaction of the material. As previously mentioned, the Status of the laboratory investigations have been included in the Soiltek Status Report which is presented in Appendix F. The results of the geotechnical laboratory testing will be presented in detail in the final geotechnical report to be prepared at the completion of the Demonstration Project. 5.3 Geotechnical Field Monitoring The geotechnical field testing has included the following activities:

MARCH 2000 PROGRESS REPORT.DOC 41
$ Field compaction monitoring
$ Settlement monitoring
$ Embankment Field Monitoring Preliminary results of the geotechnical testing are included in the Soiltek Status Report attached to Appendix F of this report. 5.3.1 Field Compaction Monitoring During the construction, field tests were performed to determine moisture content and density using the Troxler Test, the Humboldt Stiffness Gauge and the Clegg Impact Hammer. In the field, the Humboldt Stiffness Gauge and the Clegg Impact Hammer tests were performed by Soiltek, while the Troxler Test was performed by Sadat Associates. The tests were conducted upon compaction of each 12-inch lift until each lift met both the dry density and moisture content criteria. Descriptions of the testing and results are presented in Appendix F of this report. Troxler and Moisture Content Tests The Troxler Nuclear Gage Density Instrument is capable of directly measuring the wet density and moisture content of soils and calculating the dry density based on these parameters. Past experience with the use of this unit to measure these parameters in cement-SDM indicate that moisture, and consequently dry density values obtained in the field are not always accurate. To overcome this deficiency, wet density, dry density and moisture field values were measured as follows: $ A 60-foot by 60-foot grid system was established in each lift for each of the embankments. $ For every 12-inch layer constructed, in-situ wet density measurements of the compacted
SDM was made at each point of the grid system using the Troxler unit. $ Samples of the compacted SDM were collected from each location in order to measure the
moisture content in the field laboratory as per ASTM D2216. Knowing the moisture content, dry density was then calculated.
$ The compaction criteria (a moisture content less than 50%, and a minimum dry density of
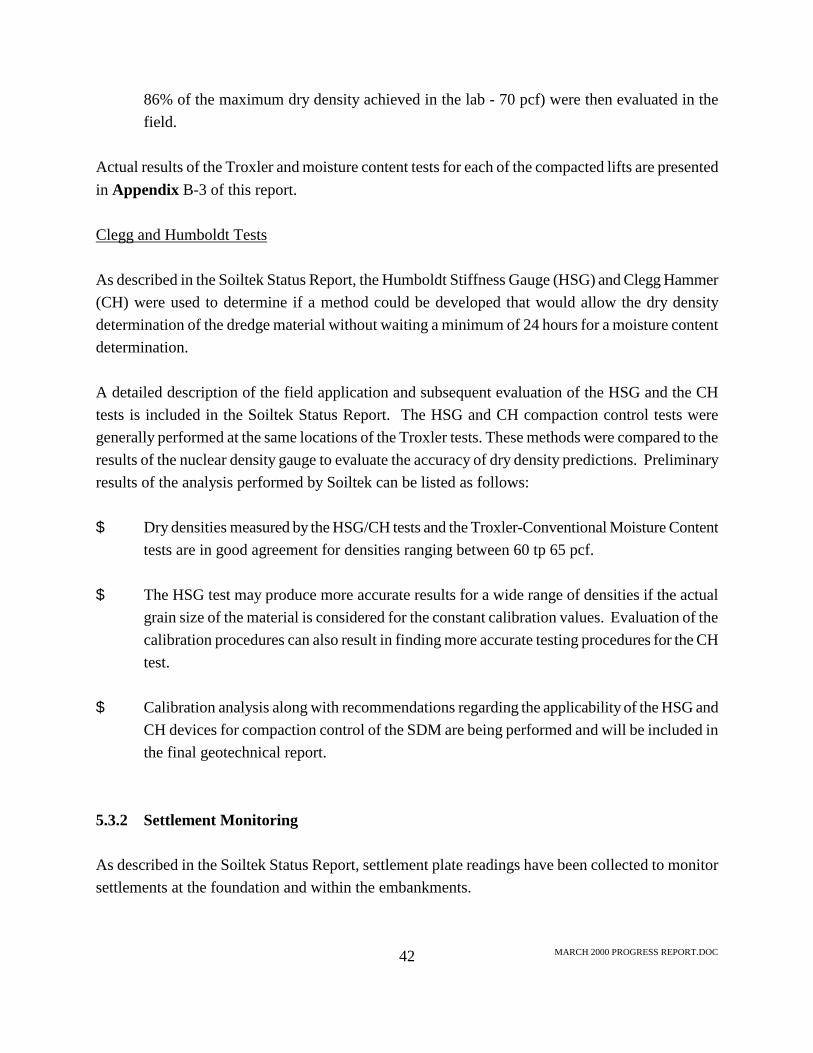
MARCH 2000 PROGRESS REPORT.DOC 42
86% of the maximum dry density achieved in the lab - 70 pcf) were then evaluated in the field.
Actual results of the Troxler and moisture content tests for each of the compacted lifts are presented in Appendix B-3 of this report. Clegg and Humboldt Tests As described in the Soiltek Status Report, the Humboldt Stiffness Gauge (HSG) and Clegg Hammer (CH) were used to determine if a method could be developed that would allow the dry density determination of the dredge material without waiting a minimum of 24 hours for a moisture content determination. A detailed description of the field application and subsequent evaluation of the HSG and the CH tests is included in the Soiltek Status Report. The HSG and CH compaction control tests were generally performed at the same locations of the Troxler tests. These methods were compared to the results of the nuclear density gauge to evaluate the accuracy of dry density predictions. Preliminary results of the analysis performed by Soiltek can be listed as follows: $ Dry densities measured by the HSG/CH tests and the Troxler-Conventional Moisture Content
tests are in good agreement for densities ranging between 60 tp 65 pcf. $ The HSG test may produce more accurate results for a wide range of densities if the actual
grain size of the material is considered for the constant calibration values. Evaluation of the calibration procedures can also result in finding more accurate testing procedures for the CH test.
$ Calibration analysis along with recommendations regarding the applicability of the HSG and
CH devices for compaction control of the SDM are being performed and will be included in the final geotechnical report.
5.3.2 Settlement Monitoring As described in the Soiltek Status Report, settlement plate readings have been collected to monitor settlements at the foundation and within the embankments.

MARCH 2000 PROGRESS REPORT.DOC 43
Readings from settlement plates, vertical and horizontal inclinometers have been collected to evaluate settlements and deformations of the embankments. Readings from the settlement plates have been obtained by McCutcheon and was submitted to Soiltek for review and evaluation. The settlement plate monitoring has been conducted on the following dates:
$ May, 17, 1999 $ June 1, 1999 $ July 9, 1999 $ July 14, 1999 $ July 21, 1999 $ July 30, 1999 $ August 16, 1999 $ August 30, 1999 $ September 13, 1999 $ October 4, 1999 $ October 18, 1999 $ November 15, 1999 $ December 15, 1999 $ January 21, 2000
The data have been processed and graphically represented by Soiltek. Based on the settlement analysis presented in the Soiltek Status Report, foundation settlements for both embankments range from 0.32 to 1.23 feet. Settlements within the embankments are found negligible. A complete analysis of the collected data will be presented in the final geotechnical report. 5.3.3 Embankment Field Monitoring A total of four vertical inclinometers (two for each embankment) and two horizontal inclinometers (one for each embankment) were installed to monitor the vertical and horizontal movement of the embankments. Data from the horizontal inclinometer have been collected since October 1, 1999. All together, three readings from Embankment No. 1 and one reading from Embankment No. 2 have been recorded for evaluation. On the other hand, vertical inclinometer readings have been taken in the field since November 1999. Two sets of vertical inclinometer readings for each embankments (top and toe) have been taken so far.
MARCH 2000 PROGRESS REPORT.DOC 44
The inclinometer data have been processed and graphically represented by Soiltek. Based on the Soiltek Status Report, 12 to 15 inches of settlement has occurred for embankment No 1 and embankment No 2, respectively. However, the vertical inclinometer readings have not shown any noticeable movements at the monitored slopes of the embankments. A complete analysis of the collected data will be presented in the final geotechnical report. 5.3.4 Field Curing Evaluation - Cone Penetration Testing Cone penetration tests (ACPT@) have been conducted by Soiltek to determine the in-situ strength characteristics of the dredge material and to monitor changes of strength with time. Additionally, results of the CPTs are being evaluated to verify strength laboratory results. The CPT field investigation and preliminary evaluation are presented in the Soiltek Status Report. As described in this report, a total number of 25 locations were tested for both embankments during the months of October and November, 1999. An initial evaluation of results indicates that the laboratory and the field shear strength measurements are within reasonable agreement. 5.4 Preliminary Data Analysis Based on the preliminary evaluation of the field data collected so far, the following conclusions have been included in the Soiltek Status Report: $ Cement inclusion increased the strength of the material significantly under ideal in-place
treated conditions. However, the strength gain was reduced due to the continual breaking of cemented bonds in the dredge material due to mixing and disking. This effect has been observed in the laboratory during testing and also in the field by cone penetration testing.
$ As long as the dredge material is compacted under the construction compaction criteria,
consolidation effects are minimal. This has been confirmed by laboratory testing, as well as by review of the field data collected from the settlement plates.
$ Utilizing alternative methods for compaction control, such as the Humboldt Stiffness Gauge
and the Cleff Impact Hammer, may allow for a more time efficient way of determining dry density of the cement SDM. However, these devices and methods need to be carefully calibrated with respect to the site conditions prior to any field work.
$ The addition of the geomembrane under the embankments allowed for a more even
MARCH 2000 PROGRESS REPORT.DOC 45
settlement of the structures. Differential settlement in the embankments was minimized by using this type of foundation improvement.
$ Laboratory results and computer models used to predict the slope stability of the
embankment have shown that the embankments have a fairly high factor of safety against slope failure. This has been verified from the available inclinometer data. From the field results, it can be concluded that the embankments have structurally performed up to the expected levels.
The Soiltek Status Report also presents the following preliminary observations made during construction: $ The SDM is sensitive to moisture. If the dredge material failed the compaction criteria at a
general location, it most likely failed the criteria due to excessive moisture content, rather than not reaching the maximum dry density.
$ The continual mixing and disking of the dredge material to aid its drying seemed to have an
adverse affect on the cementation of the material. (i.e., the cement bonds of the material were continually broken. Then, once the material was recompacted, some of the cementation effect of the material had dissipated from previous cementing. A solution to this problem may be to allow the material to hydrate and compact in place. A greater strength gain may be seen this way.)
$ Due to the higher temperatures and less precipitation, the material is much easier to use and
place in the summer months than either the spring or fall months. $ Utilizing the geomembranes underneath the embankments allows for an even distribution of
settlement to occur during the consolidation of the garbage and organic layers, especially on Embankment #2. Although the actual preloading and its corresponding effects were not directly measured, settlements on Embankment No. 1 seem to be less than Embankment No. 2 due to initial preloading of stockpiled dredge material.
6.0 AIR MONITORING ACTIVITIES

MARCH 2000 PROGRESS REPORT.DOC 46
6.1 Introduction The potential occupational and area-wide air quality impacts from the use of SDM in the construction of the embankments were assessed by the collection of personal and area samples of airborne particulate matter. The personal and area sampling program was performed by SAI in association with the Environmental and Occupational Health Sciences Institute (EOHSI). The results of this sampling, as presented by EOHSI, are included in Appendix E-1 of this report. Air quality field studies were performed by measuring the amount of airborne particulates generated and the concentration of various contaminants associated with the particulate matter during the use of SDM. For the purpose of this Demonstration Project, target activities were monitored including the drying/aeration and construction of the embankments and using SDM. Area-wide samples of airborne particulate matter were collected to evaluate the general airborne concentration of contaminants within and around the work areas. The area samples were collected at upwind, downwind and two crosswind locations perpendicular to the upwind and downwind samplers. Concentrations measured at each location were compared to each other to assess relative changes in contaminant concentrations which may be associated with the work activity. Samples of airborne particulate matter were also collected in the workers= breathing zone by fitting personal samplers to on-site workers for determining occupational exposure. The results of the personal sampling were compared to occupational exposure limits defined by the: $ Occupational Safety & Health Administration (AOSHA@);
$ National Institute of Occupational Safety & Health (ANIOSH@); and,
$ American Conference of Governmental Industrial Hygienists (AACGIH@). The area samples were analyzed for the following: $ total suspended particulates (ATSP@); $ selected metals; $ poly aromatic hydrocarbons (APAHs@); $ polychlorinated biphenyls (APCBs@); and, $ pesticides.

MARCH 2000 PROGRESS REPORT.DOC 47
The personal samples, on the other hand, were analyzed for the following: $ respirable particulate matter (particles having an aerodynamic diameter of 10 microns or less-
PM10); $ selected metals; $ poly aromatic hydrocarbons (APAHs@); $ polychlorinated biphenyls (APCBs@); and, $ pesticides. To assess worst case concentrations of airborne particulate matter which may be generated from the use of SDM during the construction of the embankments, sampling was performed during the spring and summer months when maximum dust generation was expected. Sampling was performed during two events: $ Event 1 April-May 1999 $ Event 2 June-July 1999. No sampling was performed on rainy days, since rain suppressed the generation of dust. 6.1.1 Overview of SDM Processing and Construction Activities Field air sampling was performed considering different aspects of the construction activities. Stabilized dredged material was prepared in the Sealand dredged processing facility by mixing raw dredged material with 8% cement. The material was then transported by trucks and stockpiled at Parcel G of the OENJ Redevelopment Site. Since the SDM was too moist to be used directly for construction purposes, it was aerated/dried in discrete batches prior to use. The SDM was loaded from the stockpiles using an excavator/trackhoe onto trucks and transported onto the embankment area where it was spread using a dozer. It was then disked 2-3 times a day using disking blades attached to the dozer to turn the SDM for aeration and drying. At the end of each day, or when the SDM had dried to the required moisture content, the SDM was compacted using a roller. The operations of aeration/drying and construction were performed concurrently during the Demonstration Project. In this manner, the embankments/roadway were built by layering SDM in discrete Alifts@ until the target elevation was attained. Sampling Event 1 was conducted during the construction and aeration/drying of SDM at
MARCH 2000 PROGRESS REPORT.DOC 48
Embankment No. 2, while Sampling Event 2 was performed during the aeration/drying of the material, and construction of Embankment No. 1 and the temporary access roadway. 6.1.3 Parameters Selected for Analyses The parameters selected for analyses in the area and personal samples were based on their potential presence in raw dredged material and laboratory-SDM. As indicated in the preliminary characterization data in Table 1 of Appendix E-2, raw dredged material (ARDM@) collected from the Union Dry Dock & Repair site in Hoboken, New Jersey, contained low levels of PAHs ranging from <0.01 mg/kg to 6.5 mg/kg. The analysis of airborne particulate matter was based on the following evaluation of previous SDM sampling results: $ Benzo(a)anthracene, benzo(a)pyrene and benzo(b)fluoranthene were detected in the RDM
above the applicable Residential Direct Contact Soil Cleanup Criteria (ARDCSCC@). Benzo(a)pyrene was detected in one sample of laboratory-SDM at 0.69 mg/kg, which is above the RDSCC of 0.66 mg/kg, but it was also present in the laboratory blank. All other PAHs in the RDM and laboratory-SDM were detected at concentrations lower than the RDCSCC.
$ The PCBs total concentrations in the RDM and laboratory-SDM exceeded the RDCSCC of
0.49 mg/kg but were below the NRDCSCC of 2 mg/kg. $ Nominal concentrations of pesticides such as beta-BHC, heptachlor epoxide, dieldrin, DDE,
DDD, DDT and gamma-chlordane were detected in the raw and lab-SDM. However, none of the pesticide concentrations exceeded the RDCSCC.
$ For metals, beryllium was detected at levels ranging from 1.1 to 3.4 mg/kg, exceeding the
RDCSCC of 1 mg/kg in seven out of eight samples of RDM and laboratory-SDM. Lead was detected at 467 mg/kg, in excess of the RDSCC of 400 mg/kg in one sample of laboratory-SDM, and zinc was detected at 2,190 mg/kg in one sample of RDM in excess of the NRDCSCC of 1,500 mg/kg. All other metals analyzed were detected at concentrations below the RDCSCC.
$ Dioxins and furans in samples of RDM and laboratory-SDM ranged from 1.1 x 10⁻⁶ to 3.76 x

MARCH 2000 PROGRESS REPORT.DOC 49
10-3 mg/kg. Based on these data, certain PAHs, PCBs, pesticides and metals were investigated to determine their presence in airborne particulate matter. 6.2 Methods and Materials 6.2.1 Meteorological Monitoring On-site meteorological data was recorded for temperature, wind speed and wind direction using a Weather Monitor II (Davis Instruments) meteorological station that was installed prior to any air sampling activities. The Weather Monitor was initially installed 30 feet above the ground surface near the footprint of Embankment No. 2. Over successive re-grading of the Embankment No. 2 area, the final height of the Weather Monitor was approximately 22 feet above ground surface. The Weather Monitor was used primarily to determine site-specific upwind and downwind locations for the positioning of area samplers, and to correlate the sampling data with site-specific meteorological events. After the air sampling program was completed, the Weather Monitor was disassembled and removed from the demonstration site. 6.2.2 Area Samples Area samples for the measurement of TSP in the ambient air around the SDM drying and construction areas were collected by drawing a measured quantity of air into a covered housing and through unpreserved, pre-weighed quartz fiber filters (Schleicher and Schuell No. 25, 20 x 25 cm). The apparatus used for this purpose was the Graseby General Metals Works High Volume Sampler. Samples were collected in accordance with the Reference Method for the Determination of Suspended Particulate Matter in the Atmosphere (High Volume Method) (40 CFR Part 50, Appendix B procedures). The area samples were collected as composite samples over a period of three to six days. The number of high volume samplers used and their layout is described in Section 6.3.1 of this report. At the end of each sampling day, the quartz fiber filters were covered with plexiglass sheets while mounted in their holders, and stored in a refrigerator or icebox onsite. This was done to minimize any sample contamination or losses from volatilization between sampling periods. The filters were brought back to the sample housing in the construction area for the next sampling day, and were
MARCH 2000 PROGRESS REPORT.DOC 50
placed at appropriate locations based on the prevailing wind direction. The flow rates (nominally between 10-30 cubic feet per minute) were checked each day before and after the sampling, and at regular intervals during the day, using a Magnehelic flow measuring device, which had been calibrated using a primary calibrating instrument called a Rootsmeter[1]. Total suspended particulates were measured gravimetrically based on the difference in filter weight before and after the sampling event. The filter was then split into two portions, one portion was analyzed for particulates of PAHs using gas chromatography-mass spectrometry, and PCBs and selected pesticides by gas chromatography with Ni 63 electron capture detector[1], [1] at the Department of Environmental Sciences at Rutgers University, New Brunswick, New Jersey, under the direction of Dr. S. Eisenreich. The second portion of the filter was analyzed for metal particulates using a modification of EPA Method 200.8 for Inductively Coupled Plasma-Mass at the EOHSI, Piscataway, New Jersey. It was anticipated that due to the low concentrations of metals, PAHs, PCBs, and pesticides detected in the raw and SDM samples, only low concentrations, if any, of these parameters will be detected in the airborne particulates. Even with the three to six day compositing period, it was likely that the majority of the concentrations resulting from this testing program would be less than the applicable method detection limits if the analyses were performed in strict accordance with NJDEP-approved methodologies. Therefore, to obtain lower detection limits (nanograms/m3) during sample analysis, Rutgers University research laboratories were utilized for sample analysis using modified NJDEP [6] EPA, July 1983, APTI Course 435 - Atmospheric Sampling, US Environmental Protection Agency, Air
Pollution Training Institute, MD 20, Environmental Research Center, Research Triangle Park, NC 27711, 1983, EPA 450/2-80-005.
[7] Franz, T.P., and Eisenreich, S., ASnow Scavenging of Polychlorinated Byphenyls and Polycyclic Aromatic Hydrocarbons in Minnesota@, Environ. Sci. Technol., 1998, 32 (12), 1771 - 1778.
[8] Simcik, M.F., Franz, T.P., Zhang, H., Eisenriech, S., AGas-Particle Partitioning of PCBs and PAHs in the Chicago Urban and Adjacent Coastal Atmosphere: States of Equilibrium@, Environ. Sci. Technol., 1998, 32 (2), 251 - 257.

MARCH 2000 PROGRESS REPORT.DOC 51
analytical methodologies. This allowed for the generation of more accurate analytical results and more accurate assessments of potential air quality impacts. During the summer months (Event 2), when ambient temperatures were high enough to measure the volatilization of semi-volatile compounds in the SDM, the high volume area samplers were additionally fitted with a polyurethane foam (APUF@) (0.049 g/cm3 density) adsorbent plug to collect vapor phase concentrations of PCBs, pesticides and PAHs. These analytes were measured using gas chromatography-mass spectrometry at Rutgers University. In addition to the measurement of TSP, separate area samples (upwind and downwind sets) were collected using low flow pumps for PM10. These samples were analyzed by Princeton Analytical Laboratories, Princeton, New Jersey using the NIOSH 0600 analytical method. Due to a sampling volume limitation of NIOSH Method 0600, samples for PM10 were collected for approximately two hours. 6.2.3 Personal Samples Personal samples were collected using SKC Aircheck or Ametek Model MG-4 constant low-flow pumps that were fitted with analyte-specific sampling filters/media onto the construction personnel (operators of loaders, trucks, rolling and disking equipment). The personal samplers were calibrated before and after each sampling day using a bubble flow meter. The NIOSH methods used for sampling and analyses, and the nominal flow rates at which the personal pumps were operated are as follows: Analyte Analytical Method Nominal Flow Rate (L/min) Respirable Particulate Matter (PM10) NIOSH 0600 2.2 Metals NIOSH 7300 1.91 Pesticides and PCBs NIOSH 5503 0.08 Poly aromatic hydrocarbons NIOSH 5506/5515 1.91 The personal samples were collected over an 8-hour work shift in accordance with applicable NIOSH methods, except the samples for PM10 which were collected for approximately two hours due to a sample volume limitation of the analytical method (NIOSH 0600). All personal samples were analyzed by Princeton Analytical Laboratories.
MARCH 2000 PROGRESS REPORT.DOC 52
6.3 Area and Personal Sample Collection 6.3.1 Area Samples Two to four high volume air samplers were used for the collection of area samples. An upwind air sampling location was used to establish background air quality and to assess potential upwind sources of airborne particulates (control sample), whereas downwind and crosswind samplers were used to collect airborne particulates within the construction area. The wind direction was determined each morning from the on-site weather station, and upwind, crosswind and downwind samplers were accordingly positioned approximately 150 feet from the edge of the active drying and construction areas, where the potential for elevated concentrations of airborne particulates was the highest. For screening purposes, only two high volume samplers were used during Event 1. If the wind direction changed during the day, the samplers were relocated according to the appropriate wind direction. However, on days when the wind direction fluctuated significantly, sampling was discontinued. Most days had a constant wind direction, so no major adjustments were necessary after the initial placement of the filter. For Event 2, a total of four high volume samplers was used. In addition to the upwind control location, one sampler was placed directly downwind and two samplers were placed at crosswind locations, perpendicular to the upwind and downwind samplers. This was done to collect representative samples of airborne particulates generated during the sampling day, by accounting for changes in wind direction. Sampling was performed during active drying and construction activities at the Site which ranged from four to eight hours a day. The area samples were collected as composites over three to six days in order to obtain sufficient particulate loading on the quartz-fiber filter, and allow for the adequate detection of metals and target organic compounds in the particulates. Table 2 of Appendix E-2 of this report summarizes the sampling frequency and the analytical parameters. As indicated on Table 2, two sets of composite area samples were collected; i.e., two pairs of upwind and downwind area samples during Event 1. During Event 2, another two sets of area samples were collected, however, each set also consisted of two crosswind samples. A lower compositing interval (i.e., 2-3 days) was used during Event 2 because higher temperatures and drier days at this time were expected to favor greater dust

MARCH 2000 PROGRESS REPORT.DOC 53
generation, and sufficient particulate loading was observed on the quartz filters in a shorter time period. Furthermore, since it was summer time, the daily work-shift had been extended to ten hours to expedite embankment construction. In addition, the upwind and downwind samplers were fitted with PUF adsorbent traps for the collection of vapor-phase concentrations of PAHs, PCBs and pesticides. Due to the limited availability of PUF samplers, the crosswind samplers were not fitted with the PUF backup. Five sets of upwind and downwind area samples were collected for PM10 during Event 1. No additional area samples for PM10 were collected during Event 2. 6.3.2 Personal Samples During the collection of area samples in Events 1 and 2, two 8-hour work shifts were selected from each sampling event to perform personal sampling. Personal sampling was conducted on days when at least four construction personnel were available within the work area for an eight-hour sampling period. This was done so that all four of the target analytes, i.e., PAHs, PCBs/pesticides, metals and PM10, could be sampled on the same day under similar work and weather conditions. For reasons explained above, personal sampling for PM10 was performed for a two-hour period only. Each individual=s activities and specific work areas were noted at the time of sampling. The personal monitoring pumps were provided to construction personnel at the start of the day=s activities and retrieved from them during their lunch break. The same samplers were replaced on the same workers afterwards, and retrieved at the end of the day. Because of the need to dry the SDM (alternate periods of disking and aeration) prior to the construction of subsequent lift of the embankments, many work-shifts at the demonstration Site required less than 8-hours of labor. As a result, several members of the construction crew split their daily work-shift between the Demonstration Site and the adjacent Jersey Gardens Mall construction site. Therefore, the availability of personnel who could wear a personal sampler and remain within the confines of the SDM Demonstration Site for an entire 8-hour work-shift was limited. On an average construction day, only one to two personnel were available to dedicate 8-hours of work at the embankments. In addition, since it was cumbersome for active site workers to be equipped with more than one personal monitor, it was necessary to limit the number of samples that could be collected during each sampling event. The number of personal samples collected during Events 1 and 2 is indicated on Table 2 of Appendix E-2 of this report.

MARCH 2000 PROGRESS REPORT.DOC 54
6.4 Results and Data Evaluation 6.4.1 Meteorological Data Meteorological data collected during Events 1 and 2 are summarized in Appendix E-2 of this report. The actions taken to compensate for fluctuations in wind direction so that representative samples of airborne particulates would be collected included shifting the sampling locations whenever possible to re-orient the samplers according to the new prevailing wind direction, switching filters, and/or shutting down the samplers when wind directions changed frequently or by 90 degrees or more. These measures are summarized in Appendix E-3 and were based on specific weather conditions observed during sampling. 6.4.2 Background Conditions and Potential Interferences The OENJ Redevelopment Site, of which Parcel G was used as the Demonstration Site for the construction of embankments, was a former landfill. Sections of the OENJ Redevelopment Site were being redeveloped to construct the Jersey Gardens Mall concurrently with the construction of the demonstration roadway embankments at Parcel G. Therefore, it is possible that the air samples collected upwind and downwind of the embankments were potentially impacted by activities unrelated to the Demonstration Project. Specifically, one crosswind area sample (Sample ID# T070899J), collected during Event 2 (July 14-15, 1999), was significantly impacted by extraneous activities occurring in the vicinity of the Demonstration Site. These activities involved heavy equipment traffic in the vicinity of one crosswind high volume sampler. Due to the topography of the Site and the limited space around the embankments, it was not possible to move this crosswind sampler to a location that would prevent the interference of nearby unrelated activities. As a result, Sample T070899J is noted to have higher dust loadings and consequently, higher concentrations of metals, PCBs/pesticides, and PAHs. Similarly, visual observations during the Event 1 sampling reveal that higher particulate loadings on upwind samplers were due to nearby mall construction activities rather than embankment construction activities. During Event 1, dust from the mall construction site was observed to blow towards the upwind sampler (approximately 1,000 ft from mall construction site) but did not get carried farther to impact the downwind sampler to the same extent (approximately 2,000 feet away from mall construction site). As a result, upwind concentrations for Event 1 are marginally higher
MARCH 2000 PROGRESS REPORT.DOC 55
than downwind concentrations for all the parameters analyzed. Further, the OENJ Redevelopment Site is located in a completely industrialized area with several large manufacturing facilities that may potentially emit airborne contaminants. Other sources of potential air pollution include the heavy commercial traffic due to the Elizabeth Sea Port, the Newark Airport and the New Jersey Turnpike which are near the OENJ Redevelopment Site. Specific background impacts/interferences have been described, wherever observed, in the following sections of the report. 6.4.3 Area Samples Visual observations of SDM used in embankment construction indicate that the material was generally moist so that dust generation from SDM was minimal when the material was stockpiled or compacted after construction of a lift. Minor amounts of SDM became airborne only when the material was transported or actively disked for the purpose of drying. The concentrations of upwind/downwind and crosswind samples have been evaluated with respect to each other. Apparent incremental increases in the concentration of downwind and crosswind samples have been identified herein. However, due to the apparent contributing factors from nearby potential sources, it is difficult to determine if the apparent increases in contaminant concentrations are reflective of the SDM or other sources. As shown in Tables 3 through 5 of Appendix E-2, the area samples showed measurable concentrations of metals, PCBs and PAHs since these parameters were analyzed using very low detection limits (ng/m3). In general, the relative concentration differences between upwind and downwind/crosswind sampling locations for metals, PAHs and PCBs are approximately "1 order of magnitude. However, even with these relative differences in magnitude, the detected concentrations of these parameters indicate that the SDM used in embankment construction was not a major source of airborne metals, PAHs or PCBs in the particulate phase. 6.4.3.1 TSP and PM10 Total Suspended Particles (TSP) observed in the area samples ranged from 0.10 to 1.16 mg/m3. The differences in TSP in spring and summer do not appear to be significant. During Event 1, the TSP and Respirable Particulate Matter (PM10) concentrations were actually higher at upwind locations than at downwind locations (see Table 6 of Appendix E-2). Visual observations at the time of

MARCH 2000 PROGRESS REPORT.DOC 56
sample collection reveal that higher particulate loadings on upwind samplers were due to nearby mall construction activities rather than embankment construction activities. During Event 1, dust from the mall construction site was observed to blow towards the upwind sampler. Dust from this background operation may have also impacted the downwind sampler, but at much lower levels. A comparison of the TSP and PM10 data shows that although sampling time-frames for the TSP and PM10 samples were different (16-36 hour composites v/s 2-hour composites), the PM10 results were within a factor of 2 to 4 of the TSP results. This indicates that a significant portion of the particulate matter in the air at the Demonstration Site was of respirable size. During Event 2 (July 14 to 15, 1999), construction and heavy equipment traffic not associated with the use of the SDM was observed to generate dust plumes near one cross wind sampling location (T070899J), but did not appear to significantly impact other sampling locations. As a result, higher particulate loadings (TSP) were observed at this crosswind sample compared to the other downwind/crosswind samples collected during this event. The New Jersey Ambient Air Quality Standard for Total Suspended Particulates (0.75 mg/m3) and the National Primary Ambient Air Quality Standard for PM10 (0.05 mg/m3) are based on 24-hour average concentrations measured during twelve consecutive months. Since the TSP and PM10 concentrations at the Demonstration Site represent worst-case concentrations determined very close to the source areas (within 150 feet of the drying and construction activities), over a much shorter sampling time-frame, direct comparisons of the TSP and PM10 worst-case concentrations with the ambient air quality criteria cannot be made. 6.4.3.2 Metals Measurable concentrations of metals were detected in the area samples (See Table 3 of Appendix E-2). For reasons explained above, upwind metal concentrations for Event 1 were higher than downwind metal concentrations due to interferences from nearby sources unrelated to the Demonstration Project. In addition, metal concentrations were also higher in one crosswind sample (T070899J) (Event 2) due to unrelated activities occurring in the vicinity of the high volume sampler. The most abundant metals detected were aluminum, barium, copper, magnesium, titanium and zinc. Generally, except for instances where the upwind samples (or the crosswind sample that was apparently affected by nearby construction activity unrelated to the Demonstration Project) indicated higher concentrations than the downwind and crosswind samples, the results for upwind and crosswind samples are within the same order of magnitude. No consistent trends are observed
MARCH 2000 PROGRESS REPORT.DOC 57
between the downwind/crosswind samples and the upwind samples, and based on the low concentrations (ng/m3) detected in all the samples collected, the SDM does not appear to be a major source of target metals. 6.4.3.3 PCBs/Pesticides As shown in Table 5 of Appendix E-2, relative differences in concentration between the upwind and downwind particulate phase PCBs were insignificant during the Event 1 sampling. For Event 2, during the July 14-15, 1999 sampling, one cross-wind sample (T070899J) was noted to have particulate phase PCBs that were an order of magnitude higher (5.87 x 10⁻¹ Fg/m3) than the other downwind (3.22 x 10⁻² Fg/m3) and crosswind samples (2.86 x 10⁻² Fg/m3), as well as the upwind sample (3.61 x 10⁻² Fg/m3). However, this crosswind sampling location, as explained previously, was impacted by a higher dust loading due to nearby construction activities that were unrelated to the Demonstration Project. As such, Sample T070899J is not a truly representative sample of the Demonstration Site activities. During the July 19-21, 1999 sampling, however, a crosswind sample (Sample ID# T070899H) was noted to have a significantly higher particulate-phase PCB concentration (8.24 x 10⁻² Fg/m3) compared to the downwind (2.23 x 10⁻² Fg/m3) and other crosswind (2.96 x 10⁻² Fg/m3) samples, as well as the upwind sample (1.83 x 10⁻² Fg/m3). This relatively higher concentration in the Sample T070899H is attributed to changes in the wind direction which may have resulted in potentially higher dust loadings at certain times during the area sampling. Vapor-phase PCB concentrations were slightly higher in the downwind samples than in the upwind samples, although upwind and downwind concentrations were in the same order of magnitude. During the July 14-15, 1999 sampling, the upwind PCB vapor concentration was 2.78 Fg/m3 and the downwind PCB vapor concentration was 5.56 Fg/m3. For the July 19-21, 1999 sampling, the upwind PCB vapor concentration was 2.97 Fg/m3 and the downwind concentration was 3.56 Fg/m3. Vapor-phase PCB concentrations observed in the summer were three orders of magnitude higher than particulate phase PCBs at both upwind and downwind sampling locations. A comparison of the observed vapor-phase PCB concentrations to known urban (Chicago) levels of PCBs in summer shows that the vapor phase PCBs at the Demonstration Site, including upwind concentrations, were also approximately three orders of magnitude higher than the Chicago levels (See Table 8 of Appendix E-2).
As shown in Table 1 of Appendix E-2, total PCB concentrations in the SDM range from <0.5 Fg/kg to 840 Fg/kg. Based on the results of the particulate phase and vapor concentrations of PCBs, since

MARCH 2000 PROGRESS REPORT.DOC 58
significant background contributions are evident, there is no conclusive indication that the SDM is a primary source of PCB emissions in the area. The Demonstration Site is located in a highly industrialized area of Elizabeth, New Jersey, which may possibly have a high background concentration of PCBs. Additional investigation of the vapor phase PCBs would be required to evaluate the SDM as a potential source of PCB emissions, including quantitative data on the magnitude of decay in the PCB concentrations as distance from the SDM source increases. Like PCBs, particulate concentrations of pesticides were lower than vapor-phase pesticide concentrations measured during Event 2. Depending on the volatility of an individual pesticide, vapor concentrations ranged from being within the same order of magnitude to three orders of magnitude higher than the corresponding particulate phase concentrations. Vapor concentrations of heptachlor were the highest noted, followed by concentrations of hexachlorobenzene and 4,4-DDE. However, in most cases, the downwind concentrations of these vapors were only marginally higher than the corresponding upwind concentrations. Particulate concentrations of 4,4-DDT were highest among the particulate phase pesticides, and only marginally higher in the downwind samples compared to the upwind samples. A relatively high, anomalous concentration of pesticides was observed in the cross-wind sample T070899J, and as explained in previous sections, this sample was impacted with a higher dust loading than its downwind/crosswind and upwind counterparts due to activities in the vicinity of the sampler that were unrelated to the Demonstration Project. Similarly, another crosswind sample T070899I also revealed relatively higher concentrations than its downwind counterpart due to higher dust loadings resulting from temporary shifts in the wind speed and direction during sampling. 6.4.3.4 PAHs Upwind PAH concentrations during Event 1 are marginally higher than the downwind concentrations, although both upwind and downwind concentrations are in the same order of magnitude (See Table 4 of Appendix E-2). As explained in Section 6.4.2, due to the location of the upwind samplers, mall construction activities apparently impacted the upwind samplers during Event 1. For the July 14-15, 1999 sampling during Event 2, except for sample T070899J which was impacted by activities unrelated to the Demonstration Project, the differences between downwind/crosswind samples and the upwind samples are marginal, and within the same order of magnitude. For the July 19-21, 1999 sampling, crosswind sample T0708991 was noted to have relatively higher PAH concentrations than the downwind/crosswind or upwind samples. The relatively higher concentration of PAHs in crosswind sample T0708991 than the downwind sample is attributed to

MARCH 2000 PROGRESS REPORT.DOC 59
fluctuations in the wind speed and direction for certain periods during the sampling. In general, PAH vapor concentrations appear to be higher for certain PAHs than particulate phase concentrations, possibly due to differences in volatility of the PAHs. The detected PAH concentrations (both particulate and vapor phase) are of such small magnitude (#1 ng/m3 for most compounds) that it cannot be conclusively determined whether the SDM is a primary source of PAHs or if significant background contributions exist. Based on the data, however, it can be concluded that PAHs are not emitted in large quantities from the use of SDM. 6.4.4 Overview of Area Sampling Results The target particulate pollutants and vapor phase PAH concentrations measured in the ambient air around the embankment construction areas are similar to concentrations of each pollutant measured previously or currently in New Jersey and other locations in the United States (Tables 7 to 10 of Appendix E-2)[1] [1]. Because the Demonstration Project was performed in an industrial location, background conditions may have influenced some of the samples, however, even with these interferences, the results indicate that using the dredge material in the manner done at the Demonstration Site does not have a significant effect on the air concentrations of most compounds in the surrounding work place and community environment. Individual compounds, except vapor phase PCBs, measured in the ambient air were no more than an order of magnitude greater than reported in individual samples elsewhere. The exception was vapor phase PCBs, which were at concentrations much greater than observed in a major urban area. In addition, since the samples were collected only ~150 feet from areas of active construction, the diffusion of any air contaminants contributed by the SDM is expected to be significant as distance from the source areas increases. 6.4.5 Personal Samples [9] Sweet, C.W., Vermette, S.J, ASources of Toxic Trace Elements in Urban Air in Illinois@, Environmental.
Science. and Technology, 1993, 27 (12), 2502 - 2510.
[10] Cari Lavorgna Gigliotti, Environmental Sciences, APolycyclic Aromatic Hydrocarbons in the New Jersey Coastal Atmosphere@, Thesis submitted January 1999.

MARCH 2000 PROGRESS REPORT.DOC 60
The results for almost all metals, PCBs, pesticides and PAHs were below the applicable detection limits for the personal air samples (see Tables 11 to 14 of Appendix E-2). The specific work activities of the individuals sampled apparently did not significantly impact the concentrations of airborne contaminants to which they were exposed. The airborne concentrations of the target contaminants in the workers= breathing zone were compared to the following applicable occupational exposure limits: $ Occupational Safety and Health Administration (AOSHA@): Maximum Permissible Exposure
Limit (APEL@) expressed as a time-weighted average; the concentration of a substance to which most workers can be exposed without adverse effect averaged over a normal 8-hour workday or a 40-hour work week. The OSHA PEL is a regulatory exposure limit.
$ National Institute of Occupational Safety and Health (ANIOSH@): Recommended Exposure
Limits (AREL@) for an 8-10 hour time weighted average. $ American Conference of Governmental Industrial Hygienists (ACGIH): Threshold Limit
Value (ATLV@) expressed as a time weighted average; the concentration of a substance to which most workers can be exposed without adverse effects.
6.4.5.1 Respirable Particulate Matter The respirable particulate matter (PM10) concentrations observed in personal samples were below the method detection limit during the spring sampling, but measurable levels were found in the summer samples. This is because the SDM was drier in the summer, resulting in the generation of greater airborne dust in the workers= breathing zone. The PM10 concentrations in the summer, however, were at least one order of magnitude below the PEL of 5 mg/m3 and the TLV guideline of 3 mg/m3 for PM10 and, therefore, within the acceptable ranges for 8-hour exposure (See Table 11 of Appendix E-2). There are no RELs for respirable dust. 6.4.5.2 Metals Measurable levels of chromium, lead, nickel, thallium, selenium, and zinc were noted in all six of the personal samples collected (See Table 12 of Appendix E-2). However, these air concentrations were well below the applicable PELs, RELs or TLVs. 6.4.5.3 PCBs and Pesticides
MARCH 2000 PROGRESS REPORT.DOC 61
Concentrations of PCBs and pesticides were below the method detection limits (<0.0006 to <0.01 mg/m3) in all seven personal samples collected for these parameters (See Table 13 of Appendix E-2). In general, PCB and pesticide concentrations were at least two orders of magnitude less than the applicable PELs or TLVs. The NIOSH REL for PCBs is a conservative guideline used for 10-hour exposure to known human carcinogens (0.001 mg/m3/10 hr). However in this case, a comparison of PCB concentrations with this REL cannot be made because the analytical detection limits for PCBs by Princeton Analytical are higher than the REL. 6.4.5.4 PAHs Acenaphthene, acenaphthalene, and benzo(e)pyrene were detected at very low concentrations (ranging from 0.0004 to 0.0039 ng/m3), but no PELs, RELs or TLVs have been developed for these compounds. Naphthalene was also detected, but at concentrations well below the applicable PEL, REL or TLV. 6.4.6 Overview of the Personal Sampling Results Concentrations of PM10, metals, PCBs, pesticides and PAHs were well below OSHA PELs indicating that breathing zone concentrations of these potential contaminants did not pose adverse health risks to workers using SDM for construction purposes. 6.5 Conclusions and Recommendations Based on the results of the air sampling program described above, the potential impacts to ambient air quality and worker health are not expected to be significant for total and respirable airborne particulates, metals, PAHs and pesticides. While PCBs in the particulate phase do not appear to be present in significant concentrations in both ambient air and in the workers= breathing zone, vapor-phase PCB concentrations measured in the area samples were found to be higher than those measured in another urban area. The data do not conclusively indicate that the SDM is the primary source of the observed PCB vapor concentrations. It is possible that background sources may have contributed to the observed PCB vapor concentrations.
MARCH 2000 PROGRESS REPORT.DOC 62
7.0 ENVIRONMENTAL FIELD MONITORING ACTIVITIES 7.1 Introduction A comprehensive environmental monitoring plan was developed to assess the environmental characteristics of cement SDM used in the construction of the embankments. Based on this plan, air, stormwater, percolated groundwater and dredged material samples were collected to assess the behavior and chemical properties of SDM. As presented in Section 1.4 of this report, environmental monitoring activities mainly included the sampling and characterization of: $ Solids:
Raw Dredged Material (RDM) Stabilized Dredged Material (SDM)
$ Liquids
Leachate generated from SDM samples Stormwater Runoff Percolated Groundwater
$ Air
Airborne Particulates / dust samples collected during construction Sampling has been performed at different phases of the project for various parameters in order to characterize the materials involved in the construction and assess potential adverse environmental conditions. The project phase at which the environmental sampling has been performed is indicated in the Project Flow Chart presented in Figure 2 of Section 1.4 of this report. The RDM and SDM were characterized according to NJDEP[1] guidelines set forth to determine the suitability of the material for upland beneficial use. In addition, the RDM and SDM were also analyzed for other parameters as recommended by the US Army Corps of Engineers[1] (AUSACOE@). The stabilized and the raw dredged materials were tested for the same analytical parameters as [11] The Management and Regulation of Dredging Activities and Dredged Material in New Jersey=s Tidal Waters, October
1997.
[12] USACOE Technical Note DOER-C2, February 1998.

MARCH 2000 PROGRESS REPORT.DOC 63
recommended by the NJDEP and USACOE. As requested by the NJDEP on March 17, 1998, SDM samples were subjected to the Modified Multiple Extraction Procedure (AMMEP@). The MMEP test is a modified version of the Multiple Extraction Procedure set forth in the EPA Method 1320[1] which has been used for approval of material deposited at the OENJ-Elizabeth Site. For comparative purposes, the leachates produced by the MMEP were analyzed for the same parameters as the RDM and SDM with the exception of those analyses that can only be performed on soil samples, such as cation exchange capacity or sodium adsorption ratio. In addition to the laboratory testing, air, stormwater and percolated groundwater samples have been collected from the field and analyzed for different parameters to evaluate the actual environmental conditions of the embankments during and after construction. The stormwater and percolated groundwater samples were analyzed for the same parameters as the MMEP leachates. The potential impacts to ambient air quality and worker health from the generation of airborne particles of the SDM were assessed by the collection of area and personal samples. The air quality study and its results are presented in detail in Section 6.0 of this report. Potential long-term changes in the characteristics of the SDM will be determined by collecting samples of SDM from the embankments after their construction has been completed. This data will be compared to the RDM and SDM data collected before and during construction of the embankments to evaluate temporal changes in the chemical characteristics of dredged material. A detailed description of the environmental sampling is presented in the next sections. Table H-1 of Appendix H summarizes the number of samples that were collected and remain to be collected as per the environmental sampling plan. A preliminary screening evaluation of the results is presented in Section 7.5.
[13] The Multiple Extraction Procedure (MEP) is designed to simulate the leaching that a waste will undergo
from repetitive precipitation of acid rain. The repetitive extractions reveal the highest concentration of each constituent that is likely to leach in a natural environment. Method 1320 is applicable to liquid, solid, and multiphase samples.

MARCH 2000 PROGRESS REPORT.DOC 64
7.2 Environmental Sampling Preliminary environmental investigations performed before the construction of the embankments included the characterization of RDM and SDM. 7.2.1 Environmental Sampling of the RDM Raw dredged material used in the Demonstration Project originated from the Union Dry Dock Site, located in Hoboken, New Jersey. The area where samples were collected included Pier 1, Pier 2 and Pier 3 which are identified in Figure 4. Two rounds of sampling and analysis were performed to characterize the raw dredged material from this location. April 1998 Samples The first round of sampling was performed in April 1998. The actual location and number of samples collected were based on the NJDEP=s AThe Management and Regulation of Dredging Activities and Dredged Material in New Jersey=s Tidal Waters@, dated October, 1997, in consultation with the NJDEP=s Land Use Regulation Program. The sampling scheme was approved in a letter from the NJDEP dated March 17, 1998. A total of thirteen (13) sediment core samples were collected at the Union Dry Dock Site as follows: Location of Sediment Core Samples
Number of Core Samples
Sample ID
Composite ID
North of Pier 1
3
80418
A
Area between Pier 1 and Pier 2
3
80419
B
South of Pier 3
3
80420
C
Area between Pier 2 and Pier 3
4
80421
D
As indicated above, the sediment core samples collected in each of the above areas were then composited into four composite samples. These samples were analyzed for:
$ Semi-volatile organic compounds on the USEPA Target Contaminant List (SVOCs) $ PCBs/Pesticides on the USEPA Target Contaminant List

MARCH 2000 PROGRESS REPORT.DOC 65
$ Metals on the Target Analyte List
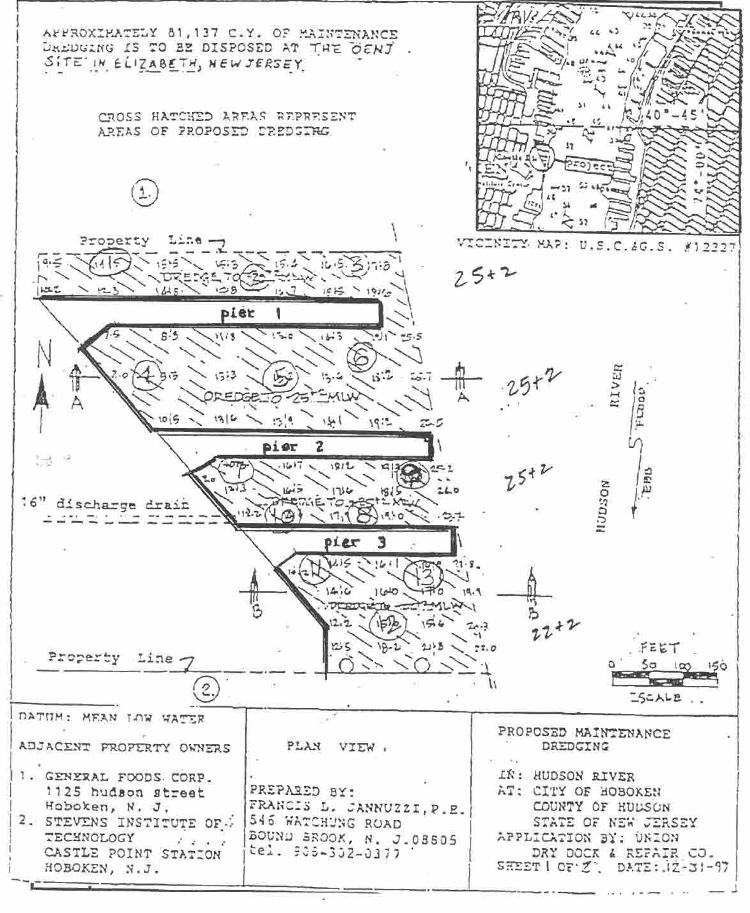
MARCH 2000 PROGRESS REPORT.DOC 67
$ Dioxins/Furans and $ Total Organic Carbon (ATOC@)[1].
On June 12, 1998, NJDEP approved the use of this material as structural fill at the OENJ Redevelopment Site. However, by the time the material was available for use at the site, it was no longer needed for filling purposes. As an alternative, the material was considered for use in the embankment Demonstration Project. October/November 1998 Samples The environmental data previously collected to obtain NJDEP approval for use of dredged materials as structural fill was considered valuable to the project. However, it was necessary to complement the data with some additional sampling to meet the requirements of the workplans. Therefoe additional SDM/RDM sampling and analyses were conducted during October and November 1998 [1]. Approximately 81,000 cubic yards of raw dredged material originated from the area between Pier 1 and Pier 2, and north of Pier 1 of the Union Dry Dock. Therefore, the supplemental environmental sampling focused on sample collection from these areas only. A total of six grab samples of RDM was collected from the area north of Pier 1 and the area between Pier1 and Pier 2 of the Union Dry Dock site. The samples were collected and analyzed by Aqua Survey, Inc. during dredging operations by Great Lakes Dredge & Dock Co. These samples were obtained from the same approximate locations as the samples collected in April 1998, and were composited as follows:
[14] Pursuant to the February 3, 1998 letter from the NJDEP to Mr. Robert Ferrie of the Union Dry Dock and
Repair Company, analysis of the composite samples for volatile organics was not required.
[15] Samples were collected on October 9, October 10, October 15, November 4, and November 10, 1998. The samples collected in October and November were composited on October 16, 1998 and November 11, 1998, respectively.

MARCH 2000 PROGRESS REPORT.DOC 68
Location of Sediment Core Samples
Number of Core Samples
Sample ID
Composite ID
North of Pier 1
3
H8788-1 [1]
A
Area between Pier 1 and Pier 2
3
H1760-1 [1]
B
These two composite samples were collected to supplement the environmental data available for the April 1998 composite samples, specifically, Sample 80418 (composite A) and Sample 80419 (composite B). These samples were analyzed for: [16] Sample H8687-1 and Sample H8788-1 complement each other. Sample H8687-1 represents one of three
grab samples which were composited into Sample H8788-1. This grab sample (H8687-1) was analyzed for TCL-VOCs instead of the composite sample (H8788-1) in order to avoid the loss of volatile organic compounds which may occur during the compositing of samples.
[17] Sample H8920-2 and H1760-1 complement each other. Sample H8920-2 represents one of three grab samples which were composited into Sample H1760-1. This grab sample (H8920-2) was analyzed for TCL-VOCs instead of the composite sample (H1760-1) in order to avoid the loss of volatile organic compounds which may occur during the compositing of samples.

MARCH 2000 PROGRESS REPORT.DOC 69
$ Volatile Organic Compounds (VOCs) on the USEPA Target Contaminant List $ pH[1], Acidity, Cation Exchange Capacity (ACEC@)[1] $ Sodium Adsorption Ratio (ASAR@)[1] $ Salinity[1], Electrical Conductivity [1], Resistivity
[18] It has been found that a high pH is needed for stabilization. In addition, the pH affects the chemical
properties of dredged material including, but not limited to, corrosivity, solubility, mobility, and toxicity of contaminants.
[19] Cation exchange reactions can alter soil physical properties and chemical composition of percolating waters. The CEC is pH dependent and directly proportional to the clay concentration, organic matter content, and particle size distribution.
[20] The SAR indicates the tendency for sodium to adsorb the cation exchange sites at greater concentration than calcium or magnesium. SAR values are generally used to indicate dispersivity in soil and permeability.
[21] Salinity is a measure of the concentration of soluble salts. Salt accumulations in soil can adversely affect its structure (decrease in the cohesiveness of particles), inhibit water and air movement, and increase the osmotic potential.
[22] Electrical conductivity will be used to measure the ionic strength present in the dredged material.

MARCH 2000 PROGRESS REPORT.DOC 70
$ Sulfates, Chlorides, and SulfidesTOC[1] and other organic components[1], and Carbon:Nitrogen Ratio[1]
Table 5 presents a summary of analytical sampling conducted for characterizing raw dredge materials.
Table 5 - Summary of Raw Dredge Material Sampling SAMPLE
DATE
No. of
SAMPLES
ANALYSES PERFORMED
SAMPLE ID
REFERENCE 80418
Composite A
80419
Composite B
80420
Composite C
04/01/98
4
SVOCs, Pesticides, PCBs, Metals, Dioxins, Furans, & TOC
80421
Composite D
H8687-1
Complement of Composite A
H8687-2 (dup)
Duplicate of H8687-1
10/10/98
2
VOCs
H8687-3 (FB)
Field Blank
H8788-1 Complement of H8687-1
10/16/98 2 TOC, and miscellaneous wet chemistry[1]
H8788-1 (dup)
Duplicate of H8688-1
H8920-2
Complement of Composite B
11/04/98
1
VOCs
H8920-1 (FB)
Field Blank
[23] The organic content in a soil can contribute to mobility and fixation of chemical compounds. In addition, it
affects plasticity, shrinkage, compressibility, permeability, and strength of the SDM. High organic contents impede the necessary reactions for stabilization.
[24] The value of the total organic carbon is separated into three components: total petroleum hydrocarbons, oils and greases, and the degradable organic carbonaceous material. The collection of this information will allow for the investigation of potential changes in chemical fixation and strength of the stabilized material due to changes in the organic content (e.g., as a result of biodegradation). Existing literature (Clare and Sherwood, 1956) suggests that the unconfined compressive strength of sand-cement mixes is affected by the organic content of the soil, and more specifically, by the type of compounds encountered in the mix.
[25] The C:N ratios present in dredged material help determine the potential for growth of soil microbes and plants.
[26] Miscellaneous wet chemistry for RDM samples refers to the alalyses for pH, salinity, electrical conductivity, sulfates, chlorides, sulfides, resistivity, acidity, CEC, SAR, coliforms, and C:N Ratio

MARCH 2000 PROGRESS REPORT.DOC 71
SAMPLE
DATE
No. of
SAMPLES
ANALYSES PERFORMED
SAMPLE ID
REFERENCE 11/11/99 1 TOC & wet chemistry H1760-1 Complement of H8920-2
A preliminary screening evaluation of results is presented in Section 7.5 of this report. 7.2.2 Environmental Sampling of SDM The SDM consisted of RDM stabilized with 8% Portland cement. Samples of SDM were either: (a) prepared in the laboratory by adding and mixing the selected cement admixture (laboratory SDM), or (b) collected in the field after stabilization at the pugmill (field SDM). To characterize the SDM, these samples were analyzed for various chemical compounds. Additionally, leachate samples were generated from some of the SDM samples and analyzed for the same parameters. Depending on the SDM sample from which leachates were generated, leachate samples are referred to as laboratory SDM leachates (i.e., SDM mixed with cement in the laboratory before testing) or field SDM leachates (i.e., SDM mixed with cement at the Sealand Facility and collected from the construction area). April 1998 Samples A portion of each of the four composited RDM samples collected in April 1998 were stabilized in the laboratory with 8% cement (referenced as Samples 80422, 80423, 80424 and 80425). These laboratory SDM samples were then analyzed for the same parameters as the RDM (pursuant to the sampling scheme approved by the NJDEP on March 17, 1998), namely:
$ SVOCs $ PCBs/Pesticides $ Metals $ Dioxins/Furans $ TOC.
In addition, the MMEP was conducted on each of the laboratory SDM samples. Seven leachates were generated by this procedure from each composite. Each of the leachates was also analyzed for the parameters listed above, with the exception of dioxins which were only analyzed in the first and seventh MMEP leachates. The leachates were labeled according to the source sample and the leachate number (e.g., 80422-5 refers to the fifth leachate generated from SAD sample 80422).

MARCH 2000 PROGRESS REPORT.DOC 72
October/November 1998 Samples Supplemental investigations performed to generate data on field SDM samples were collected from the stockpiles at the site. On October 1, 1998, two samples of SDM (Sample ID# H1354-1 and H1354-2) were collected from the stockpiles at Parcel G. These samples were analyzed for the following parameters:
$ VOCs $ pH and Acidity $ CEC, SAR, Salinity $ Electrical Conductivity, Resistivity $ Sulfates, Chlorides, and Sulfides $ TOC and Components, and C:N Ratio
The MMEP was also conducted on these samples, and each of the seven leachates generated per sample was analyzed for TOC and VOCs. The first and seventh leachates generated in each of the two samples were also analyzed for pH, salinity, electrical conductivity, sulfates, chlorides, sulfides, resistivity, and acidity. The first through seventh leachates generated from field SDM sample H1354-1 were identified as samples H1354-5 through H1354-11, respectively. The first through seventh leachates generated from field SDM sample H1354-2 were identified as samples H1355-1 through H1355-7, respectively February 1999 TCLP Samples On February 19,1999, two more samples of SDM (Sample ID# I9695-1 and I9695-2) were collected from the stockpiles at the site. These samples were analyzed for the full RCRA/TCLP parameters (metals, volatile, semi-volatile, pesticides and herbicides, corrosivity, reactivity, and ignitability) to assess whether the SDM had any characteristics of a RCRA hazardous waste. June 1999 Samples On June 24, 1999, at the request of the NJDEP, three samples of SDM (samples number I4797-1[1],
[27] Samples I4797-1 and I4999-1 are derived from the same parent sample, i.e., a single sample was divided
into these two portions which were analyzed separately for different parameters. Sample I4797-1 has also been referred to as Sample I4297-1.

MARCH 2000 PROGRESS REPORT.DOC 73
I4797-2[1], and I4797-3[1]) were collected during the construction of the embankments. These samples were analyzed for the full array of parameters, i.e., VOCs, SVOCs, Pesticides/PCBs, Metals, Dioxin/Furans, TOC and components, pH, Salinity, Electrical Conductivity, Sulfates, Chlorides, Sulfides, Resistivity, Acidity, CEC, SAR, and C:N Ratio. The three samples were also subjected to the MMEP for the extraction of a single leachate (samples numbers I4298-1, I4298-2, and I4298-3) from each SDM sample (samples numbers I4797-1, I4797-2, and I4797-3, respectively). The three extracts were analyzed for VOCs, SVOCs, Pesticides/PCBs, Metals, Dioxin/Furans, TOC, pH, Salinity, Electrical Conductivity, Sulfates, Chlorides, Sulfides, and Resistivity. Table 6 presents a summary of analytical sampling conducted for characterizing SDM, while Table 7 summarizes the analytical sampling performed on the laboratory and field SDM leachates.
[28] Samples I4797-2 and I4999-2 are derived from the same parent sample, i.e., a single sample was divided
into these two portions which were analyzed separately for different parameters. Sample I4797-2 has also been referred to as Sample I4297-2.
[29] Samples I4797-2 and I4999-2 are derived from the same parent sample. Sample I4797-3 has also been referred to as Sample I4297-3.

MARCH 2000 PROGRESS REPORT.DOC 74
Table 6 - Summary of Stabilized Dredge Material Sampling SAMPLE
DATE
No. of
SAMPLES
ANALYSES PERFORMED
SAMPLE ID
REFERENCE
80422
Composite A
80423
Composite B
80424
Composite C
04/01/98
4
SVOCs, Pesticides, PCBs, Metals, Dioxins, Furans, & TOC
80425
Composite D
H1354-1
Composite A/B
35804
2
VOCs, TOC & components, and miscellaneous wet chemistry[1]
H1354-2 Composite A/B
I9695-1
Composite A/B
I9695-2 Composite A/B
02/19/99
2
TOC & components, and hazardous characterization[1]
I9695-3 (FB) Field Blank
I4797-1 Composite A/B
I4797-2
Composite AB
VOCs, SVOCs, Pesticides, PCBs, Metals, Dioxins, Furans, TOC & components, CEC, SAR, and C:N Ratio
I4797-3 Composite A/B
I4999-1
Complement of I4797-1
I4999-2
Complement of I4797-2
pH, Salinity, Electrical Conductivity, Sulfates, Chlorides, Sulfides, Resistivity and Acidity
I4999-3
Complement of I4797-3
06/29/99
3
VOCs
H4299-1 (FB)
Field Blank
TOC & components, and
Complement of Composite B &
[30] Miscellaneous wet chemistry for SDM samples refers to the analyses for pH, salinity, electrical conductivity,
sulfates, chlorides, sulfides, resistivity, acidity, CEC, SAR, and C:N Ratio
[31] Hazardous characterization refers to the analyses for TCLP-VOCs, TCLP-SVOCs, TCLP-Pesticides, TCLP-Herbicides, TCLP- Metals, Corrosivity, Ignitiability, Explosivity, and Reactivity.

MARCH 2000 PROGRESS REPORT.DOC 75
SAMPLE
DATE
No. of
SAMPLES
ANALYSES PERFORMED
SAMPLE ID
REFERENCE
11/11/99 1 miscellaneous wet chemistry H1760-1 H8920-2
Table 7 - Summary of SDM Leachate Sampling
SAMPLE
DATE
No. of
LEACHATES
ANALYSES
PERFORMED
SAMPLE ID
REFERENCE
80422-1 thru 80422-7
From SDM 80422 (Composite A)
80423-1 thru 80423-7
From SDM 80423 (Composite B)
80424-1 thru 80424-7
From SDM 80424 (Composite C)
04/01/98
7 per SDM
Sample
SVOCs, Pesticides, PCBs, Metals, Dioxins[1], Furans, & TOC
80425-1 thru 80425-7
From SDM 80425 (Composite D)
H1354-5 and H1354-11
1st and 7th Leachates from SDM H1354-1 (Composite A/B)
Miscellaneous wet chemistry[1]
H-1355-1 and H1355-7
1st and 7th Leachates from SDM H1354-2 (Composite A/B)
H1354-5 thru H1354-11
Seven leachates from SDM H1354-1 (Composite A/B)
35804
7 per SDM
Sample
VOCs and TOC
H1355-1 thru H1355-7
Seven Leachates from SDM H1354-2 (Composite A/B)
I4798-1
1st leachate from sample I4797-1 (Composite A/B )
I4798-2
1st leachate from sample I4797-1 (Composite A/B )
06/29/99
1 per SDM
sample
VOCs, SVOCs, Pesticides, PCBs, Metals, Dioxins, Furans, TOC, and miscellaneous wet chemistry
I4798-3 1st leachate from sample I4797-1 (Composite A/B )
[32] Dioxins were only tested in the first and seventh leachates generated from each of the SDM samples.
[33] Miscellaneous wet chemistry for liquid samples refers to the analyses for pH, salinity, electrical conductivity, sulfates, chlorides, sulfides, resistivity, and acidity

MARCH 2000 PROGRESS REPORT.DOC 76
A preliminary screening evaluation of results is presented in Section 7.5 of this report.
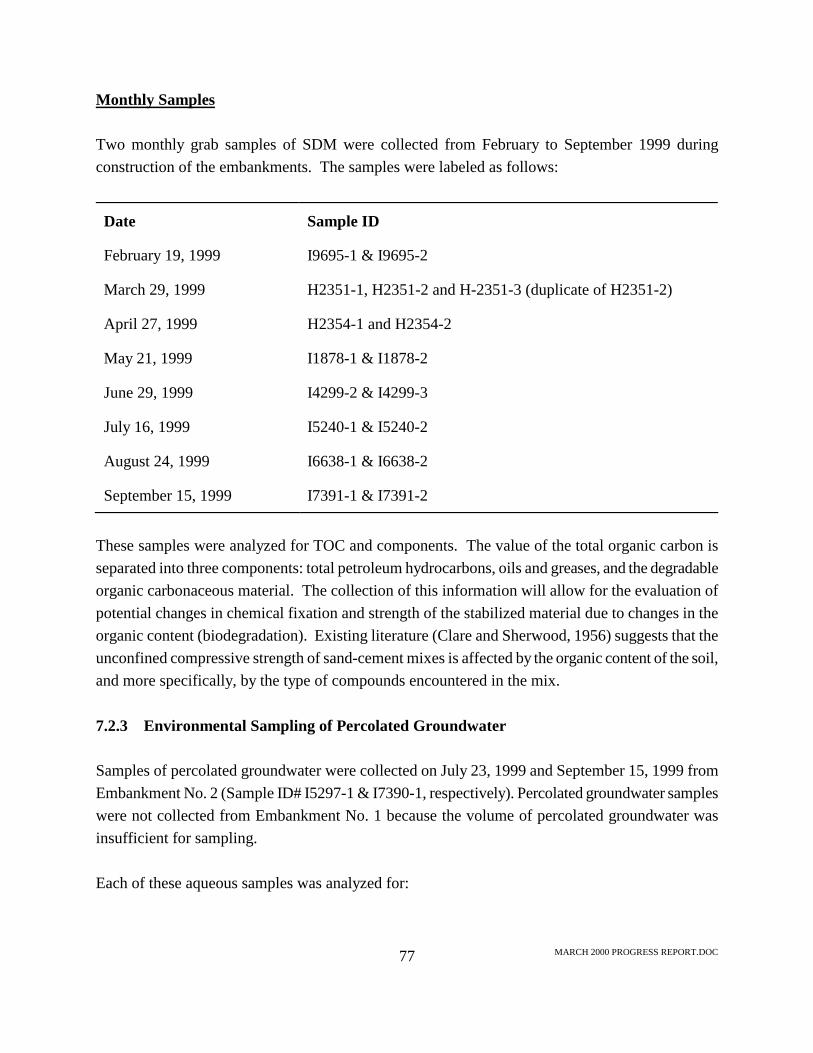
MARCH 2000 PROGRESS REPORT.DOC 77
Monthly Samples Two monthly grab samples of SDM were collected from February to September 1999 during construction of the embankments. The samples were labeled as follows: Date
Sample ID
February 19, 1999
I9695-1 & I9695-2
March 29, 1999
H2351-1, H2351-2 and H-2351-3 (duplicate of H2351-2)
April 27, 1999
H2354-1 and H2354-2
May 21, 1999
I1878-1 & I1878-2
June 29, 1999
I4299-2 & I4299-3
July 16, 1999
I5240-1 & I5240-2
August 24, 1999
I6638-1 & I6638-2
September 15, 1999
I7391-1 & I7391-2
These samples were analyzed for TOC and components. The value of the total organic carbon is separated into three components: total petroleum hydrocarbons, oils and greases, and the degradable organic carbonaceous material. The collection of this information will allow for the evaluation of potential changes in chemical fixation and strength of the stabilized material due to changes in the organic content (biodegradation). Existing literature (Clare and Sherwood, 1956) suggests that the unconfined compressive strength of sand-cement mixes is affected by the organic content of the soil, and more specifically, by the type of compounds encountered in the mix. 7.2.3 Environmental Sampling of Percolated Groundwater Samples of percolated groundwater were collected on July 23, 1999 and September 15, 1999 from Embankment No. 2 (Sample ID# I5297-1 & I7390-1, respectively). Percolated groundwater samples were not collected from Embankment No. 1 because the volume of percolated groundwater was insufficient for sampling. Each of these aqueous samples was analyzed for:
MARCH 2000 PROGRESS REPORT.DOC 78
$ VOCs, $ SVOCs, $ Pesticides/PCBs, $ Metals (total and dissolved), $ Dioxin/Furans, $ TOC, $ Total Dissolved Solids, $ pH and Acidity $ Electrical Conductivity, Resistivity, Salinity, and $ Sulfates, Chlorides, Sulfides,
7.2.4 Environmental Sampling of Stormwater Three stormwater samples were collected from each embankment after rain events on:
Date
Sample ID
September 24, 1999
J1039-1 & J1039-2
September 30, 1999
J1280-1 & J1280-2
October 6, 1999
H9120-1 & H9120-2
Each of these aqueous samples was analyzed for:
$ VOCs, SVOCs, $ Pesticides/PCBs, $ Metals (total and dissolved), $ Dioxin/Furans, $ TOC, Total Dissolved Solids, $ pH and Acidity $ Salinity, Electrical Conductivity, Resistivity, and $ Sulfates, Chlorides, Sulfides
Stormwater sampled from September 24,1999 to October 6, 1999 from Embankment No. 1 (J1039-1, J1280-1 and H9120-1) represents stormwater which came into direct contact with the SDM, since Embankment No. 1 had not yet been capped with top soil or asphalt millings. Stormwater was also sampled from Embankment No. 2 (J1039-2, J1280-2 and H9120-2). Although embankment 2 has
MARCH 2000 PROGRESS REPORT.DOC 79
been capped at the top and side slopes, the stormwater samples are considered to be in direct contact with SDM since the drainage swale was not capped at the time of sampling. Both embankments and their stormwater conveyance swales have been completely capped since October 11, 1999. The top of the embankments was covered with approximately six inches of asphalt millings. The side-slopes of the embankments, the stormwater conveyance swales and the area between the two embankments were covered with approximately six inches of topsoil. The topsoil was later hydroseeded. For the evaluation of analytical data, all the stormwater samples collected prior to October 11, 1999 are considered to have been in contact with SDM before sampling. 7.3 Post-Construction Environmental Sampling Stabilized dredged material, percolated groundwater and stormwater samples from the embankments will be collected to evaluate long term changes in the characteristics of SDM. One stormwater sample was obtained from the stormwater conveyance system of Embankment No. 2 on December 8, 1999 (Sample ID# J4560) and analyzed for:
$ VOCs, SVOCs, $ Pesticides/PCBs, $ Metals (total and dissolved), $ Dioxin/Furans, $ TOC, Total Dissolved Solids, $ pH and Acidity $ Salinity, Electrical Conductivity, Resistivity, and $ Sulfates, Chlorides, Sulfides.
The analytical data generated from this sample has not been processed and, therefore, is not presented in this report. Sampling of SDM, SDM leachates, percolated groundwater, and stormwater is being conducted after construction as specified in the final Workplan. A total of five SDM samples and leachates generated from these SDM samples will be collected and analyzed for the full array of parameters previously indicated. Stormwater and percolated groundwater samples will continue to be collected after significant rain events during the six month post-construction period. Percolated groundwater samples will only be collected from Embankment No. 2, where all previous samples have originated. Table 8 summarizes the sampling activities to be performed after construction.

MARCH 2000 PROGRESS REPORT.DOC 80
Table 8 - Summary of Sampling to be performed
Sample Type
No, of
Samples
Sampling
Frequency
ANALYSES TO BE
PERFORMED
REFERENCE
SDM
5
Upon completion of the monitoring
VOCs, SVOCs, Pesticides, PCBs, Metals, Dioxins, Furans, TOC & components, and miscellanoeus wet chemistry for SDM
To be collected from the Embankments to assess potential chemical changes with time (Composite A/B)
2
Upon completion of the monitoring
VOCs, SVOCs, Pesticides, PCBs, Metals, Dioxins, Furans, TOC and miscellaneous wet chemistry for liquid samples
Seven leachates to be generated from each of two of the five SDM samples to define changes in chemical fixation with time (Composite A/B)
SDM
Leachates
3
Upon completion of the monitoring
VOCs, SVOCs, Pesticides, PCBs, Metals, Dioxins, Furans, TOC and miscellaneous wet chemistry for liquid samples
A single leachate to be generated from each of three remaining SDM samples to define changes in chemical fixation with time (Composite A/B)
Percolated
Groundwater
3 anticipated
1 per month
VOCs, SVOCs, Pesticides, PCBs, Metals (total and dissolved), Dioxins, Furans, TOC, and miscellaneous wet chemistry for liquid samples
Samples will only be collected from Embankment No. 2
Stormwater
3 anticipated
1 per rain event
VOCs, SVOCs, Pesticides, PCBs, Metals (total and dissolved), Dioxins, Furans, TOC, and miscellaneous wet chemistry for liquid samples
Samples will only be collected from Embankment No. 2

MARCH 2000 PROGRESS REPORT.DOC 81
7.4 Data Processing and Basis for Data Screening 7.4.1 Data Base System All analytical data collected during the pre-construction and construction periods have been analyzed with proper QA/QC by certified analytical laboratories. These data were also reviewed by SAI QA/QC personnel. After these evaluations, all data were entered into a Data Base System[1] which was designed to facilitate the management of information during the preliminary data screening and evaluation. Parameter concentrations from the samples analyzed were entered into the Data Base System which includes the following information: C Sample date $ Dredging Source $ Sample ID $ Composite ID $ Media and Matrix $ Leachate Number $ Parameter name [34] The actual database program used was Access which is a relational Data Base System. A relational
database is a collection of data items organized as a set of formally-described tables from which data can be accessed or reassembled in many different ways without having to reorganize the database tables. The standard user and application program interface to a relational database is the structured query language (SQL). SQL statements are used both for interactive queries for information from a relational database and for gathering data for reports. In addition to being relatively easy to create and access, a relational database has the important advantage of being easy to extend. After the original database creation, a new data category can be added without requiring that all existing applications be modified. The definition of a relational database results in a table of Ametadata@ or formal descriptions of the tables, columns, domains, and constraints.

MARCH 2000 PROGRESS REPORT.DOC 82
C CAS Number $ Type of Chemical $ Concentration value C Units of concentration C Detection Limit $ Applicable criteria for screening evaluation To date, the Data Base System consists of 9489 concentration results from approximately 261 different parameters and 106 different samples. The data as entered in the Data Base System are presented in Appendix H of this report. Computer algorithms have been set up to classify and sort the data according to the criteria used for evaluation. 7.4.1 Environmental Standards used for Data Screening The analytical data related to dredged material, leachate, percolated groundwater, and surface water sampling have been compared with applicable standards. Specifically, the analytical results for various environmental samples were compared to the chemical-specific Federal and State criteria/standards that have been established for different media. This comparison is performed as a screening tool for the identification of those parameters which could be considered of concern and may require additional analysis. This evaluation does not include data gathered after the completion of the construction of the embankments. 7.4.1.1 Soil Samples RDM and SDM samples were compared with the following NJDEP Soil Cleanup Criteria (ASCC@)[1]:
$ Residential Direct Contact Soil Cleanup Criteria (ARDCSCC@);
$ Non-Residential Direct Contact Soil Cleanup Criteria (ANRDCSCC@); and
$ Impact to Groundwater Soil Cleanup Criteria (AIGWSCC@).
[35] Last revised May 12, 1999.
MARCH 2000 PROGRESS REPORT.DOC 83
The RDCSCC and NRDCSCC are surface soil[1] cleanup criteria which have been initially classified based on land use, i.e, residential or non-residential. Soil Cleanup Criteria threshold limits have been developed from the evaluation of unacceptable risks of exposure to carcinogenic and non-carcinogenic contaminants in surface soil. Most of the RDCSCC and NRDCSCC are developed using an incidental ingestion exposure pathway, such that incidental ingestion of soil containing a chemical at the RDCSCC or NRDCSCC concentration would pose no more than a Aone-in-a-million@ incremental cancer risk to the population. In some cases, the criteria are based on ecological considerations or chemical-specific factors that suggest increased risk through other exposure pathways. The IGWSCC are sub-surface soil cleanup criteria that are to be used where contaminated groundwater has migrated, or has the potential to migrate, to aquifers that replenish sensitive ecosystems or provide potable water. The IGWSCC are also human-health based criteria, developed with the same risk considerations as the RDCSCC and the NRDCSCC. However, generic threshold values for IGWSCC have only been developed for organic contaminants. For inorganic compounds, the NJDEP establishes that IGWSCC values be developed based on site-specific chemical and physical parameters. Site-specific IGWSCC are generally developed for those parameters exceeding the RDCSCC and/or NRDCSCC. 7.4.1.2 MMEP Leachates and Percolated Groundwater Samples Aqueous sample results from leachate generated from SDM and from water which has infiltrated through the embankments were compared with the New Jersey Groundwater Water Quality Standards (GWQS) for Class IIA Aquifers. The GWQS are based on human-health risk assessments, considering ingestion of ground water as a primary exposure pathway. These standards are protective of Class IIA Aquifers or Groundwater for Potable Supply (NJAC 7:9-6.5 c). 7.4.1.3 Stormwater Samples Stormwater sample results were compared to the New Jersey Surface Water Quality Criteria for freshwater designated as FW-2. The surface water quality criteria for FW-2 waters protect surface water bodies so that water may be used as a source of potable water, for industrial and agricultural purposes, for recreation, and for the maintenance, migration and propagation of natural biota. These [36] Surface soils are defined as the top two feet of soil.
MARCH 2000 PROGRESS REPORT.DOC 84
criteria are human-health based and consider ingestion as the primary exposure pathway. In addition, the criteria are also protective of aquatic life, and are based on acute and chronic toxicity effects to aquatic biota. Several criteria have been established by the NJDEP for the evaluation of FW-2 waters depending upon exposure and carcinogenic effects: C Criteria labeled in this report as AFW2-A@ represent criteria identified for acute (as a one hour
average) aquatic life. C Criteria labeled as AFW2-C@ represent criteria identified for chronic (as a four day average)
aquatic life. C Criteria labeled as AFW2-H@ refers to criteria defined for noncarcinogenic effects based on a
30 day average with no frequency of exceedance at or above the design flows specified in NJAC 7:9B-1.5(c)2. These criteria are based on a risk level of one-in-one million.
C Criteria labeled as AFW2-HC@ refers to criteria defined for carcinogenic effects based on a 70
year average with no frequency of exceedance at or above the design flows specified in NJAC 7:9B-1.5(c)2. These criteria are also based on a risk level of one-in-one million.
For the preliminary screening evaluation, stormwater sample results collected as part of this investigation were compared against the lowest of these four criteria. 7.4.1.4 Dioxins Analysis In this analysis, dioxin compounds include those compounds which have nonzero Toxicity Equivalency Factor (TEF) values as defined in the 1989 International Scheme, I-TEFs/89. This procedure was developed under the auspices of the North Atlantic Treaty Organization=s Committee on Challenges of Modern Society (NATO-CCMS, 1988a; 1988b) to promote international consistency in addressing contamination involving chlorinated dibenzo-p-dioxins (CDDs) and chlorinated dibenzofurans (CDFs). The USEPA has adopted the I-TEFs/89 as an interim procedure for assessing the risks associated with exposure to complex mixtures of CDDs and CDFs. The TEF scheme assigns nonzero values to all CDDs and CDFs with chlorine substitute in the 2, 3, 7, 8 positions. By relating the toxicity of the CDDs and CDFs to the highly-studied 2, 3, 7, 8-TCDD, the approach simplifies the assessment of
MARCH 2000 PROGRESS REPORT.DOC 85
risk involving exposures to mixtures of CDDs and CDFs. In general, the assessment of the human health risk to a mixture of CDDs and CDFs, using the TEF procedure, involves the following steps:
$ Analytical determination of the CDDs and CDFs in the sample.
$ Multiplication of congener concentrations in the sample by the TEFs to express the concentration in terms of 2, 3, 7, 8-TCDD equivalents (TEQs).
$ Summation of the products in Step 2 to obtain the total TEQs in the sample.
$ Determination of human exposure to the mixture in question, expressed in terms of TEQs.
$ Combination of exposure from Step 4 with toxicity information on 2, 3, 7, 8 -TCDD
to estimate risks associated with mixture. EPA has established action levels for dioxin in soils. The preliminary remediation goals (PRGs) or starting points for setting cleanup levels for dioxin in soil at Comprehensive Environmental Response, Compensation and Liability Act (CERCLA) and Resource Conservation and Recovery Act (RCRA) corrective action sites, are as follows: One ppb (TEQs) is to be generally used as a starting point for setting cleanup levels for CERCLA removal sites and as PRG for remedial sites for dioxin in surface soil involving a residential exposure scenario. C For commercial/industrial exposure scenarios, a soil level within the range of 5 ppb to 20 ppb
(TEQs) should generally be used as a starting point. For the dioxin screening evaluation of dredged materials, the levels of 1ppb (TEQs) for residential soils and 5 ppb (TEQs) for nonresidential soils were used. For groundwater and surface water screening evaluations the following criteria were used: C The dioxin standard for Class II GWQS of 0.01 ppb was used for MMEP and percolated
groundwater sample results.

MARCH 2000 PROGRESS REPORT.DOC 86
C The dioxin standard for FW-2 SWC of 0.013 ppq was used for stormwater sample results. For the samples in all media discussed above where the concentration was reported as non-detect, the concentration was estimated to be equal to the detection limit. The measured and estimated concentrations were used in the TEQ determination.

MARCH 2000 PROGRESS REPORT.DOC 87
7.5 Screening Evaluation of Analytical Data This section presents the results of the screening evaluation performed on the RDM, SDM, MMEP extracts (SDM leachates), percolated groundwater, and stormwater samples collected as described in previous sections. All samples collected prior to December 1, 1999 have been processed into the Data Base System in order to facilitate and streamline the evaluation of data. Appendix H of this report presents all tabulated data which forms the basis for this preliminary evaluation. As previously indicated, results of the soil and aqueous samples were compared to the applicable New Jersey soil, surface and groundwater quality criteria, specifically: $ Soil sample results were compared with: a) Residential Direct Contact Soil Cleanup Criteria
(ARDCSCC@); b) Non-Residential Direct Contact Soil Cleanup Criteria (ANRDCSCC@); and c) Impact to Groundwater Soil Cleanup Criteria (AIGWSCC@). For dioxin results from soil samples, the levels of 1ppb (TEQs) for residential soils and 5 ppb (TEQs) for nonresidential soils were used.
$ SDM leachates and percolated groundwater sample results were compared with the New
Jersey Groundwater Water Quality Standards (GWQS), Class IIA Aquifers or Drinking Water Aquifers. For dioxin results of SDM leachates and percolated groundwater, the Class II GWQS of 0.01 ppb was used.
$ Stormwater sample results were compared against the lowest of the four criteria of the New
Jersey Surface Water Quality Criteria for freshwater designated as FW-2; a) FW2-A - acute aquatic life; b) FW2-C - chronic aquatic life; c) FW2-H - human health noncarcinogenic effects; and d) FW2-HC - human health carcinogenic effects. For dioxin results of stormwater samples, the FW-2 SWC of 0.013 ppq was used.
In the screening evaluation of data, sample results are divided into detected concentration and non detected concentrations (detects and non-detects). The lowest level of an analyte that can be detected using an analytical method is generally termed the Adetection limit.@ Parameter concentrations are reported by the laboratories as having positive results or below certain levels based on the following commonly reported detection limits: $ Method Detection Limit (MDL)[1]

MARCH 2000 PROGRESS REPORT.DOC 88
$ Instrument Detection Limit (IDL)[1] $ Sample Quantification Limit (SQL)[1] $ Practical Quantification Limit (PQL)[1] The procedures set forth in the document entitled AEPA Region III Guidance on Handling Chemical Concentration Data Near the Detection Limit in Risk Assessments@ have been used to evaluate non-detected metal concentrations when the MDLs were higher than the selected criteria. In the EPA document, it is recommended that the non-detects be treated as half of the MDLs when the chemicals are believed to be present[1] . Similarly, the EPA document recommends that undetected chemicals be reported as zero when there is reason to believe that the chemical is not present. The screening evaluation of non-detected concentrations is presented in Appendix I of this report. This section addresses parameter concentrations reported by the laboratories as positive values by comparing them with the criteria previously presented in Section 7.4 of this report.

MARCH 2000 PROGRESS REPORT.DOC 89
7.5.1 Raw Dredged Material - RDM Because RDMs are not intended for use in construction areas, RDM analytical results may not be directly relevant for criteria comparison. Testing of the solid phase of RDM is commonly used to assess the suitability of this material for different management options. It also provides a general and confirmatory quantification of the quality of the SDM. The RDM testing data can also serve for evaluating the potential incursion of contaminants during the mixing, transport, and construction phases. The RDM sample results obtained in this study are compared with the selected criteria because these data provide some basis for future SDM evaluation. The analytical results of the RDM samples were compared with: $ Residential Direct Contact Soil Cleanup Criteria (RDCSCC); $ Nonresidential Direct Contact Soil Cleanup Criteria (NRDCSCC); and $ Impact to Groundwater Criteria (IGWC)[1]. 7.5.1.1 Residential Soil Cleanup Criteria for RDM As discussed throughout this document, the RDM samples were analyzed for VOCs, SVOCs, Pesticides, PCBs, Metals, Dioxins/Furans, and miscellaneous wet chemistry parameters. Table G-1 in Appendix G presents all chemical parameters, except dioxins, detected in the RDM above the RDCSCC. The dioxin/furans results are discussed in detail in Section 7.5.1.4. A summary of the screening evaluation for RDM under RDCSCC is presented below: $ The concentration of all VOCs, pesticides and PCBs were below the RDCSCC. $ Of the semivolatile parameters analyzed in the RDM sampling, the following were detected
above the RDCSCC:
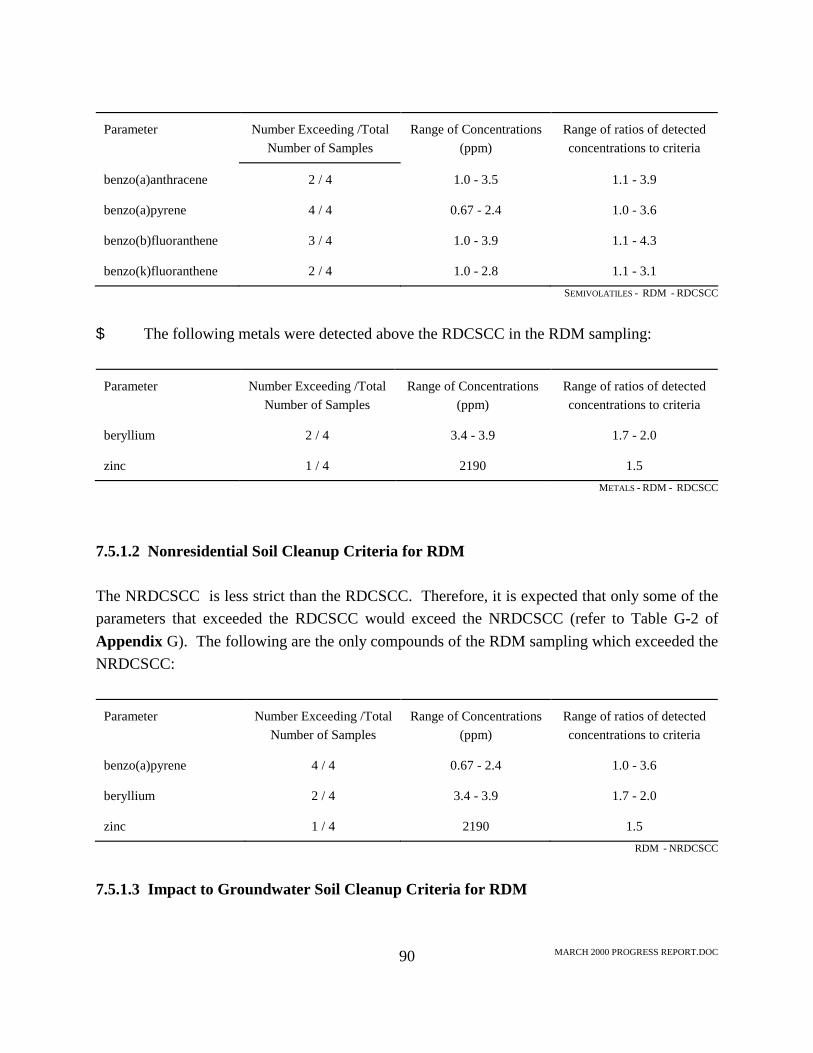
MARCH 2000 PROGRESS REPORT.DOC 90
Parameter
Number Exceeding /Total
Number of Samples
Range of Concentrations
(ppm)
Range of ratios of detected concentrations to criteria
benzo(a)anthracene
2 / 4
1.0 - 3.5
1.1 - 3.9
benzo(a)pyrene
4 / 4
0.67 - 2.4
1.0 - 3.6
benzo(b)fluoranthene
3 / 4
1.0 - 3.9
1.1 - 4.3
benzo(k)fluoranthene
2 / 4
1.0 - 2.8
1.1 - 3.1
SEMIVOLATILES - RDM - RDCSCC
$ The following metals were detected above the RDCSCC in the RDM sampling: Parameter
Number Exceeding /Total
Number of Samples
Range of Concentrations
(ppm)
Range of ratios of detected concentrations to criteria
beryllium
2 / 4
3.4 - 3.9
1.7 - 2.0
zinc
1 / 4
2190
1.5
METALS - RDM - RDCSCC 7.5.1.2 Nonresidential Soil Cleanup Criteria for RDM The NRDCSCC is less strict than the RDCSCC. Therefore, it is expected that only some of the parameters that exceeded the RDCSCC would exceed the NRDCSCC (refer to Table G-2 of Appendix G). The following are the only compounds of the RDM sampling which exceeded the NRDCSCC: Parameter
Number Exceeding /Total
Number of Samples
Range of Concentrations
(ppm)
Range of ratios of detected concentrations to criteria
benzo(a)pyrene
4 / 4
0.67 - 2.4
1.0 - 3.6
beryllium
2 / 4
3.4 - 3.9
1.7 - 2.0
zinc
1 / 4
2190
1.5
RDM - NRDCSCC 7.5.1.3 Impact to Groundwater Soil Cleanup Criteria for RDM
MARCH 2000 PROGRESS REPORT.DOC 91
None of the organic parameters tested for in the RDM were found to exceed the IGWC. The only two inorganic compounds which did not meet the residential and/or nonresidential soil cleanup criteria were zinc and beryllium. The evaluation of site specific soil cleanup criteria for these parameters would be needed if RDM were to be used at residential or non-residential areas. 7.5.1.4 Dioxins for RDM The results of analyses performed on the RDM samples are summarized in Table G-3 of Appendix G. The TEQs for all four samples were determined following the procedure described in Section 7.4.4. The calculated TEQs in four samples are 45.66 ppt, 38.13 ppt, 33.52 ppt and 36.55 ppt. All the TEQs are lower than the action level concentrations of exposure under residential scenario (1 ppb) and non-residential/industrial scenario (5 ppb).
MARCH 2000 PROGRESS REPORT.DOC 92
7.5.2 Stabilized Dredged Material - SDM As a first screening procedure, SDM was tested for Toxicity Characteristic Leaching Procedure (TCLP). As with the RDM, the SDM sample results were also compared to: $ Residential Direct Contact Soil Cleanup Criteria (RDCSCC); $ Nonresidential Direct Contact Soil Cleanup Criteria (NRDCSCC); and $ Impact to Groundwater Criteria (IGWC)[1]. 7.5.2.1 TCLP Characterization of SDM Section 1004(5) of the Resource Conservation and Recovery Act (RCRA) defines hazardous waste as solid waste that may "pose a substantial present or potential threat to human health and the environment when improperly treated, stored, transported, or otherwise managed." RCRA Section 3001 charged EPA with the responsibility of defining which specific solid wastes would be considered hazardous waste either by identifying the characteristics of hazardous waste or listing particular hazardous wastes. In response, the Agency identified four characteristics of hazardous waste: 1) toxicity, 2) corrosivity, 3) reactivity, and 4) ignitability. EPA also developed standardized procedures and criteria for determining whether a waste exhibited one of these characteristics. These characteristics and criteria are codified at 40 CFR Part 261; testing procedures are generally detailed in SW-846.[1] In order to define whether the SDM being used in the Demonstration Project would be classified as a hazardous waste according to the TCLP criteria, two samples (I9695-1 and I9695-2) were collected on February 19, 1999. These samples were analyzed for a full TCLP as recommended by the NJDEP Guidance for Sediment Quality Evaluation dated November 1998. The results are summarized in Table G-4 of Appendix G. The following is a summary of the TCLP results for SDM: $ All TCLP-VOCs, TCLP-SVOCs, TCLP-Pesticides, and TCLP-Herbicides were below
detection limit and thus below the hazardous characterization levels. $ Of the TCLP-Metals, only Barium, Mercury, and Selenium were detected. The detected
concentrations were well below the hazardous characterization levels.

MARCH 2000 PROGRESS REPORT.DOC 93
$ In addition, the samples could not be classified as either ignitible, corrosive, or reactive. Therefore, the TCLP results indicate that the material can not be classified as a hazardous waste. 7.5.2.2 Residential Soil Cleanup Criteria for SDM The SDM samples were analyzed for VOCs, SVOCs, Pesticides, PCBs, Pesticides, Metals, Dioxins/Furans, and miscellaneous wet chemistry parameters. Table G-5 of Appendix G presents all chemical parameters, except dioxins, detected above the RDCSCC. The dioxin/furans results are discussed in detail in Section 7.5.2.5. A summary of the screening evaluation for SDM under RDCSCC is presented below: $ The concentration of all VOCs, pesticides and PCBs were below the RDCSCC. $ Of all semivolatile compounds analyzed, only the following were detected above the
RDCSCC: Parameter
Number Exceeding /Total
Number of Samples
Range of Concentrations
(ppm)
Range of ratios of detected concentrations to criteria
benzo(a)anthracene
2 / 7
1.18 - 1.43
1.3 - 1.6
benzo(a)pyrene
4 / 7
0.69 - 1.28
1.0 - 1.9
benzo(b)fluoranthene
1 / 7
1.16
1.3
benzo(k)fluoranthene
2 / 7
0.977 - 1.36
1.1 - 1.5
SEMIVOLATILES - SDM - RDCSCC As previously presented in Section 7.5.1.1, these parameters were also found to exceed the RDCSCC in the RDM. However, the number of times SDM results exceeded the RDCSCC for these semivolatile compounds is reduced by a factor of approximately 2.
$ The following metals were detected above the RDCSCC in the SDM: Parameter
Number Exceeding /Total
Number of Samples
Range of Concentrations
(ppm)
Range of ratios of detected concentrations to criteria
arsenic
4 / 7
23.3 - 42.6
1.2 - 2.1

MARCH 2000 PROGRESS REPORT.DOC 94
beryllium 3 / 7 2.1 - 2.3 1.1 - 1.2 lead
1 / 7
467
1.2
METALS - SDM - RDCSCC
Both arsenic and lead were detected in the SDM but not in the RDM. This may occur as a result of the variability in quality of the dredged material as sampling is performed on two different samples.
7.5.2.3 Nonresidential Soil Cleanup Criteria for SDM Of all parameters tested and detected above the RDCSCC, only the following remained above the NRDCSCC (refer to Table G-6 of Appendix G): Parameter
Number Exceeding /Total
Number of Samples
Range of Concentrations
(ppm)
Range of ratios of detected concentrations to criteria
benzo(a)pyrene
4 / 7
0.67 - 2.4
1.0 - 1.9
arsenic
4 / 7
23.3 - 42.6
1.2 - 2.1
beryllium
3 / 7 2.1 - 2.3 1.1 - 1.2
SDM - NRDCSCC 7.5.2.4 Impact to Groundwater Soil Cleanup Criteria for SDM None of the organic parameters tested for were found to exceed the IGWC. The only inorganic constituents which did not meet the residential and/or nonresidential soil cleanup criteria were arsenic, beryllium and lead. Evaluation of site specific soil cleanup criteria would be required for these parameters. 7.5.2.5 Dioxins for SDM The results of analyses performed on the seven amended dredge material samples are summarized in Table G-7 of Appendix G. The TEQs for all seven samples were determined following the procedure outlined in Section 7.4.4. The calculated TEQs for all seven samples are 43.65 ppt, 36.86 ppt, 23.972 ppt, 29.58 ppt, 0.057 ppt, 0.061 ppt, and 0.048 ppt. All the TEQs are lower than the action level concentrations of exposure under residential scenario (1 ppb) and non-residential/industrial scenario (5 ppb).

MARCH 2000 PROGRESS REPORT.DOC 95

MARCH 2000 PROGRESS REPORT.DOC 96
7.5.3 SDM Leachates To assess the potential impact on groundwater, MMEP leachates derived from the SDM were evaluated against the Class IIA GWQS. The MMEP leachates are generated over seven days. Seven SDM samples were used to generate leachate samples. Seven leachates were generated from each of four SDM. Only the first leachate was generated from each of the remaining three SDM samples. 7.5.3.1 Groundwater Quality Standards for SDM Leachates As discussed in previous sections of this document, the leachates extracted from the SDM samples were analyzed for VOCs, SVOCs, Pesticides, PCBs, Metals, Dioxins/Furans, and miscellaneous wet chemistry parameters. Table G-8 of Appendix G presents all chemical parameters detected above the GWQS. Of all parameters analyzed, the following were detected above the GWQS: Parameter (No. of SDM samples exceeding / total No. of samples)
SDM Sample
( L:lab, F:field )
Number of Leachates
Exceeding /Total Number of Leachates per Sample
Range of
Concentrations (ppb)
Range of ratios of detected concentrations to criteria
80422 L
2 / 7
0.05 - 39
2.5 - 19.5
80423 L
3 / 7
0.061 - 0.17
3.0 - 8.5
alpha-BHC ( 3 / 7 )
80424 L
1 / 7
0.11
5.5
80422 L
7 / 7
650 - 1570
3.3 - 7.8
80423 L
7 / 7
617 - 2720
3.1 - 13.6
80424 L
7 / 7
765 - 1510
3.8 - 7.5
80425 L
7 / 7
604 - 1620
3.0 - 8.1
I4297-1 F
1 / 1
2040
10.2
I4297-2 F
1 / 1
200
9.7
aluminum ( 7 / 7 )
I4297-3 F
1 / 1
880
4.4
I4297-1 F
1 / 1
31
3.9
arsenic ( 3 / 7 )
I4297-2 F
1 / 1
25
3.1
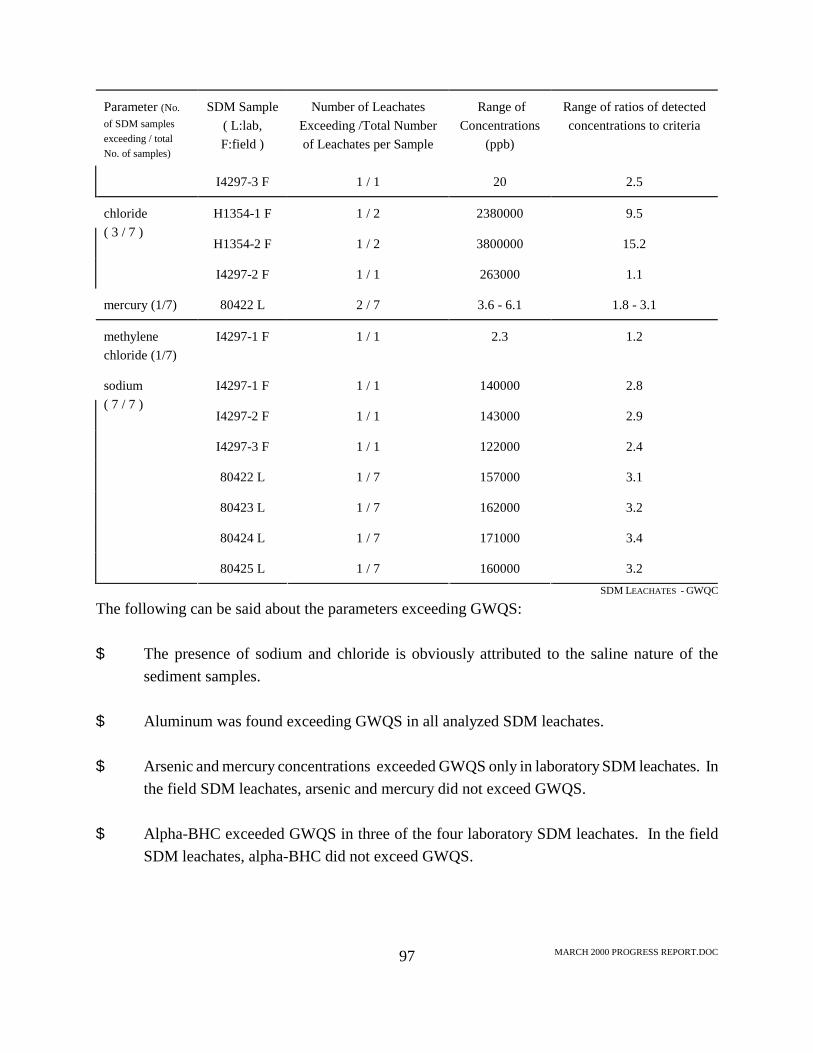
MARCH 2000 PROGRESS REPORT.DOC 97
Parameter (No. of SDM samples exceeding / total No. of samples)
SDM Sample
( L:lab, F:field )
Number of Leachates
Exceeding /Total Number of Leachates per Sample
Range of
Concentrations (ppb)
Range of ratios of detected concentrations to criteria
I4297-3 F
1 / 1
20
2.5
H1354-1 F
1 / 2
2380000
9.5
H1354-2 F
1 / 2
3800000
15.2
chloride ( 3 / 7 )
I4297-2 F
1 / 1
263000
1.1
mercury (1/7)
80422 L
2 / 7
3.6 - 6.1
1.8 - 3.1
methylene chloride (1/7)
I4297-1 F
1 / 1
2.3
1.2
I4297-1 F
1 / 1
140000
2.8
I4297-2 F
1 / 1
143000
2.9
I4297-3 F
1 / 1
122000
2.4
80422 L
1 / 7
157000
3.1
80423 L
1 / 7
162000
3.2
80424 L
1 / 7
171000
3.4
sodium ( 7 / 7 )
80425 L
1 / 7
160000
3.2
SDM LEACHATES - GWQC The following can be said about the parameters exceeding GWQS: $ The presence of sodium and chloride is obviously attributed to the saline nature of the
sediment samples. $ Aluminum was found exceeding GWQS in all analyzed SDM leachates. $ Arsenic and mercury concentrations exceeded GWQS only in laboratory SDM leachates. In
the field SDM leachates, arsenic and mercury did not exceed GWQS. $ Alpha-BHC exceeded GWQS in three of the four laboratory SDM leachates. In the field
SDM leachates, alpha-BHC did not exceed GWQS.
MARCH 2000 PROGRESS REPORT.DOC 98
7.5.3.2 Dioxins for SDM Leachate The dioxin analysis was performed on the first and seventh leachates generated from four samples (ID # 80422, 80423, 80424, and 80425) and the first leachate generated from three samples (ID # 14798-1, 14798-2, and 14798-3). The results of dioxin analysis of seven SDM samples are summarized in Table G-9 of Appendix G. The TEQs for all the samples were determined following the procedure outlined in Section 7.4.4. The calculated TEQs were then compared with the Ground Water Quality Criteria of 0.01 ppb. This analyses indicated that the dioxin TEQs are below the GWQS.

MARCH 2000 PROGRESS REPORT.DOC 99
7.5.4 Percolated Groundwater Samples Water samples were collected and analyzed to assess the actual quality of the liquids percolating through the SDM embankments. As with the MMEP leachates, the sampling results of percolated groundwater samples were compared to the groundwater quality standards (GWQS). As previously explained, only the July 23, 1999 and September 15, 1999 percolated groundwater samples are discussed in this report. 7.5.4.1 Groundwater Quality Standards for Percolated Groundwater Percolated groundwater samples were analyzed for VOCs, SVOCs, Pesticides, PCBs, Metals (total and dissolved), Dioxins/Furans, and miscellaneous wet chemistry parameters. Table 1 of Appendix G-8 presents all chemical parameters detected above the QWQS. The following represents the preliminary findings of percolated samples: $ The concentration of all VOCs, SVOCs, pesticides, PCBs, and Dioxins/Furans were below
the GWQS. As presented in Table G-10 of Appendix G, of all parameters analyzed, the following metals were detected at levels exceeding the GWQS:
Parameter
Number of Samples Exceeding
/Total Number of Samples
Range of
Concentrations (ppb)
Range of ratios of detected concentrations to criteria
aluminum, total
1 / 2
1960
1.5
aluminum, dissolved
1 / 2
290
9.8
chloride
2 / 2
1.01E6 - 1.88E8
4.0 - 75.2
iron, total
2 / 2
3480 - 4300
11.6 - 14.3
iron, dissolved
1 / 2
3520
11.7
lead, total
2 / 2
20 - 35
2.0 - 3.5
lead, dissolved
2 / 2
15 - 19
1.5 - 1.9
manganese, total
2 / 2
1670 - 3280
33.4 - 65.6
manganese, dissolved
2 / 2
1770 - 3400
35.4 - 68
nickel, total
2 / 2
110 - 220
1.1 - 2.2
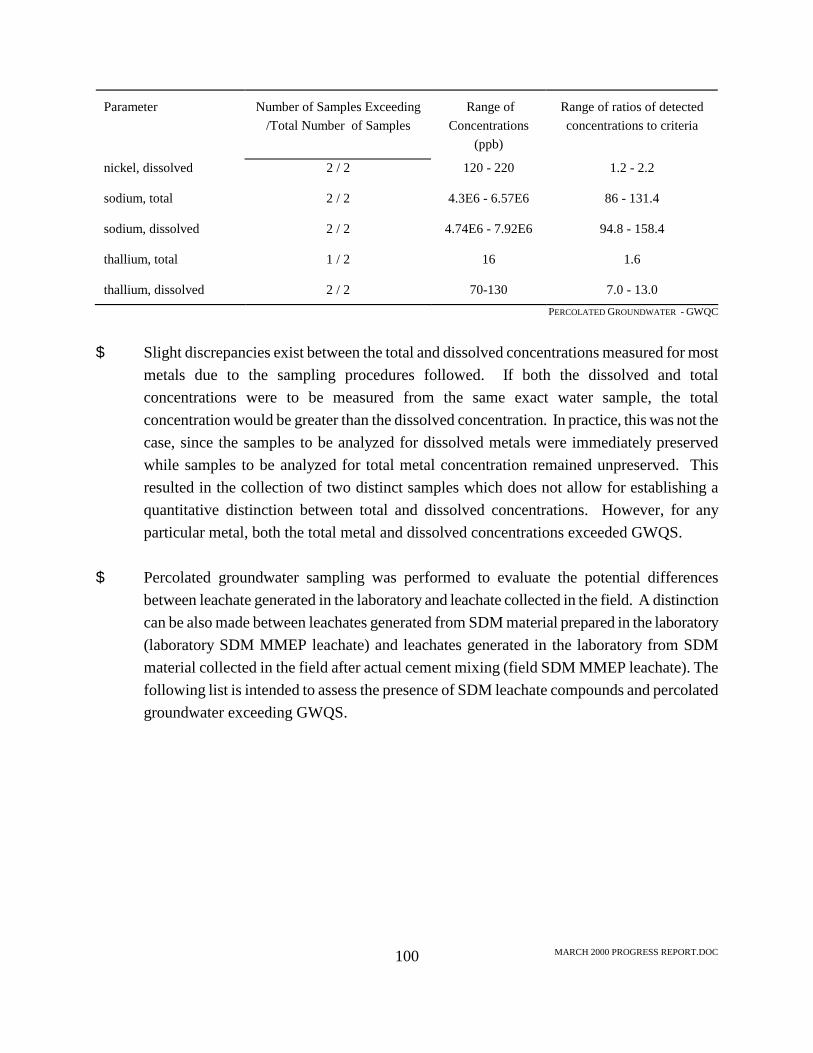
MARCH 2000 PROGRESS REPORT.DOC 100
Parameter
Number of Samples Exceeding
/Total Number of Samples
Range of
Concentrations (ppb)
Range of ratios of detected concentrations to criteria
nickel, dissolved 2 / 2 120 - 220 1.2 - 2.2 sodium, total
2 / 2
4.3E6 - 6.57E6
86 - 131.4
sodium, dissolved
2 / 2
4.74E6 - 7.92E6
94.8 - 158.4
thallium, total
1 / 2
16
1.6
thallium, dissolved
2 / 2
70-130
7.0 - 13.0
PERCOLATED GROUNDWATER - GWQC
$ Slight discrepancies exist between the total and dissolved concentrations measured for most metals due to the sampling procedures followed. If both the dissolved and total concentrations were to be measured from the same exact water sample, the total concentration would be greater than the dissolved concentration. In practice, this was not the case, since the samples to be analyzed for dissolved metals were immediately preserved while samples to be analyzed for total metal concentration remained unpreserved. This resulted in the collection of two distinct samples which does not allow for establishing a quantitative distinction between total and dissolved concentrations. However, for any particular metal, both the total metal and dissolved concentrations exceeded GWQS.
$ Percolated groundwater sampling was performed to evaluate the potential differences
between leachate generated in the laboratory and leachate collected in the field. A distinction can be also made between leachates generated from SDM material prepared in the laboratory (laboratory SDM MMEP leachate) and leachates generated in the laboratory from SDM material collected in the field after actual cement mixing (field SDM MMEP leachate). The following list is intended to assess the presence of SDM leachate compounds and percolated groundwater exceeding GWQS.

MARCH 2000 PROGRESS REPORT.DOC 101
Parameter exceeding GWQC
Incidence in Laboratory SDM MMEP Leachates
Incidence in Field SDM
MMEP Leachates
Incidence in Percolated
Groundwater
alpha-BCH
$ 3 of 4 SDM samples $ 6 of 21 leachates
$ none
$ none
aluminum
$ 4 of 4 SDM samples $ 28 of 28 leachates
$ 3 of 3 SDM samples $ 3 of 3 leachates
$ 2 of 4 samples (total
and dissolved)
arsenic
$ none
$ 3 of 3 SDM samples $ 3 of 3 leachates
$ none
chloride
$ none
$ 3 of 3 SDM samples $ 3 of 3 leachates
$ 2 of 2 samples
iron
$ none
$ none
$ 3 of 4 samples (total
and dissolved)
lead
$ none
$ none
$ 4 of 4 samples (total
and dissolved)
manganese
$ none
$ none
$ 4 of 4 samples (total
and dissolved)
mercury
$ 1 of 4 SDM samples $ 2 of 7 leachates
$ none
$ none
methylene chloride
$ none
$ 1 of 3 samples $ 1 of 1 leachate
$ none
nickel
$ none
$ none
$ 4 of 4 samples (total
and dissolved)
sodium
$ 4 of 4 SDM samples $ 4 of 28 leachates
$ 3 of 3 SDM samples $ 3 of 3 leachates
$ 4 of 4 samples (total
and dissolved)
thallium
$ none
$ none
$ 3 of 4 samples (total
and dissolved)
SDM LEACHATES - PERCOLATED GROUNDWATER

MARCH 2000 PROGRESS REPORT.DOC 102
$ On the incidence of the parameters exceeding GWQS, it is worth noting that:
$ GWQS for aluminum were exceeded in the laboratory SDM leachate, field SDM leachate, and percolated groundwater samples
$ Mercury and Alpha-BCH only exceeded GWQS in the laboratory SDM leachates $ The presence of arsenic above GWQS was detected in the field SDM leachates $ Lead, thallium, nickel, manganese and iron were detected above GWQS only in the
percolated groundwater samples
$ Although SDM leachate sampling results were intended to simulate worst-case scenarios of potential generation of leachate, partial data results may indicate that water samples which have infiltrated the actual SDM represent actual conditions in a more reliable fashion. Percolated groundwater samples account for actual field conditions (i.e., quality of cement mixing in the SDM and potential variability on chemical fixation after complete cement curing), actual atmospheric and rain conditions (i.e., actual acidity and advective/erosive forces), and actual water retention time within the soil matrix.
7.5.4.2 Dioxins for Percolated Groundwater The dioxin analysis was also performed on the two percolated groundwater samples (ID # 15297-1 and 17390). The results of dioxin analysis are summarized in Table G-11 of Appendix G. The TEQs for all the samples were determined following the procedure outlined in Section 7.4.4. As with the MMEP extracts, the calculated TEQs were compared with the GWQS of 0.01 ppb. The analysis indicated that the dioxin TEQs for all percolated groundwater samples are below the GWQS.

MARCH 2000 PROGRESS REPORT.DOC 103
7.5.5 Stormwater Samples Stormwater samples were collected and analyzed to assess the quality of the rainwater runoff which can potentially come into contact with the SDM embankments. Stormwater samples collected during construction of the embankments represent the worst case scenario, since the SDM is exposed without a protective cover. The stormwater sampling results presented in this report come from samples collected when the covers had not been installed at the site (i.e., a) the asphalt millings recently placed at the top of the embankment; and b) the top soil that covers the side slopes of the embankments and the stormwater conveyance system). Now that the capping of the embankments is complete, stormwater samples are being collected from Embankment Number 2 to assess the effectiveness of the final cover. To date, a single stormwater sample has been collected since the embankments were entirely capped. The results of the analyses performed on this sample are still unavailable. As previously indicated, the results obtained from the analyses performed on the stormwater samples collected from the stormwater conveyance system of each embankment were compared to the most stringent of the surface water criteria. Specifically, stormwater sample results were compared against the lowest of the following four criteria of the New Jersey Surface Water Quality Criteria for freshwater designated as FW-2: C FW2-A which represents the criteria identified for acute (as a one hour average) aquatic life. C FW2-C which represents the criteria identified for chronic (as a four day average) aquatic
life. C FW2-H which refers to criteria defined for noncarcinogenic effects based on a 30 day
average. C FW2-HC which refers to criteria defined for carcinogenic effects based on a 70 year average. For dioxin results of stormwater samples, the FW-2 SWC of 0.013 ppq was used. 7.5.5.1 Surface Water Criteria for Stormwater Samples Stormwater samples were analyzed for VOCs, SVOCs, Pesticides, PCBs, Metals (total and dissolved), Dioxins/Furans, and miscellaneous wet chemistry parameters. Table G-12 of Appendix G presents all chemical parameters detected above the SWC.
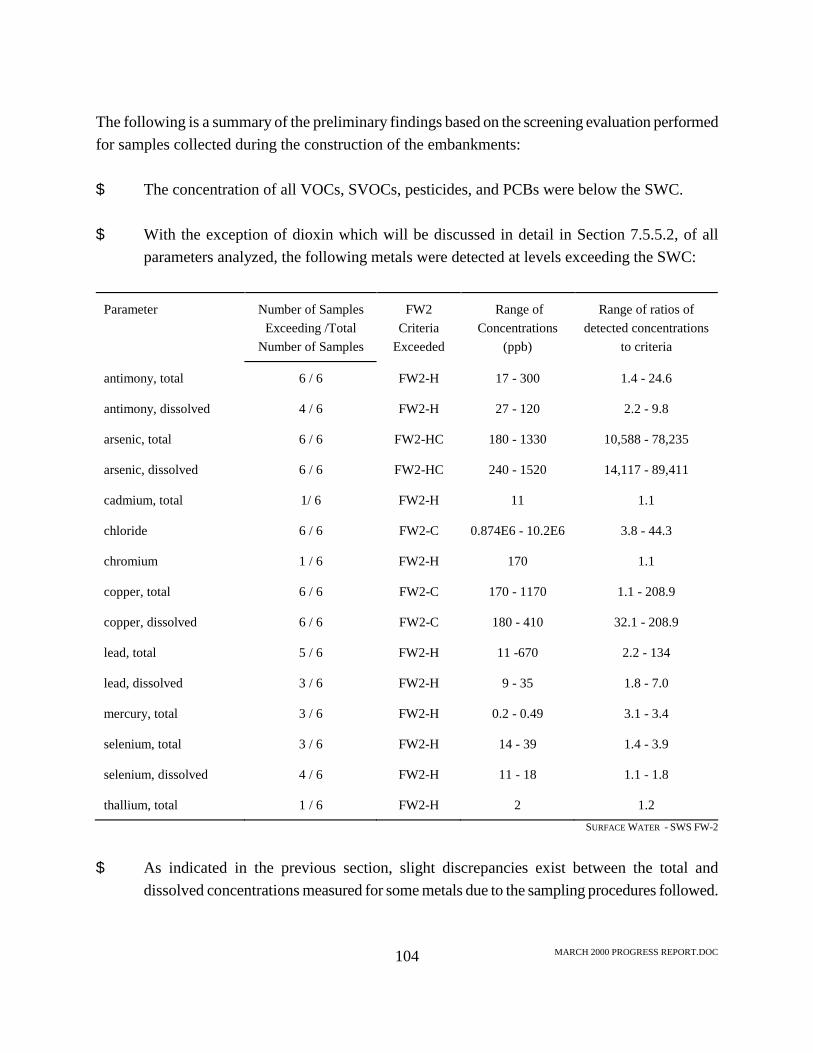
MARCH 2000 PROGRESS REPORT.DOC 104
The following is a summary of the preliminary findings based on the screening evaluation performed for samples collected during the construction of the embankments: $ The concentration of all VOCs, SVOCs, pesticides, and PCBs were below the SWC. $ With the exception of dioxin which will be discussed in detail in Section 7.5.5.2, of all
parameters analyzed, the following metals were detected at levels exceeding the SWC: Parameter
Number of Samples
Exceeding /Total Number of Samples
FW2
Criteria Exceeded
Range of
Concentrations (ppb)
Range of ratios of
detected concentrations to criteria
antimony, total
6 / 6
FW2-H
17 - 300
1.4 - 24.6
antimony, dissolved
4 / 6
FW2-H
27 - 120
2.2 - 9.8
arsenic, total
6 / 6
FW2-HC
180 - 1330
10,588 - 78,235
arsenic, dissolved
6 / 6
FW2-HC
240 - 1520
14,117 - 89,411
cadmium, total
1/ 6
FW2-H
11
1.1
chloride
6 / 6
FW2-C
0.874E6 - 10.2E6
3.8 - 44.3
chromium
1 / 6
FW2-H
170
1.1
copper, total
6 / 6
FW2-C
170 - 1170
1.1 - 208.9
copper, dissolved
6 / 6
FW2-C
180 - 410
32.1 - 208.9
lead, total
5 / 6
FW2-H
11 -670
2.2 - 134
lead, dissolved
3 / 6
FW2-H
9 - 35
1.8 - 7.0
mercury, total
3 / 6
FW2-H
0.2 - 0.49
3.1 - 3.4
selenium, total
3 / 6
FW2-H
14 - 39
1.4 - 3.9
selenium, dissolved
4 / 6
FW2-H
11 - 18
1.1 - 1.8
thallium, total
1 / 6
FW2-H
2
1.2
SURFACE WATER - SWS FW-2 $ As indicated in the previous section, slight discrepancies exist between the total and
dissolved concentrations measured for some metals due to the sampling procedures followed.

MARCH 2000 PROGRESS REPORT.DOC 105
$ Arsenic exceeded the FW2-HC criteria by approximately four orders of magnitude $ Copper exceeded the FW2-C criteria by approximately two orders of magnitude $ Lead exceeded the FW2-H criteria by more than 100 times. $ Cadmium, chromium and thallium marginally exceeded the FW2-H criteria $ Antimony, mercury and selenium exceeded the FW2-H criteria by no more than 20 times. 7.5.5.2 Dioxin Analysis of Stormwater Samples The dioxin analysis was performed on the six stormwater samples for which results were available. The results of the dioxin analysis for these samples are summarized in Table G-13 of Appendix G. The TEQs for all the samples were determined following the procedure outlined in Section 9.4. The calculated TEQs were then compared to the SWC of 0.013 ppq. The calculated TEQs for the stormwater samples are 52.20 ppq, 19.41 ppq, 23.55 ppq, 32.41 ppq, 22.45 ppq, and 31.86 ppq. The dioxin analysis results for stormwater samples indicate that the SWC was exceeded by a factor of 1,450 to 4,000 times the SWC.
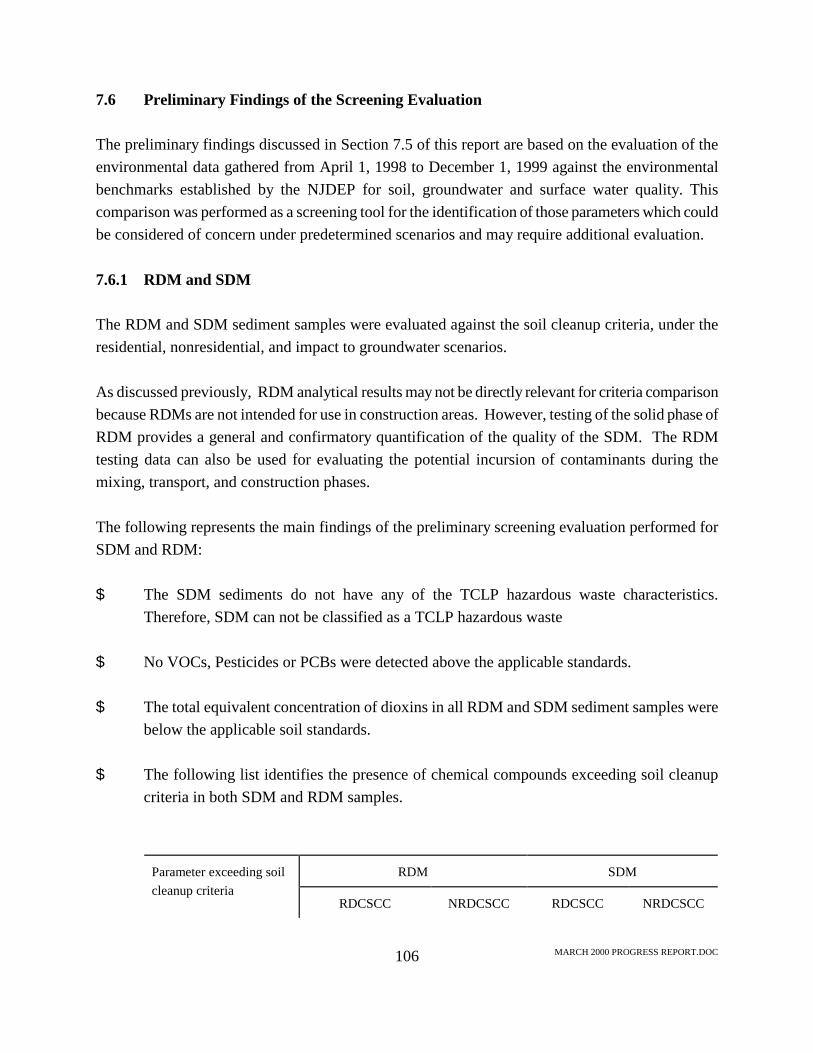
MARCH 2000 PROGRESS REPORT.DOC 106
7.6 Preliminary Findings of the Screening Evaluation The preliminary findings discussed in Section 7.5 of this report are based on the evaluation of the environmental data gathered from April 1, 1998 to December 1, 1999 against the environmental benchmarks established by the NJDEP for soil, groundwater and surface water quality. This comparison was performed as a screening tool for the identification of those parameters which could be considered of concern under predetermined scenarios and may require additional evaluation. 7.6.1 RDM and SDM The RDM and SDM sediment samples were evaluated against the soil cleanup criteria, under the residential, nonresidential, and impact to groundwater scenarios. As discussed previously, RDM analytical results may not be directly relevant for criteria comparison because RDMs are not intended for use in construction areas. However, testing of the solid phase of RDM provides a general and confirmatory quantification of the quality of the SDM. The RDM testing data can also be used for evaluating the potential incursion of contaminants during the mixing, transport, and construction phases. The following represents the main findings of the preliminary screening evaluation performed for SDM and RDM: $ The SDM sediments do not have any of the TCLP hazardous waste characteristics.
Therefore, SDM can not be classified as a TCLP hazardous waste $ No VOCs, Pesticides or PCBs were detected above the applicable standards. $ The total equivalent concentration of dioxins in all RDM and SDM sediment samples were
below the applicable soil standards. $ The following list identifies the presence of chemical compounds exceeding soil cleanup
criteria in both SDM and RDM samples.
RDM
SDM
Parameter exceeding soil cleanup criteria
RDCSCC
NRDCSCC
RDCSCC NRDCSCC

MARCH 2000 PROGRESS REPORT.DOC 107
RDM
SDM
Parameter exceeding soil cleanup criteria
RDCSCC
NRDCSCC
RDCSCC NRDCSCC
Benzo(a)anthracene exceeds exceeds benzo(a)pyrene
exceeds
exceeds
exceeds
exceeds
benzo(b)fluoranthene
exceeds
exceeds
benzo(k) fluoranthene
exceeds
exceeds
beryllium
exceeds
exceeds
exceeds
exceeds
zinc
exceeds
exceeds
arsenic
exceeds
exceeds
lead
exceeds
RDM - SDM $ At present, it is believed that due to the potential localized variations in the quality of the
sediments, lead and arsenic were detected in the SDM but not in the RDM and that zinc was detected in the RDM but not in the SDM.
$ Evaluation of site specific soil cleanup criteria based on the impact to ground water would be
required for lead, arsenic, and beryllium. Given that the exceedances are marginal, alternate levels under specific soil-to-groundwater pathways may allow the presence of these compounds at their detected concentrations
7.6.2 SDM Leachate and Percolated Groundwater SDM leachates and percolated groundwater samples were evaluated against the GWQS to assess potential contaminants of concern. Percolated groundwater sampling was performed to evaluate the potential differences between leachate generated in the laboratory and leachate collected in the field. A distinction was also made between leachates generated from SDM material prepared in the laboratory and leachates generated from SDM material collected in the field after actual cement mixing. Once the chemicals exceeding the applicable standards were identified, the results obtained for the MMEP leachates and the percolated groundwater samples were compared to assess potential
MARCH 2000 PROGRESS REPORT.DOC 108
differences between MMEP generated leachates (laboratory SDM leachates and field SDM leachates) and those obtained in actual field conditions (percolated groundwater samples). The following represents the preliminary findings of the preliminary screening evaluation performed for laboratory and field SDM leachates: $ The presence of sodium and chloride in the SDM leachates is obviously attributed to the
saline nature of the sediment samples. $ Aluminum was found exceeding GWQS in all analyzed SDM leachates. $ Arsenic and mercury concentrations exceeded GWQS only in laboratory SDM leachates. In
the field SDM leachates, arsenic and mercury did not exceed GWQS. $ Alpha-BHC exceeded GWQS in three of the four laboratory SDM leachates. In the field
SDM leachates, alpha-BHC did not exceed GWQS. Comparison between SDM leachates and percolated groundwater resulted in the following preliminary findings: $ The only pesticide detected marginally above the GWQS was alpha-BHC. No pesticides
were detected above the standards in the percolated groundwater samples. $ Neither PCBs nor dioxins were detected in neither the SDM leachates or the percolated
groundwater samples above the applicable standards. $ GWQS for aluminum were exceeded in the laboratory SDM leachate, field SDM leachate,
and percolated groundwater samples. $ Aluminum, arsenic, mercury and sodium were the only metals detected above the GWQS in
several of the SDM leachate samples. $ Of the metals found in the SDM leachate samples exceeding the criteria, only aluminum and
sodium were detected above the GWQS in the percolated groundwater samples. In addition to these metals, iron, lead, manganese, nickel and thallium were detected above the GWQS only in the percolated groundwater samples.
MARCH 2000 PROGRESS REPORT.DOC 109
Although SDM leachate sampling results are intended to simulate worst-case scenarios of potential generation of leachate, preliminary data results seem to indicate that water samples which have infiltrated the actual SDM represent actual and more parameters in a more reliable fashion than those leachates simulated in the laboratory. Percolated groudwater samples account for actual field conditions (i.e., quality of cement mixing in the SDM and potential variability on chemical fixation after complete cement curing), actual atmospheric and rain conditions (i.e., actual acidity and advective/erosive forces), and actual water retention time within the soil matrix. 7.6.3 Stormwater Stormwater samples were collected during construction of the embankments which allowed direct contact of rainwater with SDM. The results of stormwater samples collected after construction (i.e., the embankments covered with topsoil or asphalt millings) are not yet available. Stormwater sampling results are being evaluated against the SWC to assess potential contaminants of concern that may potentially impact the surface water bodies classified as FW2. The following represents the preliminary findings of the data collected during construction: $ No VOCs, SVOCs, Pesticides, or PCBs were detected at levels above the SWC. $ Arsenic exceeded the FW2-HC criteria by approximately five orders of magnitude. $ Copper and lead exceeded the FW2-C and FW2-H criteria, respectively, by approximately
two orders of magnitude. $ Cadmium, chromium and thallium marginally exceeded the FW2-H criteria. $ Antimony, mercury and selenium exceeded the FW2-H criteria by no more than 20 times. $ Dioxin total equivalent concentrations were estimated to be between 1,450 and 4,000 times
the surface water standard of 0.013 ppq. The sampling results indicate that a high potential for contamination of FW2 surface waters exists during construction of roadway structures with SDM. The main contaminants of concern are metals, specifically arsenic, copper and lead. As previously indicated, the capping of the SDM embankments and access roadway is complete and stormwater samples will be collected to assess

MARCH 2000 PROGRESS REPORT.DOC 110
whether a cover over the embankments would result in proper containment of these metals.
MARCH 2000 PROGRESS REPORT.DOC 111
8.0 Summary and Preliminary Findings 8.1 Overview of the Contents of the Progress Report The progress report presents a description of the main construction and monitoring field activities performed as of December 1, 1999 for the Demonstration Project The environmental and geotechnical data obtained during the monitoring activities conducted prior to and during construction are also presented in this progress report. The analytical data collected during the pre-construction and construction periods have been analyzed with proper QA/QC by certified analytical laboratories. After QA/QC, all data were entered into a Data Base System which was designed to facilitate the management of information during the preliminary data screening and evaluation. A preliminary evaluation of these data is also presented in this progress report. The analytical data related to air, dredged materials, leachate, percolated groundwater, and surface water sampling have been compared with applicable standards. Specifically, the analytical results for various environmental samples were compared to the chemical-specific Federal and State criteria/standards that have been established for different media. This comparison is performed as a screening tool for the identification of those parameters which could be considered of concern and may require additional analysis. This evaluation does not include data gathered after the completion of the construction of the embankments. 8.2 Objectives To date, the overall objectives of the Demonstration Project prior and during construction have been fulfilled. Specifically, pre-construction, construction, and monitoring activities have been conducted according to workplans and related documents. Two embankments and an access road were designed and constructed to simulate typical highway configurations. These structures were properly instrumented to monitor the geotechnical and environmental conditions of stabilized dredged materials. Geotechnical/engineering data have been collected to determine the characteristics and behavior of the SDM prior and during construction have been collected and evaluated. Prior to construction and during construction, analytical data for air, RDM, SDM, stormwater and percolated groundwater have been collected, analyzed and processed. A screening evaluation of the data has been performed to identify potential contaminants of concern. At the present time, all design and construction

MARCH 2000 PROGRESS REPORT.DOC 112
activities have been completed. Remaining activities are related to collection of additional data for the final assessment, and preparation of a final report. 8.3 Project Team The main project activities have been implemented by the Project Team consisting of OENJ, Sadat Associates and Soiltek. OENJ is the owner of the Demonstration Project site and General Contractor. Sadat Associates is the Project Manager and is responsible for the overall supervision of the construction activities and the performance of the environmental monitoring and evaluation of the environmental data. Soiltek is responsible for the installation of geotechnical instrumentation, as well as the performance of the geotechnical monitoring and evaluation of the geotechnical data. Numerous construction, laboratory, and consulting firms have also participated in the implementation of the Demonstration Project All phases of the project have been coordinated with members of the interested agencies and their consultants, including the New Jersey Maritime Resources, New Jersey Department of Transportation, New Jersey Department of Environmental Protection, Port Authority of New York and New Jersey, and New Jersey Transit. 8.4 Main Construction and Monitoring Activities Performed to Date Pre-Construction Activities Prior to the initiation of the construction activities, the following activities were performed: $ preparation of workplan(s) and a preliminary design; $ characterization of the raw and SDM to be used for the project; $ a foundation study for the evaluation of the physical and engineering characteristics of the
subbase to be used for the two embankments; and, $ final design and workplan. Construction The preparation of the dredged material, conducted before the actual construction of the embankments, consisted mainly of the following activities: $ Dredging at the Union Dry Dock site: The material used for the construction of the

MARCH 2000 PROGRESS REPORT.DOC 113
Demonstration Project structures was dredged from the Union Dry Dock Site by the Great Lakes Dredging Company. The activities which involved the dredging of a total of approximately 81,000 cubic yards of sediments, were initiated on September 14, 1998 and were completed on November 13, 1998.
$ Material stabilization at the Sea-Land facility: Upon dredging, the RDM was loaded on a
barge and transported to the pugmill at the Sealand processing facility, where it was stabilized by mixing it with 8% by wet weight Type II cement in a pugmill.
$ Transport and stockpiling of the SDM at the construction site. The SDM was loaded onto
trucks and transported to the designated areas at Parcel G. At Parcel G, the dredged material was stockpiled from October 1998 to February 1999.
The actual embankment construction activities mainly included: $ Preparation of a platform and a foundation for construction of the embankments. According
to the results of the Foundation Study conducted by Soiltek, it was recommended that a reinforced geosynthetic fabric be installed at the base of each of the embankments to arrest some of the anticipated settlements and allow for a more uniform settlement. The reinforced geosynthetic fabrics for both embankments were installed according to the manufacturer=s specifications.
$ Construction of the embankments and access roadway. After aeration and drying, each
structure was built by compacting layers of SDM. The compaction of each layer (lift) was monitored by different methods, including nuclear testing for density, laboratory determination of moisture content, and Humboldt Stiffness Gauge and Clegg Hammer field tests for dry density determination. Each lift was compacted according to specifications.
The construction of Embankment No. 1 started on June 23, 1999 with the preparation of the structure=s platform and was completed on September 30, 1999. Embankment No. 1 was constructed along the northern portion of Parcel G. This structure is 620 feet long, 130 feet wide at the top and 180 feet wide at the base. The maximum height of the embankment is 10 feet above grade. The structure encompasses approximately 1.5 acres of land. The slopes of the embankment are 2:1 (horizontal : vertical) along its northeastern face and 1.5:1 along its southwestern face. The slopes at the access ramps are 15:1.
The construction of Embankment No. 2 started on February 19, 1999 and was completed on

MARCH 2000 PROGRESS REPORT.DOC 114
June 28, 1999. Embankment No. 2 was constructed south of Embankment No. 1. The structure is 580 feet long, 90 feet wide at the top and 150 feet wide at the base. The maximum height of the embankment is 13 feet above grade. Embankment No. 2 encompasses approximately one acre of Parcel G. This structure has slopes of 2:1 along its northeastern and southwestern sides, and slopes 15:1 along the slopes at the access ramps.
The construction of the access roadway started on June 1, 1999 and finished on July 16, 1999. The access roadway was constructed west of the two embankments. It encompasses a total of approximately 1.4 acres, and has a top width of about 85 feet, a bottom width of approximately 90 feet and a final height of 3.5 feet above the ground surface.
Approximately six to eight inches of topsoil were placed on the slopes of the embankments and access road
$ Installation of geotechnical monitoring devices. Specifically, two horizontal inclinometers,
four vertical inclinometers, and fifteen settlement plates were installed. $ Installation of a meteorological station and air monitoring devices to be used during the air
sampling activities during construction. $ Installation of collection systems for percolating water. Water collection systems were
installed at the base of Embankment No. 1 and Embankment No. 2 to collect any liquid that could percolate through the embankments. The collection systems for percolating water were designed and constructed to run along the length of each of the embankments to a manhole and then to an existing 6-inch HDPE leachate cleanout pipe.
$ Installation of stormwater conveyance systems. The installation of the stormwater systems
involved the excavation of ditches at the base of the two embankments. An additional ditch connecting the two stormwater ditches was built to carry the stormwater runoff into the northern wetlands transition area. A total of six inches of top soil was placed on the top and the sides of the stormwater ditches, which were then hydroseeded.
Monitoring Geotechnical monitoring conducted prior to, and during construction, mainly included:

MARCH 2000 PROGRESS REPORT.DOC 115
$ cement content testing; $ subsurface investigation for design of the foundation; $ laboratory testing of SDM strength parameters; $ field compaction monitoring; $ settlement monitoring; and $ inclinometer monitoring. Environmental monitoring and sampling has been performed at different phases of the project for various parameters in order to characterize the materials involved in the construction and to assess potential adverse environmental conditions. Environmental monitoring activities mainly included the sampling and characterization of: $ Solids: Raw Dredged Material (RDM), and Stabilized Dredged Material (SDM) $ Liquids: Leachate generated from SDM samples, Stormwater Runoff, and Percolated
Groundwater $ Air: Airborne / dust samples collected during construction

MARCH 2000 PROGRESS REPORT.DOC 116
8.4 Preliminary Evaluations and Findings 8.4.1 Construction Cost Estimation Because a great portion of the construction activities was dedicated to drying the SDM to acceptable water content levels, the efforts and costs associated with this activity were evaluated to compare them with those associated with handling of conventional materials used for the construction of subbase in roadway projects. Only equipment and labor cost for spreading, disking and compaction were included in the cost estimation since these costs are directly associated with the handling of SDM exhibiting high water content. On an average, each lift of SDM was spread in two days. Disking and compacting generally took two to four days before meeting construction specifications. The number of days for the drying, aerating and compacting efforts depended on the initial moisture content and weather conditions. The overall construction cost for one cubic yard of dredged material was estimated to be approximately $8.10. A measurable correlation was established between the construction cost and rain events. The cost associated with lifts which experienced rain events during construction period was estimated to be $8.60 per cubic yard, compared to the $7.50 per cubic yard for lifts which experienced no rain events. The costs associated with the handling of dredged material are three to four times higher than the costs associated with the handling of a conventional material. The high costs associated with the dredged materials can be possibly reduced by using different drying methods during the mixing and stabilization of the RDM. The temporary storing of the dredged material during periods of dry and warm weather will help reduce the initial moisture content by minimizing the use of equipment and labor for the onsite aerating and drying of SDM.

MARCH 2000 PROGRESS REPORT.DOC 117
8.4.2 Geotechnical Preliminary Data Analysis
Based on the preliminary evaluation of the geotechnical field data collected prior and during construction, the following conclusions have been reach by Soiltek: $ Cement inclusion increased the strength of the material significantly under ideal in-place
treated conditions. However, the strength gain was reduced due to the continual breaking of cemented bonds in the dredge material due to mixing and disking. This effect has been observed in the laboratory during testing and also in the field by cone penetration testing.
$ As long as the dredge material is compacted under the construction compaction criteria,
consolidation effects are minimal. This has been confirmed by laboratory testing, as well as by review of the field data collected from the settlement plates.
$ Utilizing alternative methods for compaction control, such as the Humboldt Stiffness Gauge
and the Cleff Impact Hammer, may allow for a more time efficient way of determining dry density of the cement SDM. However, these devices and methods need to be carefully calibrated with respect to site conditions prior to any field work.
$ The addition of the geomembrane under the embankments allowed for a more even
settlement of the structures. Differential settlement in the embankments was minimized by using this type of foundation improvement.
$ Laboratory results and computer models used to predict the slope stability of the
embankment have shown that the embankments have a fairly high factor of safety against slope failure. This has been verified from the available inclinometer data. From the field results, it can be concluded that the embankments have structurally performed up to the expected levels.
Soiltek also presents the following preliminary observations made during construction: $ The SDM is sensitive to moisture. If the dredge material failed the compaction criteria at a
general location, it most likely failed the criteria due to excessive moisture content, rather than not reaching the maximum dry density.
$ The continual mixing and disking of the dredge material to aid its drying seemed to have an
adverse affect on the cementation of the material. (i.e., the cement bonds of the material
MARCH 2000 PROGRESS REPORT.DOC 118
were continually broken. Then, once the material was recompacted, some of the cementation effect of the material had dissipated from previous cementing. A solution to this problem may be to allow the material to hydrate and compact in place. A greater strength gain may be seen this way.)
$ Due to the higher temperatures and less precipitation, the material is much easier to use and
place in the summer months than during the spring or fall months. $ Utilizing the geomembranes underneath the embankments allows for an even distribution of
settlement to occur during the consolidation of the garbage and organic layers, especially on Embankment #2. Although the actual preloading and its corresponding effects were not directly measured, settlements on Embankment No. 1 seem to be less than Embankment No. 2 due to initial preloading of stockpiled dredge material.
The CPT field investigation and preliminary evaluation are presented in the Soiltek Status Report. As described in this report, a total number of 25 locations were tested for both embankments during the months of October and November, 1999. An initial evaluation of results indicates that the laboratory and the field shear strength measurements are within reasonable agreement. A complete analysis of the geotechnical data will be performed after completion of the post-construction monitoring period.

MARCH 2000 PROGRESS REPORT.DOC 119
8.4.3 Air Monitoring Data Evaluation Air samples collected to assess ambient air quality impacts from the use of SDM for construction purposes were evaluated by comparisons between samples that were collected downwind/crosswind to the area of construction and an upwind sample or background sample that served as a control. Air samples were also collected in the workers= breathing zone, by fitting personal samplers on site workers to determine occupational exposure. The results of the personal sampling were compared to occupational exposure limits defined by the federal Occupational Safety & Health Administration (OSHA), National Institute of Occupational Safety & Health (NIOSH), and American Conference of Governmental Industrial Hygienists (ACGIH). Individual compounds, except vapor phase PCBs, measured in the ambient air were no more than an order of magnitude greater than reported in individual samples elsewhere. The exception was vapor phase PCBs, which were at concentrations much greater than observed in a major urban area. In addition, since the samples were collected only ~150 feet from areas of active construction, the diffusion of any air contaminants contributed by the SDM is expected to be significant as distance from the source areas increases. The target particulate pollutants and vapor phase PAH concentrations measured in the ambient air around the embankment construction areas are similar to concentrations of each pollutant measured previously or currently in New Jersey and other locations in the United States. Based on the results of the air sampling program, the potential impacts to ambient air quality and worker health are not expected to be significant for total and respirable airborne particulates, metals, PAHs and pesticides. While PCBs in the particulate phase do not appear to be present in significant concentrations in both ambient air and in the workers= breathing zone, vapor-phase PCB concentrations measured in the area samples were found to be higher than those measured in another urban area. The data do not conclusively indicate that the SDM is the primary source of the observed PCB vapor concentrations. It is possible that background sources may have contributed to the observed PCB vapor concentrations. Because the Demonstration Project was performed in an industrial location, background conditions may have influenced some of the samples, however, even with these interferences, the results indicate that using the dredge material in the manner done at the Demonstration Site does not have a significant effect on the air concentrations of most compounds in the surrounding work place and community environment. 8.4.4 Screening Evaluation for Environmental Sampling

MARCH 2000 PROGRESS REPORT.DOC 120
All analytical data collected during the pre-construction and construction periods were analyzed with proper QA/QC by certified analytical laboratories. After these evaluations, all data were entered into a Data Base System which was designed to facilitate the management of information during the preliminary data screening and evaluation. To date, the Data Base System consists of 9489 concentration results from approximately 261 different parameters and 106 different samples. Computer algorithms have been set up to classify and sort the data according to the criteria used for evaluation. The preliminary findings discussed in this report were based on the evaluation of the environmental data gathered from April 1, 1998 to December 1, 1999 against the environmental benchmarks established by the NJDEP for soil, groundwater and surface water quality. Specifically, results of the soil and aqueous samples were compared to the applicable New Jersey soil, surface and groundwater quality criteria: $ Soil sample results were compared with: a) Residential Direct Contact Soil Cleanup Criteria
(ARDCSCC@); b) Non-Residential Direct Contact Soil Cleanup Criteria (ANRDCSCC@); and c) Impact to Groundwater Soil Cleanup Criteria (AIGWSCC@). For dioxin results from soil samples, the levels of 1ppb (TEQs) for residential soils and 5 ppb (TEQs) for nonresidential soils were used.
$ SDM leachates and percolated groundwater sample results were compared with the New
Jersey Groundwater Water Quality Standards (GWQS), Class IIA Aquifers or Drinking Water Aquifers. For dioxin results of SDM leachates and percolated groundwater, the Class II GWQS of 0.01 ppb was used.
$ Stormwater sample results were compared against the lowest of the four criteria of the New
Jersey Surface Water Quality Criteria for freshwater designated as FW-2; a) FW2-A - acute aquatic life; b) FW2-C - chronic aquatic life; c) FW2-H - human health noncarcinogenic effects; and d) FW2-HC - human health carcinogenic effects. For dioxin results of stormwater samples, the FW-2 SWC of 0.013 ppq was used.
This comparison was performed as a screening tool for the identification of those parameters which could be considered of concern under predetermined scenarios and may require additional evaluation. Following are the main preliminary findings of this screening evaluation:
MARCH 2000 PROGRESS REPORT.DOC 121
Screening Evaluation of RDM and SDM Sampling Results $ The SDM sediments do not have any of the TCLP hazardous waste characteristics.
Therefore, SDM can not be classified as a TCLP hazardous waste $ For SDM and RDM, no VOCs, Pesticides or PCBs were detected above the applicable
standards. $ The total equivalent concentration of dioxins in all RDM and SDM sediment samples were
below the applicable standards. $ Evaluation of site specific soil cleanup criteria based on the impact to ground water would be
required for lead, arsenic, and beryllium. Given that the exceedances are marginal, alternate levels under specific soil-to-groundwater pathways may allow the presence of these compounds at their detected concentrations
Screening Evaluation of SDM Leachates $ Sodium was found to exceed the GWQS in both field and laboratory SMD leachates.
Chloride was only tested in the laboratory SDM leachates and was found to exceed the GWQS in three of five samples generated. However, the presence of sodium and chloride in the SDM leachates is obviously attributed to the saline nature of the sediment samples.
$ Aluminum was found exceeding GWQS in all analyzed SDM leachates. $ Arsenic and mercury concentrations exceeded GWQS only in laboratory SDM leachates.
However, in the field SDM leachates, arsenic and mercury did not exceed GWQS. $ Alpha-BHC exceeded GWQS in three of the four laboratory SDM leachates. However, in
the field SDM leachates, alpha-BHC did not exceed GWQS. SDM leachates vs. percolated groundwater sampling results $ The only pesticide detected marginally above the GWQS was alpha-BHC. No other
pesticides were detected above the standards in the percolated groundwater samples.

MARCH 2000 PROGRESS REPORT.DOC 122
$ Neither PCBs nor dioxins were detected in neither the SDM leachates or the percolated groundwater samples above the applicable standards.
$ GWQS for aluminum were exceeded in the laboratory SDM leachate, field SDM leachate,
and percolated groundwater samples. $ Arsenic, mercury and sodium were detected above the GWQS in several of the SDM
leachate samples. $ Of the metals found in the SDM leachate samples exceeding the criteria, only aluminum and
sodium were detected above the GWQS in the percolated groundwater samples. In addition to these metals, iron, lead, manganese, nickel and thallium were detected above the GWQS in the percolated groundwater samples.
$ Although SDM leachate sampling results are intended to simulate worst-case scenarios of
potential generation of leachate, preliminary results seem to indicate that water samples which have infiltrated the actual SDM identify actual and more parameters in a more reliable fashion than those leachates simulated in the laboratory. Water samples account for actual field conditions (i.e., quality of cement mixing in the SDM and potential variability on chemical fixation after complete cement curing), actual atmospheric and rain conditions (i.e., actual acidity and advective/erosive forces), and actual water retention time within the soil matrix.
Screening Evaluation of Stormwater Sampling Results $ No VOCs, SVOCs, Pesticides, PCBS, or Dioxins were detected at levels above the SWC. $ Arsenic exceeded the FW2-HC criteria by approximately four orders of magnitude. $ Copper and lead exceeded the FW2-C and FW2-H criteria, respectively, by approximately
two orders of magnitude. $ Cadmium, chromium and thallium marginally exceeded the FW2-H criteria. $ Antimony, mercury and selenium exceeded the FW2-H criteria by no more than 20 times.
The sampling results indicate that a high potential for contamination of FW2 surface waters exists

MARCH 2000 PROGRESS REPORT.DOC
during construction of roadway structures with SDM. The main contaminants of concern are metals, specifically arsenic, copper and lead. The capping of the SDM embankments and access roadway is complete and stormwater samples will be collected to assess whether a cover over the embankments would result in proper containment of these metals. The final report will include the evaluation of the stormwater sampling results after construction and recommended measures for stormwater control during construction.

MARCH 2000 PROGRESS REPORT.DOC
8.5 Remaining Activities for Project Completion
The remaining activities for the completion of the project mainly include the geotechnical and environmental post construction monitoring, the processing of the data and the evaluation of results. The remaining activities for the geotechnical portion of the report include the following:
$ Completion of the laboratory investigation to evaluate the engineering behavior of SDM when the percent cement is reduced and determine any potential additional benefits for workability or strength resulting from the addition of fly-ash to the SDM. The laboratory results will be compared with the field strength monitoring to evaluate laboratory and field curing time and the appropriateness of the laboratory procedures to represent actual field conditions.
$ Completion of the field settlement and slope deformation monitoring and evaluation
of results.
$ Completion of the cone penetration testing to determine the in-situ strength characteristics and potential changes in strength of the SDM with time.
$ Analysis of the data and evaluation of the results to formulate conclusions for the
testing, design and construction of SDM structures. The remaining activities for the environmental portion of the report include the following:
$ Collection and analyses of SDM samples to evaluate potential long-term chemical
changes.
$ Collection and analyses of percolated groundwater samples to further evaluate the actual quality of water percolating through the embankments.
$ Collection and analyses of storm water samples to assess whether covering the
embankments will result in proper containment of the metals exceeding surface water criteria.
$ Screening evaluation of the environmental data collected during the post-construction
monitoring period.

MARCH 2000 PROGRESS REPORT.DOC
$ Evaluation of contaminant migration pathways under generic scenarios to assess potential environmental impacts to surface water, groundwater, and other environmental receptors.
The environmental and geotechnical studies will be collectively evaluated to determine the feasibility of implementation of standard guidelines and control measures for the use of SDM in NJDOT projects.

APPENDIX G
Screening Evaluation and Environmental Data

Table G1: Raw Dredge Exceeding the Residential Soil Cleanup Criteria ID DATE C PARAMETER CAS RN TYPE CONC Q RDCSCC FLAG RATIO 80420 4/1/1998 C Benzo(a)anthracene 56-55-3 Semivolatile 1 pp J 0.9 ppm 1.1 s m 80421 4/1/1998 D Benzo(a)anthracene 56-55-3 Semivolatile 3.5 pp 0.9 ppm 3.9 s m 80418 4/1/1998 A Benzo(a)pyrene 50-32-8 Semivolatile 0.67 pp J 0.66 ppm f 1.0 s m 80419 4/1/1998 B Benzo(a)pyrene 50-32-8 Semivolatile 0.79 pp J 0.66 ppm f 1.2 s m 80420 4/1/1998 C Benzo(a)pyrene 50-32-8 Semivolatile 1.1 pp J 0.66 ppm f 1.7 s m 80421 4/1/1998 D Benzo(a)pyrene 50-32-8 Semivolatile 2.4 pp 0.66 ppm f 3.6 s m 80420 4/1/1998 C Benzo(b)fluoranthene 205-99-2 Semivolatile 1 pp J 0.9 ppm 1.1 s m 80419 4/1/1998 B Benzo(b)fluoranthene 205-99-2 Semivolatile 1.5 pp JY 0.9 ppm 1.7 s m 80421 4/1/1998 D Benzo(b)fluoranthene 205-99-2 Semivolatile 3.9 pp 0.9 ppm 4.3 s m 80420 4/1/1998 C Benzo(k)fluoranthene 207-08-9 Semivolatile 1 pp J 0.9 ppm 1.1 s m 80421 4/1/1998 D Benzo(k)fluoranthene 207-08-9 Semivolatile 2.8 pp 0.9 ppm 3.1 s m 80419 4/1/1998 B Beryllium 7440-41-7 Metals 3.4 pp 2 ppm e 1.7 m 80421 4/1/1998 D Beryllium 7440-41-7 Metals 3.9 pp 2 ppm e 2.0 m 80421 4/1/1998 D Zinc 7440-66-6 Metals 2190 pp 1500 ppm m 1.5 m
Wednesday, October 24, 2001 Page 1 of 1
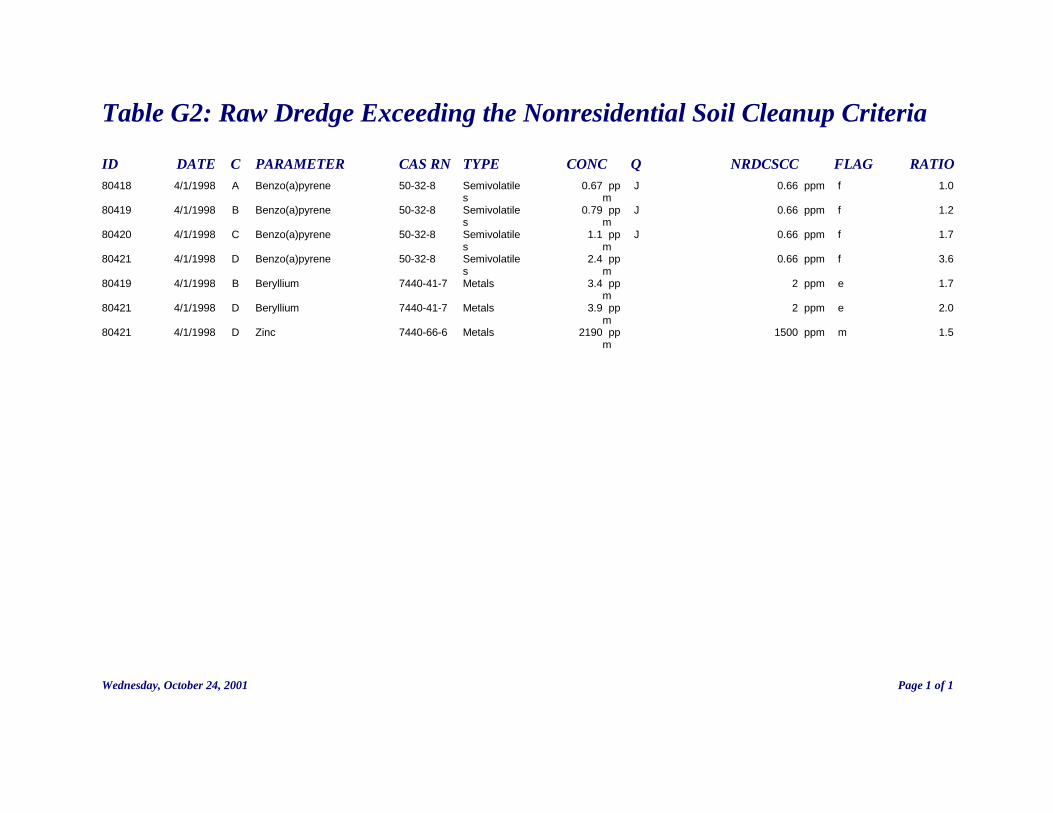
Table G2: Raw Dredge Exceeding the Nonresidential Soil Cleanup Criteria ID DATE C PARAMETER CAS RN TYPE CONC Q NRDCSCC FLAG RATIO 80418 4/1/1998 A Benzo(a)pyrene 50-32-8 Semivolatile 0.67 pp J 0.66 ppm f 1.0 s m 80419 4/1/1998 B Benzo(a)pyrene 50-32-8 Semivolatile 0.79 pp J 0.66 ppm f 1.2 s m 80420 4/1/1998 C Benzo(a)pyrene 50-32-8 Semivolatile 1.1 pp J 0.66 ppm f 1.7 s m 80421 4/1/1998 D Benzo(a)pyrene 50-32-8 Semivolatile 2.4 pp 0.66 ppm f 3.6 s m 80419 4/1/1998 B Beryllium 7440-41-7 Metals 3.4 pp 2 ppm e 1.7 m 80421 4/1/1998 D Beryllium 7440-41-7 Metals 3.9 pp 2 ppm e 2.0 m 80421 4/1/1998 D Zinc 7440-66-6 Metals 2190 pp 1500 ppm m 1.5 m
Wednesday, October 24, 2001 Page 1 of 1
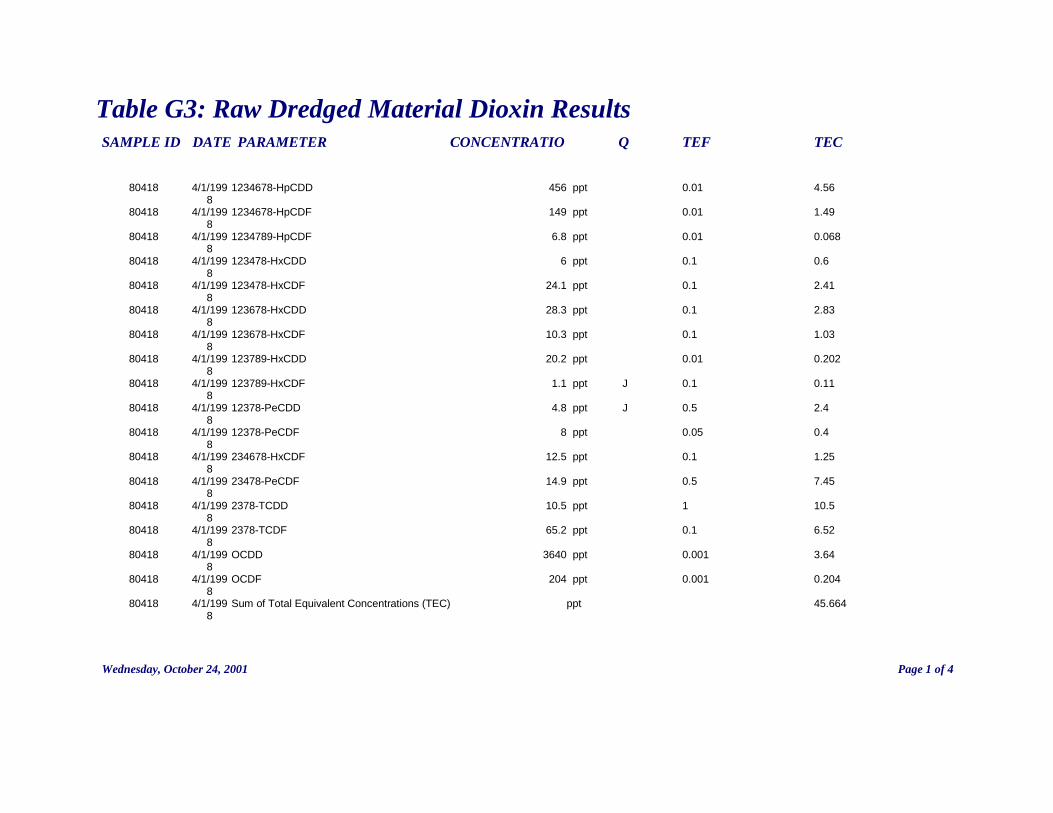
Table G3: Raw Dredged Material Dioxin Results SAMPLE ID DATE PARAMETER CONCENTRATIO Q TEF TEC
80418 4/1/199 1234678-HpCDD 456 ppt 0.01 4.56 8 80418 4/1/199 1234678-HpCDF 149 ppt 0.01 1.49 8 80418 4/1/199 1234789-HpCDF 6.8 ppt 0.01 0.068 8 80418 4/1/199 123478-HxCDD 6 ppt 0.1 0.6 8 80418 4/1/199 123478-HxCDF 24.1 ppt 0.1 2.41 8 80418 4/1/199 123678-HxCDD 28.3 ppt 0.1 2.83 8 80418 4/1/199 123678-HxCDF 10.3 ppt 0.1 1.03 8 80418 4/1/199 123789-HxCDD 20.2 ppt 0.01 0.202 8 80418 4/1/199 123789-HxCDF 1.1 ppt J 0.1 0.11 8 80418 4/1/199 12378-PeCDD 4.8 ppt J 0.5 2.4 8 80418 4/1/199 12378-PeCDF 8 ppt 0.05 0.4 8 80418 4/1/199 234678-HxCDF 12.5 ppt 0.1 1.25 8 80418 4/1/199 23478-PeCDF 14.9 ppt 0.5 7.45 8 80418 4/1/199 2378-TCDD 10.5 ppt 1 10.5 8 80418 4/1/199 2378-TCDF 65.2 ppt 0.1 6.52 8 80418 4/1/199 OCDD 3640 ppt 0.001 3.64 8 80418 4/1/199 OCDF 204 ppt 0.001 0.204 8 80418 4/1/199 Sum of Total Equivalent Concentrations (TEC) ppt 45.664 8
Wednesday, October 24, 2001 Page 1 of 4

Raw Dredged Material Dioxin Results SAMPLE ID DATE PARAMETER CONCENTRATIO Q TEF TEC
80419 4/1/199 1234678-HpCDD 458 ppt 0.01 4.58 8 80419 4/1/199 1234678-HpCDF 133 ppt 0.01 1.33 8 80419 4/1/199 1234789-HpCDF 6.4 ppt 0.01 0.064 8 80419 4/1/199 123478-HxCDD 5.8 ppt PR 0.1 0.58 8 80419 4/1/199 123478-HxCDF 22.8 ppt 0.1 2.28 8 80419 4/1/199 123678-HxCDD 28.4 ppt 0.1 2.84 8 80419 4/1/199 123678-HxCDF 9.4 ppt 0.1 0.94 8 80419 4/1/199 123789-HxCDD 19.1 ppt 0.01 0.191 8 80419 4/1/199 123789-HxCDF 1.5 ppt XJ 0.1 0.15 8 80419 4/1/199 12378-PeCDD 4.3 ppt J 0.5 2.15 8 80419 4/1/199 12378-PeCDF 7.7 ppt 0.05 0.385 8 80419 4/1/199 234678-HxCDF 10.4 ppt Q 0.1 1.04 8 80419 4/1/199 23478-PeCDF 16.4 ppt 0.5 8.2 8 80419 4/1/199 2378-TCDD 5.6 ppt 1 5.6 8 80419 4/1/199 2378-TCDF 39.8 ppt 0.1 3.98 8 80419 4/1/199 OCDD 3650 ppt 0.001 3.65 8 80419 4/1/199 OCDF 175 ppt 0.001 0.175 8 80419 4/1/199 Sum of Total Equivalent Concentrations (TEC) ppt 38.135 8
Wednesday, October 24, 2001 Page 2 of 4

Raw Dredged Material Dioxin Results SAMPLE ID DATE PARAMETER CONCENTRATIO Q TEF TEC
80420 4/1/199 1234678-HpCDD 384 ppt 0.01 3.84 8 80420 4/1/199 1234678-HpCDF 109 ppt 0.01 1.09 8 80420 4/1/199 1234789-HpCDF 4.7 ppt J 0.01 0.047 8 80420 4/1/199 123478-HxCDD 5.2 ppt PR 0.1 0.52 8 80420 4/1/199 123478-HxCDF 19.6 ppt 0.1 1.96 8 80420 4/1/199 123678-HxCDD 23.9 ppt 0.1 2.39 8 80420 4/1/199 123678-HxCDF 7.9 ppt 0.1 0.79 8 80420 4/1/199 123789-HxCDD 16.9 ppt 0.01 0.169 8 80420 4/1/199 123789-HxCDF 1.1 ppt XJ 0.1 0.11 8 80420 4/1/199 12378-PeCDD 3.9 ppt J 0.5 1.95 8 80420 4/1/199 12378-PeCDF 7.3 ppt PR 0.05 0.365 8 80420 4/1/199 234678-HxCDF 9 ppt 0.1 0.9 8 80420 4/1/199 23478-PeCDF 14.5 ppt 0.5 7.25 8 80420 4/1/199 2378-TCDD 5.4 ppt PR 1 5.4 8 80420 4/1/199 2378-TCDF 35.4 ppt 0.1 3.54 8 80420 4/1/199 OCDD 3070 ppt 0.001 3.07 8 80420 4/1/199 OCDF 129 ppt 0.001 0.129 8 80420 4/1/199 Sum of Total Equivalent Concentrations (TEC) ppt 33.52 8
Wednesday, October 24, 2001 Page 3 of 4

Raw Dredged Material Dioxin Results SAMPLE ID DATE PARAMETER CONCENTRATIO Q TEF TEC
80421 4/1/199 1234678-HpCDD 397 ppt 0.01 3.97 8 80421 4/1/199 1234678-HpCDF 102 ppt 0.01 1.02 8 80421 4/1/199 1234789-HpCDF 6.1 ppt 0.01 0.061 8 80421 4/1/199 123478-HxCDD 5.3 ppt 0.1 0.53 8 80421 4/1/199 123478-HxCDF 17.7 ppt PR 0.1 1.77 8 80421 4/1/199 123678-HxCDD 23.9 ppt 0.1 2.39 8 80421 4/1/199 123678-HxCDF 7.3 ppt 0.1 0.73 8 80421 4/1/199 123789-HxCDD 18 ppt PR 0.01 0.18 8 80421 4/1/199 123789-HxCDF 2.5 ppt PRXJ 0.1 0.25 8 80421 4/1/199 12378-PeCDD 3.8 ppt J 0.5 1.9 8 80421 4/1/199 12378-PeCDF 7.7 ppt 0.05 0.385 8 80421 4/1/199 234678-HxCDF 11.6 ppt PR 0.1 1.16 8 80421 4/1/199 23478-PeCDF 13.8 ppt 0.5 6.9 8 80421 4/1/199 2378-TCDD 6.7 ppt 1 6.7 8 80421 4/1/199 2378-TCDF 53.1 ppt 0.1 5.31 8 80421 4/1/199 OCDD 3120 ppt 0.001 3.12 8 80421 4/1/199 OCDF 175 ppt 0.001 0.175 8 80421 4/1/199 Sum of Total Equivalent Concentrations (TEC) ppt 36.551 8
Wednesday, October 24, 2001 Page 4 of 4

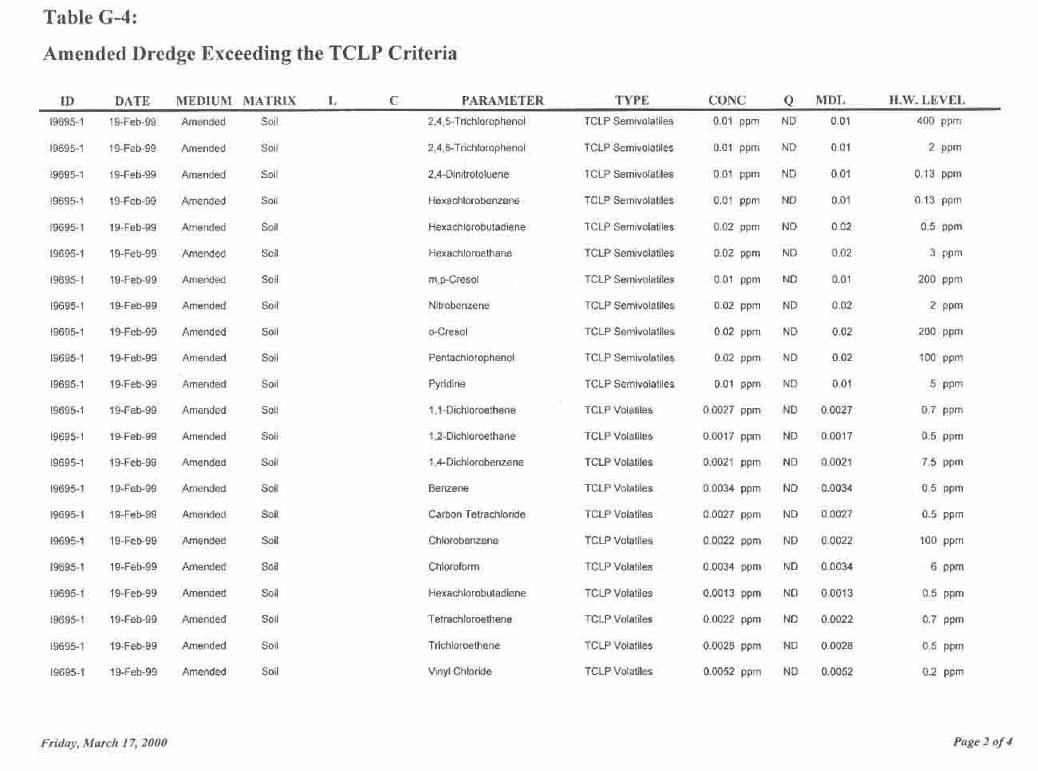
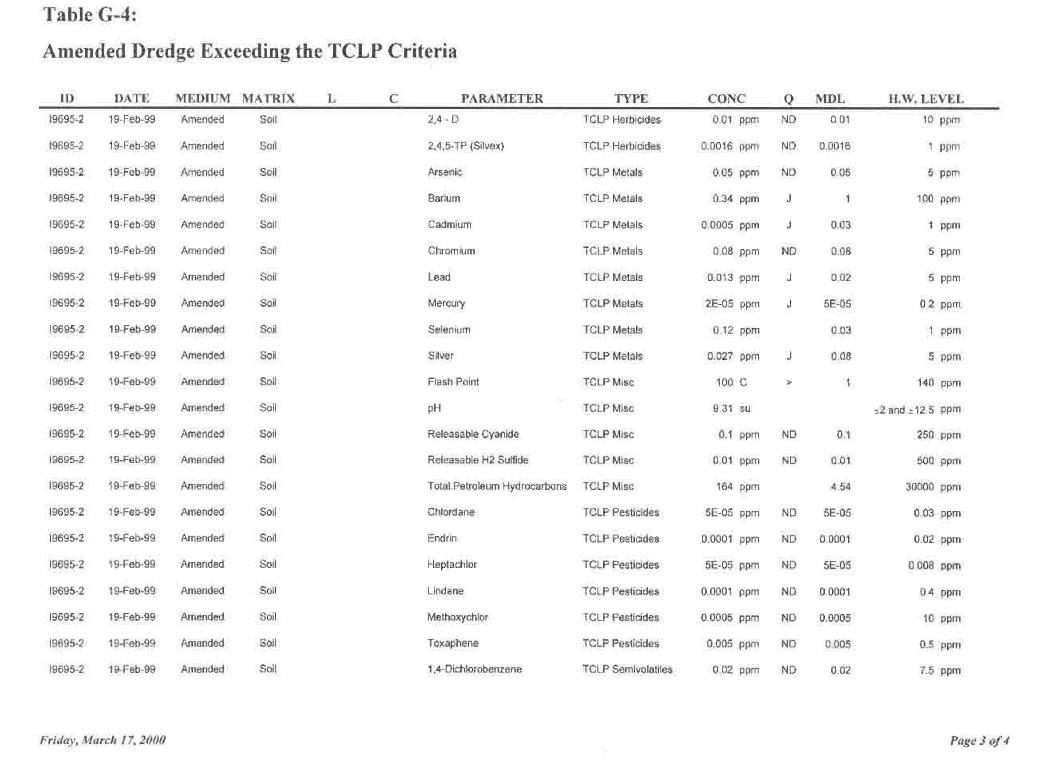
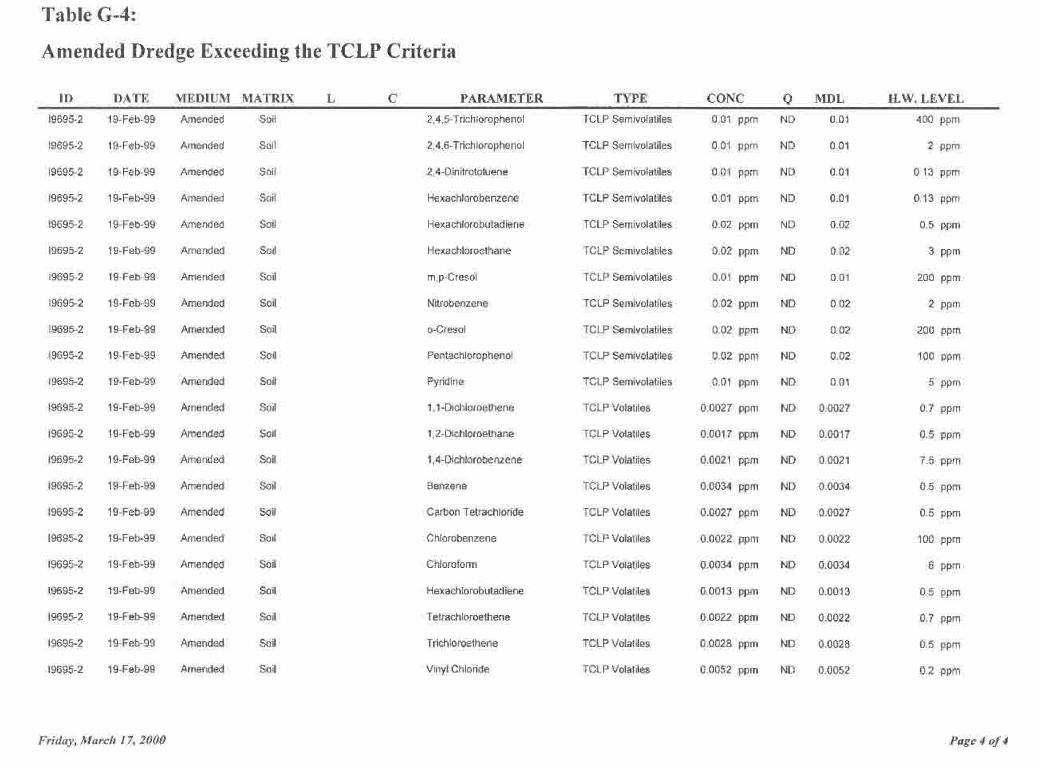
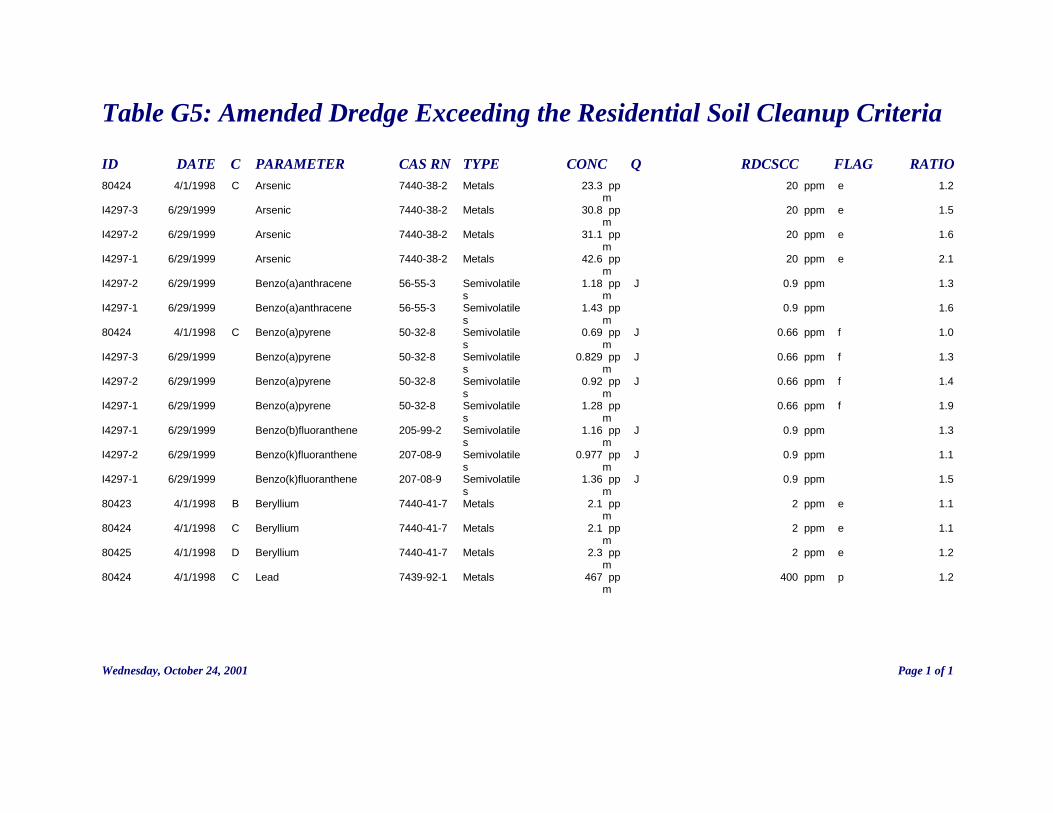
Table G5: Amended Dredge Exceeding the Residential Soil Cleanup Criteria ID DATE C PARAMETER CAS RN TYPE CONC Q RDCSCC FLAG RATIO 80424 4/1/1998 C Arsenic 7440-38-2 Metals 23.3 pp 20 ppm e 1.2 m I4297-3 6/29/1999 Arsenic 7440-38-2 Metals 30.8 pp 20 ppm e 1.5 m I4297-2 6/29/1999 Arsenic 7440-38-2 Metals 31.1 pp 20 ppm e 1.6 m I4297-1 6/29/1999 Arsenic 7440-38-2 Metals 42.6 pp 20 ppm e 2.1 m I4297-2 6/29/1999 Benzo(a)anthracene 56-55-3 Semivolatile 1.18 pp J 0.9 ppm 1.3 s m I4297-1 6/29/1999 Benzo(a)anthracene 56-55-3 Semivolatile 1.43 pp 0.9 ppm 1.6 s m 80424 4/1/1998 C Benzo(a)pyrene 50-32-8 Semivolatile 0.69 pp J 0.66 ppm f 1.0 s m I4297-3 6/29/1999 Benzo(a)pyrene 50-32-8 Semivolatile 0.829 pp J 0.66 ppm f 1.3 s m I4297-2 6/29/1999 Benzo(a)pyrene 50-32-8 Semivolatile 0.92 pp J 0.66 ppm f 1.4 s m I4297-1 6/29/1999 Benzo(a)pyrene 50-32-8 Semivolatile 1.28 pp 0.66 ppm f 1.9 s m I4297-1 6/29/1999 Benzo(b)fluoranthene 205-99-2 Semivolatile 1.16 pp J 0.9 ppm 1.3 s m I4297-2 6/29/1999 Benzo(k)fluoranthene 207-08-9 Semivolatile 0.977 pp J 0.9 ppm 1.1 s m I4297-1 6/29/1999 Benzo(k)fluoranthene 207-08-9 Semivolatile 1.36 pp J 0.9 ppm 1.5 s m 80423 4/1/1998 B Beryllium 7440-41-7 Metals 2.1 pp 2 ppm e 1.1 m 80424 4/1/1998 C Beryllium 7440-41-7 Metals 2.1 pp 2 ppm e 1.1 m 80425 4/1/1998 D Beryllium 7440-41-7 Metals 2.3 pp 2 ppm e 1.2 m 80424 4/1/1998 C Lead 7439-92-1 Metals 467 pp 400 ppm p 1.2 m
Wednesday, October 24, 2001 Page 1 of 1

Table G6: Amended Dredge Exceeding the Nonresidential Soil Cleanup Criteria
ID DATE C PARAMETER CAS RN TYPE CONC Q NRDCSCC FLAG RATIO 80424 4/1/1998 C Arsenic 7440-38-2 Metals 23.3 pp 20 ppm e 1.2 m I4297-3 6/29/1999 Arsenic 7440-38-2 Metals 30.8 pp 20 ppm e 1.5 m I4297-2 6/29/1999 Arsenic 7440-38-2 Metals 31.1 pp 20 ppm e 1.6 m I4297-1 6/29/1999 Arsenic 7440-38-2 Metals 42.6 pp 20 ppm e 2.1 m 80424 4/1/1998 C Benzo(a)pyrene 50-32-8 Semivolatile 0.69 pp J 0.66 ppm f 1.0 s m I4297-3 6/29/1999 Benzo(a)pyrene 50-32-8 Semivolatile 0.829 pp J 0.66 ppm f 1.3 s m I4297-2 6/29/1999 Benzo(a)pyrene 50-32-8 Semivolatile 0.92 pp J 0.66 ppm f 1.4 s m I4297-1 6/29/1999 Benzo(a)pyrene 50-32-8 Semivolatile 1.28 pp 0.66 ppm f 1.9 s m 80423 4/1/1998 B Beryllium 7440-41-7 Metals 2.1 pp 2 ppm e 1.1 m 80424 4/1/1998 C Beryllium 7440-41-7 Metals 2.1 pp 2 ppm e 1.1 m 80425 4/1/1998 D Beryllium 7440-41-7 Metals 2.3 pp 2 ppm e 1.2 m
Wednesday, October 24, 2001 Page 1 of 1

Table G7: Amended Dredged Material Dioxin Results SAMPLE ID DATE PARAMETER CONCENTRATIO Q TEF TEC
80422 4/1/199 1234678-HpCDD 363 ppt 0.01 3.63 8 80422 4/1/199 1234678-HpCDF 178 ppt 0.01 1.78 8 80422 4/1/199 1234789-HpCDF 10.7 ppt 0.01 0.107 8 80422 4/1/199 123478-HxCDD 4.7 ppt PRJ 0.1 0.47 8 80422 4/1/199 123478-HxCDF 19.7 ppt 0.1 1.97 8 80422 4/1/199 123678-HxCDD 24.9 ppt 0.1 2.49 8 80422 4/1/199 123678-HxCDF 8.9 ppt 0.1 0.89 8 80422 4/1/199 123789-HxCDD 19.7 ppt 0.01 0.197 8 80422 4/1/199 123789-HxCDF 2.6 ppt PRXJ 0.1 0.26 8 80422 4/1/199 12378-PeCDD 3.9 ppt J 0.5 1.95 8 80422 4/1/199 12378-PeCDF 7.8 ppt PR 0.05 0.39 8 80422 4/1/199 234678-HxCDF 10.7 ppt 0.1 1.07 8 80422 4/1/199 23478-PeCDF 12.4 ppt 0.5 6.2 8 80422 4/1/199 2378-TCDD 12.4 ppt PR 1 12.4 8 80422 4/1/199 2378-TCDF 59.1 ppt 0.1 5.91 8 80422 4/1/199 OCDD 3760 ppt 0.001 3.76 8 80422 4/1/199 OCDF 183 ppt 0.001 0.183 8 80422 4/1/199 Sum of Total Equivalent Concentrations (TEC) ppt 43.657 8
Wednesday, October 24, 2001 Page 1 of 7

Amended Dredged Material Dioxin Results SAMPLE ID DATE PARAMETER CONCENTRATIO Q TEF TEC
80423 4/1/199 1234678-HpCDD 405 ppt 0.01 4.05 8 80423 4/1/199 1234678-HpCDF 102 ppt 0.01 1.02 8 80423 4/1/199 1234789-HpCDF 6.4 ppt 0.01 0.064 8 80423 4/1/199 123478-HxCDD 4.7 ppt PRJ 0.1 0.47 8 80423 4/1/199 123478-HxCDF 16.9 ppt 0.1 1.69 8 80423 4/1/199 123678-HxCDD 22 ppt 0.1 2.2 8 80423 4/1/199 123678-HxCDF 7.7 ppt 0.1 0.77 8 80423 4/1/199 123789-HxCDD 17.6 ppt 0.01 0.176 8 80423 4/1/199 12378-PeCDD 3.2 ppt J 0.5 1.6 8 80423 4/1/199 12378-PeCDF 7.3 ppt 0.05 0.365 8 80423 4/1/199 234678-HxCDF 10.4 ppt 0.1 1.04 8 80423 4/1/199 23478-PeCDF 12.8 ppt 0.5 6.4 8 80423 4/1/199 2378-TCDD 9.3 ppt PR 1 9.3 8 80423 4/1/199 2378-TCDF 41.7 ppt 0.1 4.17 8 80423 4/1/199 OCDD 3390 ppt 0.001 3.39 8 80423 4/1/199 OCDF 155 ppt 0.001 0.155 8 80423 4/1/199 Sum of Total Equivalent Concentrations (TEC) ppt 36.86 8
Wednesday, October 24, 2001 Page 2 of 7

Amended Dredged Material Dioxin Results SAMPLE ID DATE PARAMETER CONCENTRATIO Q TEF TEC
80424 4/1/199 1234678-HpCDD 260 ppt 0.01 2.6 8 80424 4/1/199 1234678-HpCDF 88.6 ppt 0.01 0.886 8 80424 4/1/199 1234789-HpCDF 6.2 ppt 0.01 0.062 8 80424 4/1/199 123478-HxCDD 3.8 ppt PRJ 0.1 0.38 8 80424 4/1/199 123478-HxCDF 16.2 ppt 0.1 1.62 8 80424 4/1/199 123678-HxCDD 16.4 ppt 0.1 1.64 8 80424 4/1/199 123678-HxCDF 8.3 ppt 0.1 0.83 8 80424 4/1/199 123789-HxCDD 14 ppt 0.01 0.14 8 80424 4/1/199 12378-PeCDF 6.2 ppt PR 0.05 0.31 8 80424 4/1/199 234678-HxCDF 8.2 ppt 0.1 0.82 8 80424 4/1/199 23478-PeCDF 10.2 ppt 0.5 5.1 8 80424 4/1/199 2378-TCDD 4.1 ppt PR 1 4.1 8 80424 4/1/199 2378-TCDF 29.8 ppt 0.1 2.98 8 80424 4/1/199 OCDD 2390 ppt 0.001 2.39 8 80424 4/1/199 OCDF 114 ppt 0.001 0.114 8 80424 4/1/199 Sum of Total Equivalent Concentrations (TEC) ppt 23.972 8
Wednesday, October 24, 2001 Page 3 of 7

Amended Dredged Material Dioxin Results SAMPLE ID DATE PARAMETER CONCENTRATIO Q TEF TEC
80425 4/1/199 1234678-HpCDD 337 ppt 0.01 3.37 8 80425 4/1/199 1234678-HpCDF 85.4 ppt 0.01 0.854 8 80425 4/1/199 1234789-HpCDF 5.5 ppt 0.01 0.055 8 80425 4/1/199 123478-HxCDD 4.7 ppt PRJ 0.1 0.47 8 80425 4/1/199 123478-HxCDF 14.1 ppt 0.1 1.41 8 80425 4/1/199 123678-HxCDD 22 ppt 0.1 2.2 8 80425 4/1/199 123678-HxCDF 6.2 ppt 0.1 0.62 8 80425 4/1/199 123789-HxCDD 16.1 ppt 0.01 0.161 8 80425 4/1/199 123789-HxCDF 1.5 ppt PRJ 0.1 0.15 8 80425 4/1/199 12378-PeCDD 3.7 ppt J 0.5 1.85 8 80425 4/1/199 12378-PeCDF 6.4 ppt 0.05 0.32 8 80425 4/1/199 234678-HxCDF 8.5 ppt 0.1 0.85 8 80425 4/1/199 23478-PeCDF 10 ppt 0.5 5 8 80425 4/1/199 2378-TCDD 5.2 ppt PR 1 5.2 8 80425 4/1/199 2378-TCDF 40 ppt 0.1 4 8 80425 4/1/199 OCDD 2940 ppt 0.001 2.94 8 80425 4/1/199 OCDF 138 ppt 0.001 0.138 8 80425 4/1/199 Sum of Total Equivalent Concentrations (TEC) ppt 29.588 8
Wednesday, October 24, 2001 Page 4 of 7

Amended Dredged Material Dioxin Results SAMPLE ID DATE PARAMETER CONCENTRATIO Q TEF TEC
I4797-1 6/29/19 1,2,3,4,6,7,8-HpCDD 0.5183 ppt 0.01 0.00518 99 I4797-1 6/29/19 1,2,3,4,6,7,8-HpCDF 0.1785 ppt 0.01 0.00178 99 I4797-1 6/29/19 1,2,3,4,7,8,9-HpCDF 0.0128 ppt U 0.01 0.00012 99 I4797-1 6/29/19 1,2,3,4,7,8-HxCDD 0.0048 ppt U 0.1 0.00048 99 I4797-1 6/29/19 1,2,3,4,7,8-HxCDF 0.0358 ppt J 0.1 0.00358 99 I4797-1 6/29/19 1,2,3,6,7,8-HxCDD 0.0299 ppt J 0.1 0.00299 99 I4797-1 6/29/19 1,2,3,6,7,8-HxCDF 0.008 ppt J 0.1 0.0008 99 I4797-1 6/29/19 1,2,3,7,8,9-HxCDD 0.0385 ppt J 0.01 0.00038 99 I4797-1 6/29/19 1,2,3,7,8,9-HxCDF 0.0039 ppt U 0.1 0.00039 99 I4797-1 6/29/19 1,2,3,7,8-PeCDD 0.0097 ppt U 0.5 0.00485 99 I4797-1 6/29/19 1,2,3,7,8-PeCDF 0.0186 ppt J 0.05 0.00093 99 I4797-1 6/29/19 2,3,4,6,7,8-HxCDF 0.0042 ppt U 0.1 0.00042 99 I4797-1 6/29/19 2,3,4,7,8-PeCDF 0.0183 ppt J 0.5 0.00915 99 I4797-1 6/29/19 2,3,7,8-TCDD 0.0112 ppt 1 0.0112 99 I4797-1 6/29/19 2,3,7,8-TCDF 0.1041 ppt 0.1 0.01041 99 I4797-1 6/29/19 OCDD 4.6035 ppt 0.001 0.0046 99 I4797-1 6/29/19 OCDF 0.2136 ppt 0.001 0.00021 99 I4797-1 6/29/19 Sum of Total Equivalent Concentrations (TEC) ppt 0.05747 99
Wednesday, October 24, 2001 Page 5 of 7

Amended Dredged Material Dioxin Results SAMPLE ID DATE PARAMETER CONCENTRATIO Q TEF TEC
I4797-2 6/29/19 1,2,3,4,6,7,8-HpCDD 0.645 ppt 0.01 0.00645 99 I4797-2 6/29/19 1,2,3,4,6,7,8-HpCDF 0.118 ppt 0.01 0.00118 99 I4797-2 6/29/19 1,2,3,4,7,8,9-HpCDF 0.0023 ppt U 0.01 0.00002 99 I4797-2 6/29/19 1,2,3,4,7,8-HxCDD 0.0009 ppt U 0.1 0.00009 99 I4797-2 6/29/19 1,2,3,4,7,8-HxCDF 0.0205 ppt J 0.1 0.00205 99 I4797-2 6/29/19 1,2,3,6,7,8-HxCDD 0.0542 ppt 0.1 0.00542 99 I4797-2 6/29/19 1,2,3,6,7,8-HxCDF 0.0072 ppt J 0.1 0.00072 99 I4797-2 6/29/19 1,2,3,7,8,9-HxCDD 0.0236 ppt J 0.01 0.00023 99 I4797-2 6/29/19 1,2,3,7,8,9-HxCDF 0.0015 ppt J 0.1 0.00015 99 I4797-2 6/29/19 1,2,3,7,8-PeCDD 0.0215 ppt U 0.5 0.01075 99 I4797-2 6/29/19 1,2,3,7,8-PeCDF 0.0181 ppt J 0.05 0.0009 99 I4797-2 6/29/19 2,3,4,6,7,8-HxCDF 0.0163 ppt J 0.1 0.00163 99 I4797-2 6/29/19 2,3,4,7,8-PeCDF 0.0319 ppt J 0.5 0.01595 99 I4797-2 6/29/19 2,3,7,8-TCDD 0.002 ppt U 1 0.002 99 I4797-2 6/29/19 2,3,7,8-TCDF 0.0976 ppt 0.1 0.00976 99 I4797-2 6/29/19 OCDD 3.8944 ppt 0.001 0.00389 99 I4797-2 6/29/19 OCDF 0.1361 ppt 0.001 0.00013 99 I4797-2 6/29/19 Sum of Total Equivalent Concentrations (TEC) ppt 0.06132 99
Wednesday, October 24, 2001 Page 6 of 7
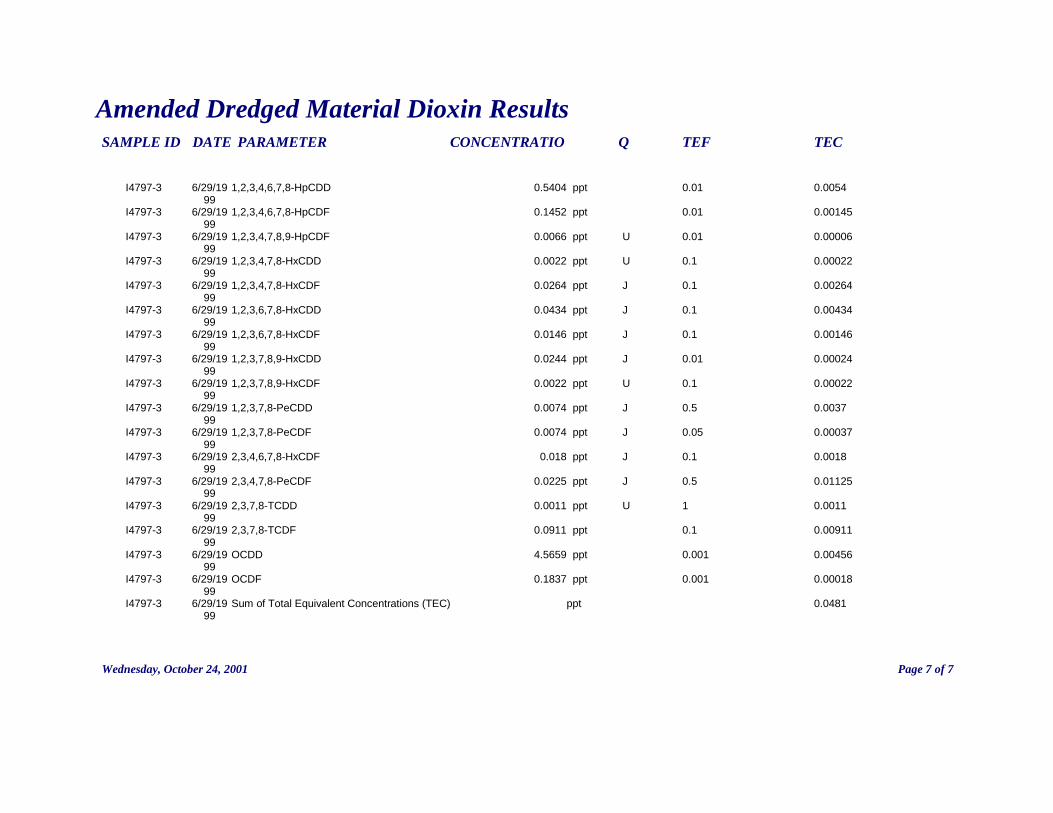
Amended Dredged Material Dioxin Results SAMPLE ID DATE PARAMETER CONCENTRATIO Q TEF TEC
I4797-3 6/29/19 1,2,3,4,6,7,8-HpCDD 0.5404 ppt 0.01 0.0054 99 I4797-3 6/29/19 1,2,3,4,6,7,8-HpCDF 0.1452 ppt 0.01 0.00145 99 I4797-3 6/29/19 1,2,3,4,7,8,9-HpCDF 0.0066 ppt U 0.01 0.00006 99 I4797-3 6/29/19 1,2,3,4,7,8-HxCDD 0.0022 ppt U 0.1 0.00022 99 I4797-3 6/29/19 1,2,3,4,7,8-HxCDF 0.0264 ppt J 0.1 0.00264 99 I4797-3 6/29/19 1,2,3,6,7,8-HxCDD 0.0434 ppt J 0.1 0.00434 99 I4797-3 6/29/19 1,2,3,6,7,8-HxCDF 0.0146 ppt J 0.1 0.00146 99 I4797-3 6/29/19 1,2,3,7,8,9-HxCDD 0.0244 ppt J 0.01 0.00024 99 I4797-3 6/29/19 1,2,3,7,8,9-HxCDF 0.0022 ppt U 0.1 0.00022 99 I4797-3 6/29/19 1,2,3,7,8-PeCDD 0.0074 ppt J 0.5 0.0037 99 I4797-3 6/29/19 1,2,3,7,8-PeCDF 0.0074 ppt J 0.05 0.00037 99 I4797-3 6/29/19 2,3,4,6,7,8-HxCDF 0.018 ppt J 0.1 0.0018 99 I4797-3 6/29/19 2,3,4,7,8-PeCDF 0.0225 ppt J 0.5 0.01125 99 I4797-3 6/29/19 2,3,7,8-TCDD 0.0011 ppt U 1 0.0011 99 I4797-3 6/29/19 2,3,7,8-TCDF 0.0911 ppt 0.1 0.00911 99 I4797-3 6/29/19 OCDD 4.5659 ppt 0.001 0.00456 99 I4797-3 6/29/19 OCDF 0.1837 ppt 0.001 0.00018 99 I4797-3 6/29/19 Sum of Total Equivalent Concentrations (TEC) ppt 0.0481 99
Wednesday, October 24, 2001 Page 7 of 7
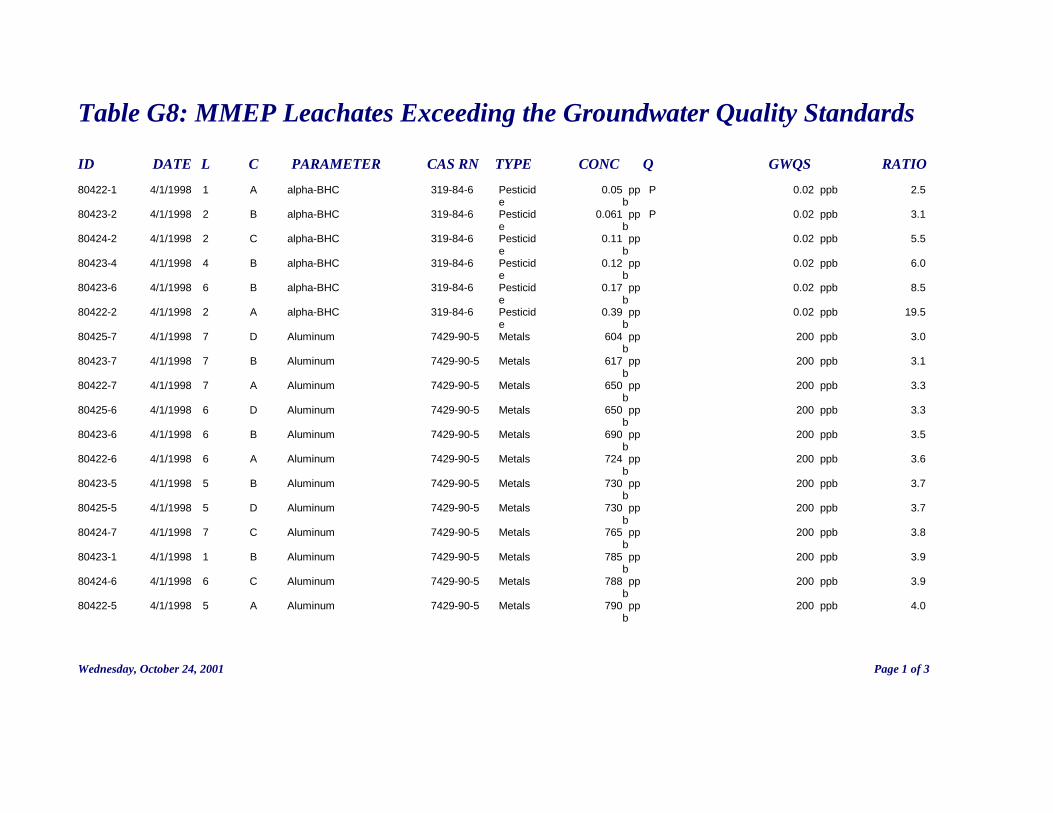
Table G8: MMEP Leachates Exceeding the Groundwater Quality Standards ID DATE L C PARAMETER CAS RN TYPE CONC Q GWQS RATIO 80422-1 4/1/1998 1 A alpha-BHC 319-84-6 Pesticid 0.05 pp P 0.02 ppb 2.5 e b 80423-2 4/1/1998 2 B alpha-BHC 319-84-6 Pesticid 0.061 pp P 0.02 ppb 3.1 e b 80424-2 4/1/1998 2 C alpha-BHC 319-84-6 Pesticid 0.11 pp 0.02 ppb 5.5 e b 80423-4 4/1/1998 4 B alpha-BHC 319-84-6 Pesticid 0.12 pp 0.02 ppb 6.0 e b 80423-6 4/1/1998 6 B alpha-BHC 319-84-6 Pesticid 0.17 pp 0.02 ppb 8.5 e b 80422-2 4/1/1998 2 A alpha-BHC 319-84-6 Pesticid 0.39 pp 0.02 ppb 19.5 e b 80425-7 4/1/1998 7 D Aluminum 7429-90-5 Metals 604 pp 200 ppb 3.0 b 80423-7 4/1/1998 7 B Aluminum 7429-90-5 Metals 617 pp 200 ppb 3.1 b 80422-7 4/1/1998 7 A Aluminum 7429-90-5 Metals 650 pp 200 ppb 3.3 b 80425-6 4/1/1998 6 D Aluminum 7429-90-5 Metals 650 pp 200 ppb 3.3 b 80423-6 4/1/1998 6 B Aluminum 7429-90-5 Metals 690 pp 200 ppb 3.5 b 80422-6 4/1/1998 6 A Aluminum 7429-90-5 Metals 724 pp 200 ppb 3.6 b 80423-5 4/1/1998 5 B Aluminum 7429-90-5 Metals 730 pp 200 ppb 3.7 b 80425-5 4/1/1998 5 D Aluminum 7429-90-5 Metals 730 pp 200 ppb 3.7 b 80424-7 4/1/1998 7 C Aluminum 7429-90-5 Metals 765 pp 200 ppb 3.8 b 80423-1 4/1/1998 1 B Aluminum 7429-90-5 Metals 785 pp 200 ppb 3.9 b 80424-6 4/1/1998 6 C Aluminum 7429-90-5 Metals 788 pp 200 ppb 3.9 b 80422-5 4/1/1998 5 A Aluminum 7429-90-5 Metals 790 pp 200 ppb 4.0 b
Wednesday, October 24, 2001 Page 1 of 3

ID DATE L C PARAMETER CAS RN TYPE CONC Q GWQS RATIO 80424-1 4/1/1998 1 C Aluminum 7429-90-5 Metals 870 pp 200 ppb 4.4 b I4298-3 6/29/1999 1 I4297-3 Aluminum 7429-90-5 Metals 880 pp 200 ppb 4.4 b 80425-4 4/1/1998 4 D Aluminum 7429-90-5 Metals 895 pp 200 ppb 4.5 b 80423-4 4/1/1998 4 B Aluminum 7429-90-5 Metals 904 pp 200 ppb 4.5 b 80425-1 4/1/1998 1 D Aluminum 7429-90-5 Metals 905 pp 200 ppb 4.5 b 80424-5 4/1/1998 5 C Aluminum 7429-90-5 Metals 934 pp 200 ppb 4.7 b 80422-4 4/1/1998 4 A Aluminum 7429-90-5 Metals 945 pp 200 ppb 4.7 b 80422-1 4/1/1998 1 A Aluminum 7429-90-5 Metals 953 pp 200 ppb 4.8 b 80424-4 4/1/1998 4 C Aluminum 7429-90-5 Metals 1060 pp 200 ppb 5.3 b 80422-3 4/1/1998 3 A Aluminum 7429-90-5 Metals 1220 pp 200 ppb 6.1 b 80425-3 4/1/1998 3 D Aluminum 7429-90-5 Metals 1220 pp 200 ppb 6.1 b 80423-2 4/1/1998 2 B Aluminum 7429-90-5 Metals 1370 pp 200 ppb 6.9 b 80424-3 4/1/1998 3 C Aluminum 7429-90-5 Metals 1420 pp 200 ppb 7.1 b 80424-2 4/1/1998 2 C Aluminum 7429-90-5 Metals 1510 pp 200 ppb 7.6 b 80422-2 4/1/1998 2 A Aluminum 7429-90-5 Metals 1570 pp 200 ppb 7.9 b 80425-2 4/1/1998 2 D Aluminum 7429-90-5 Metals 1620 pp 200 ppb 8.1 b I4298-2 6/29/1999 1 I4297-2 Aluminum 7429-90-5 Metals 1940 pp 200 ppb 9.7 b I4298-1 6/29/1999 1 I4297-1 Aluminum 7429-90-5 Metals 2040 pp 200 ppb 10.2 b 80423-3 4/1/1998 3 B Aluminum 7429-90-5 Metals 2720 pp 200 ppb 13.6 b I4298-3 6/29/1999 1 I4297-3 Arsenic 7440-38-2 Metals 20 pp 8 ppb 2.5 b I4298-2 6/29/1999 1 I4297-2 Arsenic 7440-38-2 Metals 25 pp 8 ppb 3.1 b
Wednesday, October 24, 2001 Page 2 of 3
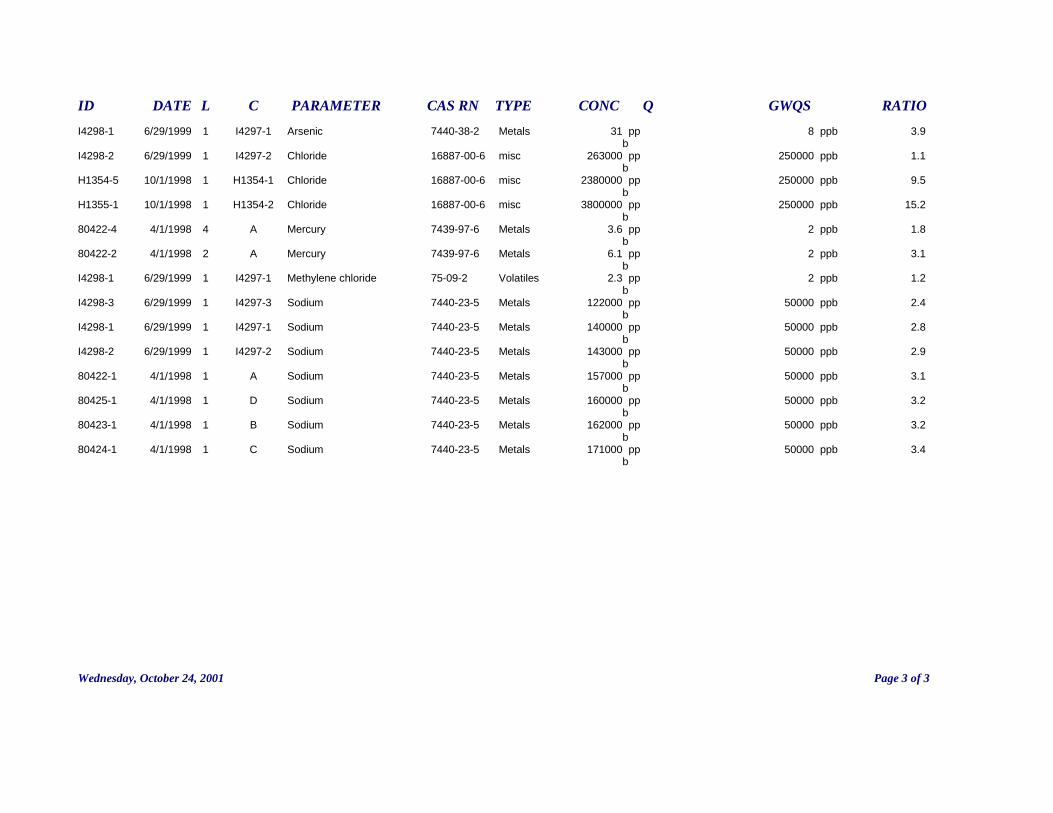
ID DATE L C PARAMETER CAS RN TYPE CONC Q GWQS RATIO I4298-1 6/29/1999 1 I4297-1 Arsenic 7440-38-2 Metals 31 pp 8 ppb 3.9 b I4298-2 6/29/1999 1 I4297-2 Chloride 16887-00-6 misc 263000 pp 250000 ppb 1.1 b H1354-5 10/1/1998 1 H1354-1 Chloride 16887-00-6 misc 2380000 pp 250000 ppb 9.5 b H1355-1 10/1/1998 1 H1354-2 Chloride 16887-00-6 misc 3800000 pp 250000 ppb 15.2 b 80422-4 4/1/1998 4 A Mercury 7439-97-6 Metals 3.6 pp 2 ppb 1.8 b 80422-2 4/1/1998 2 A Mercury 7439-97-6 Metals 6.1 pp 2 ppb 3.1 b I4298-1 6/29/1999 1 I4297-1 Methylene chloride 75-09-2 Volatiles 2.3 pp 2 ppb 1.2 b I4298-3 6/29/1999 1 I4297-3 Sodium 7440-23-5 Metals 122000 pp 50000 ppb 2.4 b I4298-1 6/29/1999 1 I4297-1 Sodium 7440-23-5 Metals 140000 pp 50000 ppb 2.8 b I4298-2 6/29/1999 1 I4297-2 Sodium 7440-23-5 Metals 143000 pp 50000 ppb 2.9 b 80422-1 4/1/1998 1 A Sodium 7440-23-5 Metals 157000 pp 50000 ppb 3.1 b 80425-1 4/1/1998 1 D Sodium 7440-23-5 Metals 160000 pp 50000 ppb 3.2 b 80423-1 4/1/1998 1 B Sodium 7440-23-5 Metals 162000 pp 50000 ppb 3.2 b 80424-1 4/1/1998 1 C Sodium 7440-23-5 Metals 171000 pp 50000 ppb 3.4 b
Wednesday, October 24, 2001 Page 3 of 3

Table G9: MMEP Leachates Dioxin Results SAMPLE ID DATE PARAMETER L C CONCENTRATIO Q TEF TEC
80422-1 4/1/199 1234678-HpCDD 1 A 1.6 ppq U 0.01 0.016 8 80422-1 4/1/199 1234678-HpCDF 1 A 1.1 ppq U 0.01 0.011 8 80422-1 4/1/199 1234789-HpCDF 1 A 1.4 ppq U 0.01 0.014 8 80422-1 4/1/199 123478-HxCDD 1 A 1.2 ppq U 0.1 0.12 8 80422-1 4/1/199 123478-HxCDF 1 A 0.8 ppq U 0.1 0.08 8 80422-1 4/1/199 123678-HxCDD 1 A 1.2 ppq U 0.1 0.12 8 80422-1 4/1/199 123678-HxCDF 1 A 0.8 ppq U 0.1 0.08 8 80422-1 4/1/199 123789-HxCDD 1 A 1.1 ppq U 0.01 0.011 8 80422-1 4/1/199 123789-HxCDF 1 A 1 ppq U 0.1 0.1 8 80422-1 4/1/199 12378-PeCDD 1 A 0.7 ppq U 0.5 0.35 8 80422-1 4/1/199 12378-PeCDF 1 A 0.4 ppq U 0.05 0.02 8 80422-1 4/1/199 234678-HxCDF 1 A 0.9 ppq U 0.1 0.09 8 80422-1 4/1/199 23478-PeCDF 1 A 0.5 ppq U 0.5 0.25 8 80422-1 4/1/199 2378-TCDD 1 A 0.5 ppq U 1 0.5 8 80422-1 4/1/199 2378-TCDF 1 A 0.3 ppq U 0.1 0.03 8 80422-1 4/1/199 OCDD 1 A 1.7 ppq U 0.001 0.0017 8 80422-1 4/1/199 OCDF 1 A 1.2 ppq U 0.001 0.0012 8 80422-1 4/1/199 Sum of Total Equivalent Concentrations (TEC) 1 A ppq 1.7949 8
Wednesday, October 24, 2001 Page 1 of 11

SAMPLE ID DATE PARAMETER L C CONCENTRATIO Q TEF TEC
80422-7 4/1/199 1234678-HpCDD 7 A 2.3 ppq U 0.01 0.023 8 80422-7 4/1/199 1234678-HpCDF 7 A 1.3 ppq U 0.01 0.013 8 80422-7 4/1/199 1234789-HpCDF 7 A 1.7 ppq U 0.01 0.017 8 80422-7 4/1/199 123478-HxCDD 7 A 1.5 ppq U 0.1 0.15 8 80422-7 4/1/199 123478-HxCDF 7 A 0.8 ppq U 0.1 0.08 8 80422-7 4/1/199 123678-HxCDD 7 A 1.4 ppq U 0.1 0.14 8 80422-7 4/1/199 123678-HxCDF 7 A 0.8 ppq U 0.1 0.08 8 80422-7 4/1/199 123789-HxCDD 7 A 1.3 ppq U 0.01 0.013 8 80422-7 4/1/199 123789-HxCDF 7 A 1 ppq U 0.1 0.1 8 80422-7 4/1/199 12378-PeCDD 7 A 1.2 ppq U 0.5 0.6 8 80422-7 4/1/199 12378-PeCDF 7 A 0.8 ppq U 0.05 0.04 8 80422-7 4/1/199 234678-HxCDF 7 A 0.9 ppq U 0.1 0.09 8 80422-7 4/1/199 23478-PeCDF 7 A 0.8 ppq U 0.5 0.4 8 80422-7 4/1/199 2378-TCDD 7 A 0.7 ppq U 1 0.7 8 80422-7 4/1/199 2378-TCDF 7 A 0.4 ppq U 0.1 0.04 8 80422-7 4/1/199 OCDD 7 A 5.9 ppq U 0.001 0.0059 8 80422-7 4/1/199 OCDF 7 A 4.4 ppq U 0.001 0.0044 8 80422-7 4/1/199 Sum of Total Equivalent Concentrations (TEC) 7 A ppq 2.4963 8
Wednesday, October 24, 2001 Page 2 of 11

SAMPLE ID DATE PARAMETER L C CONCENTRATIO Q TEF TEC
80423-1 4/1/199 1234678-HpCDD 1 B 1.8 ppq U 0.01 0.018 8 80423-1 4/1/199 1234678-HpCDF 1 B 1.5 ppq U 0.01 0.015 8 80423-1 4/1/199 1234789-HpCDF 1 B 2 ppq U 0.01 0.02 8 80423-1 4/1/199 123478-HxCDD 1 B 1.6 ppq U 0.1 0.16 8 80423-1 4/1/199 123478-HxCDF 1 B 1.1 ppq U 0.1 0.11 8 80423-1 4/1/199 123678-HxCDD 1 B 1.9 ppq U 0.1 0.19 8 80423-1 4/1/199 123678-HxCDF 1 B 1.2 ppq U 0.1 0.12 8 80423-1 4/1/199 123789-HxCDD 1 B 1.9 ppq U 0.01 0.019 8 80423-1 4/1/199 123789-HxCDF 1 B 1.4 ppq U 0.1 0.14 8 80423-1 4/1/199 12378-PeCDD 1 B 1.2 ppq U 0.5 0.6 8 80423-1 4/1/199 12378-PeCDF 1 B 0.7 ppq U 0.05 0.035 8 80423-1 4/1/199 234678-HxCDF 1 B 1.2 ppq U 0.1 0.12 8 80423-1 4/1/199 23478-PeCDF 1 B 1.1 ppq U 0.5 0.55 8 80423-1 4/1/199 2378-TCDF 1 B 5.1 ppq U 0.1 0.51 8 80423-1 4/1/199 OCDD 1 B 2.9 ppq U 0.001 0.0029 8 80423-1 4/1/199 OCDF 1 B 2.5 ppq U 0.001 0.0025 8 80423-1 4/1/199 Sum of Total Equivalent Concentrations (TEC) 1 B ppq 2.6124 8
Wednesday, October 24, 2001 Page 3 of 11

SAMPLE ID DATE PARAMETER L C CONCENTRATIO Q TEF TEC
80423-7 4/1/199 1234678-HpCDD 7 B 1.5 ppq U 0.01 0.015 8 80423-7 4/1/199 1234678-HpCDF 7 B 1.2 ppq U 0.01 0.012 8 80423-7 4/1/199 1234789-HpCDF 7 B 1.7 ppq U 0.01 0.017 8 80423-7 4/1/199 123478-HxCDD 7 B 1.5 ppq U 0.1 0.15 8 80423-7 4/1/199 123478-HxCDF 7 B 1 ppq U 0.1 0.1 8 80423-7 4/1/199 123678-HxCDD 7 B 1.7 ppq U 0.1 0.17 8 80423-7 4/1/199 123678-HxCDF 7 B 1 ppq U 0.1 0.1 8 80423-7 4/1/199 123789-HxCDD 7 B 1.6 ppq U 0.01 0.016 8 80423-7 4/1/199 123789-HxCDF 7 B 1.1 ppq U 0.1 0.11 8 80423-7 4/1/199 12378-PeCDD 7 B 1 ppq U 0.5 0.5 8 80423-7 4/1/199 12378-PeCDF 7 B 0.6 ppq U 0.05 0.03 8 80423-7 4/1/199 234678-HxCDF 7 B 0.9 ppq U 0.1 0.09 8 80423-7 4/1/199 23478-PeCDF 7 B 1 ppq U 0.5 0.5 8 80423-7 4/1/199 2378-TCDF 7 B 6.6 ppq U 0.1 0.66 8 80423-7 4/1/199 OCDD 7 B 3.1 ppq U 0.001 0.0031 8 80423-7 4/1/199 OCDF 7 B 2.2 ppq U 0.001 0.0022 8 80423-7 4/1/199 Sum of Total Equivalent Concentrations (TEC) 7 B ppq 2.4753 8
Wednesday, October 24, 2001 Page 4 of 11

SAMPLE ID DATE PARAMETER L C CONCENTRATIO Q TEF TEC
80424-1 4/1/199 1234678-HpCDD 1 C 2.5 ppq U 0.01 0.025 8 80424-1 4/1/199 1234678-HpCDF 1 C 1.6 ppq U 0.01 0.016 8 80424-1 4/1/199 1234789-HpCDF 1 C 2.1 ppq U 0.01 0.021 8 80424-1 4/1/199 123478-HxCDD 1 C 1.8 ppq U 0.1 0.18 8 80424-1 4/1/199 123478-HxCDF 1 C 1.1 ppq U 0.1 0.11 8 80424-1 4/1/199 123678-HxCDD 1 C 1.7 ppq U 0.1 0.17 8 80424-1 4/1/199 123678-HxCDF 1 C 1 ppq U 0.1 0.1 8 80424-1 4/1/199 123789-HxCDD 1 C 1.6 ppq U 0.01 0.016 8 80424-1 4/1/199 123789-HxCDF 1 C 1.3 ppq U 0.1 0.13 8 80424-1 4/1/199 12378-PeCDD 1 C 1 ppq U 0.5 0.5 8 80424-1 4/1/199 12378-PeCDF 1 C 0.6 ppq U 0.05 0.03 8 80424-1 4/1/199 234678-HxCDF 1 C 1.2 ppq U 0.1 0.12 8 80424-1 4/1/199 23478-PeCDF 1 C 0.6 ppq U 0.5 0.3 8 80424-1 4/1/199 2378-TCDD 1 C 0.7 ppq U 1 0.7 8 80424-1 4/1/199 2378-TCDF 1 C 0.4 ppq U 0.1 0.04 8 80424-1 4/1/199 OCDD 1 C 4.3 ppq U 0.001 0.0043 8 80424-1 4/1/199 OCDF 1 C 3.2 ppq U 0.001 0.0032 8 80424-1 4/1/199 Sum of Total Equivalent Concentrations (TEC) 1 C ppq 2.4655 8
Wednesday, October 24, 2001 Page 5 of 11

SAMPLE ID DATE PARAMETER L C CONCENTRATIO Q TEF TEC
80424-7 4/1/199 1234678-HpCDD 7 C 1.9 ppq U 0.01 0.019 8 80424-7 4/1/199 1234678-HpCDF 7 C 1.1 ppq U 0.01 0.011 8 80424-7 4/1/199 1234789-HpCDF 7 C 1.4 ppq U 0.01 0.014 8 80424-7 4/1/199 123478-HxCDD 7 C 1.3 ppq U 0.1 0.13 8 80424-7 4/1/199 123478-HxCDF 7 C 0.8 ppq U 0.1 0.08 8 80424-7 4/1/199 123678-HxCDD 7 C 1.3 ppq U 0.1 0.13 8 80424-7 4/1/199 123678-HxCDF 7 C 0.7 ppq U 0.1 0.07 8 80424-7 4/1/199 123789-HxCDD 7 C 1.2 ppq U 0.01 0.012 8 80424-7 4/1/199 123789-HxCDF 7 C 0.9 ppq U 0.1 0.09 8 80424-7 4/1/199 12378-PeCDD 7 C 1 ppq U 0.5 0.5 8 80424-7 4/1/199 12378-PeCDF 7 C 0.7 ppq U 0.05 0.035 8 80424-7 4/1/199 234678-HxCDF 7 C 0.9 ppq U 0.1 0.09 8 80424-7 4/1/199 23478-PeCDF 7 C 0.7 ppq U 0.5 0.35 8 80424-7 4/1/199 2378-TCDD 7 C 0.8 ppq U 1 0.8 8 80424-7 4/1/199 2378-TCDF 7 C 0.5 ppq U 0.1 0.05 8 80424-7 4/1/199 OCDD 7 C 4.5 ppq U 0.001 0.0045 8 80424-7 4/1/199 OCDF 7 C 3.3 ppq U 0.001 0.0033 8 80424-7 4/1/199 Sum of Total Equivalent Concentrations (TEC) 7 C ppq 2.3888 8
Wednesday, October 24, 2001 Page 6 of 11

SAMPLE ID DATE PARAMETER L C CONCENTRATIO Q TEF TEC
80425-1 4/1/199 1234678-HpCDD 1 D 4.2 ppq U 0.01 0.042 8 80425-1 4/1/199 1234678-HpCDF 1 D 2.5 ppq U 0.01 0.025 8 80425-1 4/1/199 1234789-HpCDF 1 D 3.1 ppq U 0.01 0.031 8 80425-1 4/1/199 123478-HxCDD 1 D 2.5 ppq U 0.1 0.25 8 80425-1 4/1/199 123478-HxCDF 1 D 1.3 ppq U 0.1 0.13 8 80425-1 4/1/199 123678-HxCDD 1 D 2.4 ppq U 0.1 0.24 8 80425-1 4/1/199 123678-HxCDF 1 D 1.3 ppq U 0.1 0.13 8 80425-1 4/1/199 123789-HxCDD 1 D 2.3 ppq U 0.01 0.023 8 80425-1 4/1/199 123789-HxCDF 1 D 1.6 ppq U 0.1 0.16 8 80425-1 4/1/199 12378-PeCDD 1 D 1.8 ppq U 0.5 0.9 8 80425-1 4/1/199 12378-PeCDF 1 D 1.1 ppq U 0.05 0.055 8 80425-1 4/1/199 234678-HxCDF 1 D 1.5 ppq U 0.1 0.15 8 80425-1 4/1/199 23478-PeCDF 1 D 1.1 ppq U 0.5 0.55 8 80425-1 4/1/199 2378-TCDD 1 D 1 ppq U 1 1 8 80425-1 4/1/199 2378-TCDF 1 D 0.7 ppq U 0.1 0.07 8 80425-1 4/1/199 OCDD 1 D 9.1 ppq U 0.001 0.0091 8 80425-1 4/1/199 OCDF 1 D 6.7 ppq U 0.001 0.0067 8 80425-1 4/1/199 Sum of Total Equivalent Concentrations (TEC) 1 D ppq 3.7718 8
Wednesday, October 24, 2001 Page 7 of 11
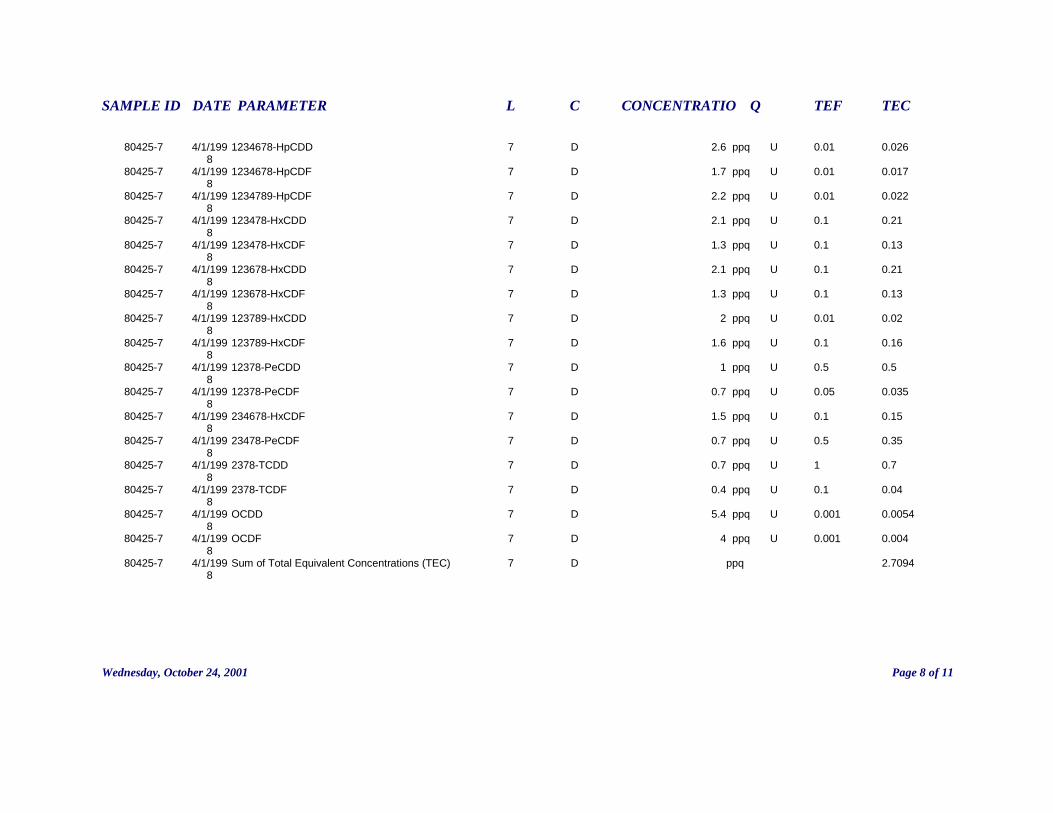
SAMPLE ID DATE PARAMETER L C CONCENTRATIO Q TEF TEC
80425-7 4/1/199 1234678-HpCDD 7 D 2.6 ppq U 0.01 0.026 8 80425-7 4/1/199 1234678-HpCDF 7 D 1.7 ppq U 0.01 0.017 8 80425-7 4/1/199 1234789-HpCDF 7 D 2.2 ppq U 0.01 0.022 8 80425-7 4/1/199 123478-HxCDD 7 D 2.1 ppq U 0.1 0.21 8 80425-7 4/1/199 123478-HxCDF 7 D 1.3 ppq U 0.1 0.13 8 80425-7 4/1/199 123678-HxCDD 7 D 2.1 ppq U 0.1 0.21 8 80425-7 4/1/199 123678-HxCDF 7 D 1.3 ppq U 0.1 0.13 8 80425-7 4/1/199 123789-HxCDD 7 D 2 ppq U 0.01 0.02 8 80425-7 4/1/199 123789-HxCDF 7 D 1.6 ppq U 0.1 0.16 8 80425-7 4/1/199 12378-PeCDD 7 D 1 ppq U 0.5 0.5 8 80425-7 4/1/199 12378-PeCDF 7 D 0.7 ppq U 0.05 0.035 8 80425-7 4/1/199 234678-HxCDF 7 D 1.5 ppq U 0.1 0.15 8 80425-7 4/1/199 23478-PeCDF 7 D 0.7 ppq U 0.5 0.35 8 80425-7 4/1/199 2378-TCDD 7 D 0.7 ppq U 1 0.7 8 80425-7 4/1/199 2378-TCDF 7 D 0.4 ppq U 0.1 0.04 8 80425-7 4/1/199 OCDD 7 D 5.4 ppq U 0.001 0.0054 8 80425-7 4/1/199 OCDF 7 D 4 ppq U 0.001 0.004 8 80425-7 4/1/199 Sum of Total Equivalent Concentrations (TEC) 7 D ppq 2.7094 8
Wednesday, October 24, 2001 Page 8 of 11
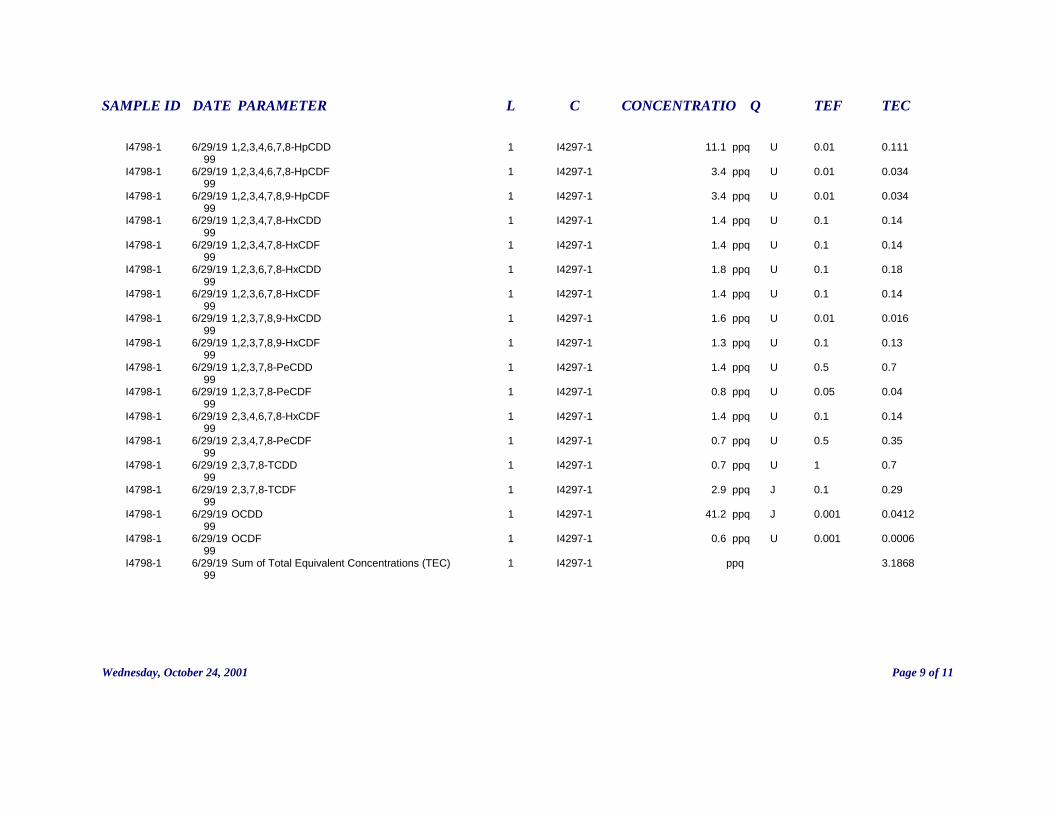
SAMPLE ID DATE PARAMETER L C CONCENTRATIO Q TEF TEC
I4798-1 6/29/19 1,2,3,4,6,7,8-HpCDD 1 I4297-1 11.1 ppq U 0.01 0.111 99 I4798-1 6/29/19 1,2,3,4,6,7,8-HpCDF 1 I4297-1 3.4 ppq U 0.01 0.034 99 I4798-1 6/29/19 1,2,3,4,7,8,9-HpCDF 1 I4297-1 3.4 ppq U 0.01 0.034 99 I4798-1 6/29/19 1,2,3,4,7,8-HxCDD 1 I4297-1 1.4 ppq U 0.1 0.14 99 I4798-1 6/29/19 1,2,3,4,7,8-HxCDF 1 I4297-1 1.4 ppq U 0.1 0.14 99 I4798-1 6/29/19 1,2,3,6,7,8-HxCDD 1 I4297-1 1.8 ppq U 0.1 0.18 99 I4798-1 6/29/19 1,2,3,6,7,8-HxCDF 1 I4297-1 1.4 ppq U 0.1 0.14 99 I4798-1 6/29/19 1,2,3,7,8,9-HxCDD 1 I4297-1 1.6 ppq U 0.01 0.016 99 I4798-1 6/29/19 1,2,3,7,8,9-HxCDF 1 I4297-1 1.3 ppq U 0.1 0.13 99 I4798-1 6/29/19 1,2,3,7,8-PeCDD 1 I4297-1 1.4 ppq U 0.5 0.7 99 I4798-1 6/29/19 1,2,3,7,8-PeCDF 1 I4297-1 0.8 ppq U 0.05 0.04 99 I4798-1 6/29/19 2,3,4,6,7,8-HxCDF 1 I4297-1 1.4 ppq U 0.1 0.14 99 I4798-1 6/29/19 2,3,4,7,8-PeCDF 1 I4297-1 0.7 ppq U 0.5 0.35 99 I4798-1 6/29/19 2,3,7,8-TCDD 1 I4297-1 0.7 ppq U 1 0.7 99 I4798-1 6/29/19 2,3,7,8-TCDF 1 I4297-1 2.9 ppq J 0.1 0.29 99 I4798-1 6/29/19 OCDD 1 I4297-1 41.2 ppq J 0.001 0.0412 99 I4798-1 6/29/19 OCDF 1 I4297-1 0.6 ppq U 0.001 0.0006 99 I4798-1 6/29/19 Sum of Total Equivalent Concentrations (TEC) 1 I4297-1 ppq 3.1868 99
Wednesday, October 24, 2001 Page 9 of 11

SAMPLE ID DATE PARAMETER L C CONCENTRATIO Q TEF TEC
I4798-2 6/29/19 1,2,3,4,6,7,8-HpCDD 1 I4297-2 47.9 ppq J 0.01 0.479 99 I4798-2 6/29/19 1,2,3,4,6,7,8-HpCDF 1 I4297-2 6.4 ppq J 0.01 0.064 99 I4798-2 6/29/19 1,2,3,4,7,8,9-HpCDF 1 I4297-2 1.6 ppq U 0.01 0.016 99 I4798-2 6/29/19 1,2,3,4,7,8-HxCDD 1 I4297-2 1.1 ppq U 0.1 0.11 99 I4798-2 6/29/19 1,2,3,4,7,8-HxCDF 1 I4297-2 1 ppq U 0.1 0.1 99 I4798-2 6/29/19 1,2,3,6,7,8-HxCDD 1 I4297-2 1.3 ppq U 0.1 0.13 99 I4798-2 6/29/19 1,2,3,6,7,8-HxCDF 1 I4297-2 1 ppq U 0.1 0.1 99 I4798-2 6/29/19 1,2,3,7,8,9-HxCDD 1 I4297-2 1.2 ppq U 0.01 0.012 99 I4798-2 6/29/19 1,2,3,7,8,9-HxCDF 1 I4297-2 0.9 ppq U 0.1 0.09 99 I4798-2 6/29/19 1,2,3,7,8-PeCDD 1 I4297-2 1.2 ppq U 0.5 0.6 99 I4798-2 6/29/19 1,2,3,7,8-PeCDF 1 I4297-2 0.8 ppq U 0.05 0.04 99 I4798-2 6/29/19 2,3,4,6,7,8-HxCDF 1 I4297-2 1 ppq U 0.1 0.1 99 I4798-2 6/29/19 2,3,4,7,8-PeCDF 1 I4297-2 0.7 ppq U 0.5 0.35 99 I4798-2 6/29/19 2,3,7,8-TCDD 1 I4297-2 0.7 ppq U 1 0.7 99 I4798-2 6/29/19 2,3,7,8-TCDF 1 I4297-2 0.5 ppq U 0.1 0.05 99 I4798-2 6/29/19 OCDD 1 I4297-2 384.7 ppq 0.001 0.3847 99 I4798-2 6/29/19 OCDF 1 I4297-2 17.5 ppq J 0.001 0.0175 99 I4798-2 6/29/19 Sum of Total Equivalent Concentrations (TEC) 1 I4297-2 ppq 3.3432 99
Wednesday, October 24, 2001 Page 10 of 11

SAMPLE ID DATE PARAMETER L C CONCENTRATIO Q TEF TEC
I4798-3 6/29/19 1,2,3,4,6,7,8-HpCDD 1 I4297-3 5.7 ppq U 0.01 0.057 99 I4798-3 6/29/19 1,2,3,4,6,7,8-HpCDF 1 I4297-3 3.5 ppq U 0.01 0.035 99 I4798-3 6/29/19 1,2,3,4,7,8,9-HpCDF 1 I4297-3 3.5 ppq U 0.01 0.035 99 I4798-3 6/29/19 1,2,3,4,7,8-HxCDD 1 I4297-3 1.8 ppq U 0.1 0.18 99 I4798-3 6/29/19 1,2,3,4,7,8-HxCDF 1 I4297-3 1.6 ppq U 0.1 0.16 99 I4798-3 6/29/19 1,2,3,6,7,8-HxCDD 1 I4297-3 2.3 ppq U 0.1 0.23 99 I4798-3 6/29/19 1,2,3,6,7,8-HxCDF 1 I4297-3 1.6 ppq U 0.1 0.16 99 I4798-3 6/29/19 1,2,3,7,8,9-HxCDD 1 I4297-3 2 ppq U 0.01 0.02 99 I4798-3 6/29/19 1,2,3,7,8,9-HxCDF 1 I4297-3 1.5 ppq U 0.1 0.15 99 I4798-3 6/29/19 1,2,3,7,8-PeCDD 1 I4297-3 2.1 ppq U 0.5 1.05 99 I4798-3 6/29/19 1,2,3,7,8-PeCDF 1 I4297-3 1.4 ppq U 0.05 0.07 99 I4798-3 6/29/19 2,3,4,6,7,8-HxCDF 1 I4297-3 1.7 ppq U 0.1 0.17 99 I4798-3 6/29/19 2,3,4,7,8-PeCDF 1 I4297-3 1.3 ppq U 0.5 0.65 99 I4798-3 6/29/19 2,3,7,8-TCDD 1 I4297-3 1.2 ppq U 1 1.2 99 I4798-3 6/29/19 2,3,7,8-TCDF 1 I4297-3 0.8 ppq U 0.1 0.08 99 I4798-3 6/29/19 OCDD 1 I4297-3 46.8 ppq J 0.001 0.0468 99 I4798-3 6/29/19 OCDF 1 I4297-3 0.5 ppq U 0.001 0.0005 99 I4798-3 6/29/19 Sum of Total Equivalent Concentrations (TEC) 1 I4297-3 ppq 4.2943 99
Wednesday, October 24, 2001 Page 11 of 11

Table G-10: Percolated Water Exceeding the Groundwater Quality Standards ID DATE PARAMETER CAS RN TYPE CONC Q MDL GWQS RATIO I7390-1 9/15/1999 Aluminum 7429-90-5 Metals, Dissolved 290 pp 170 200 ppb 1.5 b I5297-1 7/23/1999 Aluminum 7429-90-5 Metals 1960 pp 170 200 ppb 9.8 b K4942-1 8/11/2000 Arsenic 7440-38-2 Metals, Dissolved 30 pp 8 ppb 3.8 b K4942-1 8/11/2000 Arsenic 7440-38-2 Metals 39 pp 8 ppb 4.9 b I5297-1 7/23/1999 Chloride 16887-00-6 misc 1010000 pp 410 250000 ppb 4.0 b K4942-1 8/11/2000 Chloride 16887-00-6 misc 7020000 pp 250000 ppb 28.1 b I7390-1 9/15/1999 Chloride 16887-00-6 misc 18800000 pp 4090 250000 ppb 75.2 b K4942-1 8/11/2000 Iron 7439-89-6 Metals, Dissolved 500 pp 300 ppb 1.7 b K4942-1 8/11/2000 Iron 7439-89-6 Metals 840 pp 300 ppb 2.8 b I7390-1 9/15/1999 Iron 7439-89-6 Metals 3480 pp 110 300 ppb 11.6 b I7390-1 9/15/1999 Iron 7439-89-6 Metals, Dissolved 3520 pp 110 300 ppb 11.7 b I5297-1 7/23/1999 Iron 7439-89-6 Metals 4300 pp 110 300 ppb 14.3 b I5297-1 7/23/1999 Lead 7439-92-1 Metals, Dissolved 15 pp 2.2 10 ppb 1.5 b I7390-1 9/15/1999 Lead 7439-92-1 Metals, Dissolved 19 pp 2.2 10 ppb 1.9 b I7390-1 9/15/1999 Lead 7439-92-1 Metals 20 pp 2.2 10 ppb 2.0 b I5297-1 7/23/1999 Lead 7439-92-1 Metals 35 pp 2.2 10 ppb 3.5 b K4942-1 8/11/2000 Manganese 7439-96-5 Metals 950 pp 50 ppb 19.0 b K4942-1 8/11/2000 Manganese 7439-96-5 Metals, Dissolved 950 pp 50 ppb 19.0 b
Thursday, October 25, 2001 Page 1 of 2

ID DATE PARAMETER CAS RN TYPE CONC Q MDL GWQS RATIO I7390-1 9/15/1999 Manganese 7439-96-5 Metals 1670 pp 11 50 ppb 33.4 b I7390-1 9/15/1999 Manganese 7439-96-5 Metals, Dissolved 1770 pp 11 50 ppb 35.4 b I5297-1 7/23/1999 Manganese 7439-96-5 Metals 3280 pp 11 50 ppb 65.6 b I5297-1 7/23/1999 Manganese 7439-96-5 Metals, Dissolved 3400 pp 11 50 ppb 68.0 b I5297-1 7/23/1999 Nickel 7440-02-0 Metals 110 pp 11 100 ppb 1.1 b I5297-1 7/23/1999 Nickel 7440-02-0 Metals, Dissolved 120 pp 11 100 ppb 1.2 b I7390-1 9/15/1999 Nickel 7440-02-0 Metals 220 pp 11 100 ppb 2.2 b I7390-1 9/15/1999 Nickel 7440-02-0 Metals, Dissolved 220 pp 11 100 ppb 2.2 b K4942-1 8/11/2000 Sodium 7440-23-5 Metals, Dissolved 3370000 pp 50000 ppb 67.4 b K4942-1 8/11/2000 Sodium 7440-23-5 Metals 3530000 pp 50000 ppb 70.6 b I7390-1 9/15/1999 Sodium 7440-23-5 Metals 4300000 pp 50000 50000 ppb 86.0 b I7390-1 9/15/1999 Sodium 7440-23-5 Metals, Dissolved 4740000 pp 50000 50000 ppb 94.8 b I5297-1 7/23/1999 Sodium 7440-23-5 Metals 6570000 pp 20000 50000 ppb 131.4 b I5297-1 7/23/1999 Sodium 7440-23-5 Metals, Dissolved 7920000 pp 20000 50000 ppb 158.4 b I7390-1 9/15/1999 Thallium 7440-28-0 Metals, Dissolved 16 pp J 60 10 ppb 1.6 b I5297-1 7/23/1999 Thallium 7440-28-0 Metals 70 pp 60 10 ppb 7.0 b I5297-1 7/23/1999 Thallium 7440-28-0 Metals, Dissolved 130 pp 60 10 ppb 13.0 b
Thursday, October 25, 2001 Page 2 of 2

Table G-11: Percolated Water Dioxin Results SAMPLE ID DATE PARAMETER CONCENTRATIO Q TEF TEC
I5297-1 7/23/1999 1,2,3,4,6,7,8-HpCDD 22 ppq J 0.01 0.22 I5297-1 7/23/1999 1,2,3,4,6,7,8-HpCDF 3.2 ppq U 0.01 0.032 I5297-1 7/23/1999 1,2,3,4,7,8,9-HpCDF 3.2 ppq U 0.01 0.032 I5297-1 7/23/1999 1,2,3,4,7,8-HxCDD 1.6 ppq U 0.1 0.16 I5297-1 7/23/1999 1,2,3,4,7,8-HxCDF 2.1 ppq U 0.1 0.21 I5297-1 7/23/1999 1,2,3,6,7,8-HxCDD 2 ppq U 0.1 0.2 I5297-1 7/23/1999 1,2,3,6,7,8-HxCDF 2.1 ppq U 0.1 0.21 I5297-1 7/23/1999 1,2,3,7,8,9-HxCDD 1.8 ppq U 0.01 0.018 I5297-1 7/23/1999 1,2,3,7,8,9-HxCDF 2 ppq U 0.1 0.2 I5297-1 7/23/1999 1,2,3,7,8-PeCDD 3.2 ppq U 0.5 1.6 I5297-1 7/23/1999 1,2,3,7,8-PeCDF 2 ppq U 0.05 0.1 I5297-1 7/23/1999 2,3,4,6,7,8-HxCDF 2.2 ppq U 0.1 0.22 I5297-1 7/23/1999 2,3,4,7,8-PeCDF 1.9 ppq U 0.5 0.95 I5297-1 7/23/1999 2,3,7,8-TCDD 1.7 ppq U 1 1.7 I5297-1 7/23/1999 2,3,7,8-TCDF 1 ppq U 0.1 0.1 I5297-1 7/23/1999 OCDD 217.9 ppq 0.001 0.2179 I5297-1 7/23/1999 OCDF 17.7 ppq J 0.001 0.0177 I5297-1 7/23/1999 Sum of Total Equivalent Concentrations (TEC) 6.1876
Thursday, October 25, 2001 Page 1 of 3
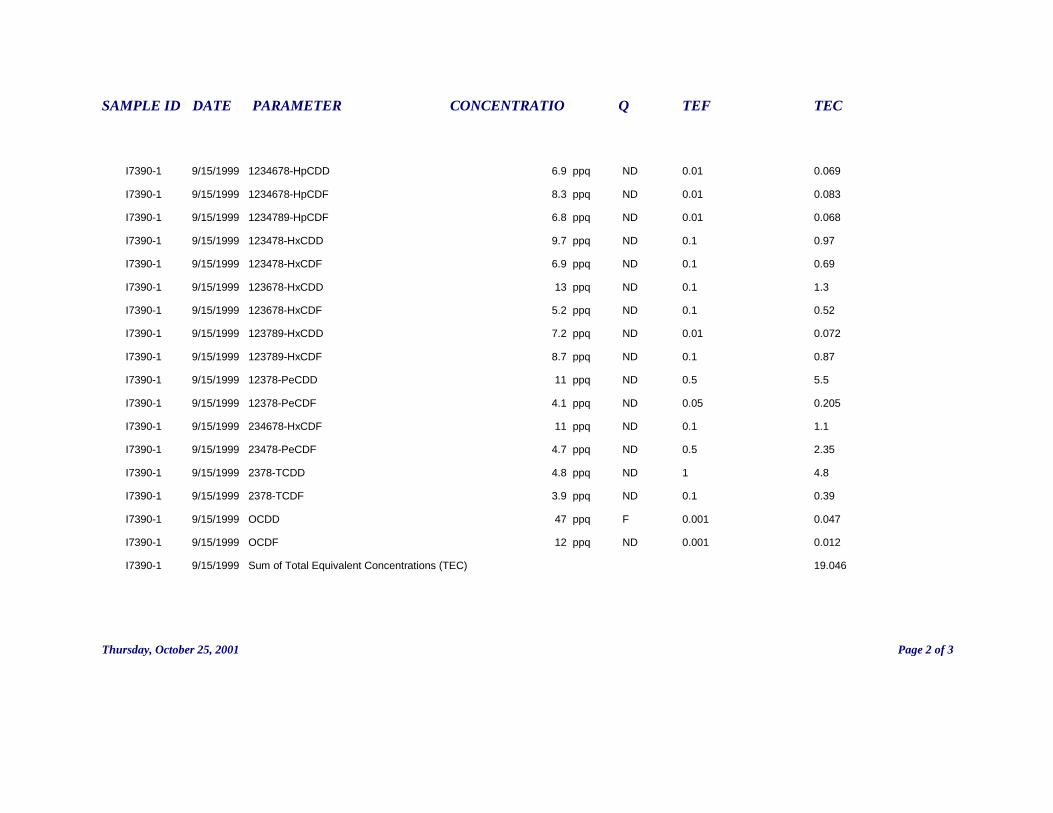
SAMPLE ID DATE PARAMETER CONCENTRATIO Q TEF TEC
I7390-1 9/15/1999 1234678-HpCDD 6.9 ppq ND 0.01 0.069 I7390-1 9/15/1999 1234678-HpCDF 8.3 ppq ND 0.01 0.083 I7390-1 9/15/1999 1234789-HpCDF 6.8 ppq ND 0.01 0.068 I7390-1 9/15/1999 123478-HxCDD 9.7 ppq ND 0.1 0.97 I7390-1 9/15/1999 123478-HxCDF 6.9 ppq ND 0.1 0.69 I7390-1 9/15/1999 123678-HxCDD 13 ppq ND 0.1 1.3 I7390-1 9/15/1999 123678-HxCDF 5.2 ppq ND 0.1 0.52 I7390-1 9/15/1999 123789-HxCDD 7.2 ppq ND 0.01 0.072 I7390-1 9/15/1999 123789-HxCDF 8.7 ppq ND 0.1 0.87 I7390-1 9/15/1999 12378-PeCDD 11 ppq ND 0.5 5.5 I7390-1 9/15/1999 12378-PeCDF 4.1 ppq ND 0.05 0.205 I7390-1 9/15/1999 234678-HxCDF 11 ppq ND 0.1 1.1 I7390-1 9/15/1999 23478-PeCDF 4.7 ppq ND 0.5 2.35 I7390-1 9/15/1999 2378-TCDD 4.8 ppq ND 1 4.8 I7390-1 9/15/1999 2378-TCDF 3.9 ppq ND 0.1 0.39 I7390-1 9/15/1999 OCDD 47 ppq F 0.001 0.047 I7390-1 9/15/1999 OCDF 12 ppq ND 0.001 0.012 I7390-1 9/15/1999 Sum of Total Equivalent Concentrations (TEC) 19.046
Thursday, October 25, 2001 Page 2 of 3

SAMPLE ID DATE PARAMETER CONCENTRATIO Q TEF TEC
K6185 8/30/2000 1,2,3,4,6,7,8-HpCDD 11 ppq U 0.01 0.11 K6185 8/30/2000 1,2,3,4,7,8,9-HpCDF 4.8 ppq U 0.01 0.048 K6185 8/30/2000 1,2,3,4,7,8-HxCDD 11 ppq U 0.1 1.1 K6185 8/30/2000 1,2,3,4,7,8-HxCDF 4.3 ppq U 0.1 0.43 K6185 8/30/2000 1,2,3,6,7,8-HxCDD 6.2 ppq U 0.1 0.62 K6185 8/30/2000 1,2,3,6,7,8-HxCDF 11 ppq U 0.1 1.1 K6185 8/30/2000 1,2,3,7,8,9-HxCDD 5.4 ppq U 0.01 0.054 K6185 8/30/2000 1,2,3,7,8,9-HxCDF 5.4 ppq U 0.1 0.54 K6185 8/30/2000 1,2,3,7,8-PeCDD 11 ppq U 0.5 5.5 K6185 8/30/2000 1,2,3,7,8-PeCDF 11 ppq U 0.05 0.55 K6185 8/30/2000 1,2.3,4,6,7,8-HpCDF 3.1 ppq U 0.01 0.031 K6185 8/30/2000 2,3,4,6,7,8-HxCDF 11 ppq U 0.1 1.1 K6185 8/30/2000 2,3,4,7,8-PeCDF 11 ppq U 0.5 5.5 K6185 8/30/2000 2,3,7,8-TCDD 11 ppq U 1 11 K6185 8/30/2000 2,3,7,8-TCDF 11 ppq U 0.1 1.1 K6185 8/30/2000 OCDD 12 ppq U 0.001 0.012 K6185 8/30/2000 OCDF 12 ppq U 0.001 0.012 K6185 8/30/2000 Sum of Total Equivalent Concentrations (TEC) 28.807
Thursday, October 25, 2001 Page 3 of 3


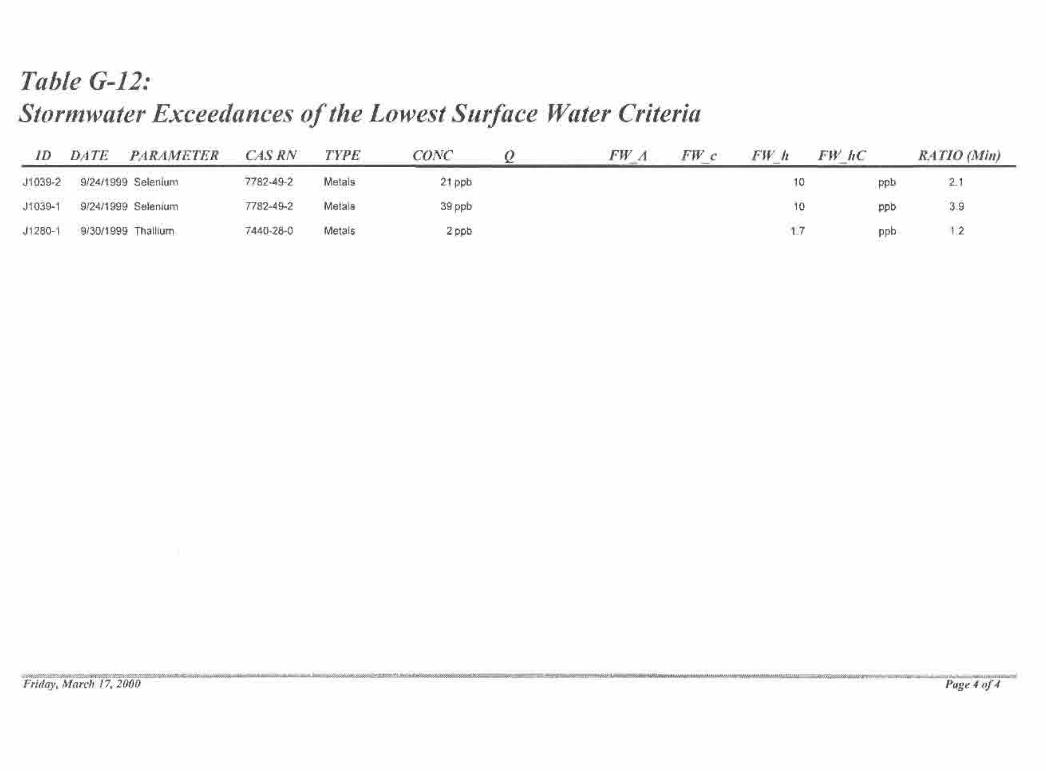
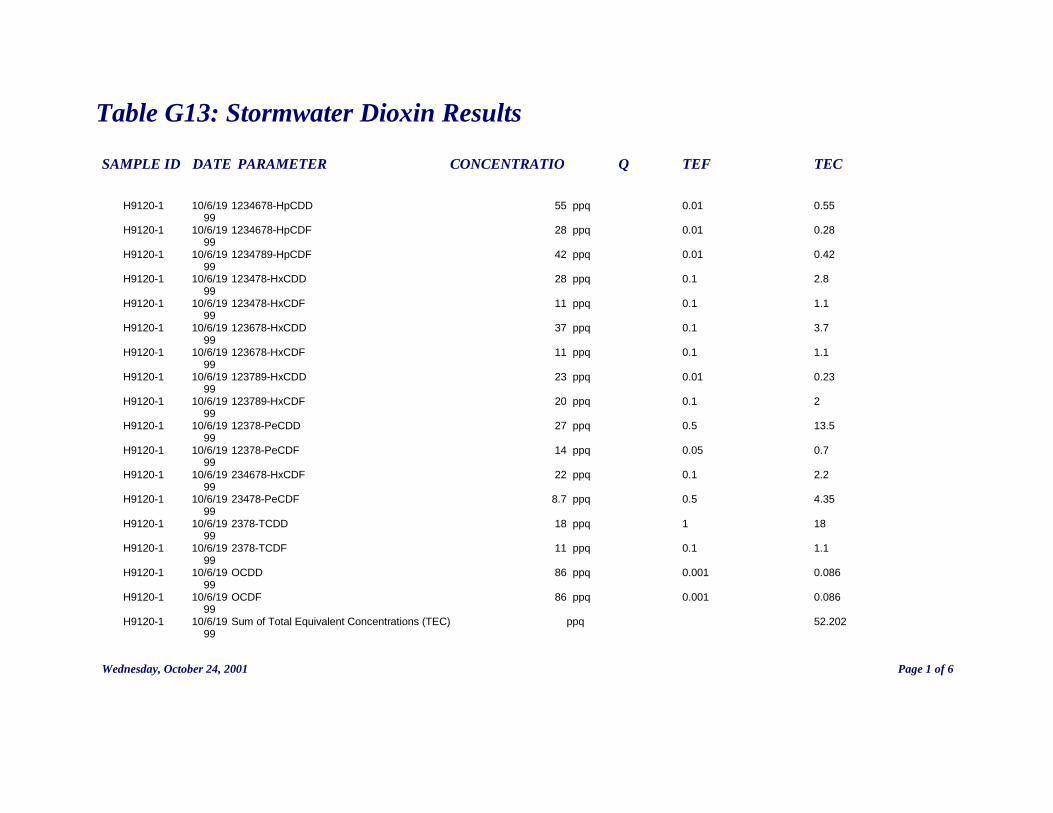
Table G13: Stormwater Dioxin Results SAMPLE ID DATE PARAMETER CONCENTRATIO Q TEF TEC
H9120-1 10/6/19 1234678-HpCDD 55 ppq 0.01 0.55 99 H9120-1 10/6/19 1234678-HpCDF 28 ppq 0.01 0.28 99 H9120-1 10/6/19 1234789-HpCDF 42 ppq 0.01 0.42 99 H9120-1 10/6/19 123478-HxCDD 28 ppq 0.1 2.8 99 H9120-1 10/6/19 123478-HxCDF 11 ppq 0.1 1.1 99 H9120-1 10/6/19 123678-HxCDD 37 ppq 0.1 3.7 99 H9120-1 10/6/19 123678-HxCDF 11 ppq 0.1 1.1 99 H9120-1 10/6/19 123789-HxCDD 23 ppq 0.01 0.23 99 H9120-1 10/6/19 123789-HxCDF 20 ppq 0.1 2 99 H9120-1 10/6/19 12378-PeCDD 27 ppq 0.5 13.5 99 H9120-1 10/6/19 12378-PeCDF 14 ppq 0.05 0.7 99 H9120-1 10/6/19 234678-HxCDF 22 ppq 0.1 2.2 99 H9120-1 10/6/19 23478-PeCDF 8.7 ppq 0.5 4.35 99 H9120-1 10/6/19 2378-TCDD 18 ppq 1 18 99 H9120-1 10/6/19 2378-TCDF 11 ppq 0.1 1.1 99 H9120-1 10/6/19 OCDD 86 ppq 0.001 0.086 99 H9120-1 10/6/19 OCDF 86 ppq 0.001 0.086 99 H9120-1 10/6/19 Sum of Total Equivalent Concentrations (TEC) ppq 52.202 99
Wednesday, October 24, 2001 Page 1 of 6
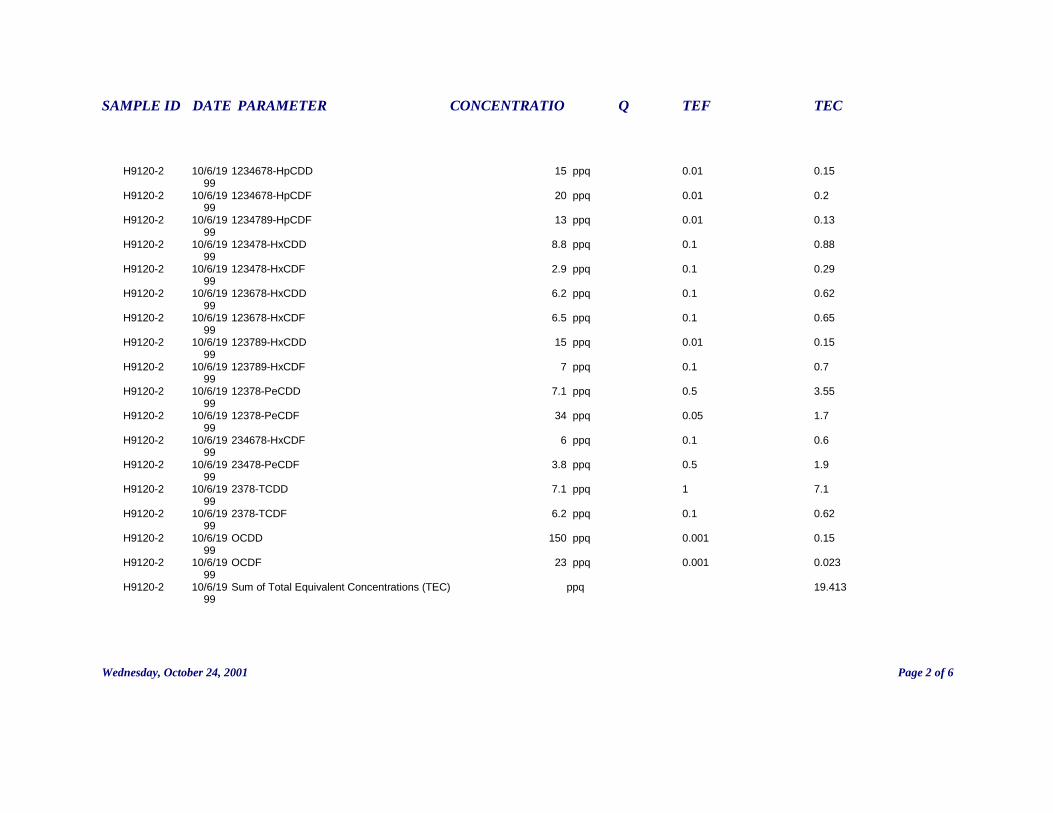
SAMPLE ID DATE PARAMETER CONCENTRATIO Q TEF TEC
H9120-2 10/6/19 1234678-HpCDD 15 ppq 0.01 0.15 99 H9120-2 10/6/19 1234678-HpCDF 20 ppq 0.01 0.2 99 H9120-2 10/6/19 1234789-HpCDF 13 ppq 0.01 0.13 99 H9120-2 10/6/19 123478-HxCDD 8.8 ppq 0.1 0.88 99 H9120-2 10/6/19 123478-HxCDF 2.9 ppq 0.1 0.29 99 H9120-2 10/6/19 123678-HxCDD 6.2 ppq 0.1 0.62 99 H9120-2 10/6/19 123678-HxCDF 6.5 ppq 0.1 0.65 99 H9120-2 10/6/19 123789-HxCDD 15 ppq 0.01 0.15 99 H9120-2 10/6/19 123789-HxCDF 7 ppq 0.1 0.7 99 H9120-2 10/6/19 12378-PeCDD 7.1 ppq 0.5 3.55 99 H9120-2 10/6/19 12378-PeCDF 34 ppq 0.05 1.7 99 H9120-2 10/6/19 234678-HxCDF 6 ppq 0.1 0.6 99 H9120-2 10/6/19 23478-PeCDF 3.8 ppq 0.5 1.9 99 H9120-2 10/6/19 2378-TCDD 7.1 ppq 1 7.1 99 H9120-2 10/6/19 2378-TCDF 6.2 ppq 0.1 0.62 99 H9120-2 10/6/19 OCDD 150 ppq 0.001 0.15 99 H9120-2 10/6/19 OCDF 23 ppq 0.001 0.023 99 H9120-2 10/6/19 Sum of Total Equivalent Concentrations (TEC) ppq 19.413 99
Wednesday, October 24, 2001 Page 2 of 6

SAMPLE ID DATE PARAMETER CONCENTRATIO Q TEF TEC
J1039-1 9/24/19 1234678-HpCDD 93 ppq 0.01 0.93 99 J1039-1 9/24/19 1234678-HpCDF 24 ppq 0.01 0.24 99 J1039-1 9/24/19 1234789-HpCDF 9.6 ppq ND 0.01 0.096 99 J1039-1 9/24/19 123478-HxCDD 9.7 ppq ND 0.1 0.97 99 J1039-1 9/24/19 123478-HxCDF 15 ppq ND 0.1 1.5 99 J1039-1 9/24/19 123678-HxCDD 6.3 ppq ND 0.1 0.63 99 J1039-1 9/24/19 123678-HxCDF 14 ppq ND 0.1 1.4 99 J1039-1 9/24/19 123789-HxCDD 9.7 ppq ND 0.01 0.097 99 J1039-1 9/24/19 123789-HxCDF 9.1 ppq ND 0.1 0.91 99 J1039-1 9/24/19 12378-PeCDD 14 ppq ND 0.5 7 99 J1039-1 9/24/19 12378-PeCDF 9.7 ppq ND 0.05 0.485 99 J1039-1 9/24/19 234678-HxCDF 8.6 ppq ND 0.1 0.86 99 J1039-1 9/24/19 23478-PeCDF 7.2 ppq ND 0.5 3.6 99 J1039-1 9/24/19 2378-TCDD 2.6 ppq 1 2.6 99 J1039-1 9/24/19 2378-TCDF 12 ppq ND 0.1 1.2 99 J1039-1 9/24/19 OCDD 990 ppq 0.001 0.99 99 J1039-1 9/24/19 OCDF 42 ppq F 0.001 0.042 99 J1039-1 9/24/19 Sum of Total Equivalent Concentrations (TEC) ppq 23.55 99
Wednesday, October 24, 2001 Page 3 of 6

SAMPLE ID DATE PARAMETER CONCENTRATIO Q TEF TEC
J1039-2 9/24/19 1234678-HpCDD 85 ppq 0.01 0.85 99 J1039-2 9/24/19 1234678-HpCDF 21 ppq 0.01 0.21 99 J1039-2 9/24/19 1234789-HpCDF 9.2 ppq 0.01 0.092 99 J1039-2 9/24/19 123478-HxCDD 11 ppq 0.1 1.1 99 J1039-2 9/24/19 123478-HxCDF 11 ppq 0.1 1.1 99 J1039-2 9/24/19 123678-HxCDD 16 ppq 0.1 1.6 99 J1039-2 9/24/19 123678-HxCDF 11 ppq 0.1 1.1 99 J1039-2 9/24/19 123789-HxCDD 11 ppq 0.01 0.11 99 J1039-2 9/24/19 123789-HxCDF 9.3 ppq 0.1 0.93 99 J1039-2 9/24/19 12378-PeCDD 17 ppq 0.5 8.5 99 J1039-2 9/24/19 12378-PeCDF 7.5 ppq 0.05 0.375 99 J1039-2 9/24/19 234678-HxCDF 7.8 ppq 0.1 0.78 99 J1039-2 9/24/19 23478-PeCDF 9.7 ppq 0.5 4.85 99 J1039-2 9/24/19 2378-TCDD 9.1 ppq 1 9.1 99 J1039-2 9/24/19 2378-TCDF 5.7 ppq G 0.1 0.57 99 J1039-2 9/24/19 OCDD 1100 ppq 0.001 1.1 99 J1039-2 9/24/19 OCDF 47 ppq F 0.001 0.047 99 J1039-2 9/24/19 Sum of Total Equivalent Concentrations (TEC) ppq 32.414 99
Wednesday, October 24, 2001 Page 4 of 6

SAMPLE ID DATE PARAMETER CONCENTRATIO Q TEF TEC
J1280-1 9/30/19 1234678-HpCDD 15 ppq 0.01 0.15 99 J1280-1 9/30/19 1234678-HpCDF 7.9 ppq 0.01 0.079 99 J1280-1 9/30/19 1234789-HpCDF 17 ppq 0.01 0.17 99 J1280-1 9/30/19 123478-HxCDD 6.4 ppq 0.1 0.64 99 J1280-1 9/30/19 123478-HxCDF 4.4 ppq 0.1 0.44 99 J1280-1 9/30/19 123678-HxCDD 9.4 ppq 0.1 0.94 99 J1280-1 9/30/19 123678-HxCDF 5.9 ppq 0.1 0.59 99 J1280-1 9/30/19 123789-HxCDD 9.8 ppq 0.01 0.098 99 J1280-1 9/30/19 123789-HxCDF 5.4 ppq 0.1 0.54 99 J1280-1 9/30/19 12378-PeCDD 12 ppq 0.5 6 99 J1280-1 9/30/19 12378-PeCDF 5.5 ppq 0.05 0.275 99 J1280-1 9/30/19 234678-HxCDF 5.9 ppq 0.1 0.59 99 J1280-1 9/30/19 23478-PeCDF 4.8 ppq 0.5 2.4 99 J1280-1 9/30/19 2378-TCDD 8.4 ppq 1 8.4 99 J1280-1 9/30/19 2378-TCDF 9.6 ppq 0.1 0.96 99 J1280-1 9/30/19 OCDD 170 ppq 0.001 0.17 99 J1280-1 9/30/19 OCDF 8.7 ppq 0.001 0.0087 99 J1280-1 9/30/19 Sum of Total Equivalent Concentrations (TEC) ppq 22.4507 99
Wednesday, October 24, 2001 Page 5 of 6
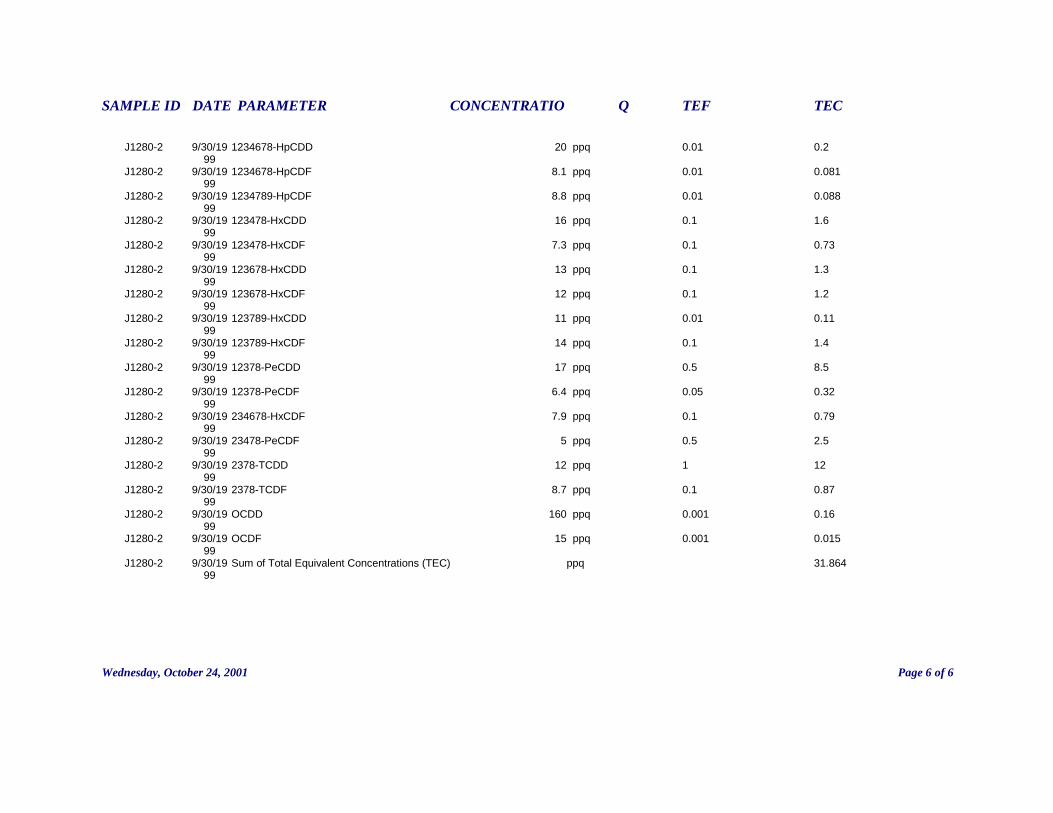
SAMPLE ID DATE PARAMETER CONCENTRATIO Q TEF TEC
J1280-2 9/30/19 1234678-HpCDD 20 ppq 0.01 0.2 99 J1280-2 9/30/19 1234678-HpCDF 8.1 ppq 0.01 0.081 99 J1280-2 9/30/19 1234789-HpCDF 8.8 ppq 0.01 0.088 99 J1280-2 9/30/19 123478-HxCDD 16 ppq 0.1 1.6 99 J1280-2 9/30/19 123478-HxCDF 7.3 ppq 0.1 0.73 99 J1280-2 9/30/19 123678-HxCDD 13 ppq 0.1 1.3 99 J1280-2 9/30/19 123678-HxCDF 12 ppq 0.1 1.2 99 J1280-2 9/30/19 123789-HxCDD 11 ppq 0.01 0.11 99 J1280-2 9/30/19 123789-HxCDF 14 ppq 0.1 1.4 99 J1280-2 9/30/19 12378-PeCDD 17 ppq 0.5 8.5 99 J1280-2 9/30/19 12378-PeCDF 6.4 ppq 0.05 0.32 99 J1280-2 9/30/19 234678-HxCDF 7.9 ppq 0.1 0.79 99 J1280-2 9/30/19 23478-PeCDF 5 ppq 0.5 2.5 99 J1280-2 9/30/19 2378-TCDD 12 ppq 1 12 99 J1280-2 9/30/19 2378-TCDF 8.7 ppq 0.1 0.87 99 J1280-2 9/30/19 OCDD 160 ppq 0.001 0.16 99 J1280-2 9/30/19 OCDF 15 ppq 0.001 0.015 99 J1280-2 9/30/19 Sum of Total Equivalent Concentrations (TEC) ppq 31.864 99
Wednesday, October 24, 2001 Page 6 of 6

Table G-14:Stormwater Collected During Construction Above the Lowest SE/SC Surface Water Criteria
ID DATE PARAMETER CAS_RN TYPE Q SE/SC SWC Ratio
H9120-1 10/6/1999 Arsenic 7440-38-2 Metals 230 ppb 0.136 1691.2
H9120-1 10/6/1999 Arsenic 7440-38-2 Metals, Dissolved 240 ppb 0.136 1764.7
H9120-2 10/6/1999 Arsenic 7440-38-2 Metals 610 ppb 0.136 4485.3
H9120-2 10/6/1999 Arsenic 7440-38-2 Metals, Dissolved 650 ppb 0.136 4779.4
J1039-1 9/24/1999 Arsenic 7440-38-2 Metals 1330 ppb 0.136 9779.4
J1039-1 9/24/1999 Arsenic 7440-38-2 Metals, Dissolved 1520 ppb 0.136 11176.5
J1039-2 9/24/1999 Arsenic 7440-38-2 Metals 550 ppb 0.136 4044.1
J1039-2 9/24/1999 Arsenic 7440-38-2 Metals, Dissolved 500 ppb 0.136 3676.5
J1280-1 9/30/1999 Arsenic 7440-38-2 Metals 180 ppb 0.136 1323.5
J1280-1 9/30/1999 Arsenic 7440-38-2 Metals, Dissolved 290 ppb 0.136 2132.4
J1280-2 9/30/1999 Arsenic 7440-38-2 Metals 590 ppb 0.136 4338.2
J1280-2 9/30/1999 Arsenic 7440-38-2 Metals, Dissolved 790 ppb 0.136 5808.8
H9120-1 10/6/1999 Copper 7440-50-8 Metals 270 ppb 5.6 48.2
H9120-1 10/6/1999 Copper 7440-50-8 Metals, Dissolved 270 ppb 5.6 48.2
H9120-2 10/6/1999 Copper 7440-50-8 Metals 400 ppb 5.6 71.4
H9120-2 10/6/1999 Copper 7440-50-8 Metals, Dissolved 410 ppb 5.6 73.2
J1039-1 9/24/1999 Copper 7440-50-8 Metals 1170 ppb 5.6 208.9
J1039-1 9/24/1999 Copper 7440-50-8 Metals, Dissolved 300 ppb 5.6 53.6
J1039-2 9/24/1999 Copper 7440-50-8 Metals 390 ppb 5.6 69.6
J1039-2 9/24/1999 Copper 7440-50-8 Metals, Dissolved 210 ppb 5.6 37.5
J1280-1 9/30/1999 Copper 7440-50-8 Metals 170 ppb 5.6 30.4
J1280-1 9/30/1999 Copper 7440-50-8 Metals, Dissolved 180 ppb 5.6 32.1
J1280-2 9/30/1999 Copper 7440-50-8 Metals 330 ppb 5.6 58.9
J1280-2 9/30/1999 Copper 7440-50-8 Metals, Dissolved 260 ppb 5.6 46.4
Page 1 of 2
CONC
Thursday, December 07, 2000
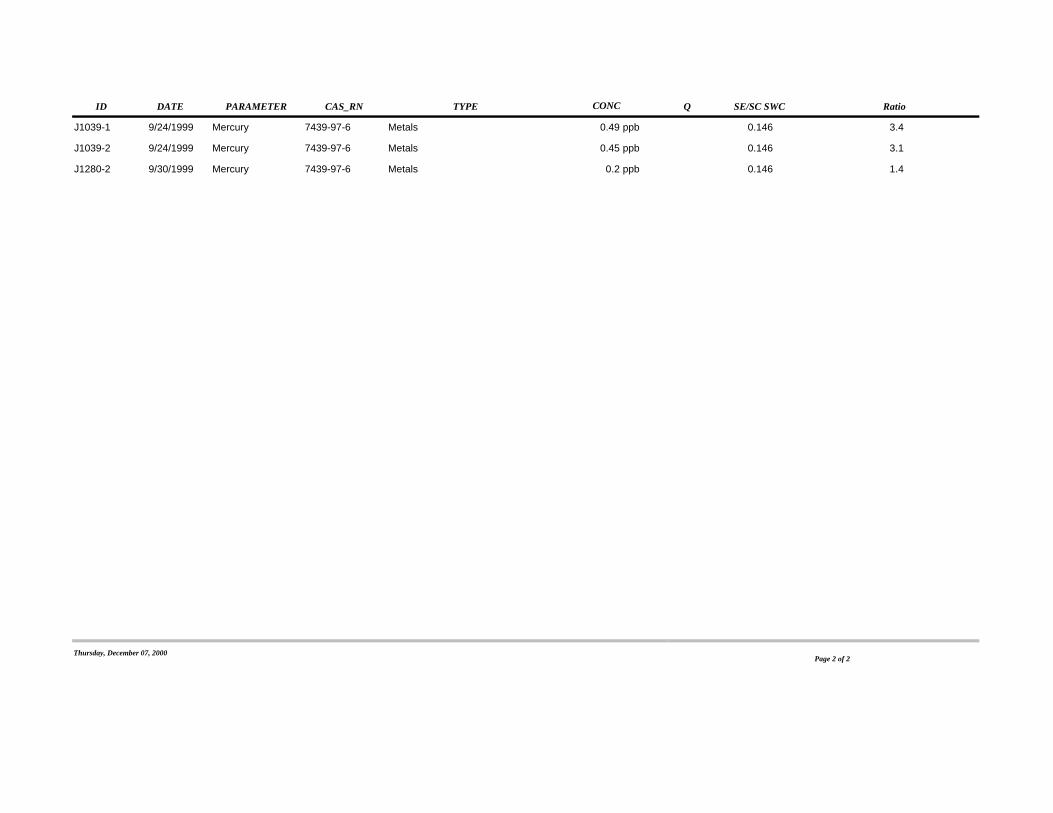
ID DATE PARAMETER CAS_RN TYPE Q SE/SC SWC Ratio
J1039-1 9/24/1999 Mercury 7439-97-6 Metals 0.49 ppb 0.146 3.4
J1039-2 9/24/1999 Mercury 7439-97-6 Metals 0.45 ppb 0.146 3.1
J1280-2 9/30/1999 Mercury 7439-97-6 Metals 0.2 ppb 0.146 1.4
Page 2 of 2
CONC
Thursday, December 07, 2000

Table G-15:Stormwater Collected During Construction Above the NJPDES Limitfor Discharge to Either FW_2 or SE/SC Surface Waters
ID DATE PARAMETER CAS_RN TYPE Q NJPDES-FW2 NJPDES-SE/SC Ratio (Min)
J1039-1 9/24/1999 Antimony 7440-36-0 Metals 300 ppb 280 -- 1.07
J1280-1 9/30/1999 Arsenic 7440-38-2 Metals, Dissolved 290 ppb 8 8 36.25
H9120-1 10/6/1999 Arsenic 7440-38-2 Metals 230 ppb 8 8 28.75
J1039-2 9/24/1999 Arsenic 7440-38-2 Metals, Dissolved 500 ppb 8 8 62.50
J1280-2 9/30/1999 Arsenic 7440-38-2 Metals, Dissolved 790 ppb 8 8 98.75
J1280-1 9/30/1999 Arsenic 7440-38-2 Metals 180 ppb 8 8 22.50
J1039-1 9/24/1999 Arsenic 7440-38-2 Metals, Dissolved 1520 ppb 8 8 190.00
H9120-2 10/6/1999 Arsenic 7440-38-2 Metals, Dissolved 650 ppb 8 8 81.25
H9120-1 10/6/1999 Arsenic 7440-38-2 Metals, Dissolved 240 ppb 8 8 30.00
J1280-2 9/30/1999 Arsenic 7440-38-2 Metals 590 ppb 8 8 73.75
J1039-2 9/24/1999 Arsenic 7440-38-2 Metals 550 ppb 8 8 68.75
J1039-1 9/24/1999 Arsenic 7440-38-2 Metals 1330 ppb 8 8 166.25
H9120-2 10/6/1999 Arsenic 7440-38-2 Metals 610 ppb 8 8 76.25
J1039-1 9/24/1999 Cadmium 7440-43-9 Metals 11 ppb 86 4 2.75
J1280-2 9/30/1999 Chromium 7440-47-3 Metals 72 ppb 32 818 2.25
J1039-1 9/24/1999 Chromium 7440-47-3 Metals 170 ppb 32 818 5.31
J1039-2 9/24/1999 Chromium 7440-47-3 Metals 88 ppb 32 818 2.75
J1280-2 9/30/1999 Copper 7440-50-8 Metals 330 ppb 11 18.4 30.00
Page 1 of 2Thursday, December 07, 2000
CONC

ID DATE PARAMETER CAS_RN TYPE Q NJPDES-FW2 NJPDES-SE/SC Ratio (Min)
J1039-1 9/24/1999 Copper 7440-50-8 Metals 1170 ppb 11 18.4 106.36
J1280-1 9/30/1999 Copper 7440-50-8 Metals, Dissolved 180 ppb 11 18.4 16.36
J1039-1 9/24/1999 Copper 7440-50-8 Metals, Dissolved 300 ppb 11 18.4 27.27
J1039-2 9/24/1999 Copper 7440-50-8 Metals 390 ppb 11 18.4 35.45
J1280-1 9/30/1999 Copper 7440-50-8 Metals 170 ppb 11 18.4 15.45
J1039-2 9/24/1999 Copper 7440-50-8 Metals, Dissolved 210 ppb 11 18.4 19.09
J1280-2 9/30/1999 Copper 7440-50-8 Metals, Dissolved 260 ppb 11 18.4 23.64
H9120-2 10/6/1999 Copper 7440-50-8 Metals 400 ppb 11 18.4 36.36
H9120-1 10/6/1999 Copper 7440-50-8 Metals 270 ppb 11 18.4 24.55
H9120-1 10/6/1999 Copper 7440-50-8 Metals, Dissolved 270 ppb 11 18.4 24.55
H9120-2 10/6/1999 Copper 7440-50-8 Metals, Dissolved 410 ppb 11 18.4 37.27
J1039-2 9/24/1999 Lead 7439-92-1 Metals 240 ppb 21 139 11.43
J1039-1 9/24/1999 Lead 7439-92-1 Metals 670 ppb 21 139 31.90
J1039-1 9/24/1999 Lead 7439-92-1 Metals, Dissolved 35 ppb 21 139 1.67
J1280-2 9/30/1999 Lead 7439-92-1 Metals 83 ppb 21 139 3.95
Page 2 of 2Thursday, December 07, 2000
CONC
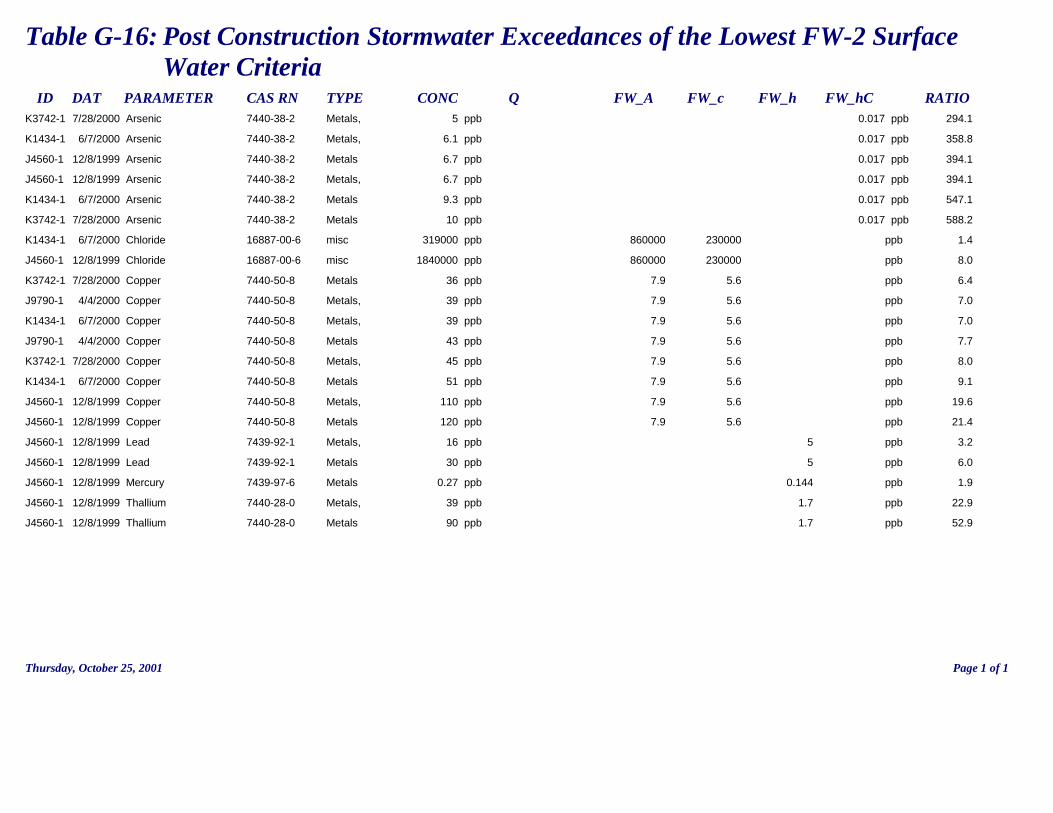
Table G-16: Post Construction Stormwater Exceedances of the Lowest FW-2 Surface Water Criteria ID DAT PARAMETER CAS RN TYPE CONC Q FW_A FW_c FW_h FW_hC RATIO K3742-1 7/28/2000 Arsenic 7440-38-2 Metals, 5 ppb 0.017 ppb 294.1 K1434-1 6/7/2000 Arsenic 7440-38-2 Metals, 6.1 ppb 0.017 ppb 358.8 J4560-1 12/8/1999 Arsenic 7440-38-2 Metals 6.7 ppb 0.017 ppb 394.1 J4560-1 12/8/1999 Arsenic 7440-38-2 Metals, 6.7 ppb 0.017 ppb 394.1 K1434-1 6/7/2000 Arsenic 7440-38-2 Metals 9.3 ppb 0.017 ppb 547.1 K3742-1 7/28/2000 Arsenic 7440-38-2 Metals 10 ppb 0.017 ppb 588.2 K1434-1 6/7/2000 Chloride 16887-00-6 misc 319000 ppb 860000 230000 ppb 1.4 J4560-1 12/8/1999 Chloride 16887-00-6 misc 1840000 ppb 860000 230000 ppb 8.0 K3742-1 7/28/2000 Copper 7440-50-8 Metals 36 ppb 7.9 5.6 ppb 6.4 J9790-1 4/4/2000 Copper 7440-50-8 Metals, 39 ppb 7.9 5.6 ppb 7.0 K1434-1 6/7/2000 Copper 7440-50-8 Metals, 39 ppb 7.9 5.6 ppb 7.0 J9790-1 4/4/2000 Copper 7440-50-8 Metals 43 ppb 7.9 5.6 ppb 7.7 K3742-1 7/28/2000 Copper 7440-50-8 Metals, 45 ppb 7.9 5.6 ppb 8.0 K1434-1 6/7/2000 Copper 7440-50-8 Metals 51 ppb 7.9 5.6 ppb 9.1 J4560-1 12/8/1999 Copper 7440-50-8 Metals, 110 ppb 7.9 5.6 ppb 19.6 J4560-1 12/8/1999 Copper 7440-50-8 Metals 120 ppb 7.9 5.6 ppb 21.4 J4560-1 12/8/1999 Lead 7439-92-1 Metals, 16 ppb 5 ppb 3.2 J4560-1 12/8/1999 Lead 7439-92-1 Metals 30 ppb 5 ppb 6.0 J4560-1 12/8/1999 Mercury 7439-97-6 Metals 0.27 ppb 0.144 ppb 1.9 J4560-1 12/8/1999 Thallium 7440-28-0 Metals, 39 ppb 1.7 ppb 22.9 J4560-1 12/8/1999 Thallium 7440-28-0 Metals 90 ppb 1.7 ppb 52.9
Thursday, October 25, 2001 Page 1 of 1

Table G-17:Post Construction Stormwater Above the Lowest SE/SC Surface Water Criteria
ID DATE PARAMETER CAS_RN TYPE Q SE/SC SWC Ratio
K3742-1 7/28/2000 Arsenic 7440-38-2 Metals 10 ppb 0.136 73.5
K3742-1 7/28/2000 Arsenic 7440-38-2 Metals, Dissolved 5 ppb 0.136 36.8
J4560-1 12/8/1999 Arsenic 7440-38-2 Metals 6.7 ppb 0.136 49.3
K1434-1 6/7/2000 Arsenic 7440-38-2 Metals 9.3 ppb 0.136 68.4
J4560-1 12/8/1999 Arsenic 7440-38-2 Metals, Dissolved 6.7 ppb 0.136 49.3
K1434-1 6/7/2000 Arsenic 7440-38-2 Metals, Dissolved 6.1 ppb 0.136 44.9
K3742-1 7/28/2000 Copper 7440-50-8 Metals, Dissolved 45 ppb 5.6 8.0
J9790-1 4/4/2000 Copper 7440-50-8 Metals, Dissolved 39 ppb 5.6 7.0
K1434-1 6/7/2000 Copper 7440-50-8 Metals, Dissolved 39 ppb 5.6 7.0
K1434-1 6/7/2000 Copper 7440-50-8 Metals 51 ppb 5.6 9.1
K3742-1 7/28/2000 Copper 7440-50-8 Metals 36 ppb 5.6 6.4
J4560-1 12/8/1999 Copper 7440-50-8 Metals, Dissolved 110 ppb 5.6 19.6
J9790-1 4/4/2000 Copper 7440-50-8 Metals 43 ppb 5.6 7.7
J4560-1 12/8/1999 Copper 7440-50-8 Metals 120 ppb 5.6 21.4
J4560-1 12/8/1999 Mercury 7439-97-6 Metals 0.27 ppb 0.146 1.8
J4560-1 12/8/1999 Thallium 7440-28-0 Metals 90 ppb 6.22 14.5
J4560-1 12/8/1999 Thallium 7440-28-0 Metals, Dissolved 39 ppb 6.22 6.3
CONC
Thursday, December 07, 2000

Table G-18:Post Construction Stormwater Exceedences of the NJPDES Limit for Discharge to Either FW-2 or SE/SC Surface Waters
ID DATE PARAMETER CAS_RN TYPE Q NJPDES-FW2 NJPDES-SE/SC Ratio (Min)
K1434-1 6/7/2000 Arsenic 7440-38-2 Metals 9.3 ppb 8 8 1.2
K3742-1 7/28/2000 Arsenic 7440-38-2 Metals 10 ppb 8 8 1.3
K3742-1 7/28/2000 Copper 7440-50-8 Metals, Dissolved 45 ppb 18.4 10 4.5
J4560-1 12/8/1999 Copper 7440-50-8 Metals, Dissolved 110 ppb 18.4 10 11.0
K3742-1 7/28/2000 Copper 7440-50-8 Metals 36 ppb 18.4 10 3.6
J4560-1 12/8/1999 Copper 7440-50-8 Metals 120 ppb 18.4 10 12.0
J9790-1 4/4/2000 Copper 7440-50-8 Metals 43 ppb 18.4 10 4.3
J9790-1 4/4/2000 Copper 7440-50-8 Metals, Dissolved 39 ppb 18.4 10 3.9
K1434-1 6/7/2000 Copper 7440-50-8 Metals 51 ppb 18.4 10 5.1
K1434-1 6/7/2000 Copper 7440-50-8 Metals, Dissolved 39 ppb 18.4 10 3.9
J4560-1 12/8/1999 Silver 7440-22-4 Metals, Dissolved 8 ppb 2.4 4.6 3.3
K1434-1 6/7/2000 Silver 7440-22-4 Metals 6.3 ppb 2.4 4.6 2.6
J4560-1 12/8/1999 Silver 7440-22-4 Metals 9 ppb 2.4 4.6 3.8
J4560-1 12/8/1999 Thallium 7440-28-0 Metals 90 ppb 34 124 2.6
J4560-1 12/8/1999 Thallium 7440-28-0 Metals, Dissolved 39 ppb 34 124 1.1
Page 1 of 1
CONC
Thursday, December 07, 2000

Table G-19: Post Construction Stormwater Dioxin Results SAMPLE ID DATE PARAMETER CONCENTRATIO Q TEF TEC
J4560-1 12/8/1999 1234678-HpCDD 9.9 ppq 0.01 0.099 J4560-1 12/8/1999 1234678-HpCDF 8.5 ppq U 0.01 0.085 J4560-1 12/8/1999 1234789-HpCDF 5.3 ppq U 0.01 0.053 J4560-1 12/8/1999 123478-HxCDD 3.8 ppq U 0.1 0.38 J4560-1 12/8/1999 123478-HxCDF 5 ppq U 0.1 0.5 J4560-1 12/8/1999 123678-HxCDD 1.8 ppq U 0.1 0.18 J4560-1 12/8/1999 123678-HxCDF 3.8 ppq U 0.1 0.38 J4560-1 12/8/1999 123789-HxCDD 5.1 ppq U 0.01 0.051 J4560-1 12/8/1999 123789-HxCDF 7.1 ppq U 0.1 0.71 J4560-1 12/8/1999 12378-PeCDD 4.7 ppq U 0.5 2.35 J4560-1 12/8/1999 12378-PeCDF 5.5 ppq U 0.05 0.275 J4560-1 12/8/1999 234678-HxCDF 3.4 ppq 0.1 0.34 J4560-1 12/8/1999 23478-PeCDF 3.5 ppq U 0.5 1.75 J4560-1 12/8/1999 2378-TCDD 3.6 ppq U 1 3.6 J4560-1 12/8/1999 2378-TCDF 2.9 ppq U 0.1 0.29 J4560-1 12/8/1999 OCDD 280 ppq 0.001 0.28 J4560-1 12/8/1999 OCDF 9 ppq U 0.001 0.009 J4560-1 12/8/1999 Sum of Total Equivalent Concentrations (TEC) 11.233
Thursday, October 25, 2001 Page 1 of 4

SAMPLE ID DATE PARAMETER CONCENTRATIO Q TEF TEC
J9790-1 4/4/2000 1,2,3,4,6,7,8-HpCDD 26 ppq 0.01 0.26 J9790-1 4/4/2000 1,2,3,4,7,8,9-HpCDF 8.9 ppq U 0.01 0.089 J9790-1 4/4/2000 1,2,3,4,7,8-HxCDD 14 ppq U 0.1 1.4 J9790-1 4/4/2000 1,2,3,4,7,8-HxCDF 23 ppq 0.1 2.3 J9790-1 4/4/2000 1,2,3,6,7,8-HxCDD 13 ppq U 0.1 1.3 J9790-1 4/4/2000 1,2,3,6,7,8-HxCDF 3.1 ppq U 0.1 0.31 J9790-1 4/4/2000 1,2,3,7,8,9-HxCDD 9.7 ppq U 0.01 0.097 J9790-1 4/4/2000 1,2,3,7,8,9-HxCDF 8.7 ppq U 0.1 0.87 J9790-1 4/4/2000 1,2,3,7,8-PeCDD 5.7 ppq U 0.5 2.85 J9790-1 4/4/2000 1,2,3,7,8-PeCDF 2.9 ppq U 0.05 0.145 J9790-1 4/4/2000 1,2.3,4,6,7,8-HpCDF 66 ppq 0.01 0.66 J9790-1 4/4/2000 2,3,4,6,7,8-HxCDF 2.7 ppq U 0.1 0.27 J9790-1 4/4/2000 2,3,4,7,8-PeCDF 3.3 ppq U 0.5 1.65 J9790-1 4/4/2000 2,3,7,8-TCDD 6.5 ppq U 1 6.5 J9790-1 4/4/2000 2,3,7,8-TCDF 4.9 ppq U 0.1 0.49 J9790-1 4/4/2000 OCDD 1400 ppq 0.001 1.4 J9790-1 4/4/2000 OCDF 54 ppq 0.001 0.054 J9790-1 4/4/2000 Sum of Total Equivalent Concentrations (TEC) 20.385
Thursday, October 25, 2001 Page 2 of 4

SAMPLE ID DATE PARAMETER CONCENTRATIO Q TEF TEC
K1434-1 6/7/2000 1,2,3,4,6,7,8-HpCDD 17 ppq U 0.01 0.17 K1434-1 6/7/2000 1,2,3,4,7,8,9-HpCDF 12 ppq U 0.01 0.12 K1434-1 6/7/2000 1,2,3,4,7,8-HxCDD 17 ppq U 0.1 1.7 K1434-1 6/7/2000 1,2,3,4,7,8-HxCDF 5.7 ppq U 0.1 0.57 K1434-1 6/7/2000 1,2,3,6,7,8-HxCDD 15 ppq U 0.1 1.5 K1434-1 6/7/2000 1,2,3,6,7,8-HxCDF 8 ppq U 0.1 0.8 K1434-1 6/7/2000 1,2,3,7,8,9-HxCDD 15 ppq U 0.01 0.15 K1434-1 6/7/2000 1,2,3,7,8,9-HxCDF 10 ppq U 0.1 1 K1434-1 6/7/2000 1,2,3,7,8-PeCDD 11 ppq U 0.5 5.5 K1434-1 6/7/2000 1,2,3,7,8-PeCDF 6.4 ppq U 0.05 0.32 K1434-1 6/7/2000 1,2.3,4,6,7,8-HpCDF 7.6 ppq U 0.01 0.076 K1434-1 6/7/2000 2,3,4,6,7,8-HxCDF 8.6 ppq U 0.1 0.86 K1434-1 6/7/2000 2,3,4,7,8-PeCDF 5.7 ppq U 0.5 2.85 K1434-1 6/7/2000 2,3,7,8-TCDD 8.4 ppq U 1 8.4 K1434-1 6/7/2000 2,3,7,8-TCDF 5.1 ppq U 0.1 0.51 K1434-1 6/7/2000 OCDD 220 ppq 0.001 0.22 K1434-1 6/7/2000 OCDF 17 ppq U 0.001 0.017 K1434-1 6/7/2000 Sum of Total Equivalent Concentrations (TEC) 24.593
Thursday, October 25, 2001 Page 3 of 4
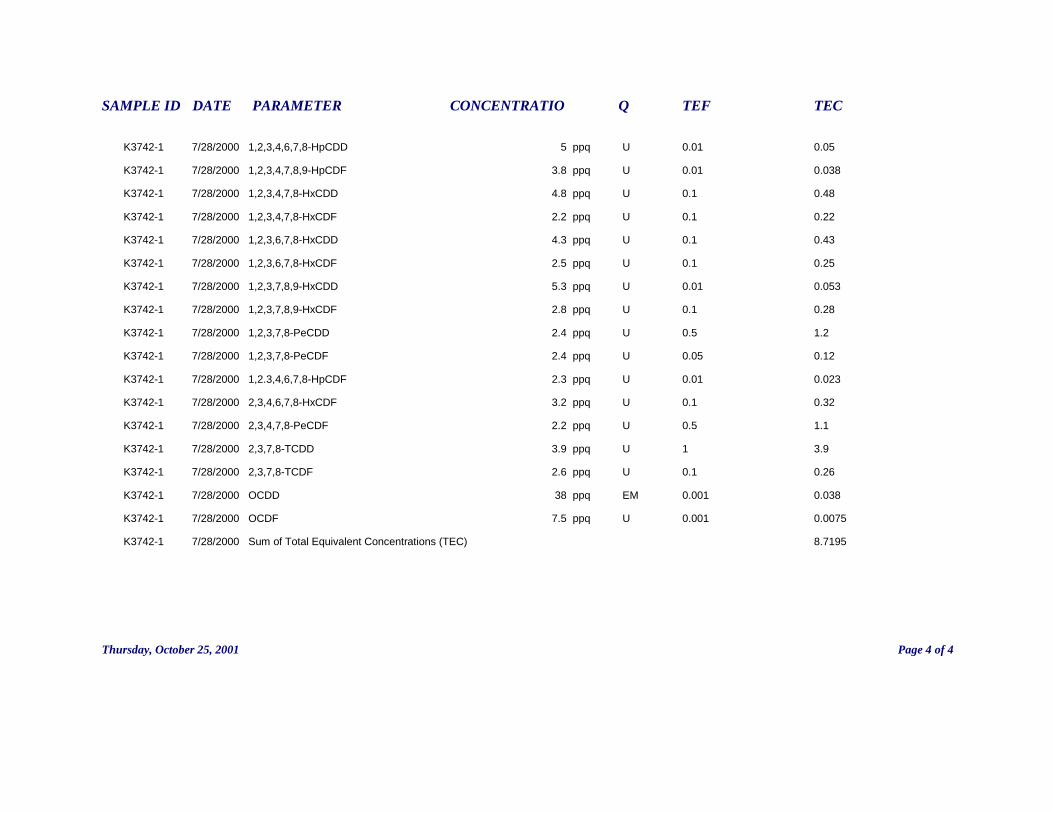
SAMPLE ID DATE PARAMETER CONCENTRATIO Q TEF TEC
K3742-1 7/28/2000 1,2,3,4,6,7,8-HpCDD 5 ppq U 0.01 0.05 K3742-1 7/28/2000 1,2,3,4,7,8,9-HpCDF 3.8 ppq U 0.01 0.038 K3742-1 7/28/2000 1,2,3,4,7,8-HxCDD 4.8 ppq U 0.1 0.48 K3742-1 7/28/2000 1,2,3,4,7,8-HxCDF 2.2 ppq U 0.1 0.22 K3742-1 7/28/2000 1,2,3,6,7,8-HxCDD 4.3 ppq U 0.1 0.43 K3742-1 7/28/2000 1,2,3,6,7,8-HxCDF 2.5 ppq U 0.1 0.25 K3742-1 7/28/2000 1,2,3,7,8,9-HxCDD 5.3 ppq U 0.01 0.053 K3742-1 7/28/2000 1,2,3,7,8,9-HxCDF 2.8 ppq U 0.1 0.28 K3742-1 7/28/2000 1,2,3,7,8-PeCDD 2.4 ppq U 0.5 1.2 K3742-1 7/28/2000 1,2,3,7,8-PeCDF 2.4 ppq U 0.05 0.12 K3742-1 7/28/2000 1,2.3,4,6,7,8-HpCDF 2.3 ppq U 0.01 0.023 K3742-1 7/28/2000 2,3,4,6,7,8-HxCDF 3.2 ppq U 0.1 0.32 K3742-1 7/28/2000 2,3,4,7,8-PeCDF 2.2 ppq U 0.5 1.1 K3742-1 7/28/2000 2,3,7,8-TCDD 3.9 ppq U 1 3.9 K3742-1 7/28/2000 2,3,7,8-TCDF 2.6 ppq U 0.1 0.26 K3742-1 7/28/2000 OCDD 38 ppq EM 0.001 0.038 K3742-1 7/28/2000 OCDF 7.5 ppq U 0.001 0.0075 K3742-1 7/28/2000 Sum of Total Equivalent Concentrations (TEC) 8.7195
Thursday, October 25, 2001 Page 4 of 4