Use of climate data for risk reduction – CCA and DRR perspective
18
Formatvorlage des Unter0telmasters durch Klicken Use of climate data for risk reduc1on – CCA and DRR perspec1ve Barbara Chimani Barbara Chimani h:p://www.ryylxjw.com/agriculture-wallpapers/41829438.html -2.0 www.wallpapersxl.com h:p://www.desktopimages.org
-
Upload
placard -
Category
Environment
-
view
379 -
download
0
Transcript of Use of climate data for risk reduction – CCA and DRR perspective

FormatvorlagedesUnter0telmastersdurchKlicken
Use of climate data for risk reduc1on – CCA and DRR
perspec1ve BarbaraChimaniBarbaraChimani
h:p://www.ryylxjw.com/agriculture-wallpapers/41829438.html
-2.01760
www.wallpapersxl.com
h:p://www.desktopimages.org

FormatvorlagedesUnter0telmastersdurchKlicken
• Concepts to adapta1on to climate change need high quality, high resolu1on climatological data
• Funded by Federa1on of Austria and all provinces
• Crea1on and Interpreta1on of high resolu1on climate informa1on on past, present and future and climate changes
Introduc0on

FormatvorlagedesUnter0telmastersdurchKlickenBackground:Observa0onalData
1kmgriddeddata:1961–2011
5 Parameter – daily values: • precipita1on • Temperature minimum/maximum
• (global radia1on/sunshine dura1on)
1kmgriddeddata:1981–2000
FormatvorlagedesUnter0telmastersdurchKlickenBackground
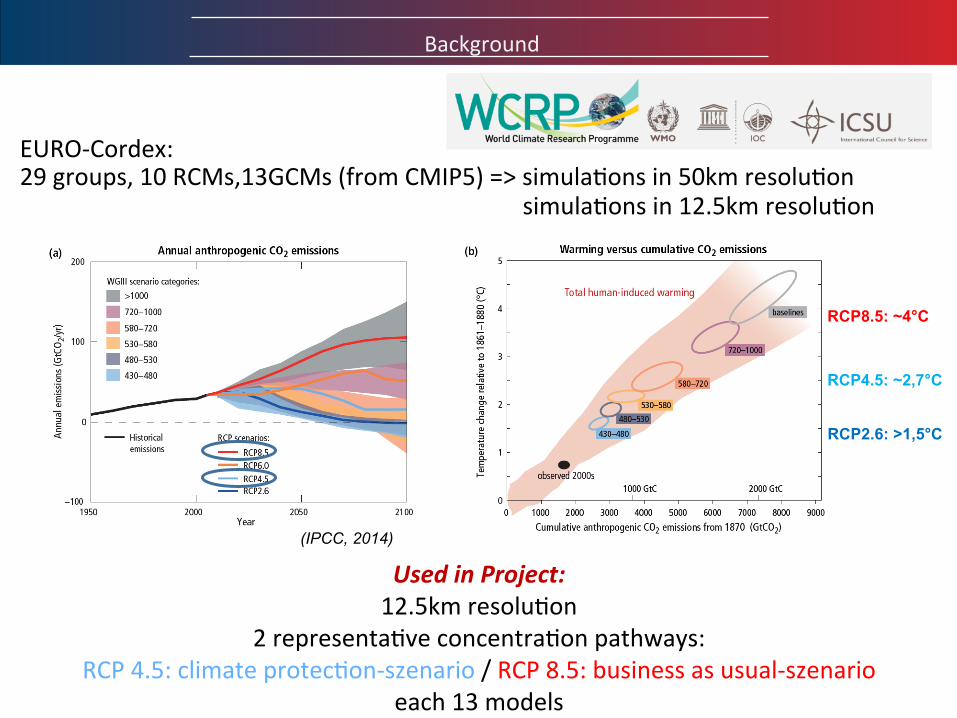
EURO-Cordex:29groups,10RCMs,13GCMs(fromCMIP5)=>simula0onsin50kmresolu0on
simula0onsin12.5kmresolu0on
UsedinProject:12.5kmresolu0on
2representa0veconcentra0onpathways:RCP4.5:climateprotec0on-szenario/RCP8.5:businessasusual-szenario
each13models
(IPCC, 2014)
RCP8.5: ~4°C
RCP4.5: ~2,7°C
RCP2.6: >1,5°C

FormatvorlagedesUnter0telmastersdurchKlickenBackground:Modeldata
12.5 km
~1 km

FormatvorlagedesUnter0telmastersdurchKlickenBackground:climatechangeanduncertain0es
∆M
M1
M2
• Calcula1on of climate means (M) and natural variability (NV) • analyse changes 1986-2010 to 1961-1985 • ∆M>NV à „significant“
past
Clim
atechangesignal
+
-0
Climatechangesignal:1971-2000to2021-20501971-2000to2071-2100
future
S<50% S>50%
Ü<80% nosignif.change Li:lemodelagreement
Ü>80% nosignif.change signif.change

FormatvorlagedesUnter0telmastersdurchKlickenClimateIndizes
temperature based precipitation based
radiation based

FormatvorlagedesUnter0telmastersdurchKlickenClimatechange:Past
meantemperature
median mean

FormatvorlagedesUnter0telmastersdurchKlickenClimatechange:Past
Precipita0onsum

FormatvorlagedesUnter0telmastersdurchKlickenClimatechange:Past
Mean precipitation intensity on days with precipitation

FormatvorlagedesUnter0telmastersdurchKlickenResults:Past
• Increase in temperature and changes in temperature dependend climate indices aUer 1950, accelera1ng aUer 1980. regional and seasonal differences
• Changes in temperature and temperature depending climate indices in many regions significant and consistent with long term signals..
• Only small long-term changes in precipita1on since 1860, regionally strong fluctua1ons superimposed
• Increase in annual precipita1on in Austria compared to 1961-1985 due to minimum around 1975.
• Natural fluctua1ons in precipita1on bigger than possible current climate change signals.
• Convec1ve events or other short term precipita1on extremes are not considered in these analyses.
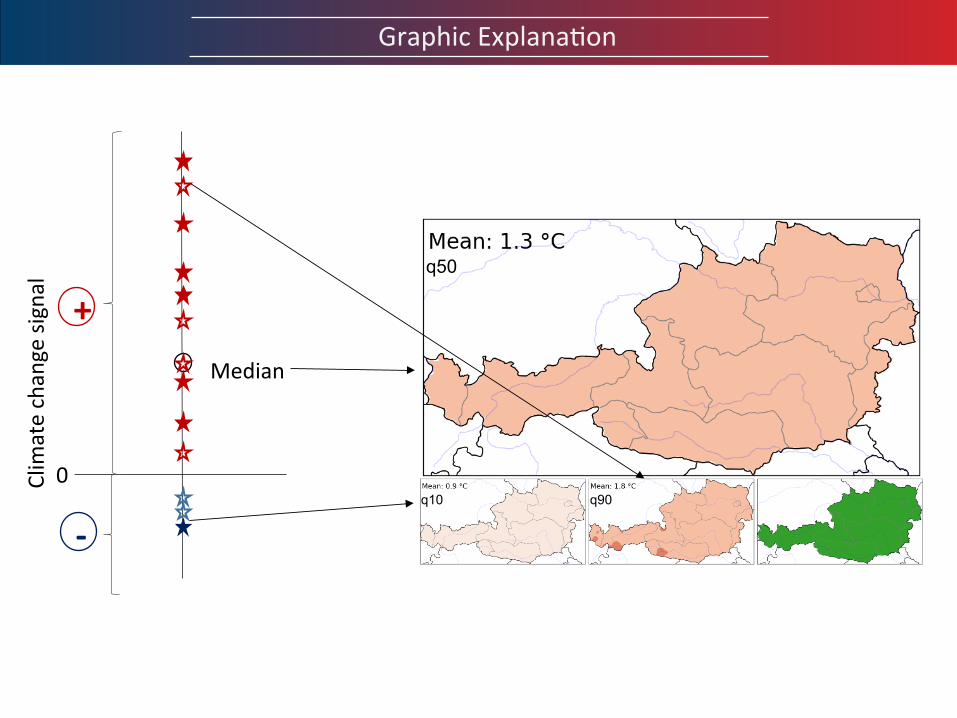
FormatvorlagedesUnter0telmastersdurchKlickenGraphicExplana0onClim
atechangesignal
+
-
0
Median
q50
q10 q90

FormatvorlagedesUnter0telmastersdurchKlickenClimatechange:Future
near future
(2021-2050)
far future
(2071-2100)
q50
q10 q90
q50
q10 q90
q50
q10 q90
q50
q10 q90
meantemperature Ref:1971-2000
RCP4.5 RCP8.5
RCP4.5 RCP8.5

FormatvorlagedesUnter0telmastersdurchKlickenClimatechange:Future
q50
q10 q90
q50
q10 q90
q50
q10 q90
q50
q10 q90
far future
(2071-2100)
far future
(2071-2100)
RCP8.5 - winter RCP8.5 - summer
Precipita0onamount
RCP4.5 - year RCP8.5 - year
Ref:1971-2000

FormatvorlagedesUnter0telmastersdurchKlickenClimatechange:Future
q50
q10 q90
q50
q10 q90
q50
q10 q90
q50
q10 q90
near future
(2021-2050)
far futur
(2071-2100)
Precipita0onintensity
RCP4.5 RCP8.5
RCP4.5 RCP8.5
Ref:1971-2000

FormatvorlagedesUnter0telmastersdurchKlickenResults:Future
- Near future: only small differences between szenarios (RCP4.5, RCP8.5)
- Far future: greater differences between szenarios (especially for temperature)
*not significant; ** in mountains not significant
2071-2100 Climateprotec;onszenario(RCP4.5)
Business-as-usualszenario(RCP8.5)
Annualmeantemperature +2,3°C +4°C
Annualprecipita0onamount +7,1% +8,7%
Frostday(annual) -41,8days -70days
Hotdays(annual) +7days** +17,7days
Precipita0ondays +0,5days* +1,3days*
Dryepisodes(annual) -2,8days* +2,2days*

FormatvorlagedesUnter0telmastersdurchKlickenFactsheets
• Forfederalprovincesandcommuni0es• Climatechangeinforma0onformeantemperature,precipita0onamountandselectedclimateindices
FormatvorlagedesUnter0telmastersdurchKlicken
• DateavailableinCCCA-datacentere.g.forstudiesconcerningclimateadap0onanddisasterriskreduc0on
• h:ps://www.ccca.ac.at/de/datenportal/• h:ps://sandboxdc.ccca.ac.at/
• DataintegratedinGIS-systemsofthefederalprovinces
• Factsheets(partly)availableviahomepageoffederalprovinces
Outlook