Use of Carbon Fiber Reinforced Polymer Composites to ... · PDF fileuse of carbon fiber...
243
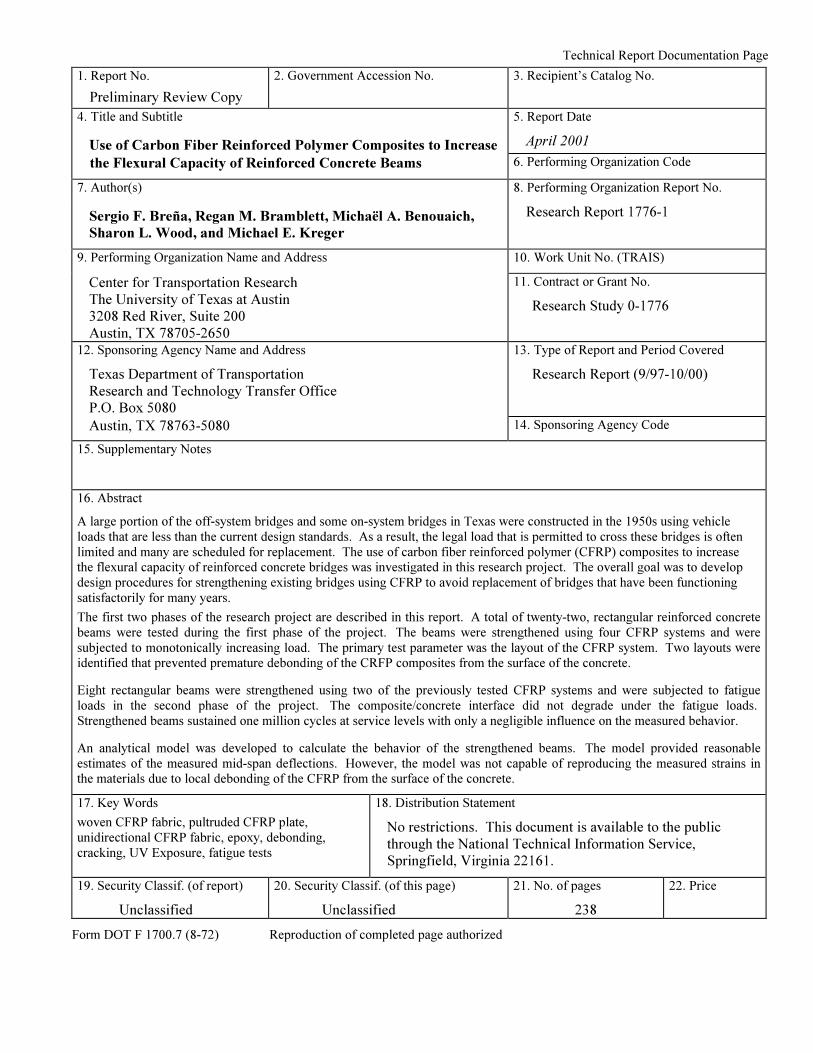
Technical Report Documentation Page 1. Report No. Preliminary Review Copy 2. Government Accession No. 3. Recipient’s Catalog No. 4. Title and Subtitle Use of Carbon Fiber Reinforced Polymer Composites to Increase 5. Report Date April 2001 the Flexural Capacity of Reinforced Concrete Beams 6. Performing Organization Code 7. Author(s) 8. Performing Organization Report No. Sergio F. Breña, Regan M. Bramblett, Michaël A. Benouaich, Sharon L. Wood, and Michael E. Kreger Research Report 1776-1 9. Performing Organization Name and Address 10. Work Unit No. (TRAIS) Center for Transportation Research The University of Texas at Austin 3208 Red River, Suite 200 Austin, TX 78705-2650 11. Contract or Grant No. Research Study 0-1776 12. Sponsoring Agency Name and Address Texas Department of Transportation Research and Technology Transfer Office P.O. Box 5080 13. Type of Report and Period Covered Research Report (9/97-10/00) Austin, TX 78763-5080 14. Sponsoring Agency Code 15. Supplementary Notes 16. Abstract A large portion of the off-system bridges and some on-system bridges in Texas were constructed in the 1950s using vehicle loads that are less than the current design standards. As a result, the legal load that is permitted to cross these bridges is often limited and many are scheduled for replacement. The use of carbon fiber reinforced polymer (CFRP) composites to increase the flexural capacity of reinforced concrete bridges was investigated in this research project. The overall goal was to develop design procedures for strengthening existing bridges using CFRP to avoid replacement of bridges that have been functioning satisfactorily for many years. The first two phases of the research project are described in this report. A total of twenty-two, rectangular reinforced concrete beams were tested during the first phase of the project. The beams were strengthened using four CFRP systems and were subjected to monotonically increasing load. The primary test parameter was the layout of the CFRP system. Two layouts were identified that prevented premature debonding of the CRFP composites from the surface of the concrete. Eight rectangular beams were strengthened using two of the previously tested CFRP systems and were subjected to fatigue loads in the second phase of the project. The composite/concrete interface did not degrade under the fatigue loads. Strengthened beams sustained one million cycles at service levels with only a negligible influence on the measured behavior. An analytical model was developed to calculate the behavior of the strengthened beams. The model provided reasonable estimates of the measured mid-span deflections. However, the model was not capable of reproducing the measured strains in the materials due to local debonding of the CFRP from the surface of the concrete. 17. Key Words woven CFRP fabric, pultruded CFRP plate, unidirectional CFRP fabric, epoxy, debonding, cracking, UV Exposure, fatigue tests 18. Distribution Statement No restrictions. This document is available to the public through the National Technical Information Service, Springfield, Virginia 22161. 19. Security Classif. (of report) Unclassified 20. Security Classif. (of this page) Unclassified 21. No. of pages 238 22. Price Form DOT F 1700.7 (8-72) Reproduction of completed page authorized
-
Upload
truongduong -
Category
Documents
-
view
217 -
download
0
Transcript of Use of Carbon Fiber Reinforced Polymer Composites to ... · PDF fileuse of carbon fiber...
Technical Report Documentation Page
1. Report No.
Preliminary Review Copy
2. Government Accession No. 3. Recipient’s Catalog No.
4. Title and Subtitle
Use of Carbon Fiber Reinforced Polymer Composites to Increase
5. Report Date
April 2001
the Flexural Capacity of Reinforced Concrete Beams 6. Performing Organization Code
7. Author(s) 8. Performing Organization Report No.
Sergio F. Breña, Regan M. Bramblett, Michaël A. Benouaich,
Sharon L. Wood, and Michael E. Kreger
Research Report 1776-1
9. Performing Organization Name and Address 10. Work Unit No. (TRAIS)
Center for Transportation Research
The University of Texas at Austin
3208 Red River, Suite 200
Austin, TX 78705-2650
11. Contract or Grant No.
Research Study 0-1776
12. Sponsoring Agency Name and Address
Texas Department of Transportation
Research and Technology Transfer Office
P.O. Box 5080
13. Type of Report and Period Covered
Research Report (9/97-10/00)
Austin, TX 78763-5080 14. Sponsoring Agency Code
15. Supplementary Notes
16. Abstract
A large portion of the off-system bridges and some on-system bridges in Texas were constructed in the 1950s using vehicle
loads that are less than the current design standards. As a result, the legal load that is permitted to cross these bridges is often
limited and many are scheduled for replacement. The use of carbon fiber reinforced polymer (CFRP) composites to increase the flexural capacity of reinforced concrete bridges was investigated in this research project. The overall goal was to develop
design procedures for strengthening existing bridges using CFRP to avoid replacement of bridges that have been functioning
satisfactorily for many years.�
The first two phases of the research project are described in this report. A total of twenty-two, rectangular reinforced concrete
beams were tested during the first phase of the project. The beams were strengthened using four CFRP systems and were
subjected to monotonically increasing load. The primary test parameter was the layout of the CFRP system. Two layouts were identified that prevented premature debonding of the CRFP composites from the surface of the concrete.
Eight rectangular beams were strengthened using two of the previously tested CFRP systems and were subjected to fatigue
loads in the second phase of the project. The composite/concrete interface did not degrade under the fatigue loads.
Strengthened beams sustained one million cycles at service levels with only a negligible influence on the measured behavior.
An analytical model was developed to calculate the behavior of the strengthened beams. The model provided reasonable
estimates of the measured mid-span deflections. However, the model was not capable of reproducing the measured strains in the materials due to local debonding of the CFRP from the surface of the concrete.
17. Key Words
woven CFRP fabric, pultruded CFRP plate,
unidirectional CFRP fabric, epoxy, debonding,
cracking, UV Exposure, fatigue tests
18. Distribution Statement
No restrictions. This document is available to the public
through the National Technical Information Service,
Springfield, Virginia 22161.
19. Security Classif. (of report)
Unclassified
20. Security Classif. (of this page)
Unclassified
21. No. of pages
238
22. Price
Form DOT F 1700.7 (8-72) Reproduction of completed page authorized

USE OF CARBON FIBER REINFORCED POLYMER
COMPOSITES TO INCREASE THE FLEXURAL CAPACITY OF
REINFORCED CONCRETE BEAMS
by
Sergio F. Breña, Regan M. Bramblett, Michaël A. Benouaich,
Sharon L. Wood, and Michael E. Kreger
Research Report 1776-1
Research Project 0-1776
DEVELOPMENT OF METHODS TO STRENGTHEN
EXISTING STRUCTURES WITH COMPOSITES
conducted for the
Texas Department of Transportation
in cooperation with the
U.S. Department of Transportation
Federal Highway Administration
by the
CENTER FOR TRANSPORTATION RESEARCH
BUREAU OF ENGINEERING RESEARCH
THE UNIVERSITY OF TEXAS AT AUSTIN
April 2001

iv
Research performed in cooperation with the Texas Department of Transportation and the U.S. Department of
Transportation, Federal Highway Administration.
ACKNOWLEDGEMENTS
This research project was sponsored by the Texas Department of Transportation (TxDOT) under Project
No. 0-1776. The involvement of Mark Steves and Richard Wilkison from TxDOT were extremely
important for the successful completion of the research project. Their fruitful suggestions were
incorporated into the research project to guarantee the applicability of the results from the experimental
program to actual field situations.
The manufacturers of the composite systems graciously donated the composites that were used to
strengthen the laboratory specimens. The assistance of Bill Light, Sika Corporation; Howard Kliger and
Bob Snider, Master Builders Technology; Paul Gugenheim, Delta Structural Technology, Inc. (Fyfe Co.);
and Ali Ganjehlou, Mitsubishi/Sumitomo Corp. is very much appreciated.
This research project was conducted at the Ferguson Structural Engineering Laboratory (FSEL). The
assistance of laboratory technicians and administrative staff was fundamental for the completion of this
project. Nicole García, Sarah Orton, and Janna Renfro participated during the fabrication and testing of
specimens during different phases of the project.
DISCLAIMERS
The contents of this report reflect the views of the authors, who are responsible for the facts and the
accuracy of the data presented herein. The contents do not necessarily reflect the view of the Federal
Highway Administration or the Texas Department of Transportation. This report does not constitute a
standard, specification, or regulation.
NOTICE
The United States Government and the state of Texas do no endorse products or manufacturers. Trade or
manufacturer’s names appear herein solely because they are considered essential to the object of this
report.
NOT INTENDED FOR CONSTRUCTION,
PERMIT, OR BIDDING PURPOSES
S. L. Wood, Texas P.E. #83804
M. E. Kreger, Texas P.E. #65541
Research Supervisors
v
TABLE OF CONTENTS
CHAPTER 1: INTRODUCTION........................................................................................................... 1
1.1 BACKGROUND ................................................................................................................................ 1
1.2 OBJECTIVES AND SCOPE OF RESEARCH ......................................................................................... 1
1.3 ORGANIZATION OF REPORT............................................................................................................ 2
CHAPTER 2: LITERATURE REVIEW............................................................................................... 5
2.1 INTRODUCTION ............................................................................................................................... 5
2.2 HISTORICAL BACKGROUND............................................................................................................ 5
2.3 BEAMS TESTED UNDER STATIC LOAD............................................................................................ 5
2.3.1 Flexural Tests on Small-Scale Specimen ............................................................................. 6
2.3.2 Flexural Tests of Large-Scale Specimens .......................................................................... 12
2.3.3 Tests to Characterize the Concrete-Composite Interface ................................................... 13
2.4 BEAMS TESTED UNDER FATIGUE LOAD........................................................................................ 15
2.5 SUMMARY .................................................................................................................................... 20
CHAPTER 3: ANALYTICAL MODEL TO CALCULATE THE FLEXURAL
RESPONSE OF REINFORCED CONCRETE ELEMENTS STRENGTHENED
USING CFRP COMPOSITES.................................................................................................. 21
3.1 INTRODUCTION ............................................................................................................................. 21
3.2 MOMENT-CURVATURE ANALYSIS OF STRENGTHENED SECTIONS............................................... 21
3.2.1 Assumptions Used in the Sectional Analysis Model.......................................................... 21
3.2.2 Stress-Strain Material Models Used for Sectional Analysis............................................... 22
3.2.3 Internal Equilibrium of Strengthened Cross Section.......................................................... 24
3.3 LOAD-DEFLECTION RESPONSE..................................................................................................... 25
3.4 VERIFICATION OF MODEL ............................................................................................................ 28
3.4.1 Tests by Spadea, Bencardino, and Swamy ......................................................................... 32
3.4.2 Tests by GangaRao and Vijay ............................................................................................ 33
3.4.3 Tests by Arduini, Di Tommaso, and Nanni........................................................................ 34
3.4.4 Tests by Nakamura, Sakai, Yagi, and Tanaka.................................................................... 36
3.4.5 Summary of Published Data............................................................................................... 38
3.5 SUMMARY .................................................................................................................................... 38
CHAPTER 4: DESCRIPTION OF LABORATORY SPECIMENS................................................. 39
4.1 INTRODUCTION ............................................................................................................................. 39
vi
4.2 DESIGN AND CONSTRUCTION OF LABORATORY SPECIMENS ....................................................... 39
4.3 CALCULATED CAPACITY OF BARE REINFORCED CONCRETE SPECIMENS ................................... 42
4.4 COMPOSITE SYSTEMS USED TO STRENGTHEN THE LABORATORY SPECIMENS ........................... 43
4.5 COMPOSITE SYSTEMS USED TO STRENGTHEN THE LABORATORY SPECIMENS ........................... 44
4.5.1 Composite Strengthening Schemes .................................................................................... 45
4.5.2 CFRP Bonded to Tension Face of Beams .......................................................................... 46
4.5.3 Bottom Application with Transverse Straps....................................................................... 47
4.5.4 CFRP Bonded to the Sides of Beams ................................................................................. 48
4.5.5 CFRP Bonded to the Sides of Beams with Straps .............................................................. 49
4.6 CALCULATED CAPACITY OF STRENGTHENED SPECIMENS ........................................................... 49
4.7 SUMMARY .................................................................................................................................... 50
CHAPTER 5: DESCRIPTION OF LABORATORY TESTS............................................................ 51
5.1 INTRODUCTION ............................................................................................................................. 51
5.2 DESCRIPTION OF TESTING PROGRAM ........................................................................................... 51
5.2.1 Static Tests ......................................................................................................................... 51
5.2.2 Fatigue Tests....................................................................................................................... 52
5.3 TEST SETUP AND LOADING SEQUENCE ........................................................................................ 54
5.3.1 Static Tests ......................................................................................................................... 55
5.3.2 Fatigue Tests....................................................................................................................... 55
5.4 SPECIMEN INSTRUMENTATION AND DATA ACQUISITION ............................................................ 56
5.5 SUMMARY .................................................................................................................................... 59
CHAPTER 6: MEASURED RESPONSE OF BEAMS SUBJECTED TO STATIC LOADS ........ 61
6.1 INTRODUCTION ............................................................................................................................. 61
6.2 OBSERVED RESPONSE OF SPECIMENS DURING TESTING ............................................................. 61
6.2.1 Beams Strengthened Using CFRP Bonded to the Tension Face ........................................ 61
6.2.2 Beams Strengthened Using CFRP Bottom Application and Straps ................................... 66
6.2.3 Beams Strengthened Using CFRP Bonded to Sides........................................................... 69
6.2.4 Beams Strengthened Using CFRP on Sides with Straps .................................................... 71
6.2.5 Beams Subjected to Cycles of Moisture and Environmental Exposure ............................. 73
6.3 MEASURED LOAD-DEFLECTION RESPONSE ................................................................................. 75
6.3.1 Qualitative Response of Strengthened Specimens ............................................................. 75
6.3.2 Measured Load-Deflection Response of Different Groups of Specimens ......................... 76
6.4 MEASURED STRAINS .................................................................................................................... 86
6.5 SUMMARY .................................................................................................................................... 92
vii
CHAPTER 7: EVALUATION OF MEASURED RESPONSE OF BEAMS SUBJECTED
TO STATIC LOADS ................................................................................................................. 93
7.1 INTRODUCTION ............................................................................................................................. 93
7.2 MEASURED STRAIN PROFILES ...................................................................................................... 93
7.3 COMPARISON OF MEASURED AND CALCULATED STRAINS.......................................................... 96
7.4 COMPARISON OF MEASURED AND CALCULATED DEFLECTIONS ............................................... 103
7.5 SUMMARY .................................................................................................................................. 109
CHAPTER 8: MEASURED RESPONSE OF BEAMS SUBJECTED TO FATIGUE
LOADING................................................................................................................................. 111
8.1 INTRODUCTION ........................................................................................................................... 111
8.2 OBSERVED RESPONSE OF SPECIMENS DURING TESTING ........................................................... 111
8.2.1 Beams Strengthened Using Composite System A............................................................ 111
8.2.2 Beams Strengthened Using Composite System D............................................................ 117
8.3 MEASURED LOAD-DEFLECTION RESPONSE ............................................................................... 123
8.3.1 Beams Strengthened Using Composite System A............................................................ 123
8.3.2 Beams Strengthened Using Composite System D............................................................ 125
8.4 MEASURED STRAINS .................................................................................................................. 127
8.4.1 Measured Strain Response of Specimens Tested Under Static Loading.......................... 129
8.5 SUMMARY .................................................................................................................................. 138
CHAPTER 9: SUMMARY AND CONCLUSIONS.......................................................................... 139
9.1 SUMMARY .................................................................................................................................. 139
9.2 CONCLUSIONS FROM SPECIMENS SUBJECTED TO STATIC LOADS .............................................. 140
9.3 CONCLUSIONS FROM SPECIMENS SUBJECTED TO FATIGUE LOADS ........................................... 140
9.4 LARGE-SCALE TESTS OF STRENGTHENED BRIDGE COMPONENTS............................................. 141
REFERENCES ................................................................................................................................... 143
APPENDIX A: MEASURED MATERIAL PROPERTIES .............................................................. 147
APPENDIX B: CRACK PATTERNS.................................................................................................. 159
APPENDIX C: APPLICATION OF CFRP COMPOSITE SYSTEMS TO EXISTING
REINFORCED CONCRETE ELEMENTS .......................................................................... 173
APPENDIX D: MEASURED STRAINS.............................................................................................. 181

viii
ix
LIST OF FIGURES
Figure 2.1 Observed Failure Modes of Strengthened Members Using CFRP Composites ...................... 7
Figure 2.2 Techniques used by Previous Researchers to Anchor Longitudinal CFRP Composites ......... 7
Figure 2.3 Strengthening of Tee-Beams Using CFRP Composite Sheets [Shahawy and Beitelman,
1996]...................................................................................................................................... 13
Figure 2.4 Direct Shear Test Apparatus .................................................................................................. 13
Figure 2.5 Bar-Pullout Bond Test Apparatus [Iketani and Jinno, 1997]................................................. 14
Figure 2.6 Variation of Interface Shear Stress with Distance [Brosens and VanGemert, 1997] ............ 14
Figure 2.7 Regions in Strengthened Beam where Different Peeling Modes Initiate [Blaschko et al.,
1998]...................................................................................................................................... 15
Figure 3.1 Idealized Stress-Strain Relationship for Concrete ................................................................. 22
Figure 3.2 Idealized Stress-Strain Relationships for Steel ...................................................................... 23
Figure 3.3 Idealized Stress-Strain Relationship for CFRP Composites.................................................. 24
Figure 3.4 Schematic Representation of Sectional Response Illustrating the Procedure Used in the
Calculations ........................................................................................................................... 26
Figure 3.5 Procedure to Calculate Deflections of an Element with a Nonlinear Moment-Curvature
Relationship ........................................................................................................................... 29
Figure 3.6 Comparison of Load-Deflection Curves for Specimens A.3 and A3.3 Reported by
Spadea et al. (1998) ............................................................................................................... 32
Figure 3.7 Comparison of Load-Deflection Curves for Specimens 1A2-R and 3B2-C Reported by
GangaRao and Vijay (1998) .................................................................................................. 35
Figure 3.8 Comparison of Load-Deflection Curves for Specimens B1, B2, and B4 Reported by
Arduini et al. (1997) .............................................................................................................. 36
Figure 3.9 Comparison of Load-Deflection Curves for Specimens BL, E24-1P, and E24-2P
Reported by Nakamura et al. (1997)...................................................................................... 37
Figure 4.1 Moment Diagram Used in the Design of Rectangular Beam Specimens .............................. 40
Figure 4.2 Geometry and Reinforcement of Laboratory Specimens....................................................... 41
Figure 4.3 Fabrication Sequence of Rectangular Beams in Laboratory.................................................. 42
Figure 4.4 Composite Systems A and B: Unidirectional Carbon Fibers................................................. 44
Figure 4.5 Composite System C: Woven Unidirectional Carbon Fibers ................................................ 45
Figure 4.6 Composite System D (Pultruded Plates)................................................................................ 45
Figure 4.7 Composite Strengthening Schemes Used in Rectangular Beam Specimens ......................... 46
Figure 4.8 Schematic of Specimen with CFRP Bonded to Tension Face............................................... 47
Figure 4.9 Schematic of Specimen with Transverse Straps to Control Debonding ................................ 48
Figure 4.10 Schematic of Specimen with CFRP Bonded to Sides............................................................ 48
x
Figure 4.11 Schematic of Specimen with CFRP Bonded to Sides and Anchorage Using Vertical
Straps ..................................................................................................................................... 49
Figure 5.1 Photograph Showing Specimens Subjected to Moisture ....................................................... 52
Figure 5.2 Test Setup for Rectangular Beam Specimens........................................................................ 54
Figure 5.3 Schematic of Loading Protocol for Fatigue Tests.................................................................. 56
Figure 5.4 Location of Instruments in Rectangular Beam Specimens .................................................... 57
Figure 5.5 Position of Linear Potentiometers on Laboratory Specimens................................................ 59
Figure 6.1 View of Bottom of Specimen A2 Showing the Formation of Secondary Cracks and
Debonding Cracks Along Both Sides of the CFRP Composite............................................. 62
Figure 6.2 View of the Bottom Face of Specimen A1 after Debonding of the CFRP Composite.......... 63
Figure 6.3 Schematic Representation of Cracking Mechanisms at Different Locations of a
Strengthened Beam................................................................................................................ 63
Figure 6.4 Initiation of Debonding Caused by Vertical Offset at Crack Location (Specimen B1) ........ 64
Figure 6.5 Bottom View of Specimen B1 Showing the Surface of the Concrete in the Area where
CFRP Debonding Initiated .................................................................................................... 65
Figure 6.6 Concrete Pulled-off from Surface of Specimen C2 after Debonding .................................... 66
Figure 6.7 Comparison of Bottom Surface of Concrete after Debonding of CFRP for Specimens D1
and D2.................................................................................................................................... 66
Figure 6.8 Localized Debonding Arrested by Vertical Straps in Specimen B2...................................... 67
Figure 6.9 Extent of Debonding and Rupture of CFRP Composite in Specimen B2 ............................. 67
Figure 6.10 Rupture of CFRP Composite in Specimen B4....................................................................... 68
Figure 6.11 Bottom View of Specimen B5 after Debonding .................................................................... 68
Figure 6.12 Propagation of Secondary Cracks into a Debonding Crack in Specimen B3 ........................ 69
Figure 6.13 Rupture of CFRP Composite in Specimen B3 after Failure .................................................. 70
Figure 6.14 Close-up of Debonding Crack that Originated from a Secondary Crack in Specimen D3... 70
Figure 6.15 Bottom View of Specimen D3 Showing Exposed Reinforcement after Debonding of
CFRP Plates ........................................................................................................................... 71
Figure 6.16 Formation of Debonding Cracks in Specimen D4................................................................. 72
Figure 6.17 Debonding at the End of the CFRP Composite Plate in Specimen D4.................................. 72
Figure 6.18 Shearing of Transverse Composite Straps after Debonding of CFRP Composites in
Specimen D4.......................................................................................................................... 73
Figure 6.19 Bottom View of Specimen A-LT1 after Rupture of the CFRP Composite ........................... 74
Figure 6.20 Bottom View of Specimen A-LT2 after Rupture of the CFRP Composite ........................... 74
Figure 6.21 Qualitative Representation of the Load-Deflection Response of the Strengthened
Specimens.............................................................................................................................. 75
Figure 6.22 Comparison of the Load-Deflection Response of Specimens Strengthened Using
Composite System A ............................................................................................................. 77
xi
Figure 6.23 Comparison of the Load-Deflection Response of Specimens Strengthened Using
Composite System B.............................................................................................................. 80
Figure 6.24 Comparison of the Load-Deflection Response of Specimens Strengthened Using
Composite System C.............................................................................................................. 82
Figure 6.25 Comparison of the Load-Deflection Response of Specimens Strengthened Using
Composite System D ............................................................................................................. 84
Figure 6.26 Load-Deflection Response of Specimens Subjected to Long-Term Exposure to Cycles of
Moisture................................................................................................................................. 86
Figure 6.27 Average Measured Strains in Specimen B4 (Section 1)........................................................ 89
Figure 6.28 Average Measured Strains in Specimen B4 (Section 2)........................................................ 90
Figure 7.1 Strain Profiles for Specimen A1 (Section 1) ......................................................................... 94
Figure 7.2 Strain Profiles for Specimen B3 (Section 1).......................................................................... 95
Figure 7.3 Strain Profiles for Specimen B4 (Section 1).......................................................................... 95
Figure 7.4 Strain Profiles for Specimen C3 (Section 1).......................................................................... 96
Figure 7.5 Strain Profiles for Specimen D5 (Section 1) ......................................................................... 96
Figure 7.6 Comparison of Measured and Calculated Strains in Specimen A1 (Section 1)..................... 98
Figure 7.7 Comparison of Measured and Calculated Strains in Specimen B3 (Section 1)..................... 99
Figure 7.8 Comparison of Measured and Calculated Strains in Specimen B4 (Section 1)................... 100
Figure 7.9 Comparison of Measured and Calculated Strains in Specimen C3 (Section 1)................... 101
Figure 7.10 Comparison of Measured and Calculated Strains in Specimen D5 (Section 1)................... 102
Figure 7.11 Schematic Distribution of Strains on the Surface of the CFRP Composites ....................... 103
Figure 7.12 Comparison of Measured and Calculated Load-Deflection Response of Specimen A1 ..... 105
Figure 7.13 Comparison of Measured and Calculated Load-Deflection Response of Specimen B3...... 105
Figure 7.14 Comparison of Measured and Calculated Load-Deflection Response of Specimen B4...... 106
Figure 7.15 Comparison of Measured and Calculated Load-Deflection Response of Specimen C3...... 106
Figure 7.16 Comparison of Measured and Calculated Load-Deflection Response of Specimen D5 ..... 107
Figure 8.1 Initiation of Debonding of Specimen A-F1 ......................................................................... 112
Figure 8.2 View of Tension Face of Specimen A-F2 after Debonding ................................................ 112
Figure 8.3 Extension of Cracks during Cycling of Specimen A-F3 ..................................................... 113
Figure 8.4 Local Debonding of CFRP Composite after 100,000 Cycles of Loading in Specimen
A-F3..................................................................................................................................... 114
Figure 8.5 Propagation of Debonding and Initiation of Strap Splitting after Failure of Specimen
A-F3..................................................................................................................................... 114
Figure 8.6 Extension of Cracks during Cycling of Specimen A-F4 ..................................................... 115
Figure 8.7 Bottom View of Specimen A-F4 Showing the Formation of Secondary Cracks during
Cycling in the Vicinity of the Crack Initiator ...................................................................... 116
Figure 8.8 Detail Showing Fatigue Fracture of Reinforcing Bar in Specimen A-F4............................ 116
xii
Figure 8.9 Formation and Extension of Crack Lengths as a Function of Load Cycling in Specimen
D-F2..................................................................................................................................... 117
Figure 8.10 Local Debonding of CFRP Plate on Specimen D-F2 during Fatigue Cycling .................... 118
Figure 8.11 Formation of Debonding Cracks in Specimen D-F2 ........................................................... 119
Figure 8.12 Debonding at the End of the CFRP Composite Plate in Specimen D-F2 ............................ 119
Figure 8.13 Formation and Extension of Crack Lengths as a Function of Load Cycling in Specimen
D-F3..................................................................................................................................... 120
Figure 8.14 Shear Crack that Formed During Cycling of Specimen D-F3............................................. 121
Figure 8.15 Crushing of the Concrete in the Compression Zone after Debonding of the CFRP Plate
on the Opposite Side of Specimen D-F3 ............................................................................. 121
Figure 8.16 Formation and Extension of Crack Lengths as a Function of Load Cycling in Specimen
D-F4..................................................................................................................................... 122
Figure 8.17 Detail Showing Propagation of Debonding Along the Top Edge of the Composite
Laminate in Specimen D-F4 during the First Cycle of Loading ......................................... 122
Figure 8.18 Debonding of Vertical Composite Straps During Cycling of Specimen D-F4.................... 123
Figure 8.19 Comparison of the Load-Deflection Response of Specimens Strengthened Using
Composite System A ........................................................................................................... 124
Figure 8.20 Comparison of the Load-Deflection Response of Specimens Strengthened Using
Composite System D ........................................................................................................... 127
Figure 8.21 Average Measured Strains in Specimen A-F3 during Static-Load Test to Failure
(Section 1)............................................................................................................................ 131
Figure 8.22 Average Measured Strains in Specimen D-F2 during Static-Load Test to Failure
(Section 1)............................................................................................................................ 132
Figure 8.23 Variation of Average Measured Strains with Number of Cycles for Specimens
Strengthened Using Composite System A (Section 1) ........................................................ 134
Figure 8.24 Variation of Average Measured Strains with Number of Cycles for Specimens
Strengthened Using Composite System A (Section 2) ........................................................ 135
Figure 8.25 Variation of Average Measured Strains with Number of Cycles for Specimens
Strengthened Using Composite System D (Section 1) ........................................................ 136
Figure 8.26 Variation of Average Measured Strains with Number of Cycles for Specimens
Strengthened Using Composite System D (Section 2) ........................................................ 137
xiii
LIST OF TABLES
Table 2.1 Qualitative Comparison of Different Fibers used in Composites [Meier and Winistörfer,
1995] ........................................................................................................................................... 6
Table 2.2 Summary of Previous Investigations on Flexural Tests.............................................................. 8
Table 2.3 Summary of Flexural Tests by Previous Investigators ............................................................... 9
Table 2.4 Geometry and Reinforcement of Flexural Specimens from Previous Investigators ................. 10
Table 2.5 Observed Failure Modes and Main Conclusions from Previous Flexural Tests....................... 12
Table 2.6 Summary of Tests of Beams under Fatigue Loading................................................................ 16
Table 2.7 Geometry and Reinforcement of Specimens Subjected to Fatigue Loads from Previous
Researchers ............................................................................................................................... 17
Table 2.8 Loading Sequence and Stress Ranges of Specimens Subjected to Fatigue Loads from
Previous Researchers ................................................................................................................ 18
Table 2.9 Failure Characteristics of Specimens Subjected to Fatigue Loads from Previous
Researchers ............................................................................................................................... 19
Table 3.1 Dimensions and Reinforcement of Specimens Reported by Other Researchers ...................... 30
Table 3.2 Material Properties and Dimensions of CFRP Composites of Specimens Reported by
Other Researchers ..................................................................................................................... 31
Table 3.3 Summary of Results from Published Data and Analytical Model ............................................ 33
Table 4.1 Summary of Material Properties and Nominal Capacities of Unstrengthened Rectangular
Beam Specimens....................................................................................................................... 48
Table 4.2 Summary of Flexural Capacity of Strengthened Rectangular Beam Specimens ...................... 54
Table 5.1 Details of the Specimens in the Static-Load Testing Program [Adapted from Bramblett,
2000] ......................................................................................................................................... 57
Table 5.2 Details of Laboratory Specimens in the Fatigue-Load Testing Program.................................. 58
Table 5.3 Summary of Fatigue Testing Program ...................................................................................... 60
Table 5.4 Characteristics of Strain Gages ................................................................................................. 61
Table 5.5 Position of Instrumented Sections for Rectangular Beam Specimens ...................................... 62
Table 6.1 Summary of Parameters and Failure Modes for the Specimens Strengthened Using
Composite System A................................................................................................................. 76
Table 6.2 Summary of Response of Specimens Subjected to Static Loads .............................................. 78
Table 6.3 Summary of Parameters and Failure Modes for the Specimens Strengthened Using
Composite System B................................................................................................................. 79
Table 6.4 Summary of Parameters and Failure Modes the Specimens Strengthened Using Composite
System C ................................................................................................................................... 81
Table 6.5 Summary of Parameters and Failure Modes the Specimens Strengthened Using Composite
System D................................................................................................................................... 83
xiv
Table 6.6 Summary of Parameters and Failure Modes for the Specimens Tested after Periodic
Exposure to Moisture................................................................................................................ 85
Table 6.7 Average Measured Strains for Specimens Subjected to Static Loads....................................... 91
Table 7.1 Comparison of Maximum Measured and Published Strains on the CFRP Laminates............ 104
Table 7.2 Comparison of Calculated and Measured Load-Deflection Response.................................... 108
Table 8.1 Observed Failure Modes of Specimens Strengthened Using Composite System A ............... 124
Table 8.2 Observed Failure Modes of Specimens Strengthened Using Composite System D ............... 125
Table 8.3 Summary of Results from Load-Deflection Response of Specimens in the Fatigue-Load
Testing Program...................................................................................................................... 128
Table 8.4 Average Measured Strain at Different Load Cycles for the Specimens in the Fatigue-Load
Testing Program...................................................................................................................... 133
Table 8.5 Average Measured Strain in Fatigue Specimens and Static-Load Specimens During Static-
Load Test to Failure ................................................................................................................ 133
xv
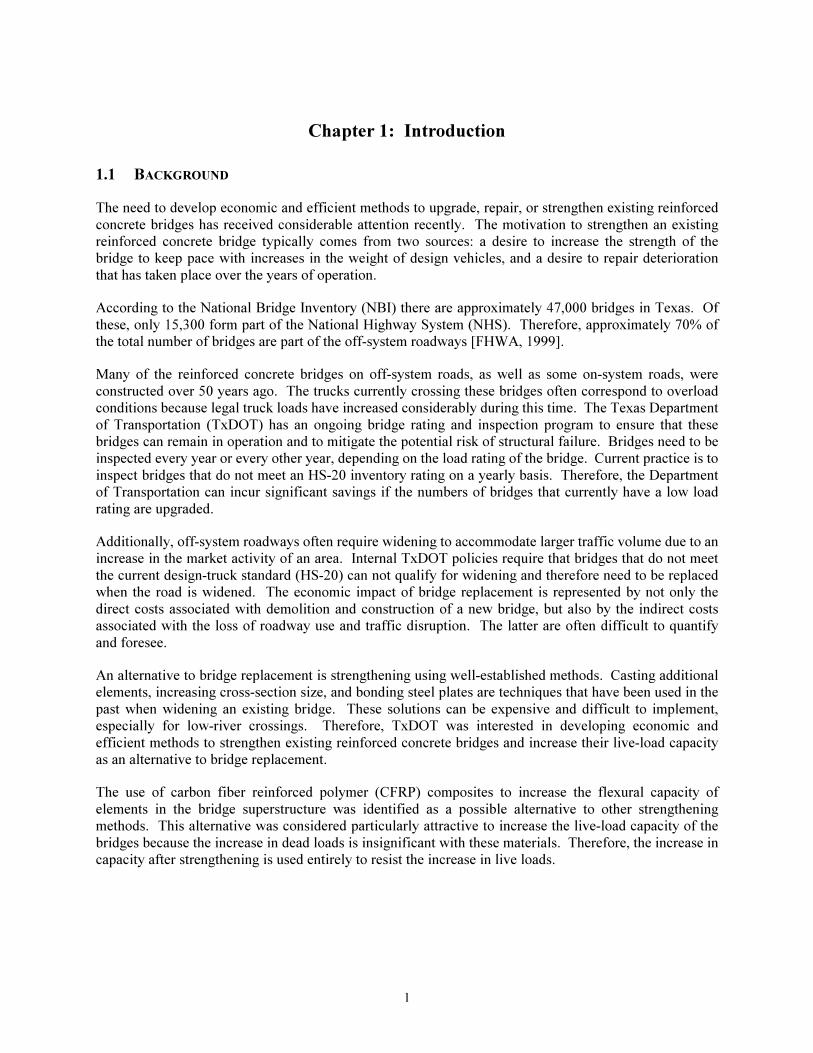
SUMMARY
A large portion of the off-system bridges and some on-system bridges in Texas were constructed in the
1950s using vehicle loads that are less than the current design standards. As a result, the legal load that is
permitted to cross these bridges is often limited and many are scheduled for replacement. The use of
carbon fiber reinforced polymer (CFRP) composites to increase the flexural capacity of reinforced
concrete bridges was investigated in this research project. The overall goal was to develop design
procedures for strengthening existing bridges using CFRP to avoid replacement of bridges that have been
functioning satisfactorily for many years.�
The first two phases of the research project are described in this report. A total of twenty-two, rectangular
reinforced concrete beams were tested during the first phase of the project. The beams were strengthened
using four CFRP systems and were subjected to monotonically increasing load. The primary test
parameter was the layout of the CFRP system. Two layouts were identified that prevented premature
debonding of the CRFP composites from the surface of the concrete.
Eight rectangular beams were strengthened using two of the previously tested CFRP systems and were
subjected to fatigue loads in the second phase of the project. The composite/concrete interface did not
degrade under the fatigue loads. Strengthened beams sustained one million cycles at service levels with
only a negligible influence on the measured behavior.
An analytical model was developed to calculate the behavior of the strengthened beams. The model
provided reasonable estimates of the measured mid-span deflections. However, the model was not
capable of reproducing the measured strains in the materials due to local debonding of the CFRP from the
surface of the concrete.
1
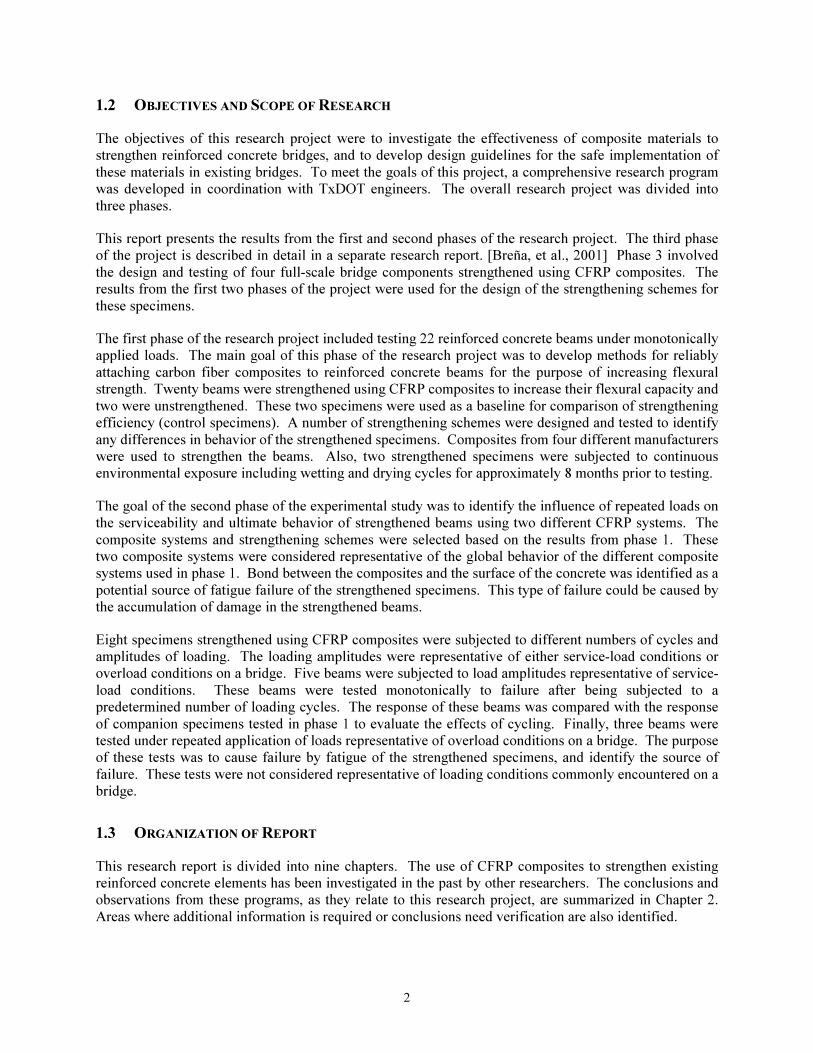
Chapter 1: Introduction
1.1 BACKGROUND
The need to develop economic and efficient methods to upgrade, repair, or strengthen existing reinforced
concrete bridges has received considerable attention recently. The motivation to strengthen an existing
reinforced concrete bridge typically comes from two sources: a desire to increase the strength of the
bridge to keep pace with increases in the weight of design vehicles, and a desire to repair deterioration
that has taken place over the years of operation.
According to the National Bridge Inventory (NBI) there are approximately 47,000 bridges in Texas. Of
these, only 15,300 form part of the National Highway System (NHS). Therefore, approximately 70% of
the total number of bridges are part of the off-system roadways [FHWA, 1999].
Many of the reinforced concrete bridges on off-system roads, as well as some on-system roads, were
constructed over 50 years ago. The trucks currently crossing these bridges often correspond to overload
conditions because legal truck loads have increased considerably during this time. The Texas Department
of Transportation (TxDOT) has an ongoing bridge rating and inspection program to ensure that these
bridges can remain in operation and to mitigate the potential risk of structural failure. Bridges need to be
inspected every year or every other year, depending on the load rating of the bridge. Current practice is to
inspect bridges that do not meet an HS-20 inventory rating on a yearly basis. Therefore, the Department
of Transportation can incur significant savings if the numbers of bridges that currently have a low load
rating are upgraded.
Additionally, off-system roadways often require widening to accommodate larger traffic volume due to an
increase in the market activity of an area. Internal TxDOT policies require that bridges that do not meet
the current design-truck standard (HS-20) can not qualify for widening and therefore need to be replaced
when the road is widened. The economic impact of bridge replacement is represented by not only the
direct costs associated with demolition and construction of a new bridge, but also by the indirect costs
associated with the loss of roadway use and traffic disruption. The latter are often difficult to quantify
and foresee.
An alternative to bridge replacement is strengthening using well-established methods. Casting additional
elements, increasing cross-section size, and bonding steel plates are techniques that have been used in the
past when widening an existing bridge. These solutions can be expensive and difficult to implement,
especially for low-river crossings. Therefore, TxDOT was interested in developing economic and
efficient methods to strengthen existing reinforced concrete bridges and increase their live-load capacity
as an alternative to bridge replacement.
The use of carbon fiber reinforced polymer (CFRP) composites to increase the flexural capacity of
elements in the bridge superstructure was identified as a possible alternative to other strengthening
methods. This alternative was considered particularly attractive to increase the live-load capacity of the
bridges because the increase in dead loads is insignificant with these materials. Therefore, the increase in
capacity after strengthening is used entirely to resist the increase in live loads.
2
1.2 OBJECTIVES AND SCOPE OF RESEARCH
The objectives of this research project were to investigate the effectiveness of composite materials to
strengthen reinforced concrete bridges, and to develop design guidelines for the safe implementation of
these materials in existing bridges. To meet the goals of this project, a comprehensive research program
was developed in coordination with TxDOT engineers. The overall research project was divided into
three phases.
This report presents the results from the first and second phases of the research project. The third phase
of the project is described in detail in a separate research report. [Breña, et al., 2001] Phase 3 involved
the design and testing of four full-scale bridge components strengthened using CFRP composites. The
results from the first two phases of the project were used for the design of the strengthening schemes for
these specimens.
The first phase of the research project included testing 22 reinforced concrete beams under monotonically
applied loads. The main goal of this phase of the research project was to develop methods for reliably
attaching carbon fiber composites to reinforced concrete beams for the purpose of increasing flexural
strength. Twenty beams were strengthened using CFRP composites to increase their flexural capacity and
two were unstrengthened. These two specimens were used as a baseline for comparison of strengthening
efficiency (control specimens). A number of strengthening schemes were designed and tested to identify
any differences in behavior of the strengthened specimens. Composites from four different manufacturers
were used to strengthen the beams. Also, two strengthened specimens were subjected to continuous
environmental exposure including wetting and drying cycles for approximately 8 months prior to testing.
The goal of the second phase of the experimental study was to identify the influence of repeated loads on
the serviceability and ultimate behavior of strengthened beams using two different CFRP systems. The
composite systems and strengthening schemes were selected based on the results from phase 1. These
two composite systems were considered representative of the global behavior of the different composite
systems used in phase 1. Bond between the composites and the surface of the concrete was identified as a
potential source of fatigue failure of the strengthened specimens. This type of failure could be caused by
the accumulation of damage in the strengthened beams.
Eight specimens strengthened using CFRP composites were subjected to different numbers of cycles and
amplitudes of loading. The loading amplitudes were representative of either service-load conditions or
overload conditions on a bridge. Five beams were subjected to load amplitudes representative of service-
load conditions. These beams were tested monotonically to failure after being subjected to a
predetermined number of loading cycles. The response of these beams was compared with the response
of companion specimens tested in phase 1 to evaluate the effects of cycling. Finally, three beams were
tested under repeated application of loads representative of overload conditions on a bridge. The purpose
of these tests was to cause failure by fatigue of the strengthened specimens, and identify the source of
failure. These tests were not considered representative of loading conditions commonly encountered on a
bridge.
1.3 ORGANIZATION OF REPORT
This research report is divided into nine chapters. The use of CFRP composites to strengthen existing
reinforced concrete elements has been investigated in the past by other researchers. The conclusions and
observations from these programs, as they relate to this research project, are summarized in Chapter 2.
Areas where additional information is required or conclusions need verification are also identified.
3
To meet the objectives of this investigation, it was considered essential to be able to calculate the capacity
and reproduce the behavior of the laboratory specimens representing the strengthened bridge elements
that were selected for this project. The analytical model presented in Chapter 3 was able to reproduce the
behavior of the strengthened elements. A discussion of the assumptions used in the development of the
analytical model is also presented.
The procedure used for the design of the laboratory specimens in phases 1 and 2 is presented in Chapter 4.
The details of the reinforced concrete beams and the composite systems are also presented. Chapter 5
gives a description of the laboratory tests conducted in the first two phases of the research project. The
test setup, instrumentation, and loading sequence are presented and discussed.
The measured response of the beams tested in phase 1 is presented in Chapter 6. A discussion of the
failure sequence of different groups of beams is presented first. Afterwards the measured strain and
deflection response of the different groups of beams is presented and discussed. The general
characteristics of the response of the specimens are described and discussed.
The measured response is compared with the calculated response of the specimens in Chapter 7. Some of
the assumptions used in the analytical model were also evaluated using the measured strain response. The
limitations of the analytical model are also identified.
Chapter 8 presents the measured response of the specimens subjected to fatigue loading. The
accumulation of damage and the failure sequence of the specimens are first discussed. The measured
strain response and displacement response are presented. The measured response of the beams tested
monotonically to failure after cyclic loading are compared with the response of the companion specimens
in phase 1. Finally Chapter 9 presents a summary and conclusions from the results of the first two phases
of this research project.

4
5
Chapter 2: Literature Review
2.1 INTRODUCTION
A review of previous investigations on the strengthening of reinforced concrete elements using CFRP
composites is presented in this chapter. A brief overview of the evolution of the use of composites in
civil engineering is presented in Section 2.2. The main failure modes observed during previous testing
and the conclusions drawn from these programs are presented in Section 2.3. Static-load testing of beams
strengthened using CFRP composites has been studied extensively as indicated in this chapter. However,
the number of studies on the fatigue performance of strengthened beams is limited. The available results
of previous testing on the fatigue performance of beams strengthened using CFRP composites are
presented in Section 2.4. A review of the literature indicated that although CFRP composites are already
being used to repair and strengthen existing structural concrete bridges, the technology is still in its
developmental stage.
2.2 HISTORICAL BACKGROUND
Fiber reinforced composites have been consistently used in other fields of engineering since the late
1960s. Their use had been restricted mainly to the aerospace and automotive industries, where the use of
high strength, lightweight materials results in significant fuel savings and the possibility of increasing the
payload. Airplane and automobile parts that were traditionally fabricated using aluminum are being
replaced with composites [Mallick, 1993]. Other fields such as the boating industry and sporting goods
industry have also benefitted from the used of fiber reinforced composites. For pressure vessels and
piping applications where corrosion protection is a primary concern, fiber reinforced plastics have also
been used extensively [ASME, 1992 and 1998].
In civil engineering, the use of composites is only beginning to gain acceptance because composite
materials have not been economically competitive with traditional building materials such as steel or
concrete, and comprehensive design guidelines [ASCE, 1984] are not available. The use of these
materials for the repair and strengthening of the aging infrastructure provides an interesting alternative to
traditional methods, because of their high strength-to-weight ratio, corrosion resistance, and excellent
fatigue performance. Although the technology of the use of composites in the aerospace industry has
advanced significantly over the last 30 years, many methods for their application to strengthen existing
structures are still under investigation.
To assess the applicability of composite materials for the bridge infrastructure in the United States, the
Federal Highway Administration conducted a scanning tour of Europe (UK, Switzerland, Germany) and
Japan, where composites had already been used to strengthen existing bridges [FHWA, 1997]. During
this survey, applications that did not require modification for use in the United States were identified. In
addition, areas where further research was needed before the technology could be implemented in field
applications were highlighted. In the case of strengthening of existing bridges using CFRP composites,
areas that need further research include the development of design guidelines consistent with U.S.
practice and the development of adequate details to ensure the full participation of the concrete substrate.
2.3 BEAMS TESTED UNDER STATIC LOAD
Research on strengthening existing structures using fiber reinforced composites (FRP) was motivated by
the need to eliminate some of the problems associated with the traditional method of strengthening by

6
bonding steel plates to the surface of the concrete. By using FRP composite plates, the corrosion potential
of the plates was eliminated and the use of heavy equipment to handle the plates during construction was
minimized.
Investigations on the use of fiber reinforced composites to strengthen bridge structures began in the late
1980s. These investigations examined the behavior of strengthening reinforced concrete beams using
glass fiber reinforced polymers (GFRP). Relatively thick GFRP plates (more than ¼ in.) had to be used
to achieve from 40% to 100% increase in strength, if anchorage was provided at the ends of the plates
[Saadatmanesh and Ehsani, 1991]. The predominant failure mode that was observed in these tests was
similar to that observed during tests on beams strengthened using steel plates. The composite material
debonded from the surface of the concrete at failure, and debonding of the plates initiated at the ends due
to the presence of large normal and shear stresses. Therefore, measures were taken to prevent this type of
failure by anchoring the ends of the GFRP plates to the concrete.
One of the earliest research programs that investigated the use of CFRP composites to strengthen
reinforced concrete elements was conducted at the Swiss Federal Institute of Technology [Meier et al.,
1992] in the late 1980s. Bridges that had been strengthened using steel plates were showing signs of
corrosion after only a few years in service and carbon fiber composites were selected as an alternative. A
qualitative comparison of the performance of carbon, glass, and aramid composites is presented in Table
2.1 [Meier and Winistörfer, 1995].
�������������� � �������������������������� ����������������������� ���
����������������� ��������� !�
Type of Fiber used in Composite Criterion
Carbon Fibers Glass Fibers Aramid Fibers
Tensile strength Very good Very good Very good
Compressive strength Very good Inadequate Good
Young’s modulus Very good Good Adequate
Long-term behavior Very good Good Adequate
Fatigue behavior Excellent Good Adequate
Bulk density Good Excellent Adequate
Alkaline resistance Very good Good Inadequate
Price Adequate Adequate Very good
��"�� ���#�������� �����$����%$&����$��&�����
During the early and mid 1990s, a large number of studies were conducted in several parts of the world to
investigate the use of CFRP composites to increase the flexural strength of existing beams. The majority
of the laboratory tests were conducted on small-scale rectangular beams tested under four-point bending.
The main modes of failure for these specimens are identified in Figure 2.1, where the critical crack is
indicated using a thick line:
• Tensile rupture of the CFRP composites (sheets).
• Failure by crushing of the concrete in compression.

7
• Diagonal tension failure at end of CFRP composites (plates).
• Debonding (peeling) of the CFRP composites.
P/2 P/2 P/2 P/2
P/2 P/2 P/2 P/2
a) CFRP Rupture b) Concrete Crushing
c) Failure of Concrete Cover at End
of Plate
d) Progressive Debonding from the
Surface of the Concrete
��'��������(�������������������������$ ���' )�������������*���'���+,�������� ���
A list of the research programs that were included in this investigation and the experimental parameters
are summarized in Table 2.2. These studies were selected to give an overview of the most important
parameters that influence the performance of strengthened beams. The specimen characteristics tested in
these research programs are summarized in Tables 2.3 and 2.4. The predominant modes of failure and
main conclusions are summarized in Table 2.5.
A common observation in these research programs was that failure of the beams was often controlled by
CFRP debonding from the surface of the concrete (Table 2.5). Therefore, several researchers investigated
the use of different techniques to delay or eliminate debonding as a failure mode. Some of the techniques
that were investigated are illustrated in Figure 2.2.
Anchor bolt detailb) Anchorage at ends using
mechanical anchors
a) CFRP sheets wrapped at
ends
c) Steel plates positioned along
CFRP composited) CFRP sheet wrapped along
entire spanBeam section
��'�����������&)��-����������.�,��������+�����&)���� ��/�&)���0��'� ���������+,�������� ���

8
�����������$�����.����,��������1���� �'� �����������#�������� ��
Test
Series Research Group Experimental Parameters
1 Ritchie, Thomas, Lu, and Connelly
(1991)
• Composite type
• Anchorage at end of plate
2 Arduini and Nanni (1997)
• Composite type
• Shear span/depth ratio
• Effect of precracking
• Surface preparation
3 Norris, Saadatmanesh, and Ehsani
(1997)
• Configuration of CFRP system
• Fiber orientation
4 Arduini, DiTommaso, and Nanni
(1997)
• Number of composite plates
• Anchorage at end of plates
5 He, Pilakoutas, and Waldron (1997) • Anchorage technique at ends of plates
6 David, Djelal, and Buyle-Bodin
(1997)
• Composite type
• Thickness and/or number of plies
7 GangaRao and Vijay (1998)
• Number of plies
• Effect of precracking
• Anchorage by wrapping with CFRP sheets
8 Spadea, Bencardino, and Swamy
(1998) • External anchorage for CFRP plates
(to control slip)
9 Garden and Hollaway (1998) • Shear span to depth ratio
• Plate end anchorage
10 Ross, Jerome, Tedesco, and Hughes
(1999)
• Existing reinforcement ratio
• Effect of composite area to steel ratio
11 Grace, Sayed, Soliman, and Saleh
(1999)
• Placement of CFRP system
• Anchorage with vertical sheets
The ends of the composites received particular attention due to the normal stresses that are generated at
the ends of the plates. To anchor the composite ends, the use of steel bolts or composite wraps were
investigated (Figure 2.2a and b). However, these methods were only partially effective in delaying
debonding of the composites. Anchoring the composites to the surface of the concrete at other locations
along the span was required (Figure 2.2c). To develop the maximum strength of the composite in tension,
composites wrapped along the entire beam length were used to anchor the longitudinal laminates
[GangaRao and Vijay, 1998]. However, this technique can be extremely expensive because a large
amount of material is required to strengthen a full-scale structure (Figure 2.2d).
Numerous anchoring techniques have been investigated without achieving uniform results. The locations
where the CFRP composites require anchorage have been determined based on the characteristics of the
particular specimens used in each research program. Additionally, the effectiveness of these anchoring
techniques has not been evaluated in large-scale elements. Therefore, a uniform criterion is required for
the design of the strengthening schemes using composites for its application to actual bridges.

9
�������������� ���������� ������������� ������������������ ��
Strengthening Method Group
No. No. of Beams
Control CFRP GFRP AFRP Steel
1 16 2 2 9 1 2
2 18 2 16 - - -
3 13 1 12 - - -
4 6 2 4 - - -
5 10 5 3 - - 2
6 10 1 4 5 - -
7 24 4 17 - - 3
8 4 1 3 - - -
9 18 2 16 - - -
10 24 6 18 - - -
11 14 1 6 7 - -
CFRP – Carbon FRP composite.
GFRP – Glass FRP composite.
AFRP – Aramid FRP composite.
Steel – Steel plates bonded to bottom.

10
�
�
����������������� ������������ ��������������� ��� ��������� ���� ������������������ ��
Section Properties Span Geometry Research
No. b, in.
(mm)
h, in.
(mm)
d, in.
(mm)
d', in.
(mm)
As, in.2
(mm2)
A's, in.2
(mm2)
L, in.
(mm)
a, in.
(mm)
x, in.
(mm)
1 6
(152)
12
(305) - -
0.4
(258) -
96
(2,440)
36
(915)
24
(610)
2a*
12.5
(320)
6.3
(160)
4.3
(110)
2
(50)
0.4
(258)
0.4
(258)
43.3
(1,100)
16.5
(420)
10.2
(260)
2b*
6.3
(160)
12.6
(320)
10.6
(270)
2
(50)
0.62
(400)
0.62
(400)
82.7
(2,100)
37.4
(950)
7.9
(200)
3 5
(127)
8
(203) - -
0.22
(142)
0.22
(142)
90
(2,286)
22.5
(572)
45
(1,145)
4 8
(200)
8
(200)
6.4
(163)
1.5
(37)
0.48
(308)
0.48
(308)
78.7
(2,000)
27.6
(700)
23.6
(600)
5 6
(150)
10
(250)
8.5
(215)
1.4
(35)
0.97
(628)
0.1
(56)
90
(2,300)
30
(767)
30
(766)
6 6
(150)
12
(300) - -
0.48
(308) -
110
(2,800)
35
(900)
40
(1,000)
7 6
(150)
12
(300)
10.6
(270)
1.2
(30)
0.88
(568)
0.22
(142)
107
(2,730)
35.8
(910)
35.8
(910)
Span Geometry
Note: Values not indicated in table were not reported in the literature. * Beams from same investigation with different cross section and span.
11
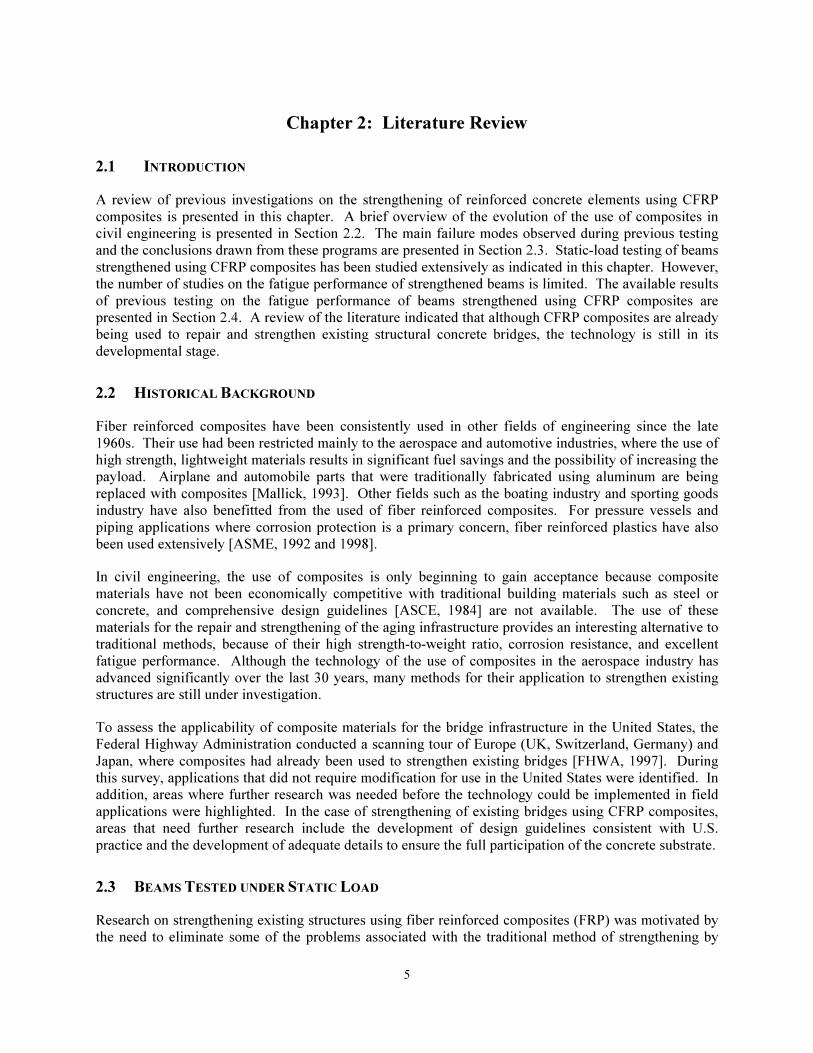
����������!"��������#�������� ������������ ��������������� ��� ��������� ���� ������������������ ��
Section Properties Span Geometry Research
No. b, in.
(mm)
h, in.
(mm)
d, in.
(mm)
d', in.
(mm)
As, in.2
(mm2)
A's, in.2
(mm2)
L, in.
(mm)
a, in.
(mm)
x, in.
(mm)
8 5.5
(140)
12
(300)
10.8
(275)
1
(25)
0.62
(400)
0.62
(400)
189
(4,800)
71
(1,800)
47
(1,200)
9a 4
(100)
4
(100)
3.3
(84)
3.3
(16)
0.13
(85)
0.09
(57)
40
(1,000) Variable
32
(400)
9b+
4
(100)
4
(100)
3.3
(84)
0.6
(16)
0.13
(85)
0.09
(57)
40
(1,000) Variable -
10 8
(200)
8
(200)
6
(152)
2
(48) Variable
0.22
(142)
108
(2,742)
36
(914)
36
(914)
11++
6
(152)
11.5
(292) - -
0.62
(400)
0.62
(400)
108
(2,742)
54
(1,371) 0
+ Cantilever beam.
++ Beams tested with single concentrated load at midspan.
a x a
Beam Geometry
L
P/2P/2
d
b
h
d’As’
As
Cross Section
bp

12
�������������� ���������������������������������������������� ��������������������
Test
Series Observed Modes of Failure Main Conclusions
1 • Debonding after yielding of
reinforcing steel
• Stress concentration at end of plates
needs more study
• Selection of bonding agent is critical
2 • Debonding at adhesive-concrete
interface
• Shear-peeling at ends of plates
• Improve concrete-FRP adhesion
• Wrapping entire length effective as
anchorage
3 • Debonding of FRP composite • Fiber orientation has large effect on
maximum strength
• Pre-cracking has negligible effect
4 • Concrete crushing
• FRP composite debonding
• Shear at ends of plates
• Brittle failure modes need to be
considered in design
• Need to improve knowledge on adhesion
performance
5 • Peeling-off at end of plates
• Shear/peeling-off
• Peeling-off related to thickness and
stiffness of plates
• Unless anchored, plates peel off
6 • Peeling-off along concrete cover • Use anchoring system to avoid brittle
mode of failure
7 • Debonding
• Crushing (fully wrapped beams)
• Debonding along concrete cover
• Full wrap required to achieve maximum
strength without debonding
8 • Debonding if not anchored
• Gradual slip if anchored
• Anchorage required for adequate
performance
9 • Shear/Peeling along concrete cover
• Debonding
• Failure mode depends on shear
span/depth ratio
• Anchorage required at ends especially
for low a/d ratios
10 • Concrete crushing (high ρ)
• FRP debonding (low ρ)
• Unable to develop full FRP strength
without anchorage
11
• FRP rupture if transverse sheets
are used along entire length
• Debonding when plates are placed
on bottom of beams
• Wrapping along full length of CFRP
increases maximum load
• Bonding plates on bottom and sides
improves performance
������ ������������������������ ����� !��������
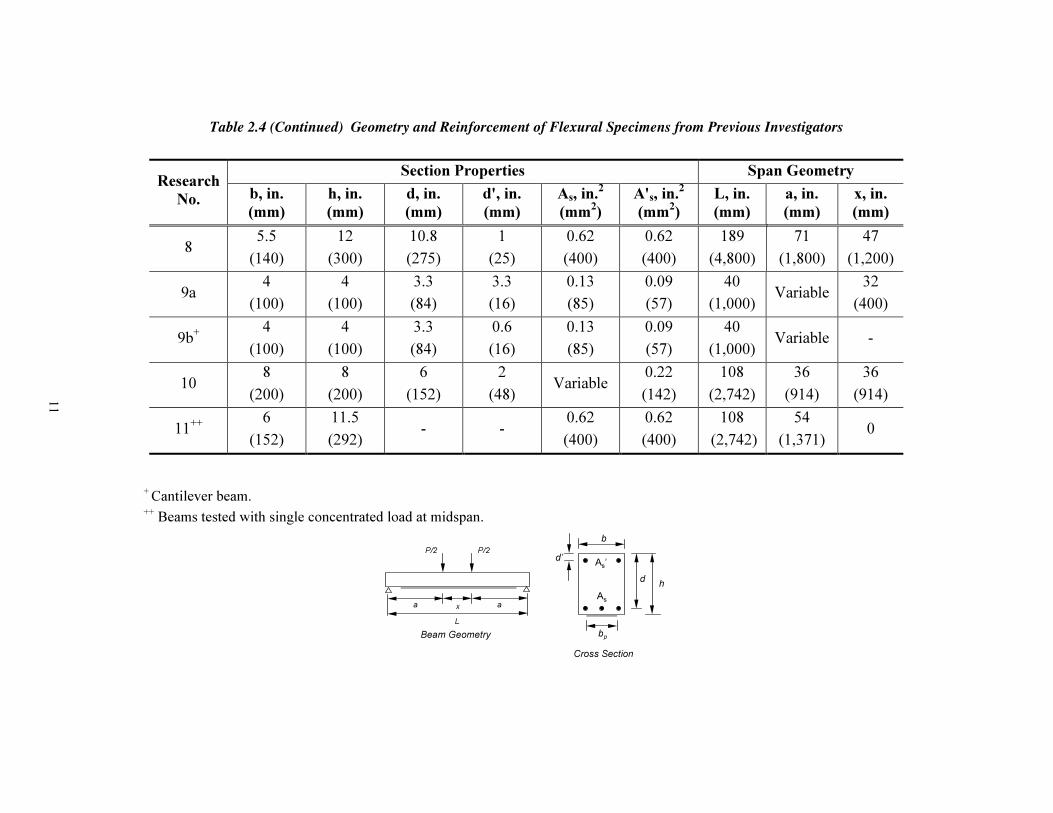
Very few tests have been conducted on large-scale strengthened specimens that do not have a rectangular
cross section. A testing program was conducted on strengthened half-scale beams by the Florida DOT
[Shahawy and Beitelman, 1996]. A total of eight tee-beams representative of a type of bridge
13
construction in Florida were tested, both under static and fatigue loads. They were strengthened using
three different types of CFRP laminates wrapping the entire length of the specimens (Figure 2.3). The
results reported indicate that strengthening existing elements using CFRP composites is a viable option.
However, it is evident that the configuration that was used would demand a significant amount of
material.
5790 mm
a) Beam elevation
594 mm
445 m
m
b) Cross section
������������ ������"�������������#�����$�������%�����!������ "������& "�"�'(�����#��������)�*++,-�
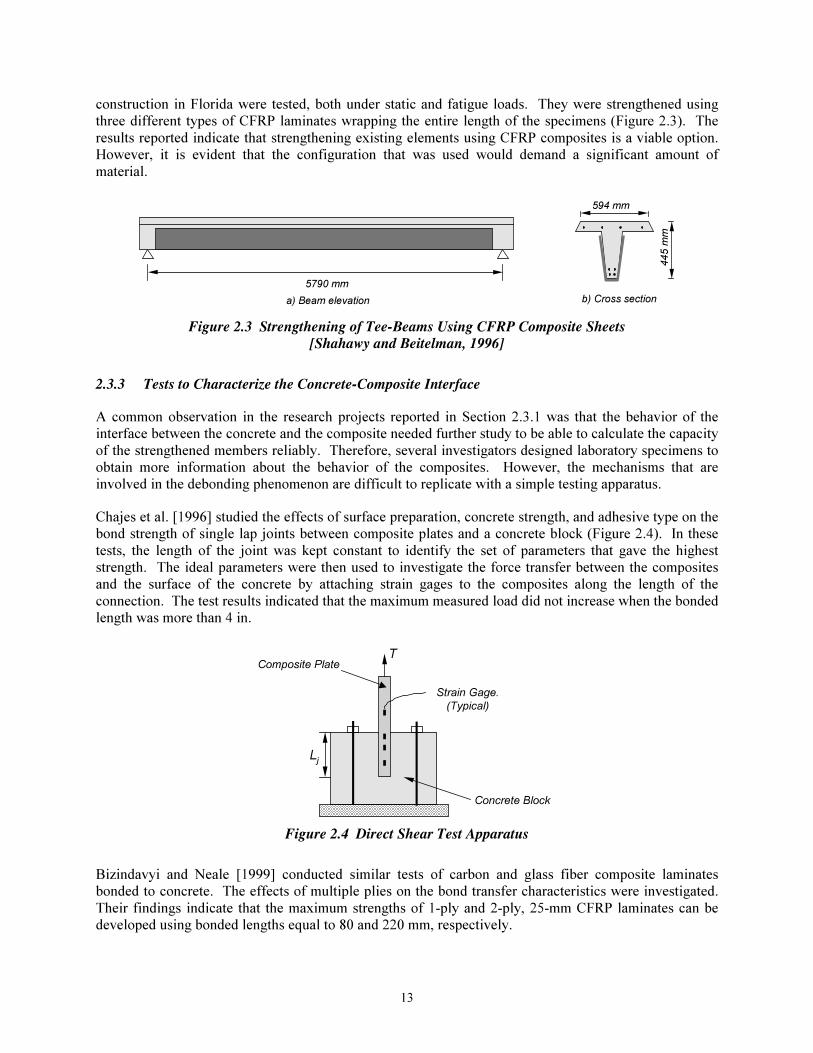
������ ����������"��������.���"��������������!������/���������
A common observation in the research projects reported in Section 2.3.1 was that the behavior of the
interface between the concrete and the composite needed further study to be able to calculate the capacity
of the strengthened members reliably. Therefore, several investigators designed laboratory specimens to
obtain more information about the behavior of the composites. However, the mechanisms that are
involved in the debonding phenomenon are difficult to replicate with a simple testing apparatus.
Chajes et al. [1996] studied the effects of surface preparation, concrete strength, and adhesive type on the
bond strength of single lap joints between composite plates and a concrete block (Figure 2.4). In these
tests, the length of the joint was kept constant to identify the set of parameters that gave the highest
strength. The ideal parameters were then used to investigate the force transfer between the composites
and the surface of the concrete by attaching strain gages to the composites along the length of the
connection. The test results indicated that the maximum measured load did not increase when the bonded
length was more than 4 in.
T
Strain Gage.
(Typical)
Concrete Block
Composite Plate
Lj
���������0��1������ "���������2!!�������
Bizindavyi and Neale [1999] conducted similar tests of carbon and glass fiber composite laminates
bonded to concrete. The effects of multiple plies on the bond transfer characteristics were investigated.
Their findings indicate that the maximum strengths of 1-ply and 2-ply, 25-mm CFRP laminates can be
developed using bonded lengths equal to 80 and 220 mm, respectively.
14
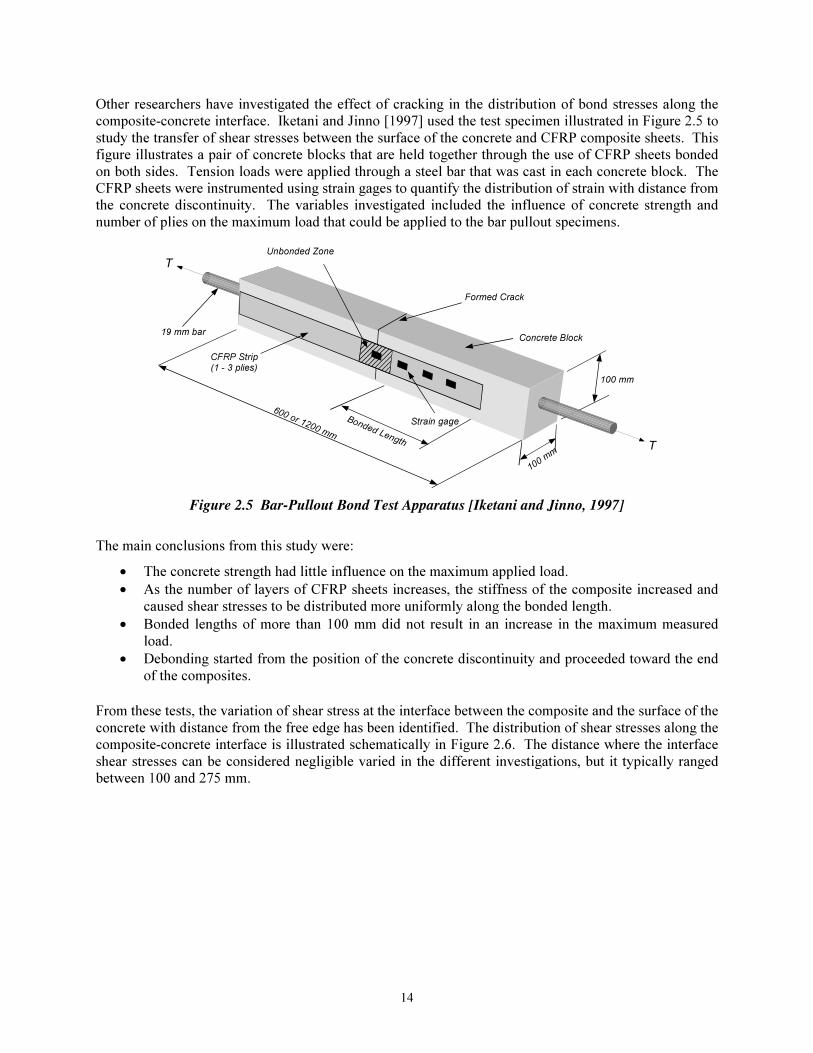
Other researchers have investigated the effect of cracking in the distribution of bond stresses along the
composite-concrete interface. Iketani and Jinno [1997] used the test specimen illustrated in Figure 2.5 to
study the transfer of shear stresses between the surface of the concrete and CFRP composite sheets. This
figure illustrates a pair of concrete blocks that are held together through the use of CFRP sheets bonded
on both sides. Tension loads were applied through a steel bar that was cast in each concrete block. The
CFRP sheets were instrumented using strain gages to quantify the distribution of strain with distance from
the concrete discontinuity. The variables investigated included the influence of concrete strength and
number of plies on the maximum load that could be applied to the bar pullout specimens.
T
T
Formed Crack
Concrete Block
Strain gage
CFRP Strip(1 - 3 plies)
19 mm bar
100 mm
100 mm
600 or 1200 mm
Bonded Length
Unbonded Zone
�����������#�����������#���������2!!�������&/3����������4����)�*++5-�
The main conclusions from this study were:
• The concrete strength had little influence on the maximum applied load.
• As the number of layers of CFRP sheets increases, the stiffness of the composite increased and
caused shear stresses to be distributed more uniformly along the bonded length.
• Bonded lengths of more than 100 mm did not result in an increase in the maximum measured
load.
• Debonding started from the position of the concrete discontinuity and proceeded toward the end
of the composites.
From these tests, the variation of shear stress at the interface between the composite and the surface of the
concrete with distance from the free edge has been identified. The distribution of shear stresses along the
composite-concrete interface is illustrated schematically in Figure 2.6. The distance where the interface
shear stresses can be considered negligible varied in the different investigations, but it typically ranged
between 100 and 275 mm.
15
τmax
T
CFRP
Concrete
a) Shear stress distribution
in uncracked concrete
Ld
T
CFRP
Concrete
b) Shear stress distribution
in cracked concrete
τmax
Ld
���������,��6������������/��������� "���� ������'��"�1���������&#�����������6��7�����)�*++5-�
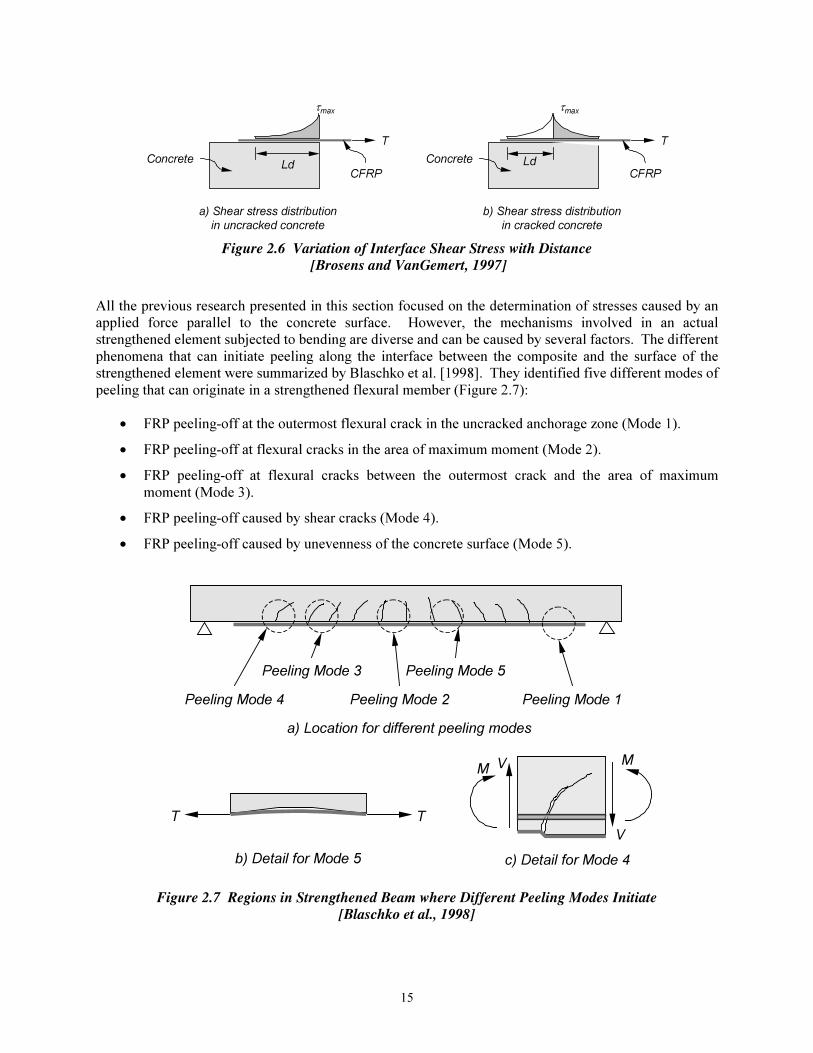
All the previous research presented in this section focused on the determination of stresses caused by an
applied force parallel to the concrete surface. However, the mechanisms involved in an actual
strengthened element subjected to bending are diverse and can be caused by several factors. The different
phenomena that can initiate peeling along the interface between the composite and the surface of the
strengthened element were summarized by Blaschko et al. [1998]. They identified five different modes of
peeling that can originate in a strengthened flexural member (Figure 2.7):
• FRP peeling-off at the outermost flexural crack in the uncracked anchorage zone (Mode 1).
• FRP peeling-off at flexural cracks in the area of maximum moment (Mode 2).
• FRP peeling-off at flexural cracks between the outermost crack and the area of maximum
moment (Mode 3).
• FRP peeling-off caused by shear cracks (Mode 4).
• FRP peeling-off caused by unevenness of the concrete surface (Mode 5).
T T
b) Detail for Mode 5
Peeling Mode 1
Peeling Mode 3
Peeling Mode 2
Peeling Mode 5
Peeling Mode 4
a) Location for different peeling modes
c) Detail for Mode 4
V
V MM
���������5��%���������� ������"�����#����'"����1�����������������������/��������&#����"3��������)�*++8-�
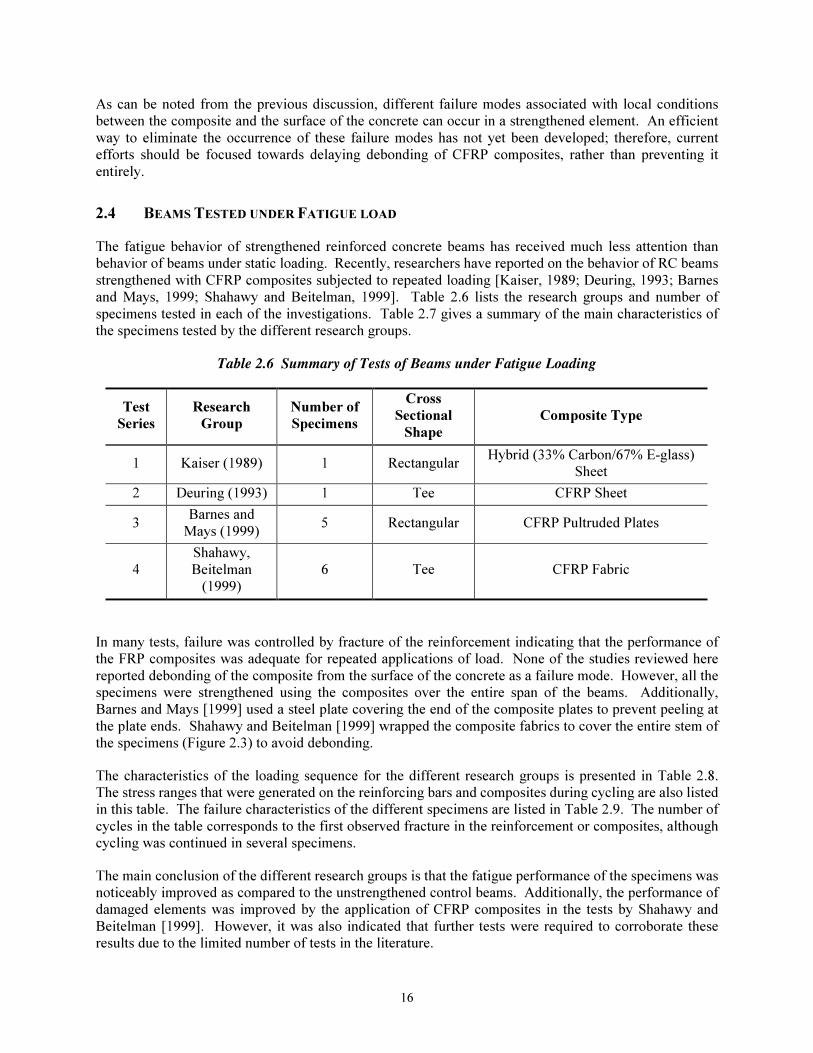
16
As can be noted from the previous discussion, different failure modes associated with local conditions
between the composite and the surface of the concrete can occur in a strengthened element. An efficient
way to eliminate the occurrence of these failure modes has not yet been developed; therefore, current
efforts should be focused towards delaying debonding of CFRP composites, rather than preventing it
entirely.
2.4 BEAMS TESTED UNDER FATIGUE LOAD
The fatigue behavior of strengthened reinforced concrete beams has received much less attention than
behavior of beams under static loading. Recently, researchers have reported on the behavior of RC beams
strengthened with CFRP composites subjected to repeated loading [Kaiser, 1989; Deuring, 1993; Barnes
and Mays, 1999; Shahawy and Beitelman, 1999]. Table 2.6 lists the research groups and number of
specimens tested in each of the investigations. Table 2.7 gives a summary of the main characteristics of
the specimens tested by the different research groups.
��������,�� �����(�������������#����������������������������
Test
Series
Research
Group
Number of
Specimens
Cross
Sectional
Shape
Composite Type
1 Kaiser (1989) 1 Rectangular Hybrid (33% Carbon/67% E-glass)
Sheet
2 Deuring (1993) 1 Tee CFRP Sheet
3 Barnes and
Mays (1999) 5 Rectangular CFRP Pultruded Plates
4
Shahawy,
Beitelman
(1999)
6 Tee CFRP Fabric
In many tests, failure was controlled by fracture of the reinforcement indicating that the performance of
the FRP composites was adequate for repeated applications of load. None of the studies reviewed here
reported debonding of the composite from the surface of the concrete as a failure mode. However, all the
specimens were strengthened using the composites over the entire span of the beams. Additionally,
Barnes and Mays [1999] used a steel plate covering the end of the composite plates to prevent peeling at
the plate ends. Shahawy and Beitelman [1999] wrapped the composite fabrics to cover the entire stem of
the specimens (Figure 2.3) to avoid debonding.
The characteristics of the loading sequence for the different research groups is presented in Table 2.8.
The stress ranges that were generated on the reinforcing bars and composites during cycling are also listed
in this table. The failure characteristics of the different specimens are listed in Table 2.9. The number of
cycles in the table corresponds to the first observed fracture in the reinforcement or composites, although
cycling was continued in several specimens.
The main conclusion of the different research groups is that the fatigue performance of the specimens was
noticeably improved as compared to the unstrengthened control beams. Additionally, the performance of
damaged elements was improved by the application of CFRP composites in the tests by Shahawy and
Beitelman [1999]. However, it was also indicated that further tests were required to corroborate these
results due to the limited number of tests in the literature.
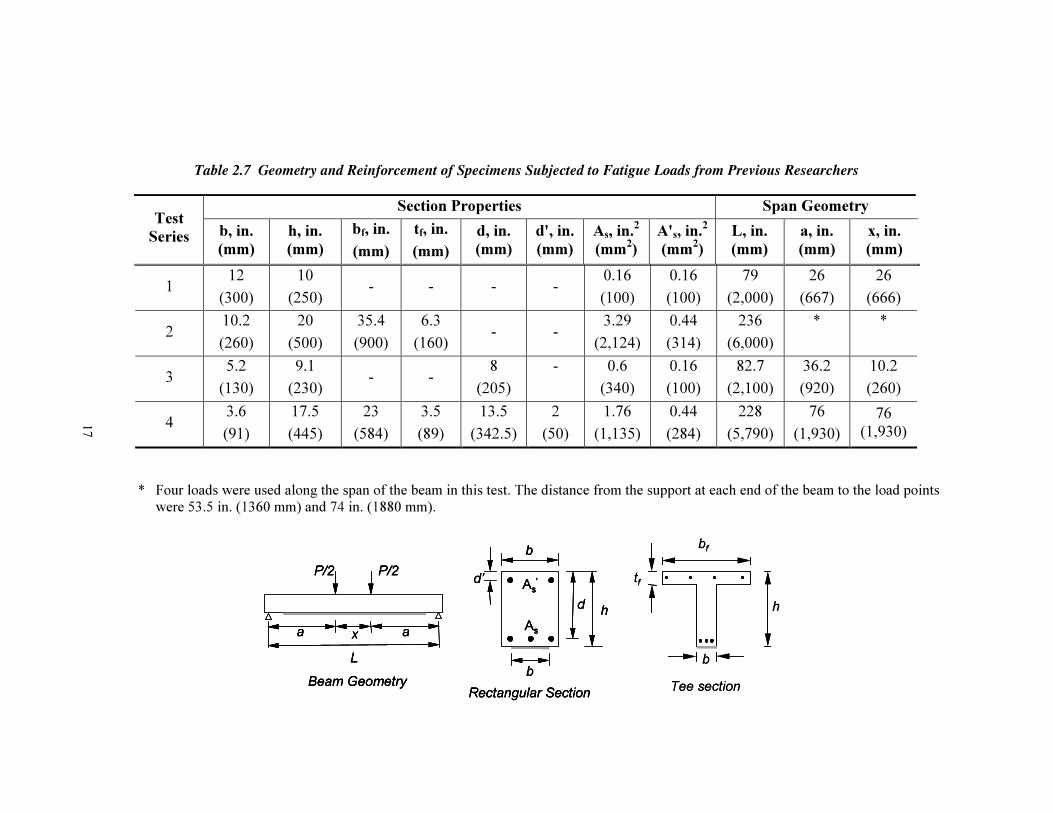
17
�
�
�������������� ������������������� �������������������� ��� ���� �������������������������������� ����
Section Properties Span Geometry Test
Series b, in.
(mm)
h, in.
(mm)
bf, in.
(mm)
tf, in.
(mm)
d, in.
(mm)
d', in.
(mm)
As, in.2
(mm2)
A's, in.2
(mm2)
L, in.
(mm)
a, in.
(mm)
x, in.
(mm)
1 12
(300)
10
(250) - - - -
0.16
(100)
0.16
(100)
79
(2,000)
26
(667)
26
(666)
2 10.2
(260)
20
(500)
35.4
(900)
6.3
(160) - -
3.29
(2,124)
0.44
(314)
236
(6,000)
*
*
3 5.2
(130)
9.1
(230) - -
8
(205)
-
0.6
(340)
0.16
(100)
82.7
(2,100)
36.2
(920)
10.2
(260)
4 3.6
(91)
17.5
(445)
23
(584)
3.5
(89)
13.5
(342.5)
2
(50)
1.76
(1,135)
0.44
(284)
228
(5,790)
76
(1,930)
76
(1,930)
* Four loads were used along the span of the beam in this test. The distance from the support at each end of the beam to the load points
were 53.5 in. (1360 mm) and 74 in. (1880 mm).
bf
h
Tee section
b
tf
a x a
Beam Geometry
L
P/2P/2
d
b
h
d’A
s'
As
Rectangular Section
b
bf
h
Tee section
b
tf
a x a
Beam Geometry
L
P/2P/2
d
b
h
d’A
s'
As
Rectangular Section
b
a x a
Beam Geometry
L
P/2P/2
d
b
h
d’A
s'
As
Rectangular Section
b
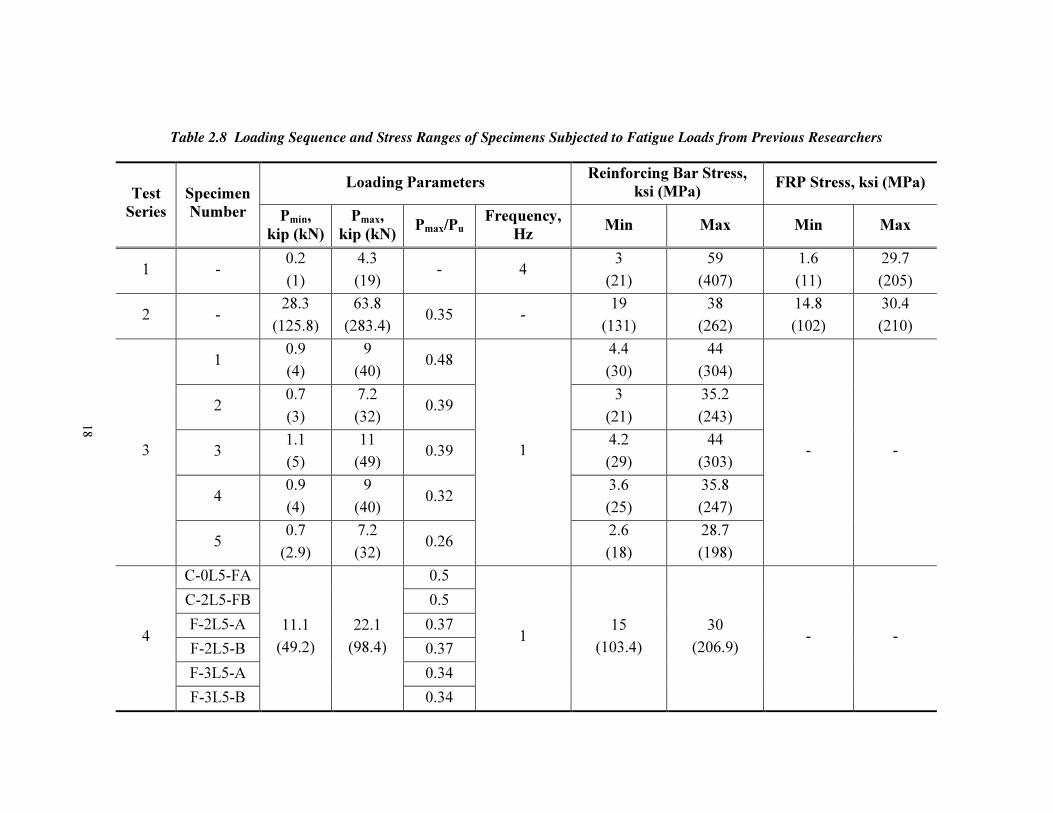
18
�
��������!������������"����������� ������������������������������� ��� ���� �������������������������������� ����
Loading Parameters Reinforcing Bar Stress,
ksi (MPa) FRP Stress, ksi (MPa)
Test
Series
Specimen
Number Pmin,
kip (kN)
Pmax,
kip (kN)Pmax/Pu
Frequency,
Hz Min Max Min Max
1 - 0.2
(1)
4.3
(19) - 4
3
(21)
59
(407)
1.6
(11)
29.7
(205)
2 - 28.3
(125.8)
63.8
(283.4) 0.35 -
19
(131)
38
(262)
14.8
(102)
30.4
(210)
1 0.9
(4)
9
(40) 0.48
4.4
(30)
44
(304)
2 0.7
(3)
7.2
(32) 0.39
3
(21)
35.2
(243)
3 1.1
(5)
11
(49) 0.39
4.2
(29)
44
(303)
4 0.9
(4)
9
(40) 0.32
3.6
(25)
35.8
(247)
3
5 0.7
(2.9)
7.2
(32) 0.26
1
2.6
(18)
28.7
(198)
- -
C-0L5-FA 0.5
C-2L5-FB 0.5
F-2L5-A 0.37
F-2L5-B 0.37
F-3L5-A 0.34
4
F-3L5-B
11.1
(49.2)
22.1
(98.4)
0.34
1 15
(103.4)
30
(206.9) - -
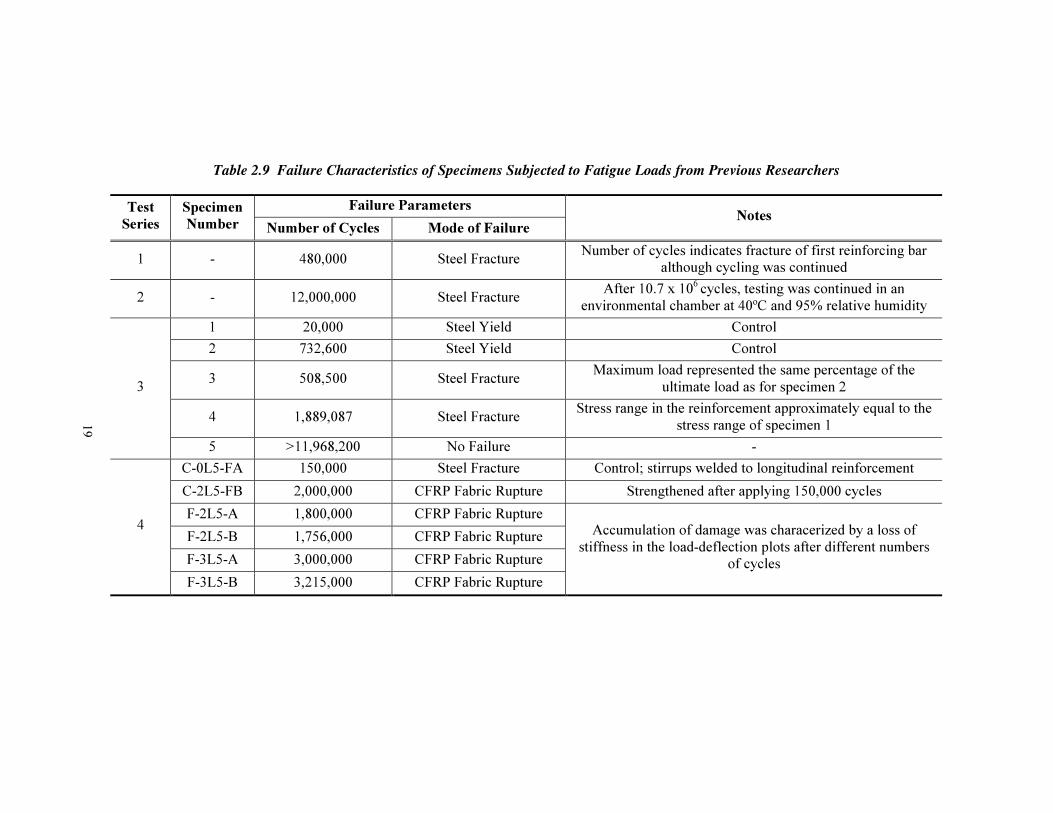
19
�
�
��������#����������$ ���� ���� ����������������������� ��� ���� �������������������������������� ����
Failure Parameters Test
Series
Specimen
Number Number of Cycles Mode of Failure Notes
1 - 480,000 Steel Fracture Number of cycles indicates fracture of first reinforcing bar
although cycling was continued
2 - 12,000,000 Steel Fracture After 10.7 x 10
6 cycles, testing was continued in an
environmental chamber at 40ºC and 95% relative humidity
1 20,000 Steel Yield Control
2 732,600 Steel Yield Control
3 508,500 Steel Fracture Maximum load represented the same percentage of the
ultimate load as for specimen 2
4 1,889,087 Steel Fracture Stress range in the reinforcement approximately equal to the
stress range of specimen 1
3
5 >11,968,200 No Failure -
C-0L5-FA 150,000 Steel Fracture Control; stirrups welded to longitudinal reinforcement
C-2L5-FB 2,000,000 CFRP Fabric Rupture Strengthened after applying 150,000 cycles
F-2L5-A 1,800,000 CFRP Fabric Rupture
F-2L5-B 1,756,000 CFRP Fabric Rupture
F-3L5-A 3,000,000 CFRP Fabric Rupture
4
F-3L5-B 3,215,000 CFRP Fabric Rupture
Accumulation of damage was characerized by a loss of
stiffness in the load-deflection plots after different numbers
of cycles
20
2.5 SUMMARY
The conclusions from previous investigations on the behavior of strengthened reinforced concrete
elements using CFRP composites were presented in this chapter. From this review, it is evident that,
although the benefits that can be obtained from strengthening flexural members are well identified, there
are still areas where further research is required. In particular, most of the previous research was
conducted on small-scale specimens where local effects can have a large impact on the global response.
The need to understand the bond behavior between the composite and the surface of the concrete was a
consistent conclusion from previous investigations. A summary of previous efforts in this area was also
presented. It was found that this phenomenon is highly dependent on local surface and damage
conditions and is consequently very difficult to quantify.
Given the limited amount of information available from previous research in the area of strengthening
existing members with composites, testing full-scale specimens representative of actual bridges was
considered a priority for this research project. Instead of approaching the debonding problem at the local
concrete-composite interface level, the approach that was taken in this project was to delay total failure of
the strengthened element by using techniques that would control debonding of the composite in an
economic manner. For this purpose, a large number of specimens incorporating different strengthening
techniques and composite materials were tested in this research project. The results of these tests are
presented in the following chapters of this report. Results from the large-scale tests are included in a
companion report.
Under fatigue loading, reinforced concrete beams strengthened using CFRP laminates exhibit better
performance than reinforced concrete beams. However, fatigue failure of strengthened beams appears to
be controlled by fracture of the reinforcing bars in fatigue. Further tests are needed to corroborate the
available results and to evaluate the importance of other variables, such as the configuration of the
composites.
21
Chapter 3: Analytical Model to Calculate the Flexural Response of
Reinforced Concrete Elements Strengthened Using CFRP Composites
3.1 INTRODUCTION
This chapter describes an analytical procedure that was developed to calculate the moment-curvature and
load-deflection response of reinforced concrete members strengthened using CFRP composites. The
procedure uses the nonlinear material properties of concrete, steel, and CFRP composites to calculate the
internal forces corresponding to equilibrium for a strengthened section. Moment and curvature are then
calculated from the internal forces, and deflections along the span are calculated from the moment-
curvature relationship.
Procedures used to calculate the moment-curvature response of a strengthened section are described in
Section 3.2, and procedures used to calculate deflections are described in Section 3.3. The model is
verified in Section 3.4 using published data for reinforced concrete elements strengthened with CFRP
composites.
3.2 MOMENT-CURVATURE ANALYSIS OF STRENGTHENED SECTIONS
The analytical procedure described in this chapter is based on a sectional model. Moment-curvature
relationships for reinforced concrete sections strengthened with carbon fiber reinforced composites were
calculated using nonlinear material properties. Basic assumptions are presented in Section 3.2.1 and the
idealized stress-strain curves for the materials are presented in Section 3.2.2.
3.2.1 Assumptions Used in the Sectional Analysis Model
Similarly to most analytical methods used to calculate the flexural response of reinforced concrete
elements, the cross section was divided into horizontal slices. The total response of the cross section is
obtained by adding the contribution of each slice. Separate slices were used for the different materials;
therefore, the idealized behavior of each slice is controlled by the stress-strain relationship for a given
material. However, multiple slices may be located at the same position along the depth of the cross
section.
The following assumptions, which are consistent with current design practice of reinforced concrete
sections, were used in the model:
• Strains increase proportionally with distance from the neutral axis.
• No slip occurs between the steel reinforcement and concrete surrounding it.
• Perfect bond exists between the carbon fiber reinforced composite material and concrete surface.
• Failure is reached when the extreme fiber in compression reaches the maximum usable strain in
the concrete (εcu).
The third assumption was later refined because the CFRP material was observed to slip relative to the
concrete surface during the experimental phase of this project. Modifications to the analytical model to
include debonding of the CFRP and concrete are discussed in the research report for phase 3 of this
project.
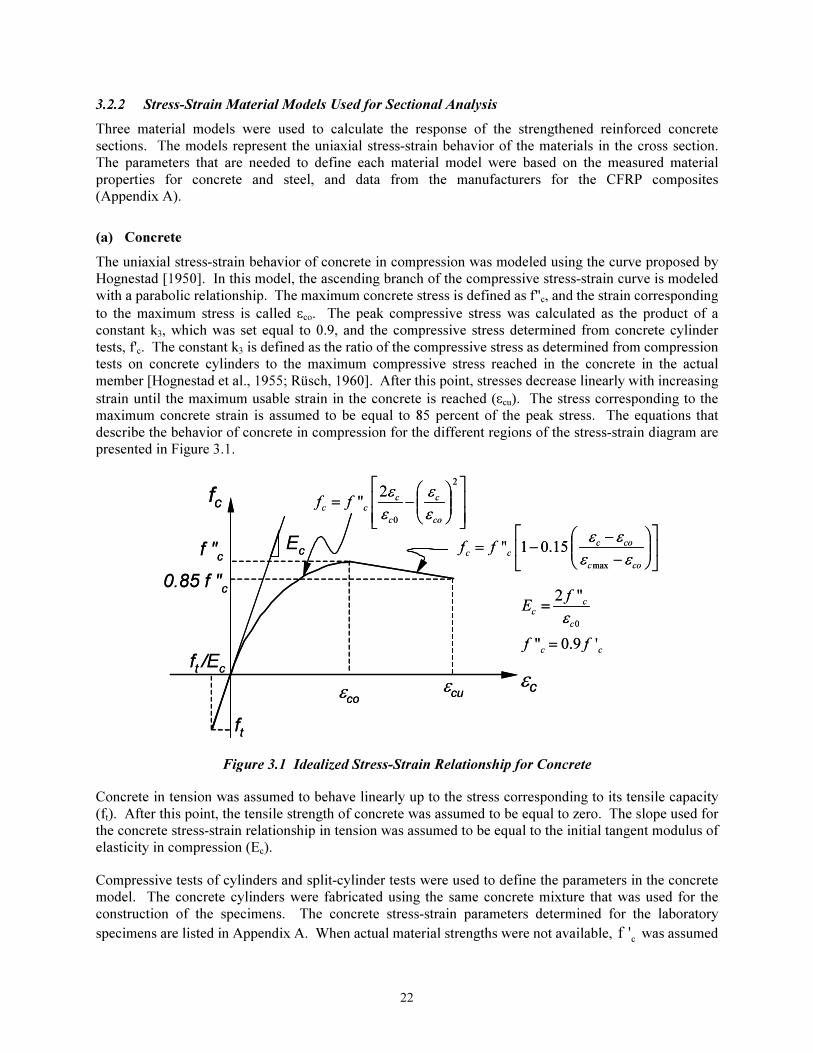
22
3.2.2 Stress-Strain Material Models Used for Sectional Analysis
Three material models were used to calculate the response of the strengthened reinforced concrete
sections. The models represent the uniaxial stress-strain behavior of the materials in the cross section.
The parameters that are needed to define each material model were based on the measured material
properties for concrete and steel, and data from the manufacturers for the CFRP composites
(Appendix A).
(a) Concrete
The uniaxial stress-strain behavior of concrete in compression was modeled using the curve proposed by
Hognestad [1950]. In this model, the ascending branch of the compressive stress-strain curve is modeled
with a parabolic relationship. The maximum concrete stress is defined as f"c, and the strain corresponding
to the maximum stress is called εco. The peak compressive stress was calculated as the product of a
constant k3, which was set equal to 0.9, and the compressive stress determined from concrete cylinder
tests, f'c. The constant k3 is defined as the ratio of the compressive stress as determined from compression
tests on concrete cylinders to the maximum compressive stress reached in the concrete in the actual
member [Hognestad et al., 1955; Rüsch, 1960]. After this point, stresses decrease linearly with increasing
strain until the maximum usable strain in the concrete is reached (εcu). The stress corresponding to the
maximum concrete strain is assumed to be equal to 85 percent of the peak stress. The equations that
describe the behavior of concrete in compression for the different regions of the stress-strain diagram are
presented in Figure 3.1.
f "c
εco
εcε
cu
0.85 f "c
ft
ft /E
c
Ec
fc
−
−−=
coc
coc
ccff
εε
εε
max
15.01"
0
" 2
c
c
c
fE
ε
=
−=
2
0
2"
co
c
c
c
ccff
ε
ε
ε
ε
ccff ' 9.0" =
f "c
εco
εcε
cu
0.85 f "c
ft
ft /E
c
Ec
fc
−
−−=
coc
coc
ccff
εε
εε
max
15.01"
0
" 2
c
c
c
fE
ε
=
−=
2
0
2"
co
c
c
c
ccff
ε
ε
ε
ε
ccff ' 9.0" =
Figure 3.1 Idealized Stress-Strain Relationship for Concrete
Concrete in tension was assumed to behave linearly up to the stress corresponding to its tensile capacity
(ft). After this point, the tensile strength of concrete was assumed to be equal to zero. The slope used for
the concrete stress-strain relationship in tension was assumed to be equal to the initial tangent modulus of
elasticity in compression (Ec).
Compressive tests of cylinders and split-cylinder tests were used to define the parameters in the concrete
model. The concrete cylinders were fabricated using the same concrete mixture that was used for the
construction of the specimens. The concrete stress-strain parameters determined for the laboratory
specimens are listed in Appendix A. When actual material strengths were not available, c' f was assumed
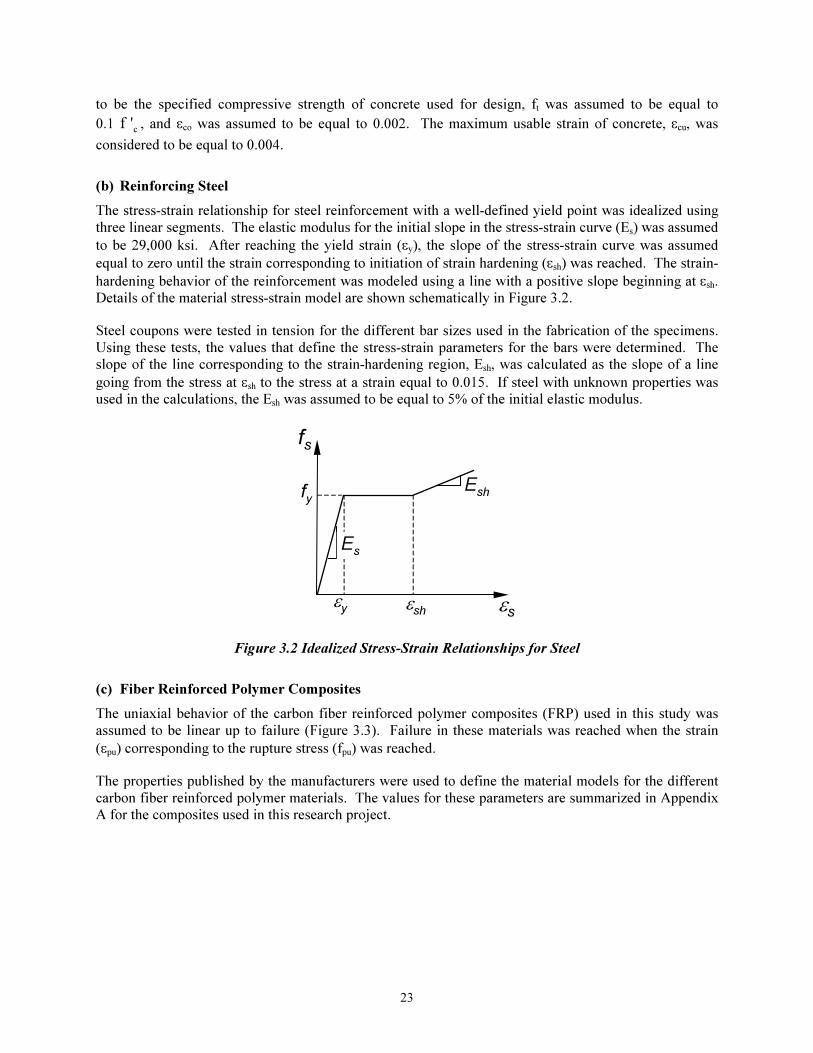
23
to be the specified compressive strength of concrete used for design, ft was assumed to be equal to
0.1 c' f , and εco was assumed to be equal to 0.002. The maximum usable strain of concrete, εcu, was
considered to be equal to 0.004.
(b) Reinforcing Steel
The stress-strain relationship for steel reinforcement with a well-defined yield point was idealized using
three linear segments. The elastic modulus for the initial slope in the stress-strain curve (Es) was assumed
to be 29,000 ksi. After reaching the yield strain (εy), the slope of the stress-strain curve was assumed
equal to zero until the strain corresponding to initiation of strain hardening (εsh) was reached. The strain-
hardening behavior of the reinforcement was modeled using a line with a positive slope beginning at εsh.
Details of the material stress-strain model are shown schematically in Figure 3.2.
Steel coupons were tested in tension for the different bar sizes used in the fabrication of the specimens.
Using these tests, the values that define the stress-strain parameters for the bars were determined. The
slope of the line corresponding to the strain-hardening region, Esh, was calculated as the slope of a line
going from the stress at εsh to the stress at a strain equal to 0.015. If steel with unknown properties was
used in the calculations, the Esh was assumed to be equal to 5% of the initial elastic modulus.
fy
εy εsh
Es
Esh
εs
fs
Figure 3.2 Idealized Stress-Strain Relationships for Steel
(c) Fiber Reinforced Polymer Composites
The uniaxial behavior of the carbon fiber reinforced polymer composites (FRP) used in this study was
assumed to be linear up to failure (Figure 3.3). Failure in these materials was reached when the strain
(εpu) corresponding to the rupture stress (fpu) was reached.
The properties published by the manufacturers were used to define the material models for the different
carbon fiber reinforced polymer materials. The values for these parameters are summarized in Appendix
A for the composites used in this research project.
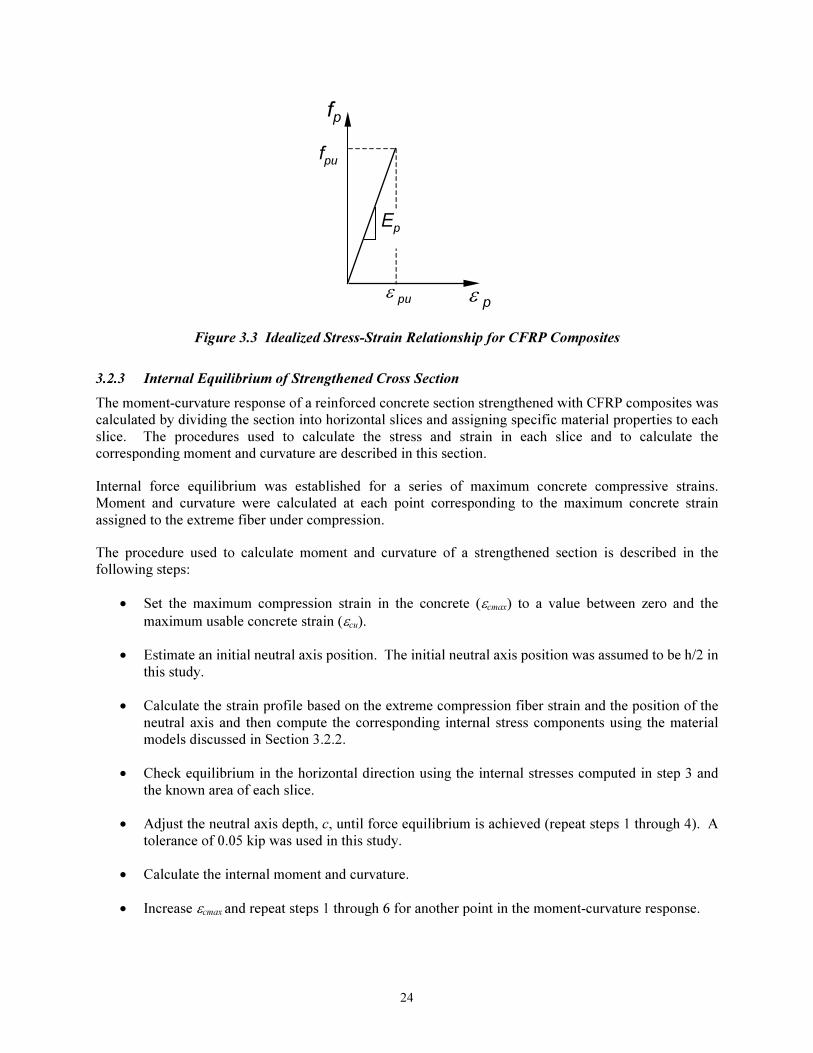
24
ε pu
fpu
Ep
fp
ε p
Figure 3.3 Idealized Stress-Strain Relationship for CFRP Composites
3.2.3 Internal Equilibrium of Strengthened Cross Section
The moment-curvature response of a reinforced concrete section strengthened with CFRP composites was
calculated by dividing the section into horizontal slices and assigning specific material properties to each
slice. The procedures used to calculate the stress and strain in each slice and to calculate the
corresponding moment and curvature are described in this section.
Internal force equilibrium was established for a series of maximum concrete compressive strains.
Moment and curvature were calculated at each point corresponding to the maximum concrete strain
assigned to the extreme fiber under compression.
The procedure used to calculate moment and curvature of a strengthened section is described in the
following steps:
• Set the maximum compression strain in the concrete (εcmax) to a value between zero and the
maximum usable concrete strain (εcu).
• Estimate an initial neutral axis position. The initial neutral axis position was assumed to be h/2 in
this study.
• Calculate the strain profile based on the extreme compression fiber strain and the position of the
neutral axis and then compute the corresponding internal stress components using the material
models discussed in Section 3.2.2.
• Check equilibrium in the horizontal direction using the internal stresses computed in step 3 and
the known area of each slice.
• Adjust the neutral axis depth, c, until force equilibrium is achieved (repeat steps 1 through 4). A
tolerance of 0.05 kip was used in this study.
• Calculate the internal moment and curvature.
• Increase εcmax and repeat steps 1 through 6 for another point in the moment-curvature response.
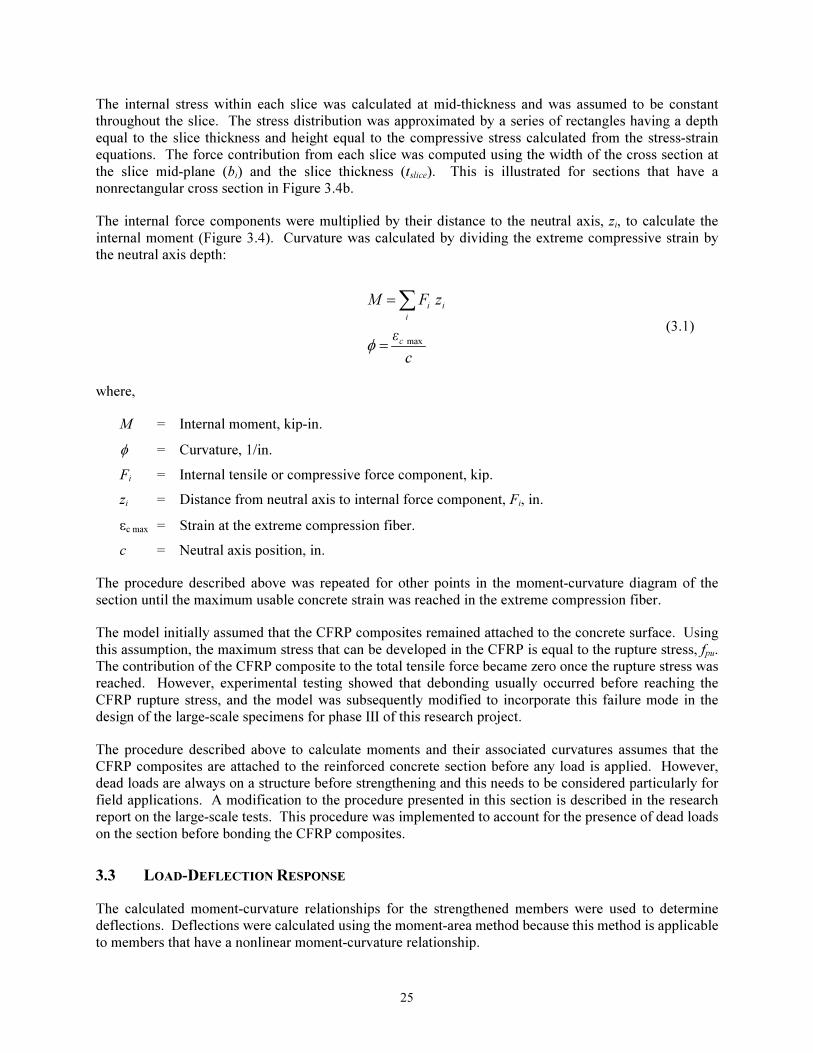
25
The internal stress within each slice was calculated at mid-thickness and was assumed to be constant
throughout the slice. The stress distribution was approximated by a series of rectangles having a depth
equal to the slice thickness and height equal to the compressive stress calculated from the stress-strain
equations. The force contribution from each slice was computed using the width of the cross section at
the slice mid-plane (bi) and the slice thickness (tslice). This is illustrated for sections that have a
nonrectangular cross section in Figure 3.4b.
The internal force components were multiplied by their distance to the neutral axis, zi, to calculate the
internal moment (Figure 3.4). Curvature was calculated by dividing the extreme compressive strain by
the neutral axis depth:
c
ε
zFM
c
i
ii
max
=
=∑
φ
(3.1)
where,
M = Internal moment, kip-in.
φ = Curvature, 1/in.
Fi = Internal tensile or compressive force component, kip.
zi = Distance from neutral axis to internal force component, Fi, in.
εc max = Strain at the extreme compression fiber.
c = Neutral axis position, in.
The procedure described above was repeated for other points in the moment-curvature diagram of the
section until the maximum usable concrete strain was reached in the extreme compression fiber.
The model initially assumed that the CFRP composites remained attached to the concrete surface. Using
this assumption, the maximum stress that can be developed in the CFRP is equal to the rupture stress, fpu.
The contribution of the CFRP composite to the total tensile force became zero once the rupture stress was
reached. However, experimental testing showed that debonding usually occurred before reaching the
CFRP rupture stress, and the model was subsequently modified to incorporate this failure mode in the
design of the large-scale specimens for phase III of this research project.
The procedure described above to calculate moments and their associated curvatures assumes that the
CFRP composites are attached to the reinforced concrete section before any load is applied. However,
dead loads are always on a structure before strengthening and this needs to be considered particularly for
field applications. A modification to the procedure presented in this section is described in the research
report on the large-scale tests. This procedure was implemented to account for the presence of dead loads
on the section before bonding the CFRP composites.
3.3 LOAD-DEFLECTION RESPONSE
The calculated moment-curvature relationships for the strengthened members were used to determine
deflections. Deflections were calculated using the moment-area method because this method is applicable
to members that have a nonlinear moment-curvature relationship.
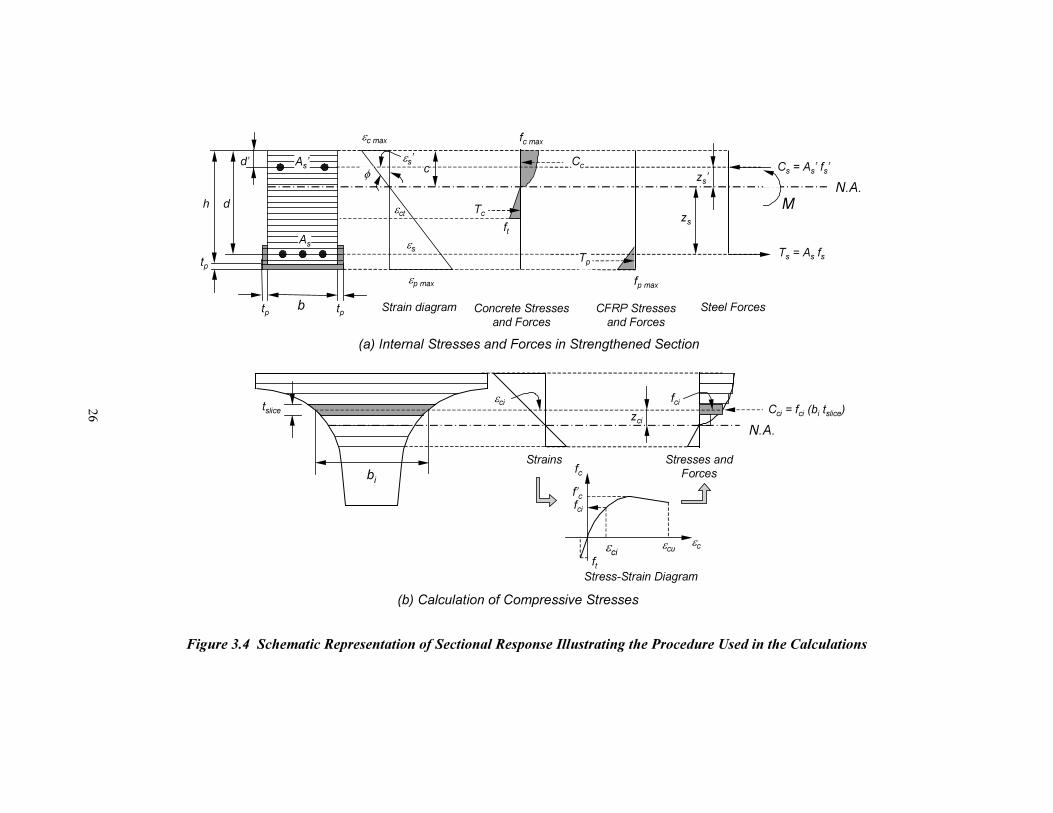
26
f’c
εci
εcεcu
ft
fc
fci
εci fci
bi
Cci = fci (bi tslice)
N.A.
tslice
Strains Stresses and
Forces
Stress-Strain Diagram
(b) Calculation of Compressive Stresses
zci
(a) Internal Stresses and Forces in Strengthened Section
Cc Cs = As’ fs’
Ts = As fsεs
εp max
εs’
N.A.
b
h d
d’c
Strain diagram Concrete Stresses
and Forces
As’
εc max
Tc
fc max
ft
fp max
Tp
CFRP Stresses
and Forces
Steel Forces
As
tptp
tp
εct zs
zs’φ
M
Figure 3.4 Schematic Representation of Sectional Response Illustrating the Procedure Used in the Calculations

27
The moment-area method is summarized in this section (Figure 3.5). First, the moment diagram was
calculated for a specific span length and configuration of loading. Then, the curvature at every point
along the span was determined using the moment-curvature relationship calculated previously for the
cross section.
After determining the curvature diagram along the span, rotations and deflections at any point may be
calculated using the moment-area theorems. Numerical integration of the curvature diagram was used to
determine the rotations and deflections of tangents to the deflected shape. The change in rotation of the
tangents to the deflected shape at two points is determined by computing the area under the curvature
diagram between the two points. The vertical distance between two tangents to the deflected curve at a
point along the span is determined by calculating the first moment of area of the curvature diagram about
the point of interest. Deflections are then determined from geometric considerations.
The procedure used to compute the deflection at point j, δj, of an element with a nonlinear moment-
curvature relationship using the moment-area theorems is illustrated in Figure 3.5. This procedure can be
summarized in the following steps for a simply supported beam:
• Determine the moment and curvature diagrams along the span. Curvatures associated with the
moment at each location are obtained from the moment-curvature relationship of the cross
section.
• Divide the curvature diagram into sufficient segments (twenty segments were used for this study).
The curvature diagram is assumed to be linear within each segment. The curvatures defining an
arbitrary segment, φi and φi+1 are shown in Figure 3.5b.
• Calculate the area and centroid of each segment using the trapezoidal rule:
( )
3
2
2
1
1
1
i
ii
iii
i
iii
∆x
x
∆x
A
+
+=
+=
+
+
+
φφ
φφ
φφ
(3.2)
• Compute the first moment of area of each segment about point j, where the distance between
tangents needs to be determined.
• Calculate the deflection at a point from geometric considerations using the tangents to the
deflected shape.
The distance between two tangents to the deflected shape of the element is determined by taking moments
of each segment about the desired point. For example, the distance between the tangents at points A and
B is equal to the sum of the product of the area of each segment from the curvature diagram times the
distance from point B to the centroid of each segment (Figure 3.5). The distance between two tangents at
points A and j can be calculated similarly by computing the moment of the area of each segment on the
curvature diagram about point j. The deflection at point j is calculated using Equation 3.4 after
determining the distance yj from similar triangles (Equation 3.5):
jAjj - t y −
=δ (3.3)
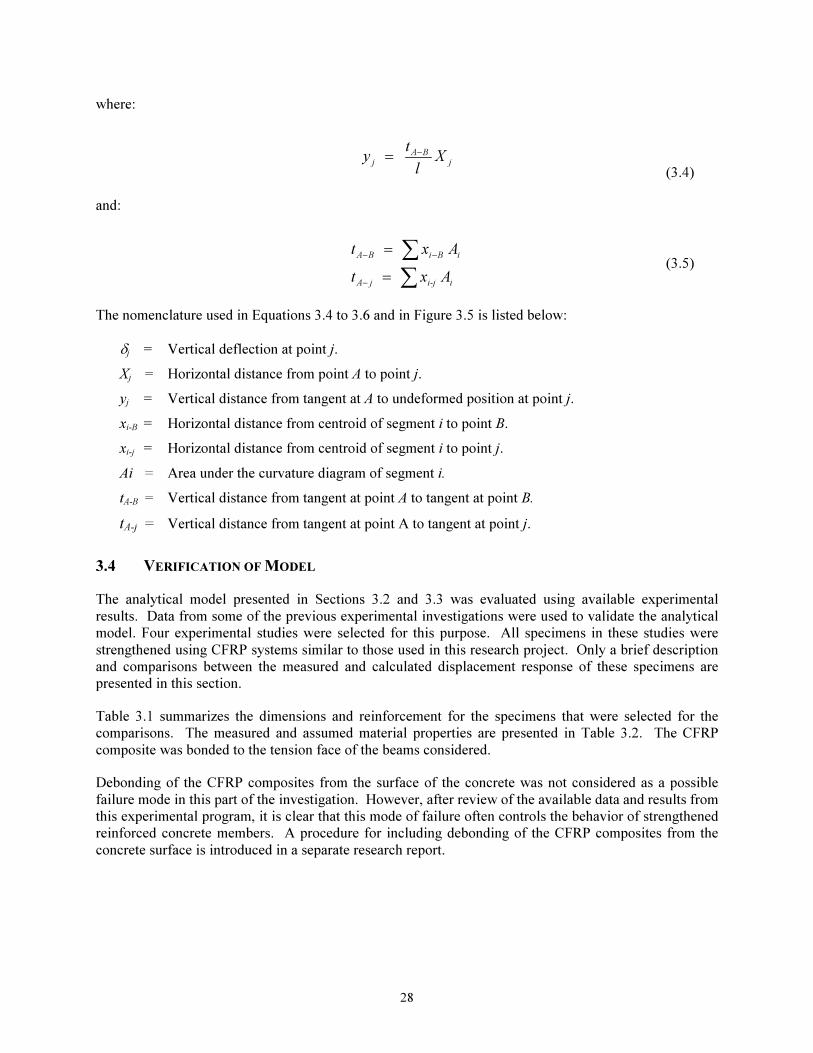
28
where:
jBA
j Xl
t y −
=
(3.4)
and:
∑
∑=
=
−
−−
ii-jjA
iBiBA
Ax t
Ax t
(3.5)
The nomenclature used in Equations 3.4 to 3.6 and in Figure 3.5 is listed below:
δj = Vertical deflection at point j.
Xj = Horizontal distance from point A to point j.
yj = Vertical distance from tangent at A to undeformed position at point j.
xi-B = Horizontal distance from centroid of segment i to point B.
xi-j = Horizontal distance from centroid of segment i to point j.
Ai = Area under the curvature diagram of segment i.
tA-B = Vertical distance from tangent at point A to tangent at point B.
tA-j = Vertical distance from tangent at point A to tangent at point j.
3.4 VERIFICATION OF MODEL
The analytical model presented in Sections 3.2 and 3.3 was evaluated using available experimental
results. Data from some of the previous experimental investigations were used to validate the analytical
model. Four experimental studies were selected for this purpose. All specimens in these studies were
strengthened using CFRP systems similar to those used in this research project. Only a brief description
and comparisons between the measured and calculated displacement response of these specimens are
presented in this section.
Table 3.1 summarizes the dimensions and reinforcement for the specimens that were selected for the
comparisons. The measured and assumed material properties are presented in Table 3.2. The CFRP
composite was bonded to the tension face of the beams considered.
Debonding of the CFRP composites from the surface of the concrete was not considered as a possible
failure mode in this part of the investigation. However, after review of the available data and results from
this experimental program, it is clear that this mode of failure often controls the behavior of strengthened
reinforced concrete members. A procedure for including debonding of the CFRP composites from the
concrete surface is introduced in a separate research report.
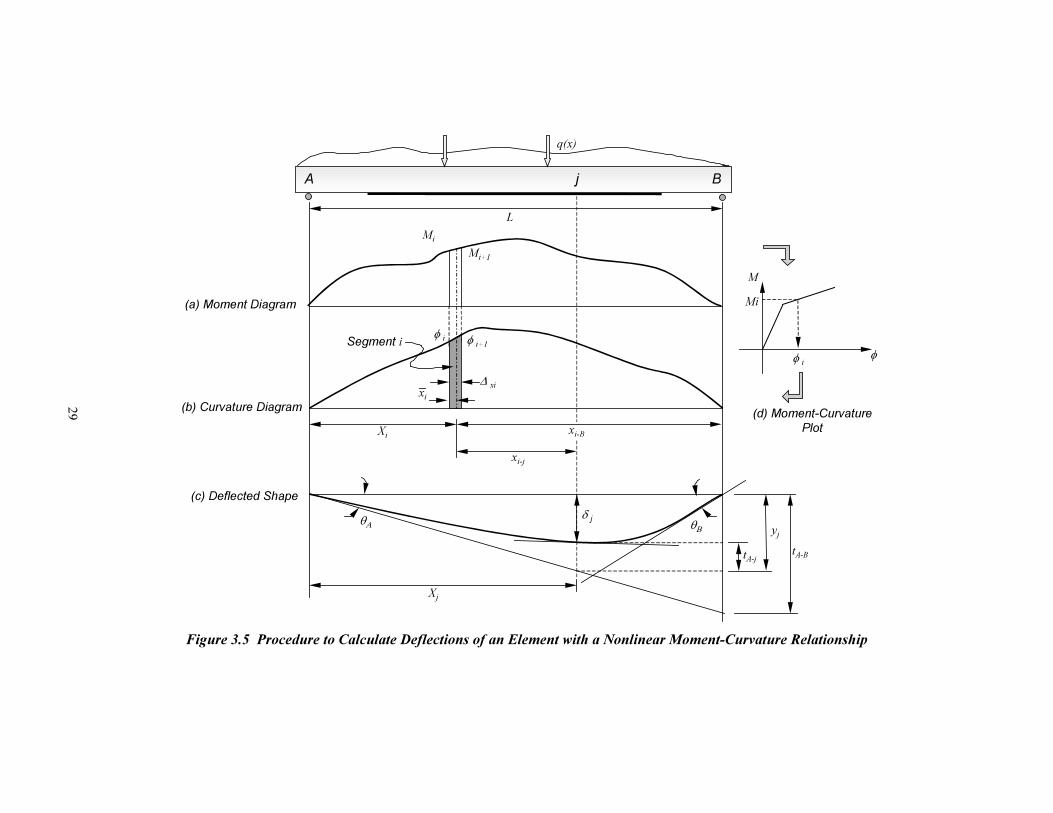
29
Segment i
∆ xi
(a) Moment Diagram
Xi
φ i
Mi
φ i+1
Mi+1
δ j
Xj
θΑ
tA-jtA-B
(b) Curvature Diagram
(c) Deflected Shape
yj
A Bj
xi-B
xi-j
L
Mi
φ iφ
M
(d) Moment-Curvature
Plot
q(x)
xi
θΒ
Figure 3.5 Procedure to Calculate Deflections of an Element with a Nonlinear Moment-Curvature Relationship
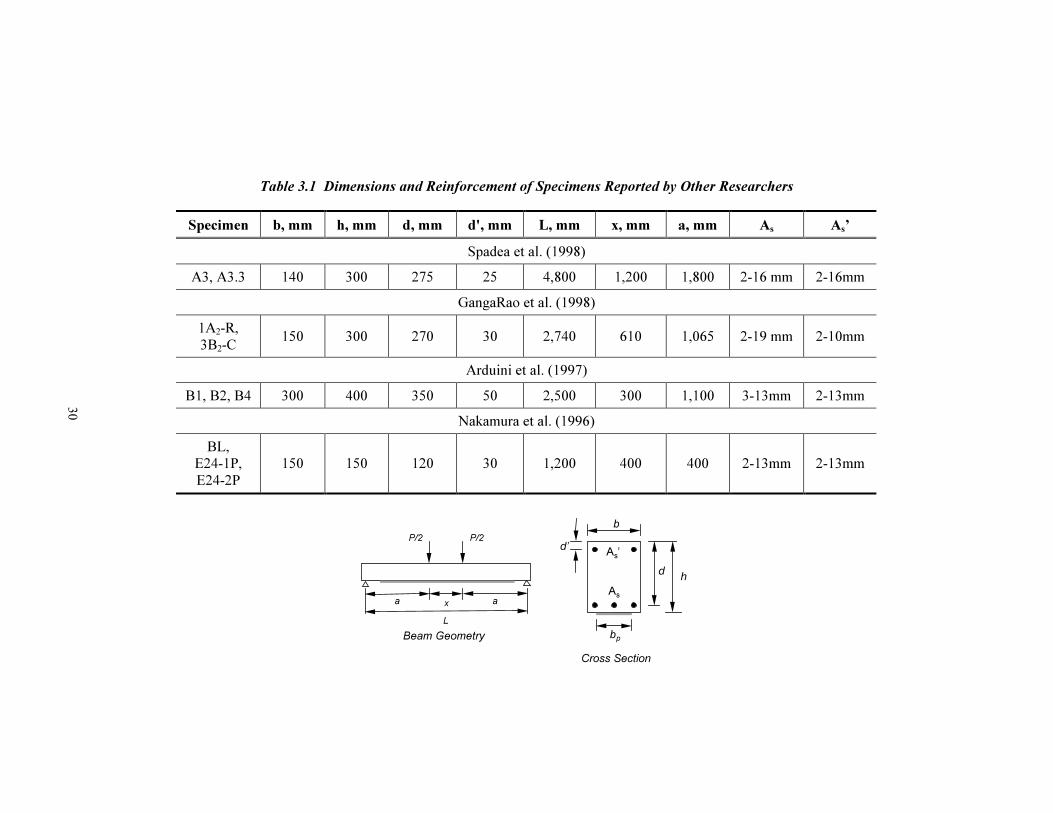
30
Table 3.1 Dimensions and Reinforcement of Specimens Reported by Other Researchers
Specimen b, mm h, mm d, mm d', mm L, mm x, mm a, mm As As’
Spadea et al. (1998)
A3, A3.3 140 300 275 25 4,800 1,200 1,800 2-16 mm 2-16mm
GangaRao et al. (1998)
1A2-R,
3B2-C 150 300 270 30 2,740 610 1,065 2-19 mm 2-10mm
Arduini et al. (1997)
B1, B2, B4 300 400 350 50 2,500 300 1,100 3-13mm 2-13mm
Nakamura et al. (1996)
BL,
E24-1P,
E24-2P
150 150 120 30 1,200 400 400 2-13mm 2-13mm
a x a
Beam Geometry
L
P/2P/2
d
b
h
d’A
s’
As
Cross Section
bp
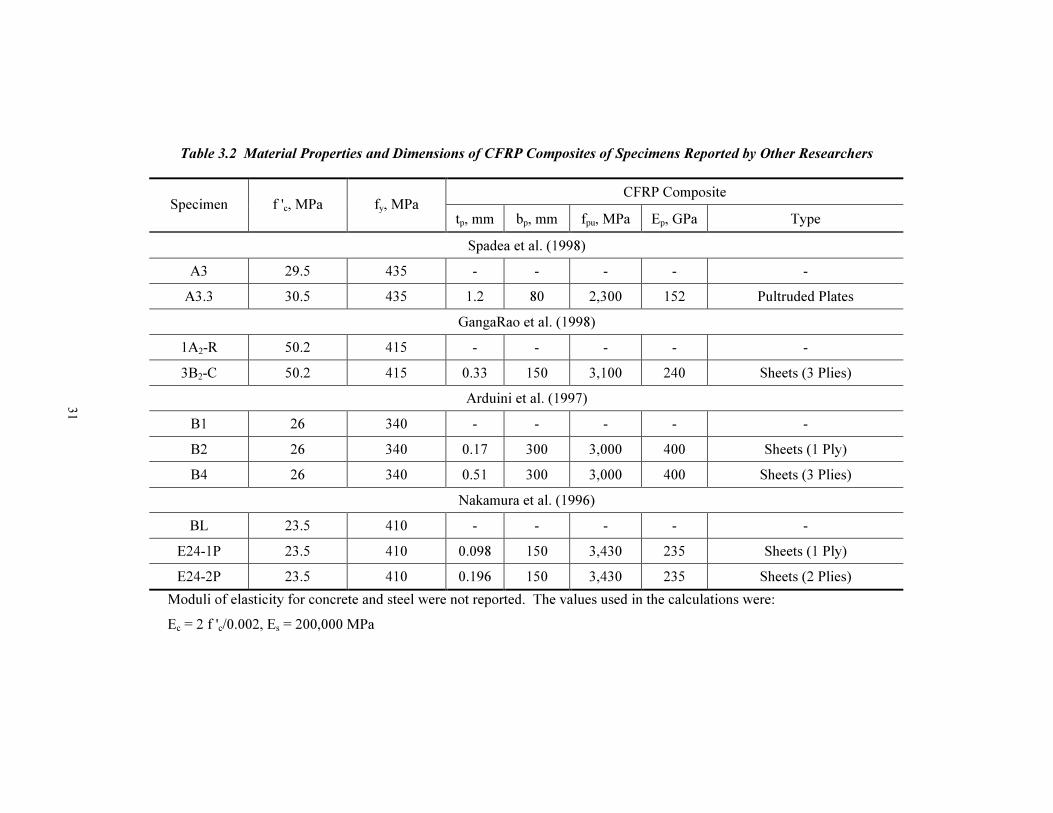
31
Table 3.2 Material Properties and Dimensions of CFRP Composites of Specimens Reported by Other Researchers
CFRP Composite Specimen f 'c, MPa fy, MPa
tp, mm bp, mm fpu, MPa Ep, GPa Type
Spadea et al. (1998)
A3 29.5 435 - - - - -
A3.3 30.5 435 1.2 80 2,300 152 Pultruded Plates
GangaRao et al. (1998)
1A2-R 50.2 415 - - - - -
3B2-C 50.2 415 0.33 150 3,100 240 Sheets (3 Plies)
Arduini et al. (1997)
B1 26 340 - - - - -
B2 26 340 0.17 300 3,000 400 Sheets (1 Ply)
B4 26 340 0.51 300 3,000 400 Sheets (3 Plies)
Nakamura et al. (1996)
BL 23.5 410 - - - - -
E24-1P 23.5 410 0.098 150 3,430 235 Sheets (1 Ply)
E24-2P 23.5 410 0.196 150 3,430 235 Sheets (2 Plies)
Moduli of elasticity for concrete and steel were not reported. The values used in the calculations were:
Ec = 2 f 'c/0.002, Es = 200,000 MPa
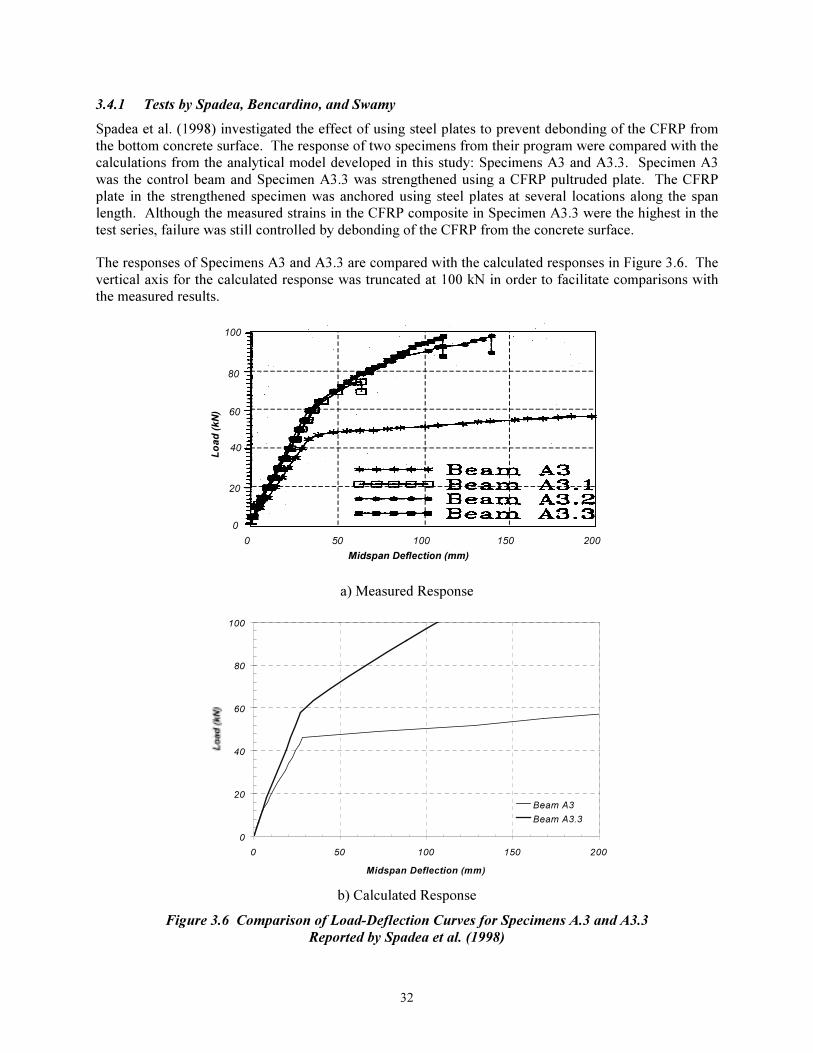
32
3.4.1 Tests by Spadea, Bencardino, and Swamy
Spadea et al. (1998) investigated the effect of using steel plates to prevent debonding of the CFRP from
the bottom concrete surface. The response of two specimens from their program were compared with the
calculations from the analytical model developed in this study: Specimens A3 and A3.3. Specimen A3
was the control beam and Specimen A3.3 was strengthened using a CFRP pultruded plate. The CFRP
plate in the strengthened specimen was anchored using steel plates at several locations along the span
length. Although the measured strains in the CFRP composite in Specimen A3.3 were the highest in the
test series, failure was still controlled by debonding of the CFRP from the concrete surface.
The responses of Specimens A3 and A3.3 are compared with the calculated responses in Figure 3.6. The
vertical axis for the calculated response was truncated at 100 kN in order to facilitate comparisons with
the measured results.
150
100
80
60
40
20
0
200100500
Midspan Deflection (mm)
Lo
ad
(kN
)
a) Measured Response
0
20
40
60
80
100
0 50 100 150 200
Midspan Deflection (mm)
Beam A3
Beam A3.3
b) Calculated Response
Figure 3.6 Comparison of Load-Deflection Curves for Specimens A.3 and A3.3
Reported by Spadea et al. (1998)
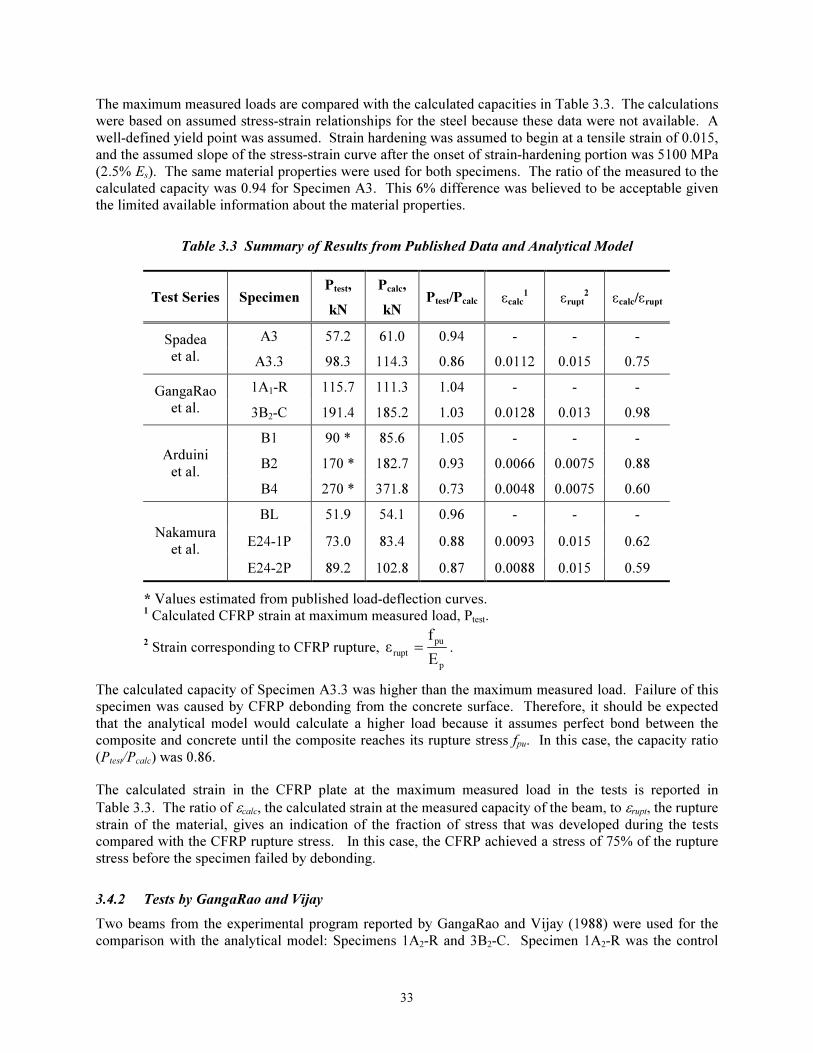
33
The maximum measured loads are compared with the calculated capacities in Table 3.3. The calculations
were based on assumed stress-strain relationships for the steel because these data were not available. A
well-defined yield point was assumed. Strain hardening was assumed to begin at a tensile strain of 0.015,
and the assumed slope of the stress-strain curve after the onset of strain-hardening portion was 5100 MPa
(2.5% Es). The same material properties were used for both specimens. The ratio of the measured to the
calculated capacity was 0.94 for Specimen A3. This 6% difference was believed to be acceptable given
the limited available information about the material properties.
Table 3.3 Summary of Results from Published Data and Analytical Model
Test Series Specimen Ptest,
kN
Pcalc,
kN Ptest/Pcalc εcalc
1 εrupt
2 εcalc/εrupt
A3 57.2 61.0 0.94 - - - Spadea
et al. A3.3 98.3 114.3 0.86 0.0112 0.015 0.75
1A1-R 115.7 111.3 1.04 - - - GangaRao
et al. 3B2-C 191.4 185.2 1.03 0.0128 0.013 0.98
B1 90 * 85.6 1.05 - - -
B2 170 * 182.7 0.93 0.0066 0.0075 0.88 Arduini
et al.
B4 270 * 371.8 0.73 0.0048 0.0075 0.60
BL 51.9 54.1 0.96 - - -
E24-1P 73.0 83.4 0.88 0.0093 0.015 0.62 Nakamura
et al.
E24-2P 89.2 102.8 0.87 0.0088 0.015 0.59
* Values estimated from published load-deflection curves. 1 Calculated CFRP strain at maximum measured load, Ptest.
2 Strain corresponding to CFRP rupture,
p
pu
ruptE
fε = .
The calculated capacity of Specimen A3.3 was higher than the maximum measured load. Failure of this
specimen was caused by CFRP debonding from the concrete surface. Therefore, it should be expected
that the analytical model would calculate a higher load because it assumes perfect bond between the
composite and concrete until the composite reaches its rupture stress fpu. In this case, the capacity ratio
(Ptest/Pcalc) was 0.86.
The calculated strain in the CFRP plate at the maximum measured load in the tests is reported in
Table 3.3. The ratio of εcalc, the calculated strain at the measured capacity of the beam, to εrupt, the rupture
strain of the material, gives an indication of the fraction of stress that was developed during the tests
compared with the CFRP rupture stress. In this case, the CFRP achieved a stress of 75% of the rupture
stress before the specimen failed by debonding.
3.4.2 Tests by GangaRao and Vijay
Two beams from the experimental program reported by GangaRao and Vijay (1988) were used for the
comparison with the analytical model: Specimens 1A2-R and 3B2-C. Specimen 1A2-R was the control
34
beam companion to Specimen 3B2-C. The geometry and material properties for these specimens are
included in Tables 3.1 and 3.2, respectively.
Specimen 3B2-C was strengthened after first cracking the concrete using a CFRP composite fabricated by
a wet-layup procedure (Appendix C). This specimen was strengthened using 3 layers (plies) of CFRP
sheets bonded to the tension face of the reinforced concrete beam. The sheets were made of
unidirectional carbon fibers that were oriented longitudinally along the axis of the beam. An additional
CFRP sheet was wrapped around the beam on top of the 3-ply, longitudinal sheets along the entire length
to control slip of the CFRP composite.
A comparison of the load-deflection response of the two specimens is presented in Figure 3.7. Failure of
both specimens was controlled by concrete crushing in the compression zone. The ratios of maximum
measured to calculated loads are included in Table 3.3. The excellent correlation to the model in this case
is a result of the failure mode experienced by Specimen 3B2-C (concrete crushing). No debonding of the
CFRP composite was detected during the test, indicating that wrapping a sheet of CFRP along the entire
length of the beam is an effective method of anchoring the sheets.
The ratio of calculated strain at maximum load (εcalc) to CFRP rupture strain (εrupt) is presented in
Table 3.3. This ratio is very close to 1.0 because the failure mode was controlled by crushing of the
concrete and not debonding of the CFRP sheets.
3.4.3 Tests by Arduini, Di Tommaso, and Nanni
Arduini et al. (1997) tested square reinforced concrete beams strengthened using CFRP pultruded plates
(Series A). They also reported the results of tests performed at Penn State University in 1995 of four
rectangular beams strengthened using CFRP flexible sheets (Series B). Three beams from series B:
Specimens B1, B2, and B4 were used for comparison to the analytical model in this chapter.
Beam B1 was the control specimen. Beams B2 and B4 were strengthened using 1 and 3 layers of CFRP
sheets, respectively, bonded to the tension side of the specimens. These sheets were made with
unidirectional carbon fibers and they were oriented longitudinally along the beams. An additional carbon
fiber sheet was wrapped around the bottom and sides of Specimen B4 throughout the strengthened portion
of the beam to avoid debonding of the longitudinal sheets. Details of the specimen geometry and
reinforcement are summarized in Table 3.1. The reported material properties and the characteristics of
the CFRP sheets are contained in Table 3.2.
Failure of Specimen B2 was controlled by CFRP rupture at midspan. Specimen B4 failed by concrete
crushing at one of the loading points after local debonding of the transverse CFRP sheet was observed at
several places.
Measured and calculated responses are compared in Figure 3.8. The plot reported by Arduini et al. (1998)
was truncated at a displacement of 12 mm although it is apparent that Specimen B1 experienced larger
displacements before failure. The calculated results are plotted to the same scale to facilitate
comparisons.
The calculated response of Specimens B1 and B2 show excellent agreement with the measured data.
Measured loads corresponding to cracking, yielding, and capacity are reproduced closely with the
sectional model for both specimens. The ratio between the measured and calculated capacities for
Specimen B2 was 0.93 (Table 3.3). In this case the model estimated the capacity closely because this
specimen failed by rupture of the CFRP sheet, rather than debonding.
35
15
200
160
120
80
40
0
20 25 301050
Midspan Deflection (mm)
Lo
ad
(kN
)
a) Measured Response
0
40
80
120
160
200
0 5 10 15 20 25 30
Midspan Deflection (mm)
1A2-R
3B2-C
b) Calculated Response
Figure 3.7 Comparison of Load-Deflection Curves for Specimens 1A2-R and 3B2-C
Reported by GangaRao and Vijay (1998)
The calculated and measured responses of Specimen B4 are also shown in Figure 3.8 and Table 3.3. The
calculated curve was truncated at a load of 280 kN to facilitate comparison with the measured response,
although the calculated capacity was over 370 kN (Table 3.3). The poor correlation with the measured
response is due to the failure mode experienced by the specimen (crushing after localized debonding of
the transverse sheet).
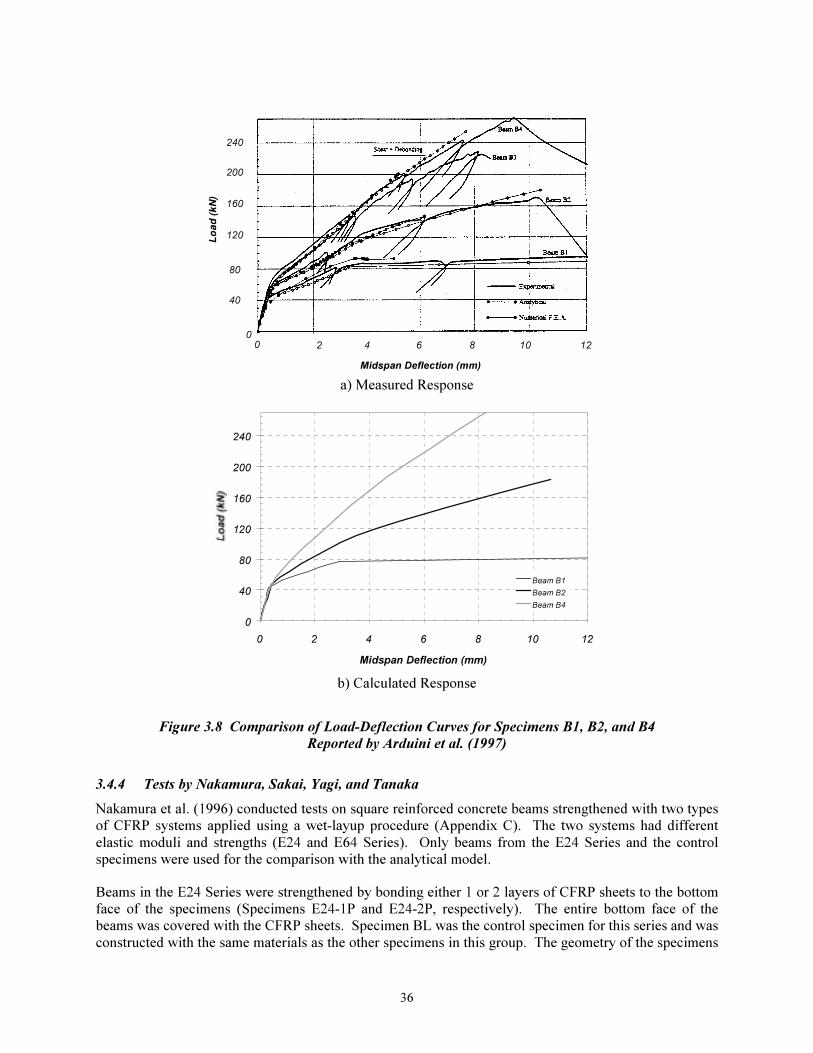
36
2 4 6 80
0
240
200
160
120
80
40
Midspan Deflection (mm)
Lo
ad
(kN
)
10 12
a) Measured Response
0
40
80
120
160
200
240
0 2 4 6 8 10 12
Midspan Deflection (mm)
Beam B1
Beam B2
Beam B4
b) Calculated Response
Figure 3.8 Comparison of Load-Deflection Curves for Specimens B1, B2, and B4
Reported by Arduini et al. (1997)
3.4.4 Tests by Nakamura, Sakai, Yagi, and Tanaka
Nakamura et al. (1996) conducted tests on square reinforced concrete beams strengthened with two types
of CFRP systems applied using a wet-layup procedure (Appendix C). The two systems had different
elastic moduli and strengths (E24 and E64 Series). Only beams from the E24 Series and the control
specimens were used for the comparison with the analytical model.
Beams in the E24 Series were strengthened by bonding either 1 or 2 layers of CFRP sheets to the bottom
face of the specimens (Specimens E24-1P and E24-2P, respectively). The entire bottom face of the
beams was covered with the CFRP sheets. Specimen BL was the control specimen for this series and was
constructed with the same materials as the other specimens in this group. The geometry of the specimens
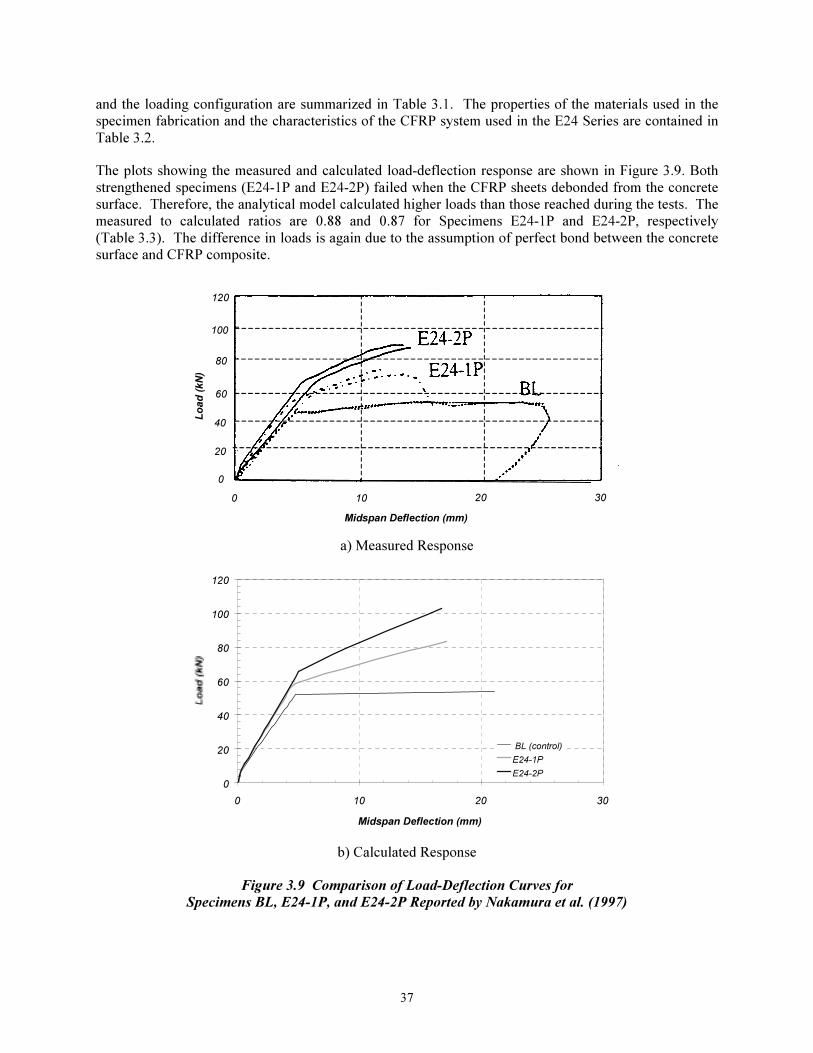
37
and the loading configuration are summarized in Table 3.1. The properties of the materials used in the
specimen fabrication and the characteristics of the CFRP system used in the E24 Series are contained in
Table 3.2.
The plots showing the measured and calculated load-deflection response are shown in Figure 3.9. Both
strengthened specimens (E24-1P and E24-2P) failed when the CFRP sheets debonded from the concrete
surface. Therefore, the analytical model calculated higher loads than those reached during the tests. The
measured to calculated ratios are 0.88 and 0.87 for Specimens E24-1P and E24-2P, respectively
(Table 3.3). The difference in loads is again due to the assumption of perfect bond between the concrete
surface and CFRP composite.
120
100
80
60
40
0
20 30100
Midspan Deflection (mm)
Lo
ad
(kN
)
20
a) Measured Response
0
20
40
60
80
100
120
0 10 20 30
Midspan Deflection (mm)
BL (control)
E24-1P
E24-2P
b) Calculated Response
Figure 3.9 Comparison of Load-Deflection Curves for
Specimens BL, E24-1P, and E24-2P Reported by Nakamura et al. (1997)

38
The ratio of calculated to rupture strain indicates that the maximum stress developed in CFRP sheets was
about 60% of the maximum rupture stress. No attempt was made to prevent debonding of the CFRP
sheets from the beams in these tests.
3.4.5 Summary of Published Data
The analytical model presented in this chapter can reliably reproduce the general behavior of strengthened
reinforced concrete specimens using CFRP composites. The shapes of the calculated load-deflection
curves follow very closely the measured response reported by other researchers. The agreement between
measured and calculated capacity clearly depends on the mode of failure observed during the individual
tests. If the composites debond from the concrete surface before reaching their tensile strength, the
analytical model will overestimate the capacity of these specimens.
3.5 SUMMARY
An analytical model for calculating the moment-curvature and load-deflection response of reinforced
concrete sections strengthened using CFRP composites was presented in this chapter. This model was
validated using existing experimental data from reinforced concrete beams using CFRP composites. The
model provides an accurate estimate of the observed capacity if the beam fails after rupture of the CFRP
composite or crushing of the concrete. However, most beams failed after the CFRP composite debonded
from the surface of the concrete, and the analytical model was not capable of reproducing this mode of
failure. The model was later refined by adding a limiting composite strain before debonding. The refined
model was used to design the composite systems to strengthen the large-scale specimens for this
experimental program. A description of the refinements to the analytical model are presented in a
separate research report [Breña et al., 2001].
39
Chapter 4: Description of Laboratory Specimens
4.1 INTRODUCTION
This chapter presents a description of the design and construction of the laboratory specimens tested in
this part of the research project. The criteria used to design the laboratory specimens are described in
Section 4.2. The calculated capacity of the unstrengthened specimens is presented in Section 4.3.
Specimens were strengthened using four different CFRP systems to increase their flexural capacity. A
description of the different systems used to strengthen the reinforced concrete beams is presented in
Section 4.5, and the calculated capacity of the strengthened specimens is contained in Section 4.6.
Thirty rectangular, reinforced concrete beams were fabricated in the Ferguson Structural Engineering
Laboratory at the University of Texas at Austin. Twenty of these beams were subjected to monotically
increasing loads after curing for at least 28 days, two were exposed to the environment, including wetting
and drying cycles, for approximately 8 months before testing failure, and eight were subjected to repeated
loads.
4.2 DESIGN AND CONSTRUCTION OF LABORATORY SPECIMENS
The main objective of this part of the research project was to determine the most suitable configuration of
the composite systems to strengthen the reinforced concrete elements. It was hoped that a configuration
could be found to utilize the full strength of the composites. The results of this part of the project were
expected to be used for the design of the large-scale laboratory specimens in phase 3 of the research
project. To facilitate construction and to simplify calculations, simply-supported reinforced concrete
beams having a rectangular cross section were selected for these tests. The general trends in the behavior
of these specimens were expected to be similar to the behavior of elements with other cross sectional
shapes, such as tee or joist sections. Four different composite systems were used to strengthen the
reinforced concrete beam specimens. Details of the four different composite systems used in this study
are presented in Section 4.5.
The specimens were scaled down from the prototype bridges because it was considered important to be
able to study different composite systems and configurations at this stage of the research project.
Therefore, a relatively large number of tests were planned to include as many variables as practical. A
beam length of approximately one-third of the prototype bridge span was selected as the minimum
dimension that could practically be constructed without having to scale aggregate size or longitudinal bar
diameters. Once the length of the beams was approximated, the loading configuration and depth of the
rectangular beam specimens were selected by choosing a shear-span-to-depth ratio to ensure that the
behavior was dominated by flexure. A minimum shear-span-to-depth ratio of approximately three was
selected to achieve this goal.
Bonded length of the composite systems was the main parameter studied in this initial set of tests. The
beams were designed to avoid failure of the specimens at the CFRP cut-off point at an applied load
corresponding to the tensile strength of the composite. The capacity of the cross section was calculated
by assuming that the composite did not debond from the surface of the concrete. This assumption was
later revised based on the results of the first set of tests as described in Section 4.5. Different bonded
lengths were required to develop the maximum flexural capacity of the strengthened beams depending on
the strength of the composite system. The length required to develop the full strength of each CFRP
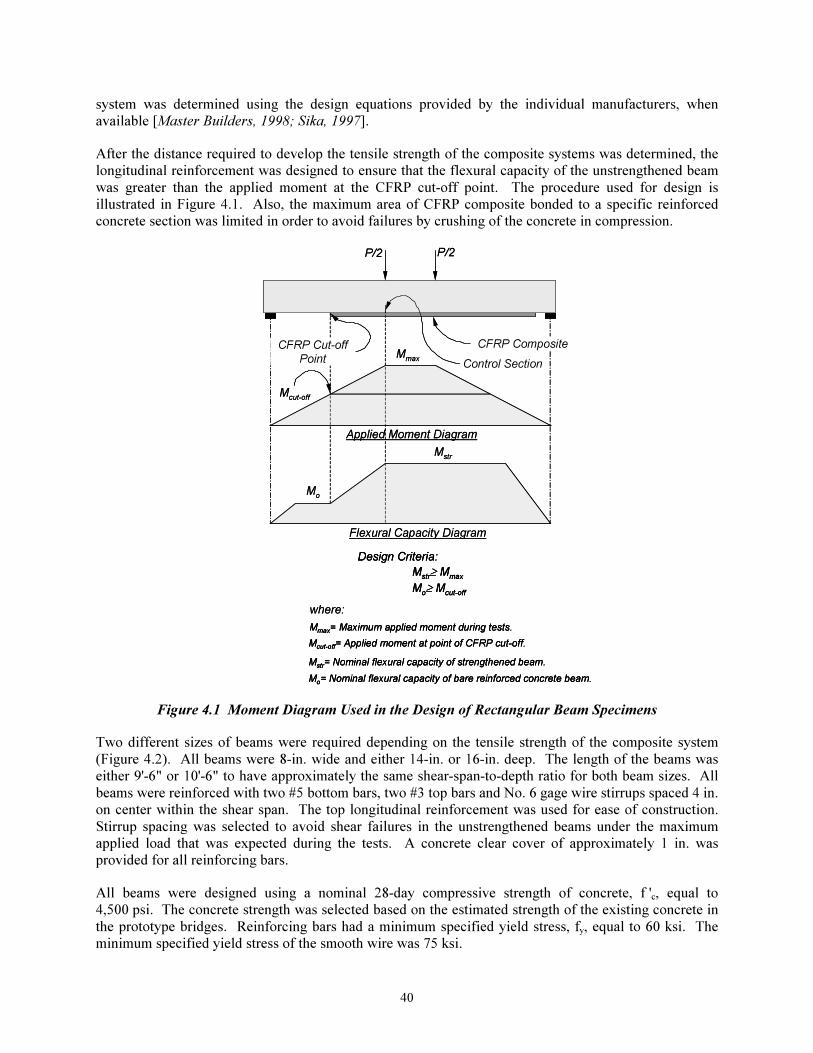
40
system was determined using the design equations provided by the individual manufacturers, when
available [Master Builders, 1998; Sika, 1997].
After the distance required to develop the tensile strength of the composite systems was determined, the
longitudinal reinforcement was designed to ensure that the flexural capacity of the unstrengthened beam
was greater than the applied moment at the CFRP cut-off point. The procedure used for design is
illustrated in Figure 4.1. Also, the maximum area of CFRP composite bonded to a specific reinforced
concrete section was limited in order to avoid failures by crushing of the concrete in compression.
Applied Moment Diagram
P/2P/2
Flexural Capacity Diagram
Mmax
Control Section
CFRP Composite
Mo
Mstr
Mcut-off
CFRP Cut-off
Point
Mstr≥ M
max
Mo≥ M
cut-off
Design Criteria:
Mmax
= Maximum applied moment during tests.
Mo= Nominal flexural capacity of bare reinforced concrete beam.
Mstr
= Nominal flexural capacity of strengthened beam.
Mcut-off= Applied moment at point of CFRP cut-off.
where:
Applied Moment Diagram
P/2P/2
Flexural Capacity Diagram
Mmax
Control Section
CFRP Composite
Mo
Mstr
Mcut-off
CFRP Cut-off
Point
Mstr≥ M
max
Mo≥ M
cut-off
Design Criteria:
Mstr≥ M
max
Mo≥ M
cut-off
Design Criteria:
Mmax
= Maximum applied moment during tests.
Mo= Nominal flexural capacity of bare reinforced concrete beam.
Mstr
= Nominal flexural capacity of strengthened beam.
Mcut-off= Applied moment at point of CFRP cut-off.
Mmax
= Maximum applied moment during tests.
Mo= Nominal flexural capacity of bare reinforced concrete beam.
Mstr
= Nominal flexural capacity of strengthened beam.
Mcut-off= Applied moment at point of CFRP cut-off.
where:
Figure 4.1 Moment Diagram Used in the Design of Rectangular Beam Specimens
Two different sizes of beams were required depending on the tensile strength of the composite system
(Figure 4.2). All beams were 8-in. wide and either 14-in. or 16-in. deep. The length of the beams was
either 9'-6" or 10'-6" to have approximately the same shear-span-to-depth ratio for both beam sizes. All
beams were reinforced with two #5 bottom bars, two #3 top bars and No. 6 gage wire stirrups spaced 4 in.
on center within the shear span. The top longitudinal reinforcement was used for ease of construction.
Stirrup spacing was selected to avoid shear failures in the unstrengthened beams under the maximum
applied load that was expected during the tests. A concrete clear cover of approximately 1 in. was
provided for all reinforcing bars.
All beams were designed using a nominal 28-day compressive strength of concrete, f 'c, equal to
4,500 psi. The concrete strength was selected based on the estimated strength of the existing concrete in
the prototype bridges. Reinforcing bars had a minimum specified yield stress, fy, equal to 60 ksi. The
minimum specified yield stress of the smooth wire was 75 ksi.
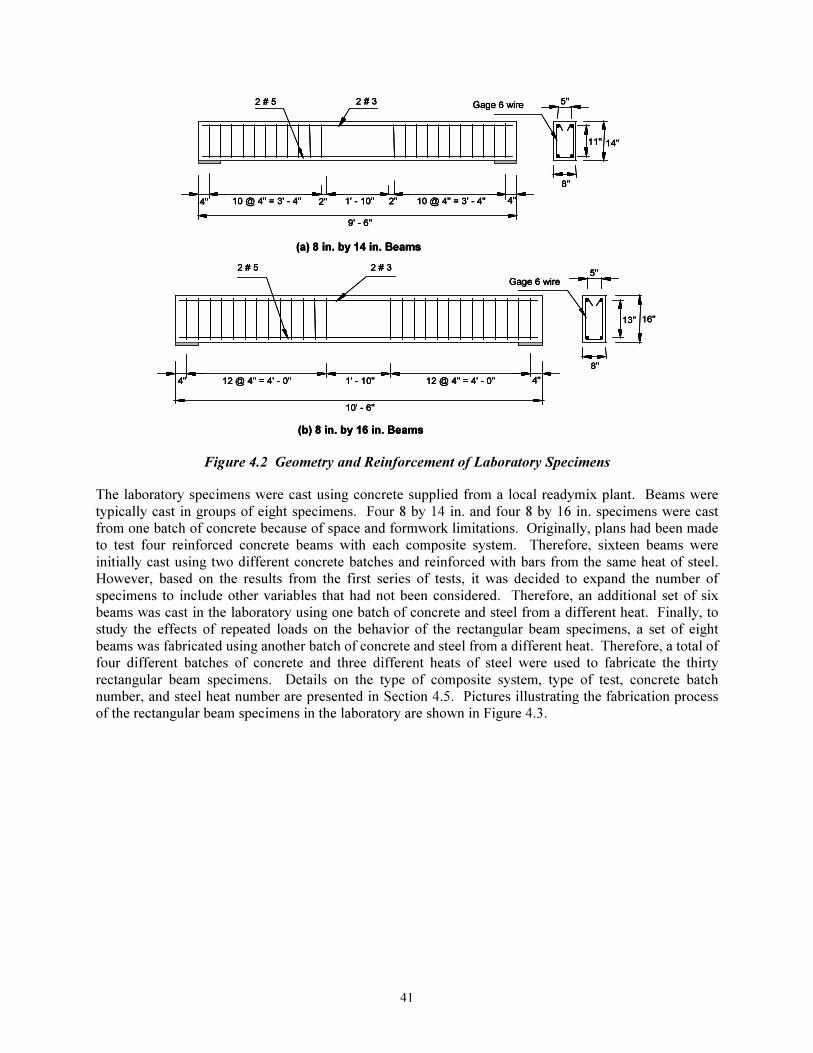
41
(b) 8 in. by 16 in. Beams
10' - 6"
12 @ 4" = 4' - 0"
2 # 3
12 @ 4" = 4' - 0"4" 1' - 10"
2 # 55"
Gage 6 wire
4"
8"
16"13"
(a) 8 in. by 14 in. Beams
9' - 6"
10 @ 4" = 3' - 4"4" 1' - 10"10 @ 4" = 3' - 4"
2 # 5 2 # 3
4"
5"Gage 6 wire
11" 14"
8"
2" 2"
(b) 8 in. by 16 in. Beams
10' - 6"
12 @ 4" = 4' - 0"
2 # 3
12 @ 4" = 4' - 0"4" 1' - 10"
2 # 55"
Gage 6 wire
4"
8"
16"13"
(b) 8 in. by 16 in. Beams
10' - 6"
12 @ 4" = 4' - 0"
2 # 3
12 @ 4" = 4' - 0"4" 1' - 10"
2 # 55"
Gage 6 wire
4"
8"
16"13"
(a) 8 in. by 14 in. Beams
9' - 6"
10 @ 4" = 3' - 4"4" 1' - 10"10 @ 4" = 3' - 4"
2 # 5 2 # 3
4"
5"Gage 6 wire
11" 14"
8"
2" 2"
(a) 8 in. by 14 in. Beams
9' - 6"
10 @ 4" = 3' - 4"4" 1' - 10"10 @ 4" = 3' - 4"
2 # 5 2 # 3
4"
5"Gage 6 wire
11" 14"
8"
2" 2"
Figure 4.2 Geometry and Reinforcement of Laboratory Specimens
The laboratory specimens were cast using concrete supplied from a local readymix plant. Beams were
typically cast in groups of eight specimens. Four 8 by 14 in. and four 8 by 16 in. specimens were cast
from one batch of concrete because of space and formwork limitations. Originally, plans had been made
to test four reinforced concrete beams with each composite system. Therefore, sixteen beams were
initially cast using two different concrete batches and reinforced with bars from the same heat of steel.
However, based on the results from the first series of tests, it was decided to expand the number of
specimens to include other variables that had not been considered. Therefore, an additional set of six
beams was cast in the laboratory using one batch of concrete and steel from a different heat. Finally, to
study the effects of repeated loads on the behavior of the rectangular beam specimens, a set of eight
beams was fabricated using another batch of concrete and steel from a different heat. Therefore, a total of
four different batches of concrete and three different heats of steel were used to fabricate the thirty
rectangular beam specimens. Details on the type of composite system, type of test, concrete batch
number, and steel heat number are presented in Section 4.5. Pictures illustrating the fabrication process
of the rectangular beam specimens in the laboratory are shown in Figure 4.3.
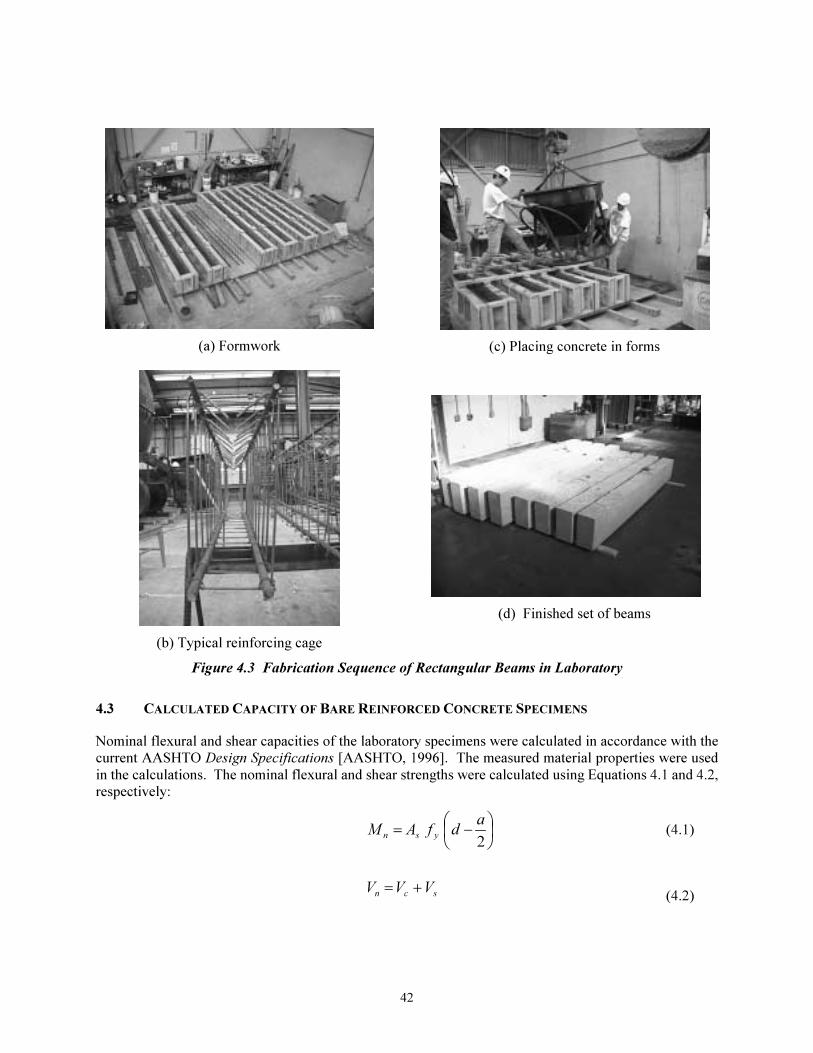
42
(a) Formwork
(b) Typical reinforcing cage
(c) Placing concrete in forms
(d) Finished set of beams
Figure 4.3 Fabrication Sequence of Rectangular Beams in Laboratory
4.3 CALCULATED CAPACITY OF BARE REINFORCED CONCRETE SPECIMENS
Nominal flexural and shear capacities of the laboratory specimens were calculated in accordance with the
current AASHTO Design Specifications [AASHTO, 1996]. The measured material properties were used
in the calculations. The nominal flexural and shear strengths were calculated using Equations 4.1 and 4.2,
respectively:
−=2
ad f A M
ysn (4.1)
scnVVV +=
(4.2)

43
where
Mn = Nominal flexural strength, lb-in.
( )in. block, stress equivalent ofdepth
' 85.0
==
c
ys
fb
fAa
Vn = Nominal shear strength of member, lb.
Vc = 2 db'fc
= concrete contribution to the nominal shear strength of the member, lb.
Vs = s
d fAyv
= stirrup contribution to the nominal shear strength of the member, lb.
As = Area of flexural reinforcement, in2.
Av = Area of shear reinforcement within a distance s, in2.
d = Distance from extreme compression fiber to centroid of flexural reinforcement, in.
b = Width of beam, in.
s = Horizontal spacing of shear reinforcement, in.
fy = Yield stress of flexural or shear reinforcement, psi.
f 'c = Concrete compressive strength, psi.
Four groups of beams were cast using different concrete batches with the same concrete mixture design.
The capacities of the unstrengthened beams were calculated for each of the beam groups. Eight beams
(four, 14-in. deep and four, 16-in. deep) were cast for groups I, II, and IV, and six beams (four, 14-in.
deep and two, 16-in. deep) were cast for group III. The reinforcing steel for beam groups I and II was
obtained from the same heat of steel, while the reinforcement for groups III and IV was obtained from
different heats.
Concrete cylinders were tested at different ages to determine the variation of concrete strength with time.
Although the strength of concrete kept increasing at ages beyond 28 days, the variation of strength was
not significant between the dates that the first and last beams within a group of beams were tested
(Appendix A). Therefore, the average concrete strength at the time that the last beam within each group
was tested was used in the calculations.
4.4 COMPOSITE SYSTEMS USED TO STRENGTHEN THE LABORATORY SPECIMENS
Four different composite systems were used to strengthen the rectangular beam specimens. For the
purpose of identification, the different composite systems were labeled using letters A through D. The
composite systems were applied to the beams using different strengthening schemes as described in
Section 4.5.1. Physical and mechanical properties of the systems are presented in Appendix A.
Composite systems A and B consisted of an epoxy-based matrix reinforced with unidirectional carbon
fibers. System C was based on woven unidirectional carbon fibers impregnated in an epoxy-based
matrix. The epoxy matrix in systems A through C was also used to bond the systems to the surface of the
concrete using the wet-layup technique. System D consisted of pultruded CFRP plates attached to the
concrete using an epoxy-based paste. Figures 4.4 through 4.6 illustrate the composite systems being
bonded to the tension face of the specimens. As shown in these figures, the specimens were turned upside
down in the laboratory to facilitate the strengthening procedure.
Table 4.1 lists the material properties and the flexural and shear capacities for each group of specimens.
Beams in groups I through III were subjected to monotonically increasing loads and beams in group IV
were subjected to repeated loads.
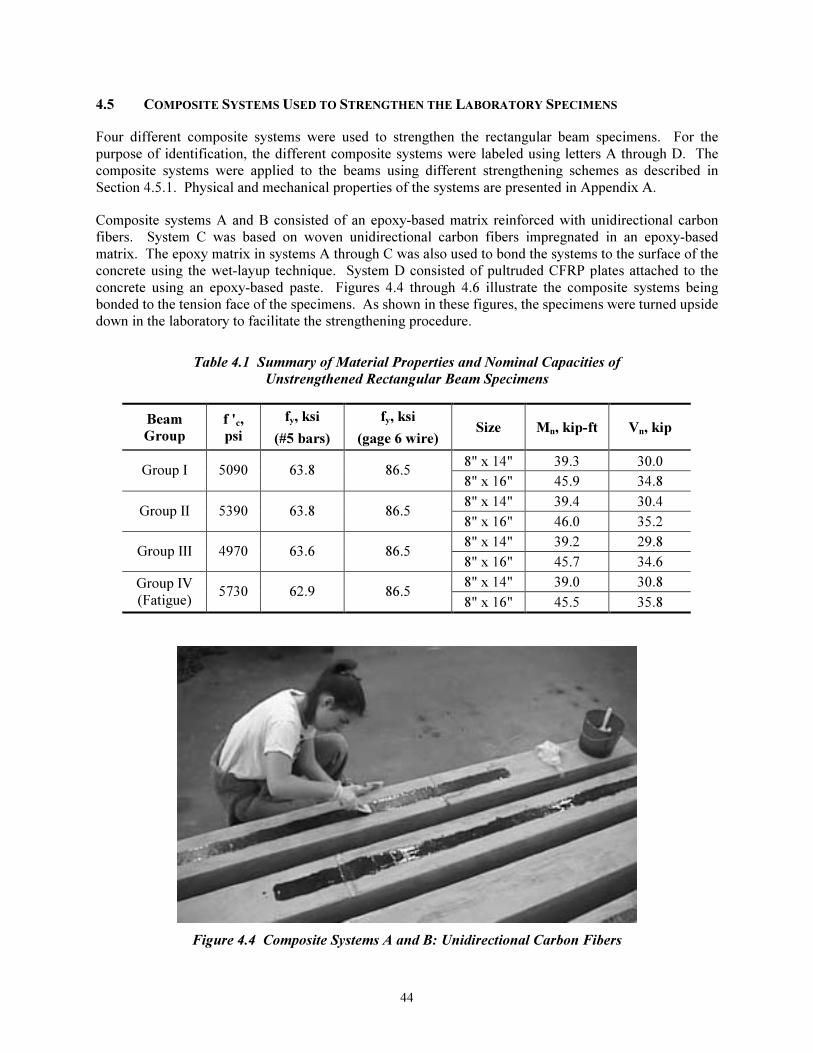
44
4.5 COMPOSITE SYSTEMS USED TO STRENGTHEN THE LABORATORY SPECIMENS
Four different composite systems were used to strengthen the rectangular beam specimens. For the
purpose of identification, the different composite systems were labeled using letters A through D. The
composite systems were applied to the beams using different strengthening schemes as described in
Section 4.5.1. Physical and mechanical properties of the systems are presented in Appendix A.
Composite systems A and B consisted of an epoxy-based matrix reinforced with unidirectional carbon
fibers. System C was based on woven unidirectional carbon fibers impregnated in an epoxy-based
matrix. The epoxy matrix in systems A through C was also used to bond the systems to the surface of the
concrete using the wet-layup technique. System D consisted of pultruded CFRP plates attached to the
concrete using an epoxy-based paste. Figures 4.4 through 4.6 illustrate the composite systems being
bonded to the tension face of the specimens. As shown in these figures, the specimens were turned upside
down in the laboratory to facilitate the strengthening procedure.
Table 4.1 Summary of Material Properties and Nominal Capacities of
Unstrengthened Rectangular Beam Specimens
Beam
Group
f 'c,
psi
fy, ksi
(#5 bars)
fy, ksi
(gage 6 wire) Size Mn, kip-ft Vn, kip
8" x 14" 39.3 30.0 Group I 5090 63.8 86.5
8" x 16" 45.9 34.8
8" x 14" 39.4 30.4 Group II 5390 63.8 86.5
8" x 16" 46.0 35.2
8" x 14" 39.2 29.8 Group III 4970 63.6 86.5
8" x 16" 45.7 34.6
8" x 14" 39.0 30.8 Group IV
(Fatigue) 5730 62.9 86.5
8" x 16" 45.5 35.8
Figure 4.4 Composite Systems A and B: Unidirectional Carbon Fibers
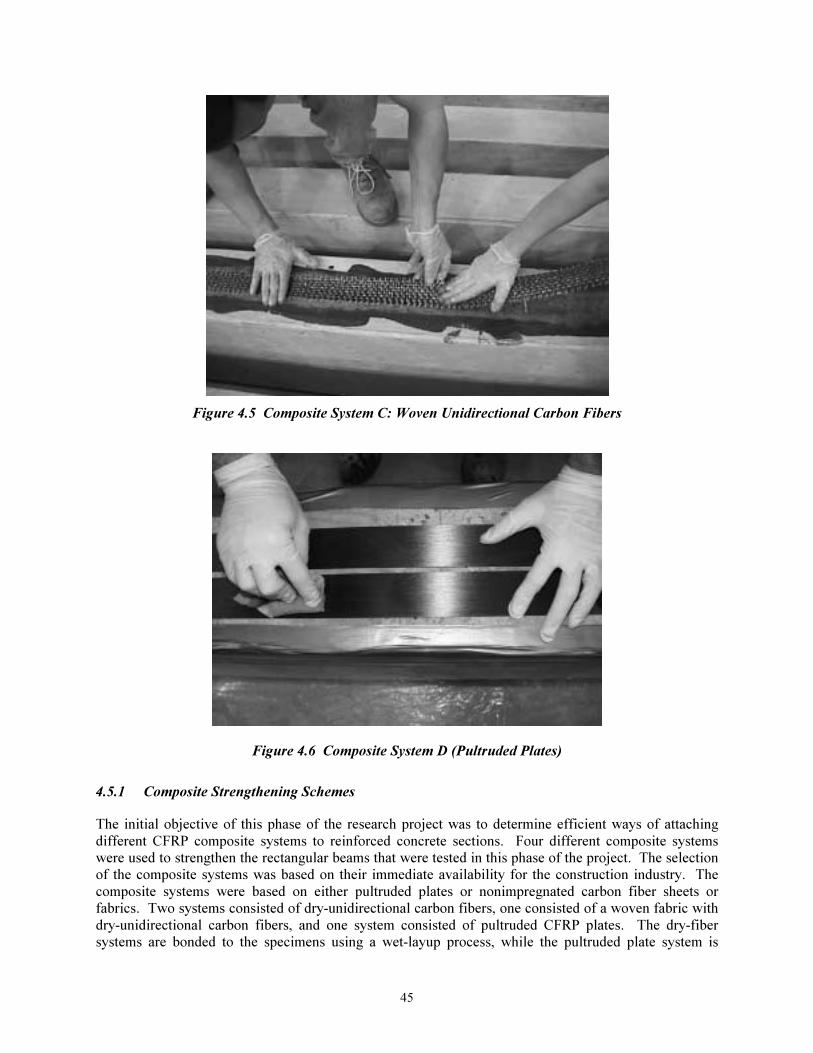
45
Figure 4.5 Composite System C: Woven Unidirectional Carbon Fibers
Figure 4.6 Composite System D (Pultruded Plates)
4.5.1 Composite Strengthening Schemes
The initial objective of this phase of the research project was to determine efficient ways of attaching
different CFRP composite systems to reinforced concrete sections. Four different composite systems
were used to strengthen the rectangular beams that were tested in this phase of the project. The selection
of the composite systems was based on their immediate availability for the construction industry. The
composite systems were based on either pultruded plates or nonimpregnated carbon fiber sheets or
fabrics. Two systems consisted of dry-unidirectional carbon fibers, one consisted of a woven fabric with
dry-unidirectional carbon fibers, and one system consisted of pultruded CFRP plates. The dry-fiber
systems are bonded to the specimens using a wet-layup process, while the pultruded plate system is
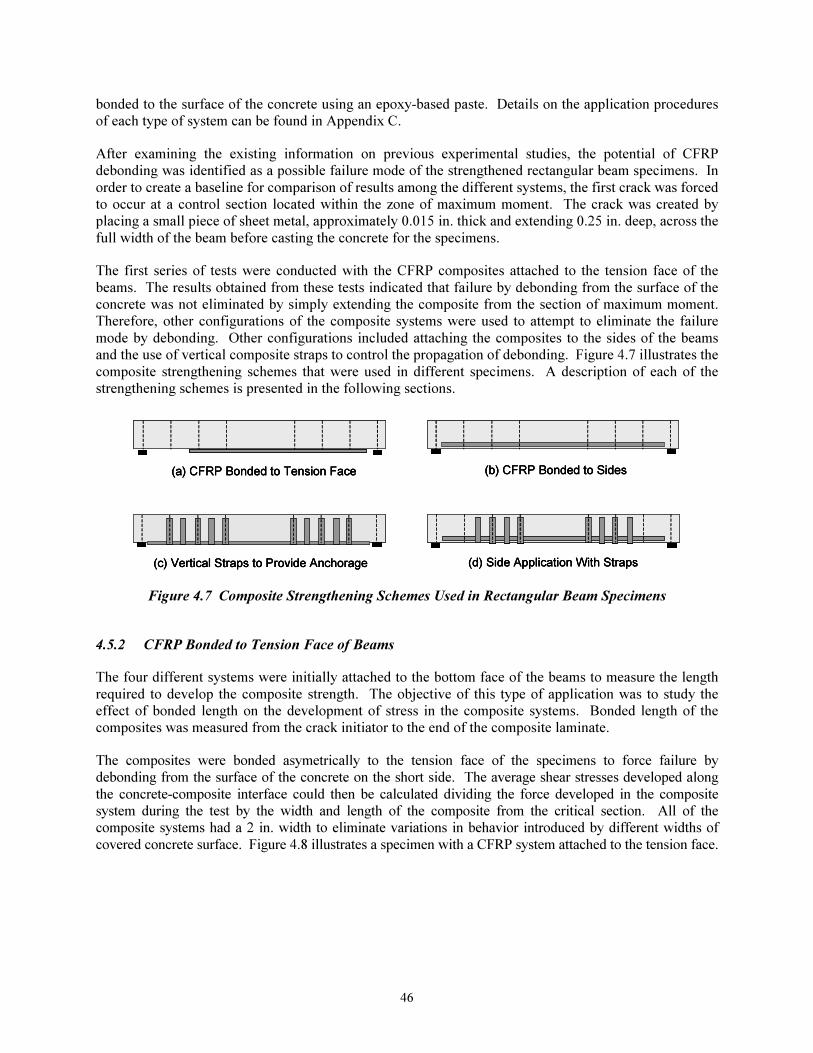
46
bonded to the surface of the concrete using an epoxy-based paste. Details on the application procedures
of each type of system can be found in Appendix C.
After examining the existing information on previous experimental studies, the potential of CFRP
debonding was identified as a possible failure mode of the strengthened rectangular beam specimens. In
order to create a baseline for comparison of results among the different systems, the first crack was forced
to occur at a control section located within the zone of maximum moment. The crack was created by
placing a small piece of sheet metal, approximately 0.015 in. thick and extending 0.25 in. deep, across the
full width of the beam before casting the concrete for the specimens.
The first series of tests were conducted with the CFRP composites attached to the tension face of the
beams. The results obtained from these tests indicated that failure by debonding from the surface of the
concrete was not eliminated by simply extending the composite from the section of maximum moment.
Therefore, other configurations of the composite systems were used to attempt to eliminate the failure
mode by debonding. Other configurations included attaching the composites to the sides of the beams
and the use of vertical composite straps to control the propagation of debonding. Figure 4.7 illustrates the
composite strengthening schemes that were used in different specimens. A description of each of the
strengthening schemes is presented in the following sections.
(a) CFRP Bonded to Tension Face (b) CFRP Bonded to Sides(a) CFRP Bonded to Tension Face(a) CFRP Bonded to Tension Face (b) CFRP Bonded to Sides(b) CFRP Bonded to Sides
(d) Side Application With Straps(c) Vertical Straps to Provide Anchorage (d) Side Application With Straps(d) Side Application With Straps(c) Vertical Straps to Provide Anchorage(c) Vertical Straps to Provide Anchorage
Figure 4.7 Composite Strengthening Schemes Used in Rectangular Beam Specimens
4.5.2 CFRP Bonded to Tension Face of Beams
The four different systems were initially attached to the bottom face of the beams to measure the length
required to develop the composite strength. The objective of this type of application was to study the
effect of bonded length on the development of stress in the composite systems. Bonded length of the
composites was measured from the crack initiator to the end of the composite laminate.
The composites were bonded asymetrically to the tension face of the specimens to force failure by
debonding from the surface of the concrete on the short side. The average shear stresses developed along
the concrete-composite interface could then be calculated dividing the force developed in the composite
system during the test by the width and length of the composite from the critical section. All of the
composite systems had a 2 in. width to eliminate variations in behavior introduced by different widths of
covered concrete surface. Figure 4.8 illustrates a specimen with a CFRP system attached to the tension face.
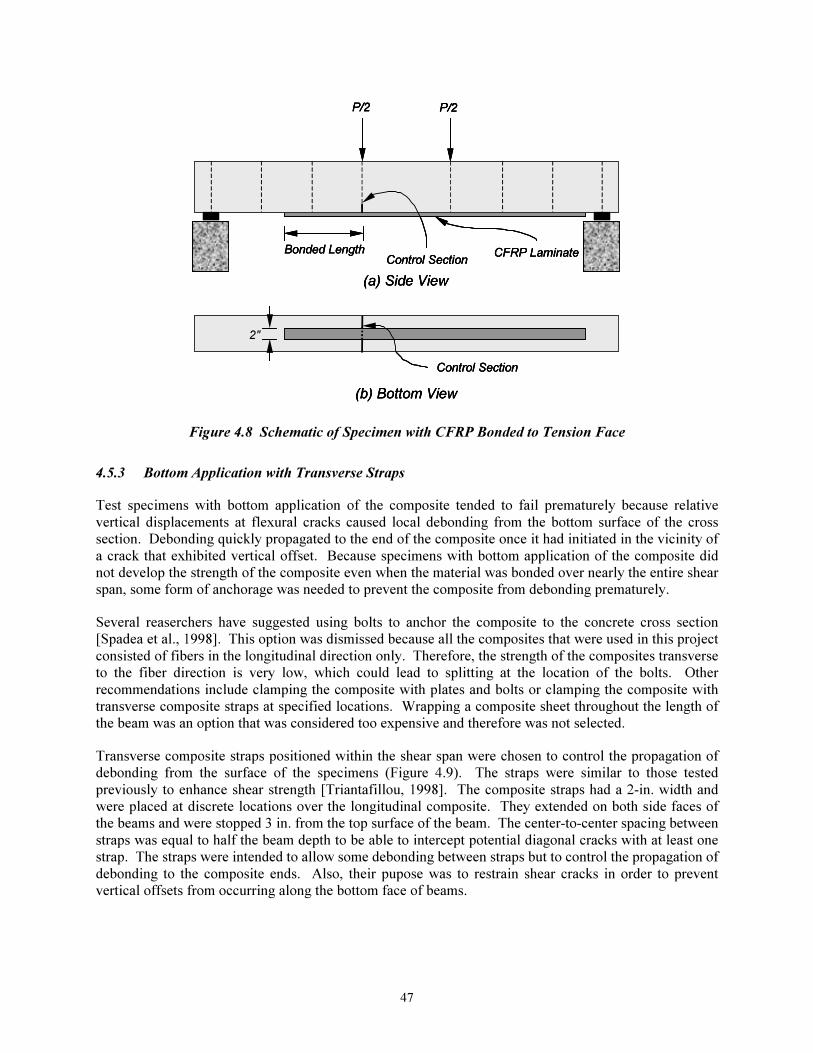
47
(a) Side View
P/2 P/2
Bonded LengthControl Section
CFRP Laminate
(b) Bottom View
2"
Control Section
(a) Side View
P/2 P/2
Bonded LengthControl Section
CFRP Laminate
(a) Side View
P/2 P/2
Bonded LengthControl Section
CFRP Laminate
(b) Bottom View
2"
Control Section
(b) Bottom View
2"
Control Section
Figure 4.8 Schematic of Specimen with CFRP Bonded to Tension Face
4.5.3 Bottom Application with Transverse Straps
Test specimens with bottom application of the composite tended to fail prematurely because relative
vertical displacements at flexural cracks caused local debonding from the bottom surface of the cross
section. Debonding quickly propagated to the end of the composite once it had initiated in the vicinity of
a crack that exhibited vertical offset. Because specimens with bottom application of the composite did
not develop the strength of the composite even when the material was bonded over nearly the entire shear
span, some form of anchorage was needed to prevent the composite from debonding prematurely.
Several reaserchers have suggested using bolts to anchor the composite to the concrete cross section
[Spadea et al., 1998]. This option was dismissed because all the composites that were used in this project
consisted of fibers in the longitudinal direction only. Therefore, the strength of the composites transverse
to the fiber direction is very low, which could lead to splitting at the location of the bolts. Other
recommendations include clamping the composite with plates and bolts or clamping the composite with
transverse composite straps at specified locations. Wrapping a composite sheet throughout the length of
the beam was an option that was considered too expensive and therefore was not selected.
Transverse composite straps positioned within the shear span were chosen to control the propagation of
debonding from the surface of the specimens (Figure 4.9). The straps were similar to those tested
previously to enhance shear strength [Triantafillou, 1998]. The composite straps had a 2-in. width and
were placed at discrete locations over the longitudinal composite. They extended on both side faces of
the beams and were stopped 3 in. from the top surface of the beam. The center-to-center spacing between
straps was equal to half the beam depth to be able to intercept potential diagonal cracks with at least one
strap. The straps were intended to allow some debonding between straps but to control the propagation of
debonding to the composite ends. Also, their pupose was to restrain shear cracks in order to prevent
vertical offsets from occurring along the bottom face of beams.

48
(a) Side View
P/2 P/2
Bonded LengthControl Section
CFRP Laminate
(b) Bottom View
2"
Control Section
(a) Side View
P/2 P/2
Bonded LengthControl Section
CFRP Laminate
(a) Side View
P/2 P/2
Bonded LengthControl Section
CFRP Laminate
(b) Bottom View
2"
Control Section
(b) Bottom View
2"
Control Section
Figure 4.9 Schematic of Specimen with Transverse Straps to Control Debonding
4.5.4 CFRP Bonded to the Sides of Beams
Results from the initial tests of the beams with the composite systems attached to the bottom face of the
beams indicated that debonding initiated at flexural crack locations that exhibited vertical offsets. The
bond between the composite and the surface of the concrete appeared to be weaker in the direction
perpendicular to the surface of the concrete where the composites were attached. Therefore, another
approach to control debonding of the composites was selected by attaching the laminates to the sides of
the beams and reduce the deformations induced by crack movement. This strengthening scheme is
illustrated in Figure 4.10.
(a) Side View
P/2 P/2
Control Section CFRP Laminate
2"
(b) Bottom View
Control Section
(a) Side View
P/2 P/2
Control Section CFRP Laminate
2"
(a) Side View
P/2 P/2
Control Section CFRP Laminate
2"
(b) Bottom View
Control Section
(b) Bottom View
Control Section
Figure 4.10 Schematic of Specimen with CFRP Bonded to Sides
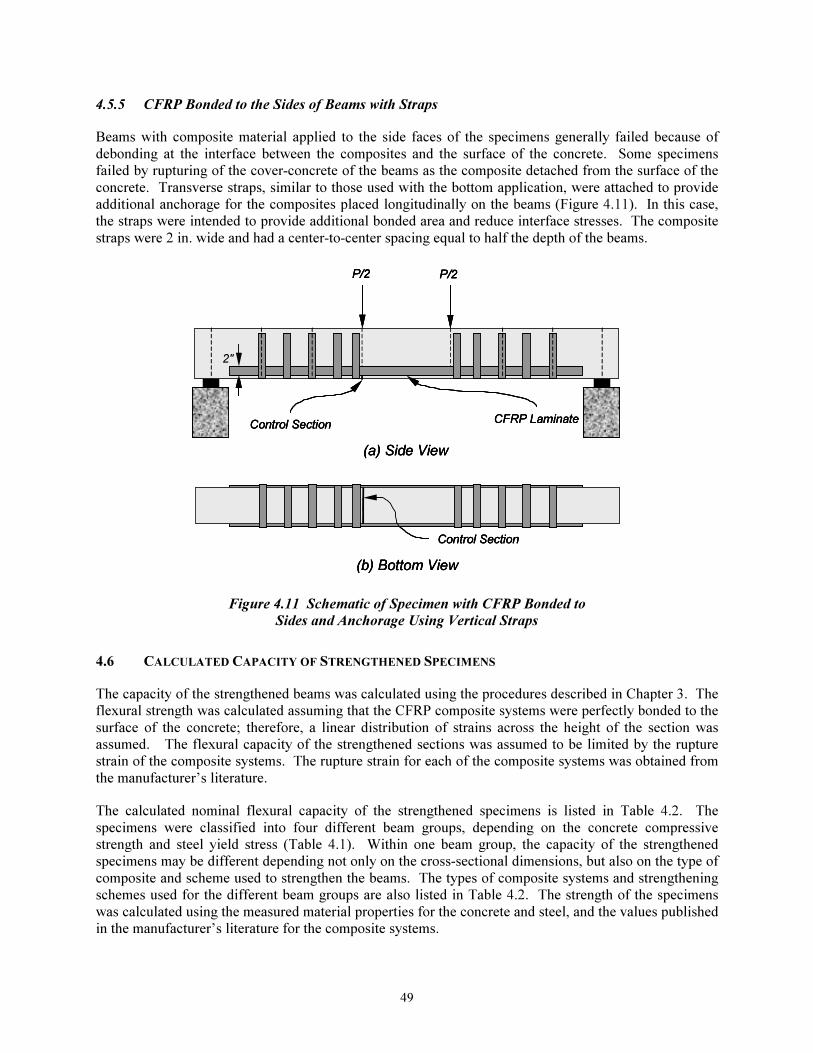
49
4.5.5 CFRP Bonded to the Sides of Beams with Straps
Beams with composite material applied to the side faces of the specimens generally failed because of
debonding at the interface between the composites and the surface of the concrete. Some specimens
failed by rupturing of the cover-concrete of the beams as the composite detached from the surface of the
concrete. Transverse straps, similar to those used with the bottom application, were attached to provide
additional anchorage for the composites placed longitudinally on the beams (Figure 4.11). In this case,
the straps were intended to provide additional bonded area and reduce interface stresses. The composite
straps were 2 in. wide and had a center-to-center spacing equal to half the depth of the beams.
(a) Side View
P/2 P/2
Control SectionCFRP Laminate
2"
(b) Bottom View
Control Section
(a) Side View
P/2 P/2
Control SectionCFRP Laminate
2"
(a) Side View
P/2 P/2
Control SectionCFRP Laminate
2"
(b) Bottom View
Control Section
(b) Bottom View
Control Section
Figure 4.11 Schematic of Specimen with CFRP Bonded to
Sides and Anchorage Using Vertical Straps
4.6 CALCULATED CAPACITY OF STRENGTHENED SPECIMENS
The capacity of the strengthened beams was calculated using the procedures described in Chapter 3. The
flexural strength was calculated assuming that the CFRP composite systems were perfectly bonded to the
surface of the concrete; therefore, a linear distribution of strains across the height of the section was
assumed. The flexural capacity of the strengthened sections was assumed to be limited by the rupture
strain of the composite systems. The rupture strain for each of the composite systems was obtained from
the manufacturer’s literature.
The calculated nominal flexural capacity of the strengthened specimens is listed in Table 4.2. The
specimens were classified into four different beam groups, depending on the concrete compressive
strength and steel yield stress (Table 4.1). Within one beam group, the capacity of the strengthened
specimens may be different depending not only on the cross-sectional dimensions, but also on the type of
composite and scheme used to strengthen the beams. The types of composite systems and strengthening
schemes used for the different beam groups are also listed in Table 4.2. The strength of the specimens
was calculated using the measured material properties for the concrete and steel, and the values published
in the manufacturer’s literature for the composite systems.
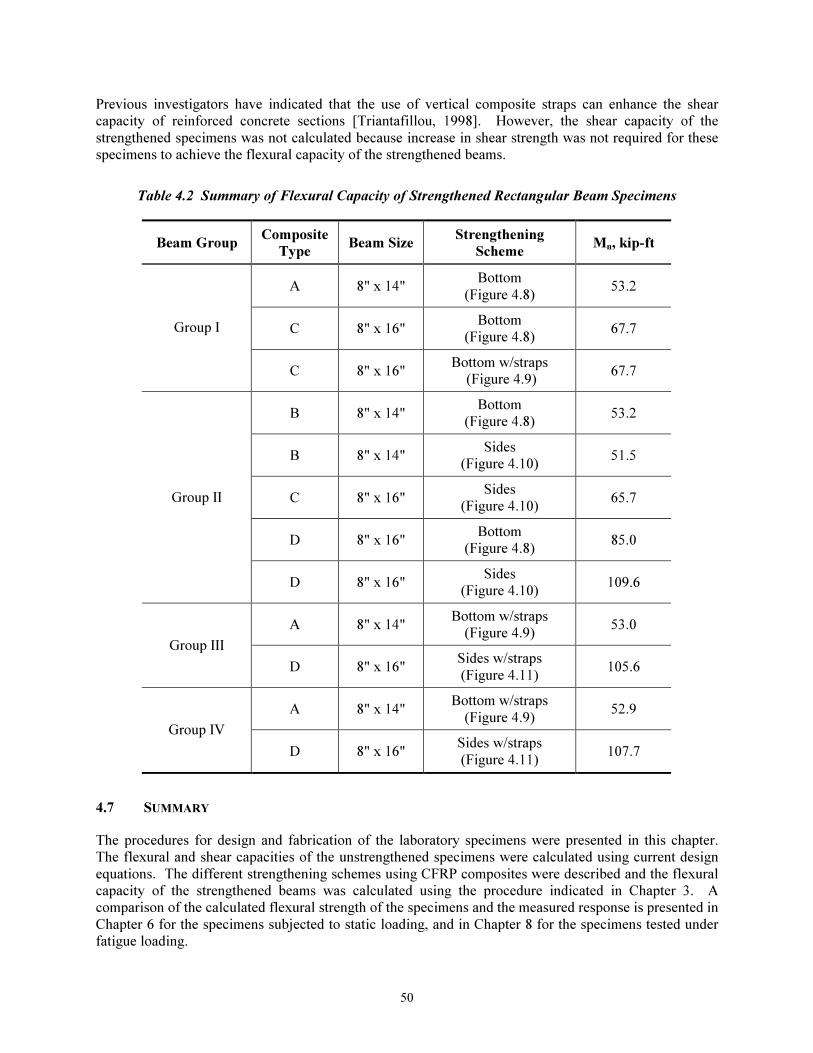
50
Previous investigators have indicated that the use of vertical composite straps can enhance the shear
capacity of reinforced concrete sections [Triantafillou, 1998]. However, the shear capacity of the
strengthened specimens was not calculated because increase in shear strength was not required for these
specimens to achieve the flexural capacity of the strengthened beams.
Table 4.2 Summary of Flexural Capacity of Strengthened Rectangular Beam Specimens
Beam Group Composite
Type Beam Size
Strengthening
Scheme Mn, kip-ft
A 8" x 14" Bottom
(Figure 4.8) 53.2
C 8" x 16" Bottom
(Figure 4.8) 67.7 Group I
C 8" x 16" Bottom w/straps
(Figure 4.9) 67.7
B 8" x 14" Bottom
(Figure 4.8) 53.2
B 8" x 14" Sides
(Figure 4.10) 51.5
C 8" x 16" Sides
(Figure 4.10) 65.7
D 8" x 16" Bottom
(Figure 4.8) 85.0
Group II
D 8" x 16" Sides
(Figure 4.10) 109.6
A 8" x 14" Bottom w/straps
(Figure 4.9) 53.0
Group III
D 8" x 16" Sides w/straps
(Figure 4.11) 105.6
A 8" x 14" Bottom w/straps
(Figure 4.9) 52.9
Group IV
D 8" x 16" Sides w/straps
(Figure 4.11) 107.7
4.7 SUMMARY
The procedures for design and fabrication of the laboratory specimens were presented in this chapter.
The flexural and shear capacities of the unstrengthened specimens were calculated using current design
equations. The different strengthening schemes using CFRP composites were described and the flexural
capacity of the strengthened beams was calculated using the procedure indicated in Chapter 3. A
comparison of the calculated flexural strength of the specimens and the measured response is presented in
Chapter 6 for the specimens subjected to static loading, and in Chapter 8 for the specimens tested under
fatigue loading.
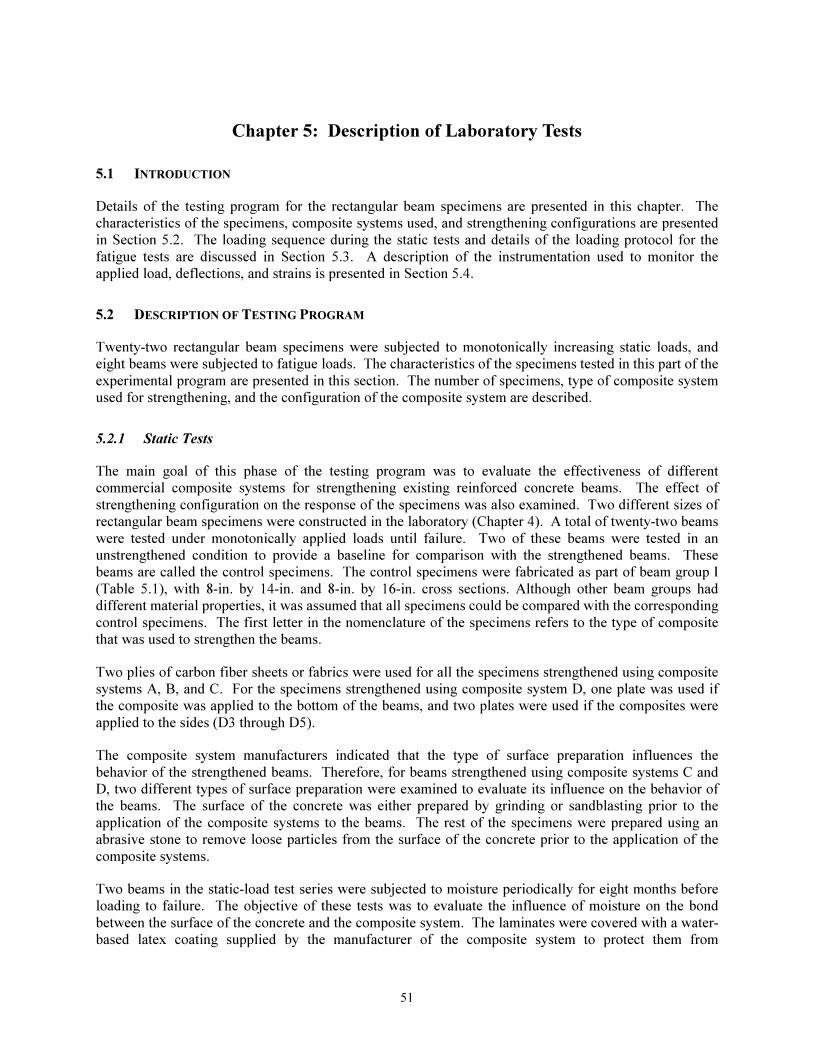
51
Chapter 5: Description of Laboratory Tests
5.1 INTRODUCTION
Details of the testing program for the rectangular beam specimens are presented in this chapter. The
characteristics of the specimens, composite systems used, and strengthening configurations are presented
in Section 5.2. The loading sequence during the static tests and details of the loading protocol for the
fatigue tests are discussed in Section 5.3. A description of the instrumentation used to monitor the
applied load, deflections, and strains is presented in Section 5.4.
5.2 DESCRIPTION OF TESTING PROGRAM
Twenty-two rectangular beam specimens were subjected to monotonically increasing static loads, and
eight beams were subjected to fatigue loads. The characteristics of the specimens tested in this part of the
experimental program are presented in this section. The number of specimens, type of composite system
used for strengthening, and the configuration of the composite system are described.
5.2.1 Static Tests
The main goal of this phase of the testing program was to evaluate the effectiveness of different
commercial composite systems for strengthening existing reinforced concrete beams. The effect of
strengthening configuration on the response of the specimens was also examined. Two different sizes of
rectangular beam specimens were constructed in the laboratory (Chapter 4). A total of twenty-two beams
were tested under monotonically applied loads until failure. Two of these beams were tested in an
unstrengthened condition to provide a baseline for comparison with the strengthened beams. These
beams are called the control specimens. The control specimens were fabricated as part of beam group I
(Table 5.1), with 8-in. by 14-in. and 8-in. by 16-in. cross sections. Although other beam groups had
different material properties, it was assumed that all specimens could be compared with the corresponding
control specimens. The first letter in the nomenclature of the specimens refers to the type of composite
that was used to strengthen the beams.
Two plies of carbon fiber sheets or fabrics were used for all the specimens strengthened using composite
systems A, B, and C. For the specimens strengthened using composite system D, one plate was used if
the composite was applied to the bottom of the beams, and two plates were used if the composites were
applied to the sides (D3 through D5).
The composite system manufacturers indicated that the type of surface preparation influences the
behavior of the strengthened beams. Therefore, for beams strengthened using composite systems C and
D, two different types of surface preparation were examined to evaluate its influence on the behavior of
the beams. The surface of the concrete was either prepared by grinding or sandblasting prior to the
application of the composite systems to the beams. The rest of the specimens were prepared using an
abrasive stone to remove loose particles from the surface of the concrete prior to the application of the
composite systems.
Two beams in the static-load test series were subjected to moisture periodically for eight months before
loading to failure. The objective of these tests was to evaluate the influence of moisture on the bond
between the surface of the concrete and the composite system. The laminates were covered with a water-
based latex coating supplied by the manufacturer of the composite system to protect them from
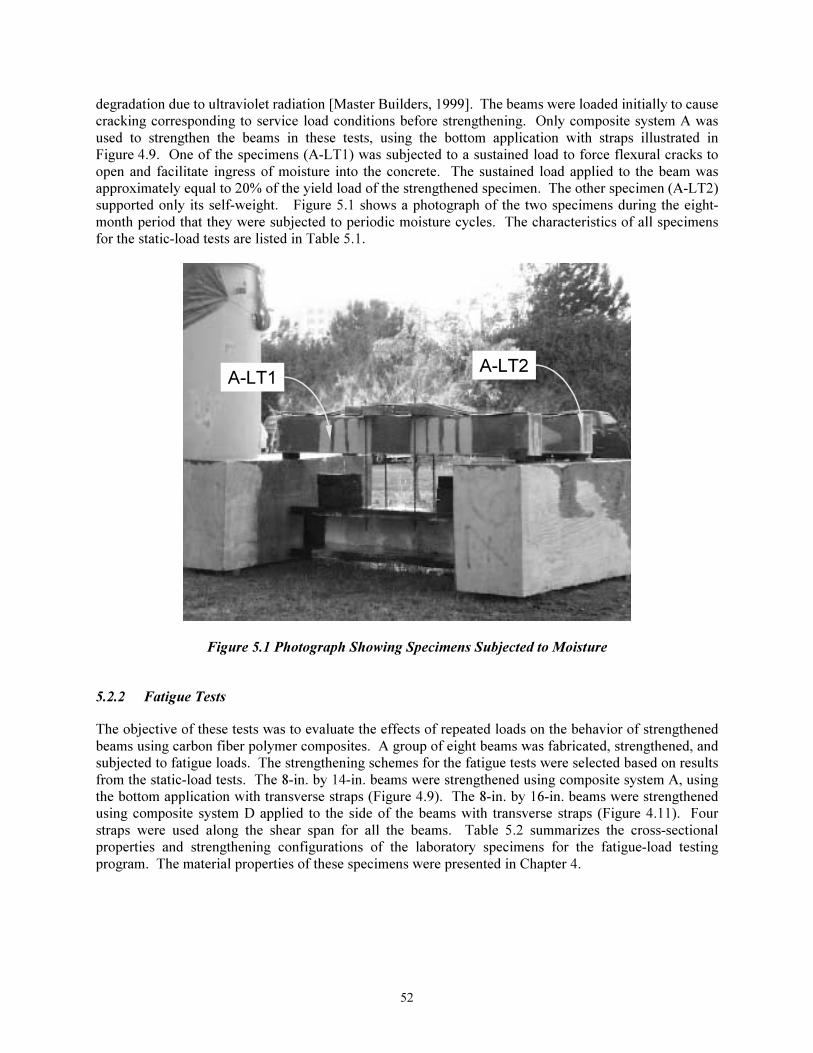
52
degradation due to ultraviolet radiation [Master Builders, 1999]. The beams were loaded initially to cause
cracking corresponding to service load conditions before strengthening. Only composite system A was
used to strengthen the beams in these tests, using the bottom application with straps illustrated in
Figure 4.9. One of the specimens (A-LT1) was subjected to a sustained load to force flexural cracks to
open and facilitate ingress of moisture into the concrete. The sustained load applied to the beam was
approximately equal to 20% of the yield load of the strengthened specimen. The other specimen (A-LT2)
supported only its self-weight. Figure 5.1 shows a photograph of the two specimens during the eight-
month period that they were subjected to periodic moisture cycles. The characteristics of all specimens
for the static-load tests are listed in Table 5.1.
A-LT1A-LT2
A-LT1A-LT2
Figure 5.1 Photograph Showing Specimens Subjected to Moisture
5.2.2 Fatigue Tests
The objective of these tests was to evaluate the effects of repeated loads on the behavior of strengthened
beams using carbon fiber polymer composites. A group of eight beams was fabricated, strengthened, and
subjected to fatigue loads. The strengthening schemes for the fatigue tests were selected based on results
from the static-load tests. The 8-in. by 14-in. beams were strengthened using composite system A, using
the bottom application with transverse straps (Figure 4.9). The 8-in. by 16-in. beams were strengthened
using composite system D applied to the side of the beams with transverse straps (Figure 4.11). Four
straps were used along the shear span for all the beams. Table 5.2 summarizes the cross-sectional
properties and strengthening configurations of the laboratory specimens for the fatigue-load testing
program. The material properties of these specimens were presented in Chapter 4.
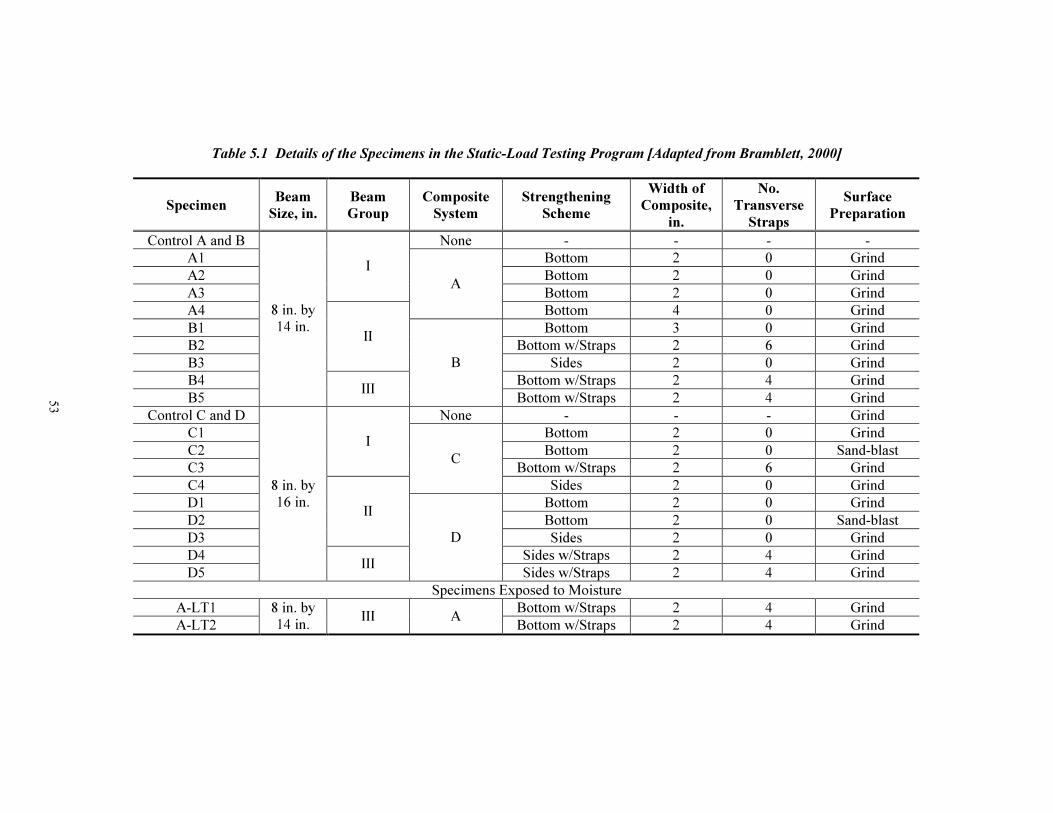
53
Table 5.1 Details of the Specimens in the Static-Load Testing Program [Adapted from Bramblett, 2000]
Specimen Beam
Size, in.
Beam
Group
Composite
System
Strengthening
Scheme
Width of
Composite,
in.
No.
Transverse
Straps
Surface
Preparation
Control A and B None - - - -
A1 Bottom 2 0 Grind
A2 Bottom 2 0 Grind
A3
I
Bottom 2 0 Grind
A4
A
Bottom 4 0 Grind
B1 Bottom 3 0 Grind
B2 Bottom w/Straps 2 6 Grind
B3
II
Sides 2 0 Grind
B4 Bottom w/Straps 2 4 Grind
B5
8 in. by
14 in.
III
B
Bottom w/Straps 2 4 Grind
Control C and D None - - - Grind
C1 Bottom 2 0 Grind
C2 Bottom 2 0 Sand-blast
C3
I
Bottom w/Straps 2 6 Grind
C4
C
Sides 2 0 Grind
D1 Bottom 2 0 Grind
D2 Bottom 2 0 Sand-blast
D3
II
Sides 2 0 Grind
D4 Sides w/Straps 2 4 Grind
D5
8 in. by
16 in.
III
D
Sides w/Straps 2 4 Grind
Specimens Exposed to Moisture
A-LT1 Bottom w/Straps 2 4 Grind
A-LT2
8 in. by
14 in. III A
Bottom w/Straps 2 4 Grind
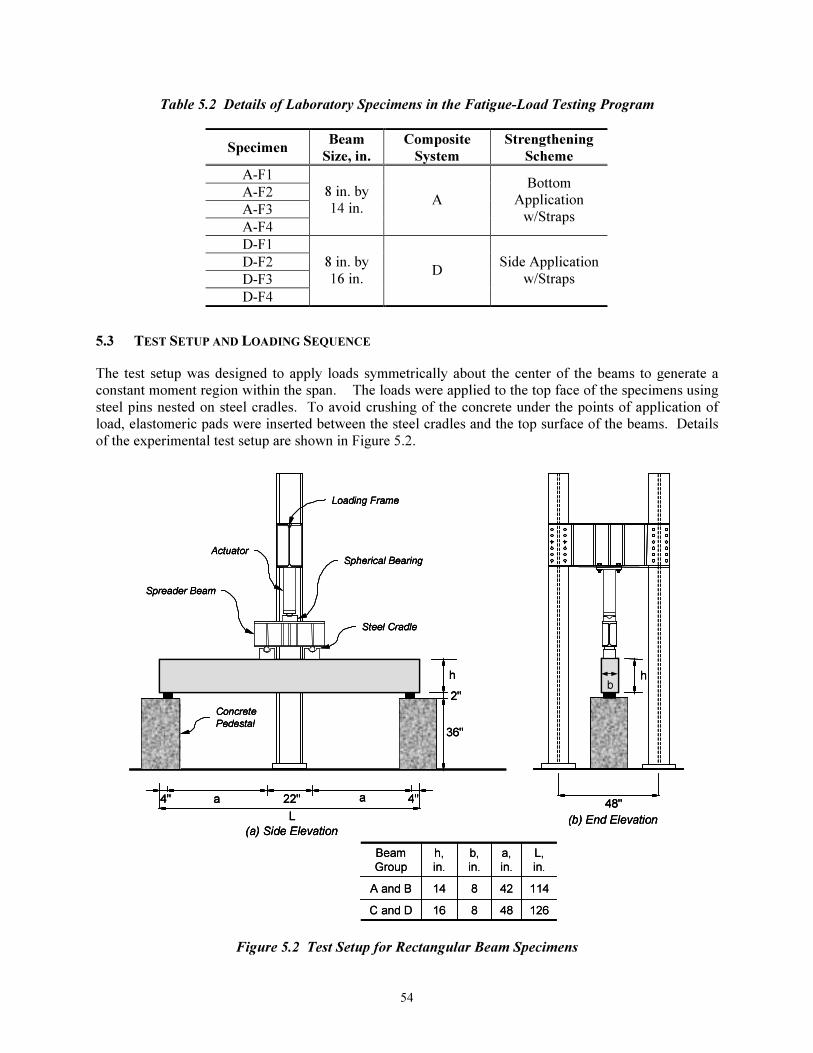
54
Table 5.2 Details of Laboratory Specimens in the Fatigue-Load Testing Program
Specimen Beam
Size, in.
Composite
System
Strengthening
Scheme
A-F1
A-F2
A-F3
A-F4
8 in. by
14 in. A
Bottom
Application
w/Straps
D-F1
D-F2
D-F3
D-F4
8 in. by
16 in. D
Side Application
w/Straps
5.3 TEST SETUP AND LOADING SEQUENCE
The test setup was designed to apply loads symmetrically about the center of the beams to generate a
constant moment region within the span. The loads were applied to the top face of the specimens using
steel pins nested on steel cradles. To avoid crushing of the concrete under the points of application of
load, elastomeric pads were inserted between the steel cradles and the top surface of the beams. Details
of the experimental test setup are shown in Figure 5.2.
12648816C and D
11442814A and B
L,
in.
a,
in.
b,
in.
h,
in.
Beam
Group
12648816C and D
11442814A and B
L,
in.
a,
in.
b,
in.
h,
in.
Beam
Group
L
a 22" a 4"
36"
2"
h
4"
(a) Side Elevation
ActuatorSpherical Bearing
Loading Frame
Spreader Beam
Steel Cradle
Concrete
Pedestal
48"
h
(b) End Elevation
b
L
a 22" a 4"
36"
2"
h
4"
(a) Side Elevation
ActuatorSpherical Bearing
Loading Frame
Spreader Beam
Steel Cradle
Concrete
Pedestal
L
a 22" a 4"
36"
2"
h
4"
(a) Side Elevation
ActuatorSpherical Bearing
Loading Frame
Spreader Beam
Steel Cradle
Concrete
Pedestal
48"
h
(b) End Elevation
b
48"
h
(b) End Elevation
b
Figure 5.2 Test Setup for Rectangular Beam Specimens
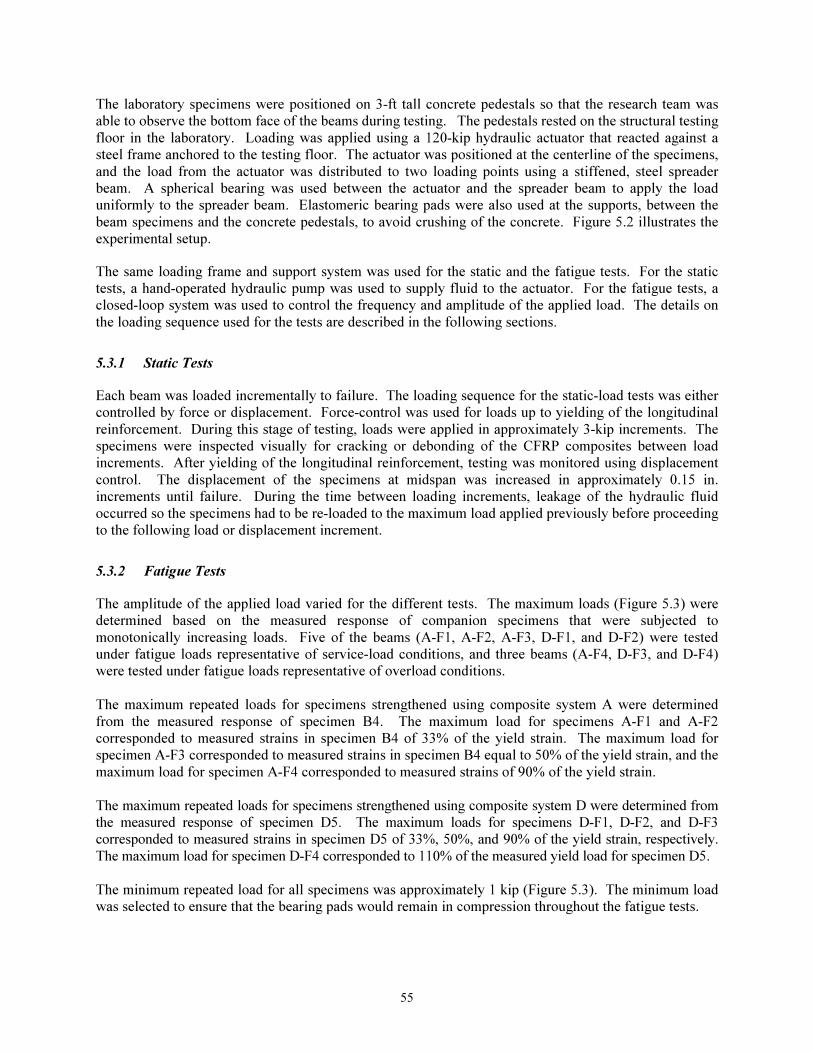
55
The laboratory specimens were positioned on 3-ft tall concrete pedestals so that the research team was
able to observe the bottom face of the beams during testing. The pedestals rested on the structural testing
floor in the laboratory. Loading was applied using a 120-kip hydraulic actuator that reacted against a
steel frame anchored to the testing floor. The actuator was positioned at the centerline of the specimens,
and the load from the actuator was distributed to two loading points using a stiffened, steel spreader
beam. A spherical bearing was used between the actuator and the spreader beam to apply the load
uniformly to the spreader beam. Elastomeric bearing pads were also used at the supports, between the
beam specimens and the concrete pedestals, to avoid crushing of the concrete. Figure 5.2 illustrates the
experimental setup.
The same loading frame and support system was used for the static and the fatigue tests. For the static
tests, a hand-operated hydraulic pump was used to supply fluid to the actuator. For the fatigue tests, a
closed-loop system was used to control the frequency and amplitude of the applied load. The details on
the loading sequence used for the tests are described in the following sections.
5.3.1 Static Tests
Each beam was loaded incrementally to failure. The loading sequence for the static-load tests was either
controlled by force or displacement. Force-control was used for loads up to yielding of the longitudinal
reinforcement. During this stage of testing, loads were applied in approximately 3-kip increments. The
specimens were inspected visually for cracking or debonding of the CFRP composites between load
increments. After yielding of the longitudinal reinforcement, testing was monitored using displacement
control. The displacement of the specimens at midspan was increased in approximately 0.15 in.
increments until failure. During the time between loading increments, leakage of the hydraulic fluid
occurred so the specimens had to be re-loaded to the maximum load applied previously before proceeding
to the following load or displacement increment.
5.3.2 Fatigue Tests
The amplitude of the applied load varied for the different tests. The maximum loads (Figure 5.3) were
determined based on the measured response of companion specimens that were subjected to
monotonically increasing loads. Five of the beams (A-F1, A-F2, A-F3, D-F1, and D-F2) were tested
under fatigue loads representative of service-load conditions, and three beams (A-F4, D-F3, and D-F4)
were tested under fatigue loads representative of overload conditions.
The maximum repeated loads for specimens strengthened using composite system A were determined
from the measured response of specimen B4. The maximum load for specimens A-F1 and A-F2
corresponded to measured strains in specimen B4 of 33% of the yield strain. The maximum load for
specimen A-F3 corresponded to measured strains in specimen B4 equal to 50% of the yield strain, and the
maximum load for specimen A-F4 corresponded to measured strains of 90% of the yield strain.
The maximum repeated loads for specimens strengthened using composite system D were determined from
the measured response of specimen D5. The maximum loads for specimens D-F1, D-F2, and D-F3
corresponded to measured strains in specimen D5 of 33%, 50%, and 90% of the yield strain, respectively.
The maximum load for specimen D-F4 corresponded to 110% of the measured yield load for specimen D5.
The minimum repeated load for all specimens was approximately 1 kip (Figure 5.3). The minimum load
was selected to ensure that the bearing pads would remain in compression throughout the fatigue tests.
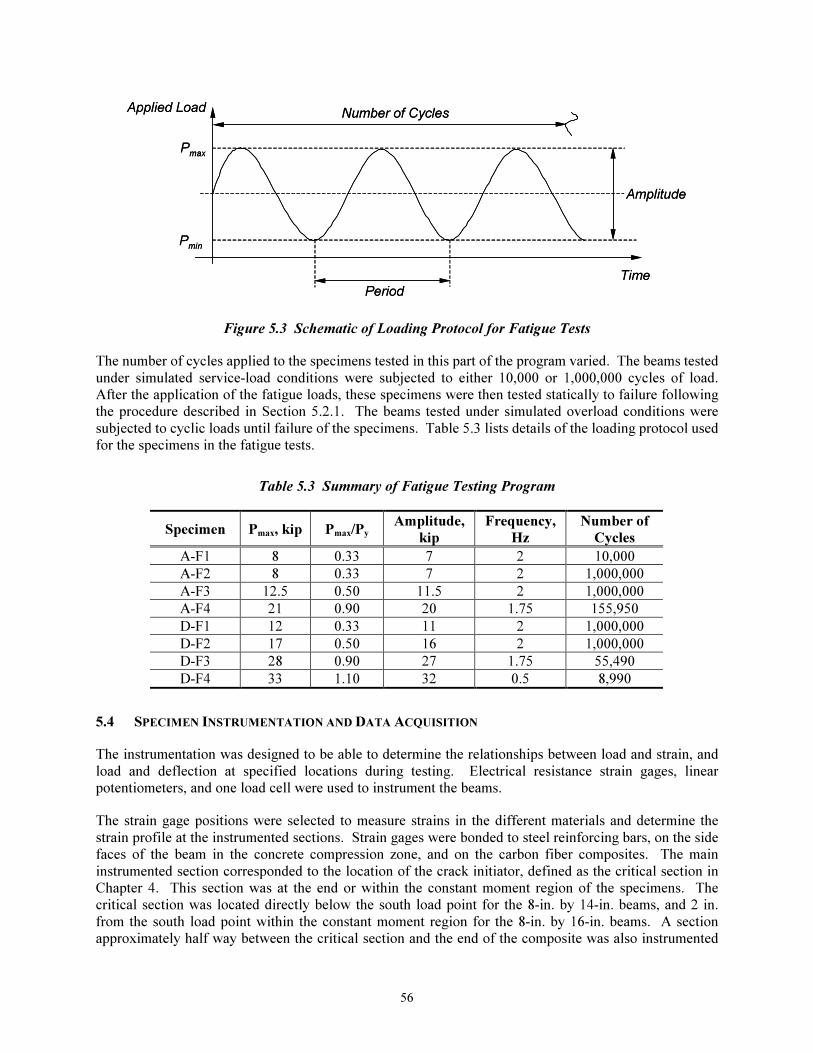
56
Applied Load
Pmax
Pmin
Time
Amplitude
Number of Cycles
Period
Applied Load
Pmax
Pmin
Time
Amplitude
Number of Cycles
Period
Figure 5.3 Schematic of Loading Protocol for Fatigue Tests
The number of cycles applied to the specimens tested in this part of the program varied. The beams tested
under simulated service-load conditions were subjected to either 10,000 or 1,000,000 cycles of load.
After the application of the fatigue loads, these specimens were then tested statically to failure following
the procedure described in Section 5.2.1. The beams tested under simulated overload conditions were
subjected to cyclic loads until failure of the specimens. Table 5.3 lists details of the loading protocol used
for the specimens in the fatigue tests.
Table 5.3 Summary of Fatigue Testing Program
Specimen Pmax, kip Pmax/Py Amplitude,
kip
Frequency,
Hz
Number of
Cycles
A-F1 8 0.33 7 2 10,000
A-F2 8 0.33 7 2 1,000,000
A-F3 12.5 0.50 11.5 2 1,000,000
A-F4 21 0.90 20 1.75 155,950
D-F1 12 0.33 11 2 1,000,000
D-F2 17 0.50 16 2 1,000,000
D-F3 28 0.90 27 1.75 55,490
D-F4 33 1.10 32 0.5 8,990
5.4 SPECIMEN INSTRUMENTATION AND DATA ACQUISITION
The instrumentation was designed to be able to determine the relationships between load and strain, and
load and deflection at specified locations during testing. Electrical resistance strain gages, linear
potentiometers, and one load cell were used to instrument the beams.
The strain gage positions were selected to measure strains in the different materials and determine the
strain profile at the instrumented sections. Strain gages were bonded to steel reinforcing bars, on the side
faces of the beam in the concrete compression zone, and on the carbon fiber composites. The main
instrumented section corresponded to the location of the crack initiator, defined as the critical section in
Chapter 4. This section was at the end or within the constant moment region of the specimens. The
critical section was located directly below the south load point for the 8-in. by 14-in. beams, and 2 in.
from the south load point within the constant moment region for the 8-in. by 16-in. beams. A section
approximately half way between the critical section and the end of the composite was also instrumented
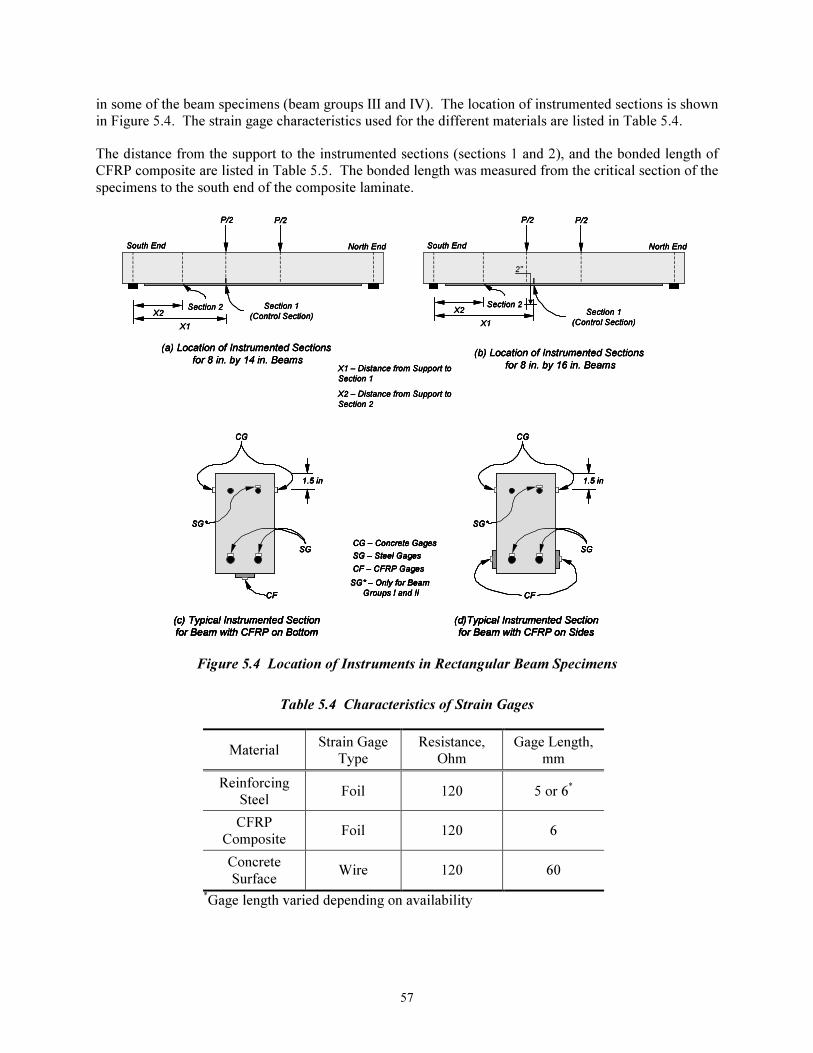
57
in some of the beam specimens (beam groups III and IV). The location of instrumented sections is shown
in Figure 5.4. The strain gage characteristics used for the different materials are listed in Table 5.4.
The distance from the support to the instrumented sections (sections 1 and 2), and the bonded length of
CFRP composite are listed in Table 5.5. The bonded length was measured from the critical section of the
specimens to the south end of the composite laminate.
X1 – Distance from Support to
Section 1
X2 – Distance from Support to
Section 2
1.5 in
SG
CG
CF
(c) Typical Instrumented Section
for Beam with CFRP on Bottom
SG*
CG – Concrete Gages
SG – Steel Gages
CF – CFRP Gages
SG* – Only for Beam
Groups I and II
1.5 in
SG
CG
CF
(d)Typical Instrumented Section
for Beam with CFRP on Sides
SG*
(a) Location of Instrumented Sections
for 8 in. by 14 in. Beams
P/2 P/2
X1
Section 1
(Control Section)X2
South End North End
Section 2
P/2 P/2
X1
Section 1
(Control Section)
X2
South End North End
(b) Location of Instrumented Sections
for 8 in. by 16 in. Beams
2"
Section 2
X1 – Distance from Support to
Section 1
X2 – Distance from Support to
Section 2
X1 – Distance from Support to
Section 1
X2 – Distance from Support to
Section 2
1.5 in
SG
CG
CF
(c) Typical Instrumented Section
for Beam with CFRP on Bottom
SG*
CG – Concrete Gages
SG – Steel Gages
CF – CFRP Gages
SG* – Only for Beam
Groups I and II
1.5 in
SG
CG
CF
(d)Typical Instrumented Section
for Beam with CFRP on Sides
SG*
1.5 in
SG
CG
CF
(c) Typical Instrumented Section
for Beam with CFRP on Bottom
SG*
1.5 in
SG
CG
CF
(c) Typical Instrumented Section
for Beam with CFRP on Bottom
SG*
CG – Concrete Gages
SG – Steel Gages
CF – CFRP Gages
SG* – Only for Beam
Groups I and II
CG – Concrete Gages
SG – Steel Gages
CF – CFRP Gages
SG* – Only for Beam
Groups I and II
1.5 in
SG
CG
CF
(d)Typical Instrumented Section
for Beam with CFRP on Sides
SG*
1.5 in
SG
CG
CF
(d)Typical Instrumented Section
for Beam with CFRP on Sides
SG*
(a) Location of Instrumented Sections
for 8 in. by 14 in. Beams
P/2 P/2
X1
Section 1
(Control Section)X2
South End North End
Section 2
(a) Location of Instrumented Sections
for 8 in. by 14 in. Beams
P/2 P/2
X1
Section 1
(Control Section)X2
South End North End
Section 2
P/2 P/2
X1
Section 1
(Control Section)
X2
South End North End
(b) Location of Instrumented Sections
for 8 in. by 16 in. Beams
2"
Section 2
P/2 P/2
X1
Section 1
(Control Section)
X2
South End North End
(b) Location of Instrumented Sections
for 8 in. by 16 in. Beams
2"
Section 2
Figure 5.4 Location of Instruments in Rectangular Beam Specimens
Table 5.4 Characteristics of Strain Gages
Material Strain Gage
Type
Resistance,
Ohm
Gage Length,
mm
Reinforcing
Steel Foil 120 5 or 6*
CFRP
Composite Foil 120 6
Concrete
Surface Wire 120 60
*Gage length varied depending on availability
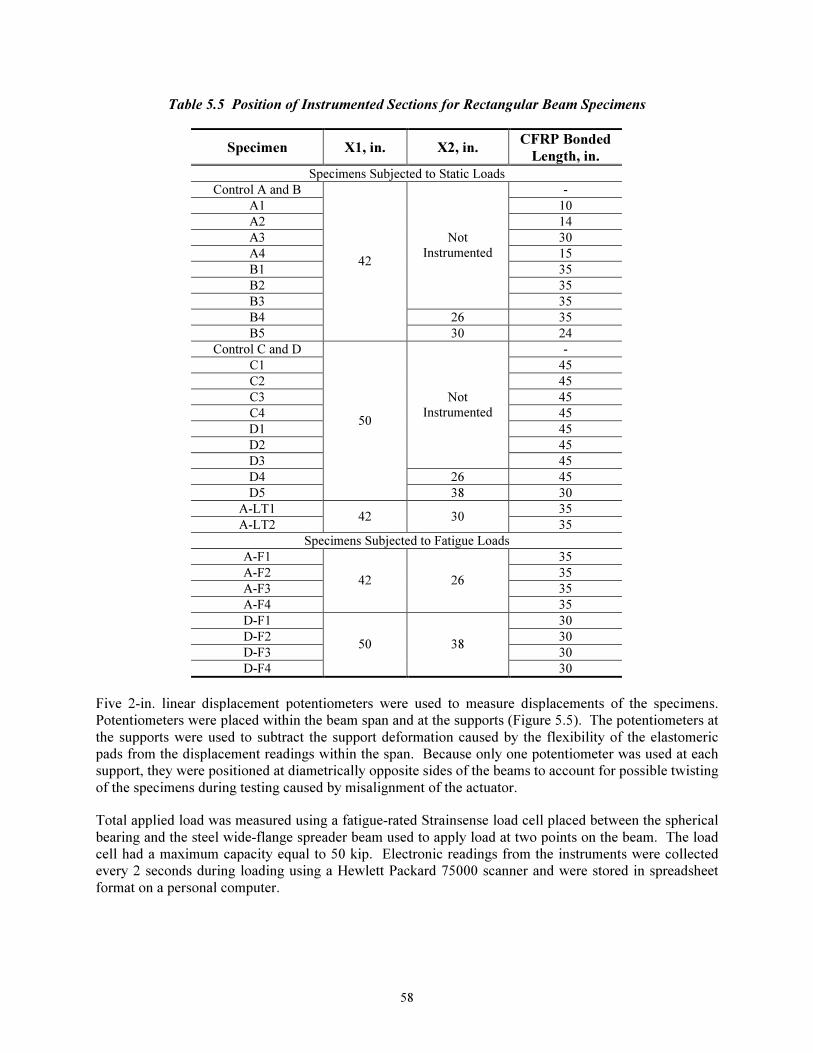
58
Table 5.5 Position of Instrumented Sections for Rectangular Beam Specimens
Specimen X1, in. X2, in. CFRP Bonded
Length, in.
Specimens Subjected to Static Loads
Control A and B -
A1 10
A2 14
A3 30
A4 15
B1 35
B2 35
B3
Not
Instrumented
35
B4 26 35
B5
42
30 24
Control C and D -
C1 45
C2 45
C3 45
C4 45
D1 45
D2 45
D3
Not
Instrumented
45
D4 26 45
D5
50
38 30
A-LT1 35
A-LT2 42 30
35
Specimens Subjected to Fatigue Loads
A-F1 35
A-F2 35
A-F3 35
A-F4
42 26
35
D-F1 30
D-F2 30
D-F3 30
D-F4
50 38
30
Five 2-in. linear displacement potentiometers were used to measure displacements of the specimens.
Potentiometers were placed within the beam span and at the supports (Figure 5.5). The potentiometers at
the supports were used to subtract the support deformation caused by the flexibility of the elastomeric
pads from the displacement readings within the span. Because only one potentiometer was used at each
support, they were positioned at diametrically opposite sides of the beams to account for possible twisting
of the specimens during testing caused by misalignment of the actuator.
Total applied load was measured using a fatigue-rated Strainsense load cell placed between the spherical
bearing and the steel wide-flange spreader beam used to apply load at two points on the beam. The load
cell had a maximum capacity equal to 50 kip. Electronic readings from the instruments were collected
every 2 seconds during loading using a Hewlett Packard 75000 scanner and were stored in spreadsheet
format on a personal computer.
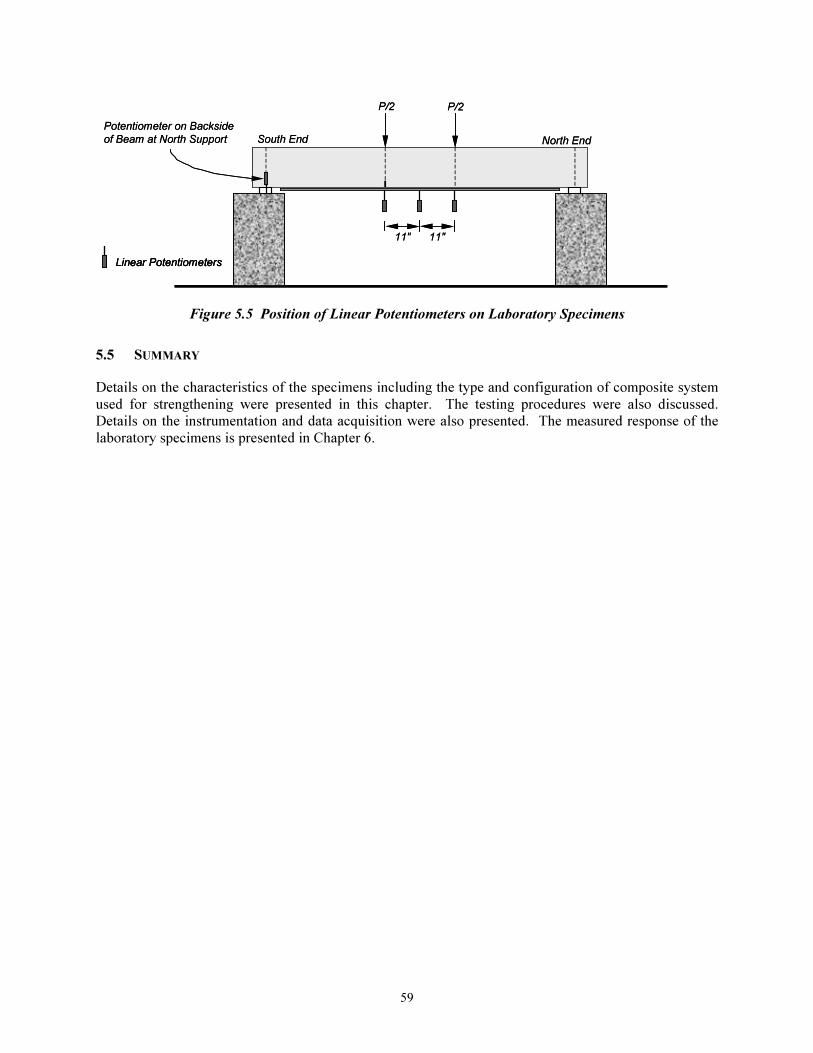
59
P/2 P/2
11"
South End North End
Potentiometer on Backside
of Beam at North Support
Linear Potentiometers
11"
P/2 P/2
11"
South End North End
Potentiometer on Backside
of Beam at North Support
Linear PotentiometersLinear Potentiometers
11"
Figure 5.5 Position of Linear Potentiometers on Laboratory Specimens
5.5 SUMMARY
Details on the characteristics of the specimens including the type and configuration of composite system
used for strengthening were presented in this chapter. The testing procedures were also discussed.
Details on the instrumentation and data acquisition were also presented. The measured response of the
laboratory specimens is presented in Chapter 6.

60

61
Chapter 6: Measured Response of Beams Subjected to Static Loads
6.1 INTRODUCTION
The response of the specimens subjected to static loads is presented in this chapter. The observed
behavior of the specimens during the tests is presented in Section 6.2. The differences in behavior caused
by the use of different strengthening schemes are discussed. The mechanisms that led to failure of the
specimens are also presented and discussed in this section. A discussion of the measured load-deflection
response of the different groups of beams is presented in Section 6.3. The variables that were included in
each of the different groups are presented, and their effect on the measured response is discussed. Finally,
the typical measured strain response of the specimens is presented in Section 6.4. The discussion
presented in this section centers about the response of one of the specimens because similar features were
observed in all the specimens. Measured load-strain plots for all the specimens are presented in
Appendix D.
6.2 OBSERVED RESPONSE OF SPECIMENS DURING TESTING
The observed response of the specimens during the static tests are presented in this section. Although the
trends in the global behavior of all the strengthened specimens were similar regardless of which composite
system was used for strengthening, the propagation of debonding of the CFRP composites was significantly
different depending on the strengthening scheme. Because of this, it was considered important to include a
description of the sequence of debonding for each of the strengthening schemes. A qualitative description
of the global response of the specimens is presented in Section 6.2.5.
Crack formation and crack widths were monitored and measured throughout testing to assess the behavior
of the strengthened specimens in comparison with the behavior of the unstrengthened control beams.
However, no significant differences in the cracking patterns and crack widths were observed between the
specimens strengthened using different CFRP schemes. Therefore, the cracking patterns for the
specimens are not discussed here. Only the formation of cracks that led to debonding of the composites
from the surface of the concrete are discussed in this section. The crack patterns and widths of all the
specimens at failure are presented in Appendix B.
6.2.1 Beams Strengthened Using CFRP Bonded to the Tension Face
The observed response of all the strengthened specimens was similar up to the yield load. No evidence of
debonding of the CFRP composites was observed until after yielding of the reinforcement. The formation
of secondary cracks adjacent to existing flexural cracks was an indication of initiation of debonding of the
composite laminates. These cracks were followed by the formation of longitudinal debonding cracks
along the sides of the CFRP composites (Figure 6.1). These cracks propagated toward the end of the
composite laminates and caused total debonding of the composites from the surface of the concrete. The
load required to cause propagation of the debonding cracks to the end of the CFRP composites varied
depending on the strengthening configuration.
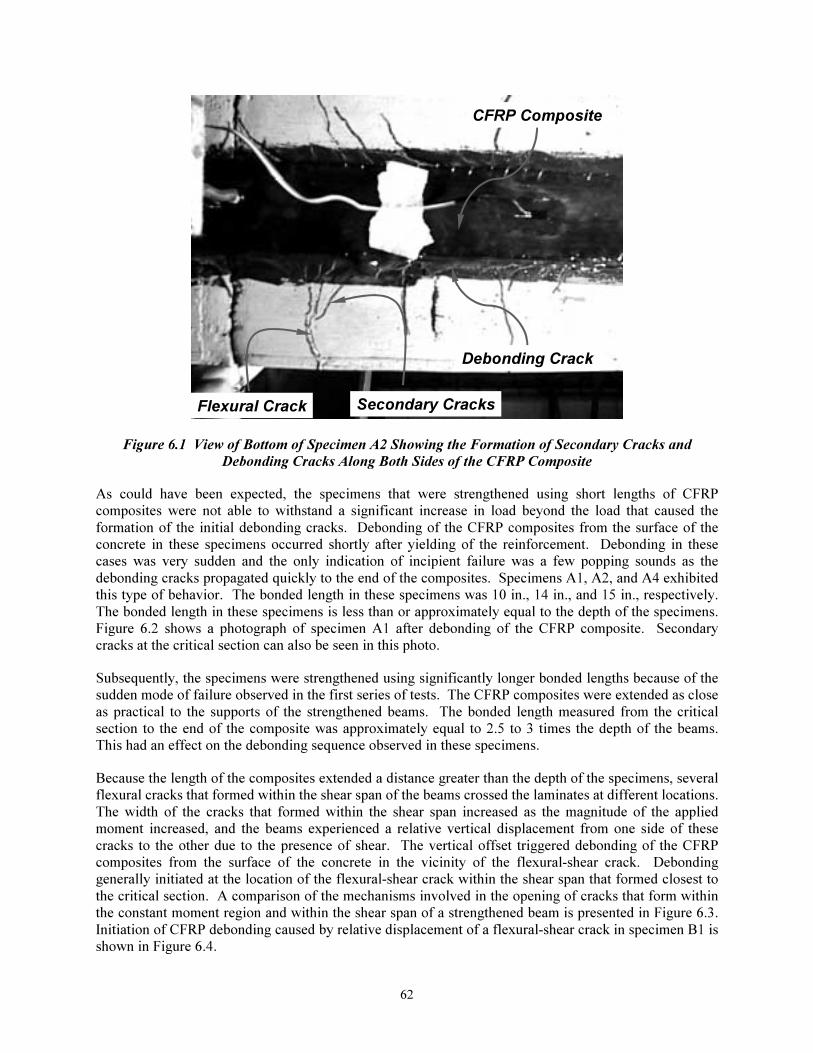
62
CFRP Composite
Debonding Crack
Secondary CracksFlexural Crack
CFRP Composite
Debonding Crack
Secondary CracksFlexural Crack
Figure 6.1 View of Bottom of Specimen A2 Showing the Formation of Secondary Cracks and
Debonding Cracks Along Both Sides of the CFRP Composite
As could have been expected, the specimens that were strengthened using short lengths of CFRP
composites were not able to withstand a significant increase in load beyond the load that caused the
formation of the initial debonding cracks. Debonding of the CFRP composites from the surface of the
concrete in these specimens occurred shortly after yielding of the reinforcement. Debonding in these
cases was very sudden and the only indication of incipient failure was a few popping sounds as the
debonding cracks propagated quickly to the end of the composites. Specimens A1, A2, and A4 exhibited
this type of behavior. The bonded length in these specimens was 10 in., 14 in., and 15 in., respectively.
The bonded length in these specimens is less than or approximately equal to the depth of the specimens.
Figure 6.2 shows a photograph of specimen A1 after debonding of the CFRP composite. Secondary
cracks at the critical section can also be seen in this photo.
Subsequently, the specimens were strengthened using significantly longer bonded lengths because of the
sudden mode of failure observed in the first series of tests. The CFRP composites were extended as close
as practical to the supports of the strengthened beams. The bonded length measured from the critical
section to the end of the composite was approximately equal to 2.5 to 3 times the depth of the beams.
This had an effect on the debonding sequence observed in these specimens.
Because the length of the composites extended a distance greater than the depth of the specimens, several
flexural cracks that formed within the shear span of the beams crossed the laminates at different locations.
The width of the cracks that formed within the shear span increased as the magnitude of the applied
moment increased, and the beams experienced a relative vertical displacement from one side of these
cracks to the other due to the presence of shear. The vertical offset triggered debonding of the CFRP
composites from the surface of the concrete in the vicinity of the flexural-shear crack. Debonding
generally initiated at the location of the flexural-shear crack within the shear span that formed closest to
the critical section. A comparison of the mechanisms involved in the opening of cracks that form within
the constant moment region and within the shear span of a strengthened beam is presented in Figure 6.3.
Initiation of CFRP debonding caused by relative displacement of a flexural-shear crack in specimen B1 is
shown in Figure 6.4.
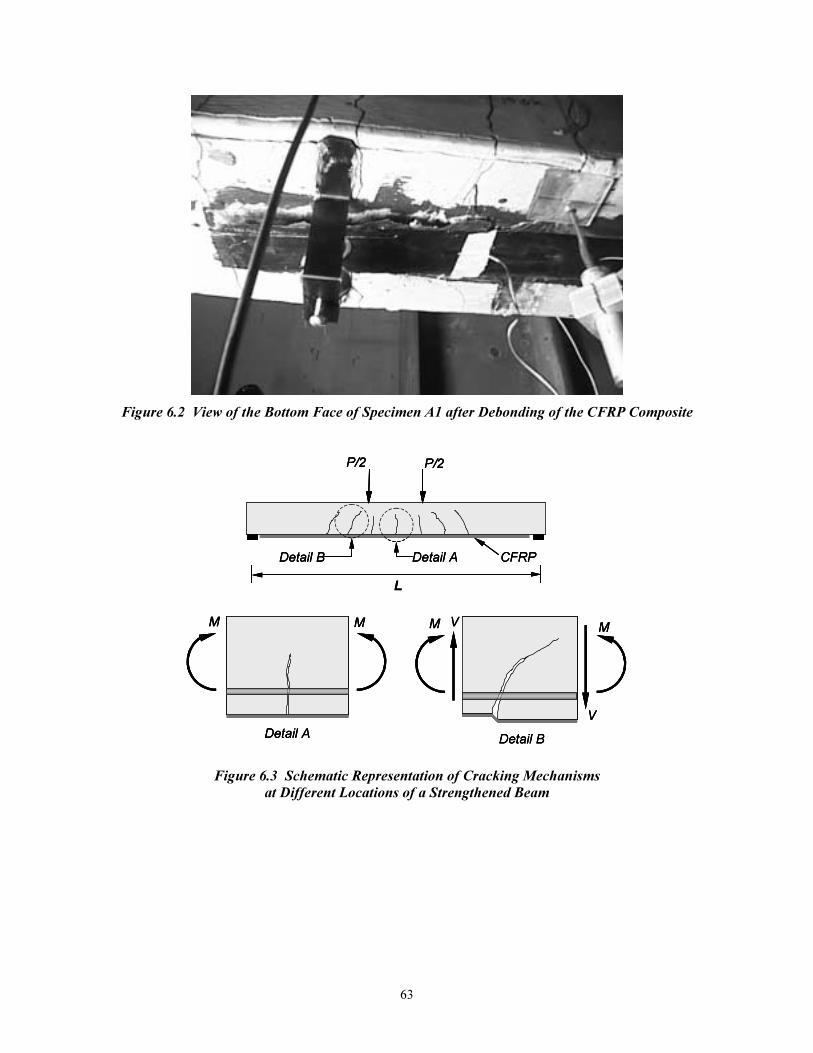
63
Figure 6.2 View of the Bottom Face of Specimen A1 after Debonding of the CFRP Composite
Detail A
M M
P/2
L
CFRPDetail B
P/2
Detail A
Detail B
V
VMM
Detail A
M M
Detail A
M M
P/2
L
CFRPDetail B
P/2
Detail A
P/2
L
CFRPDetail B
P/2
Detail A
Detail B
V
VMM
Detail B
V
VMM
Figure 6.3 Schematic Representation of Cracking Mechanisms
at Different Locations of a Strengthened Beam
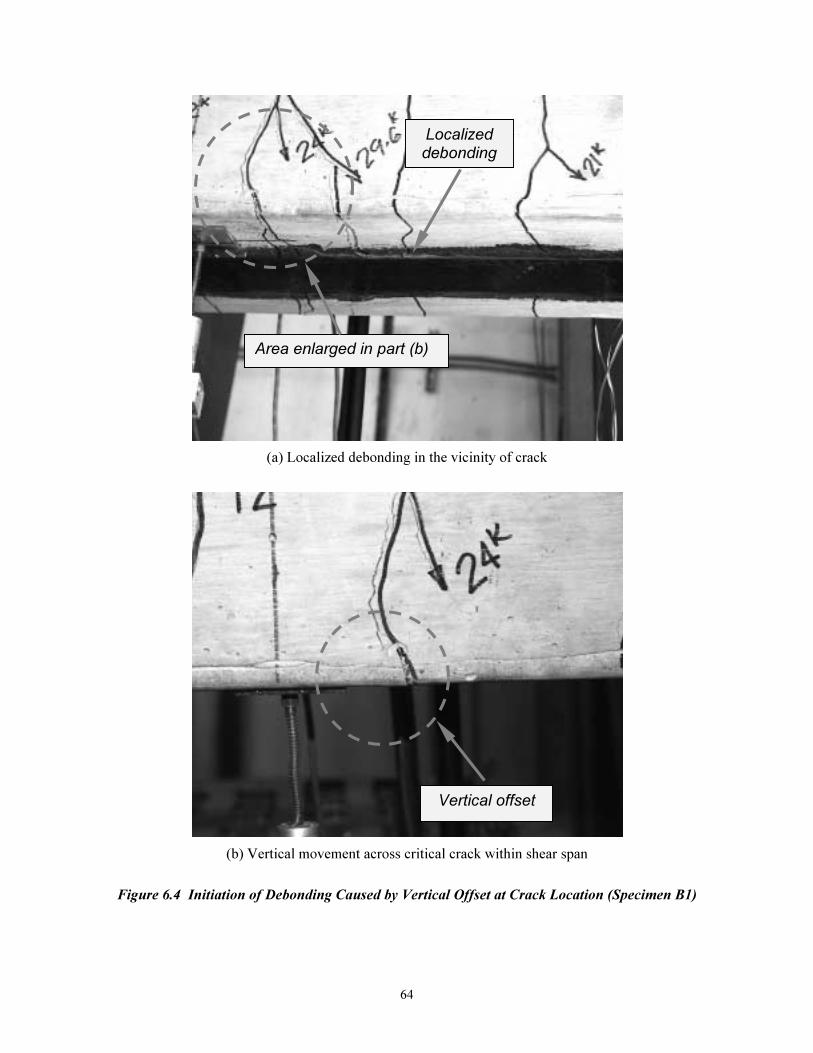
64
(a) Localized debonding in the vicinity of crack
(b) Vertical movement across critical crack within shear span
Figure 6.4 Initiation of Debonding Caused by Vertical Offset at Crack Location (Specimen B1)
Vertical offset
Localized debonding
Area enlarged in part (b)
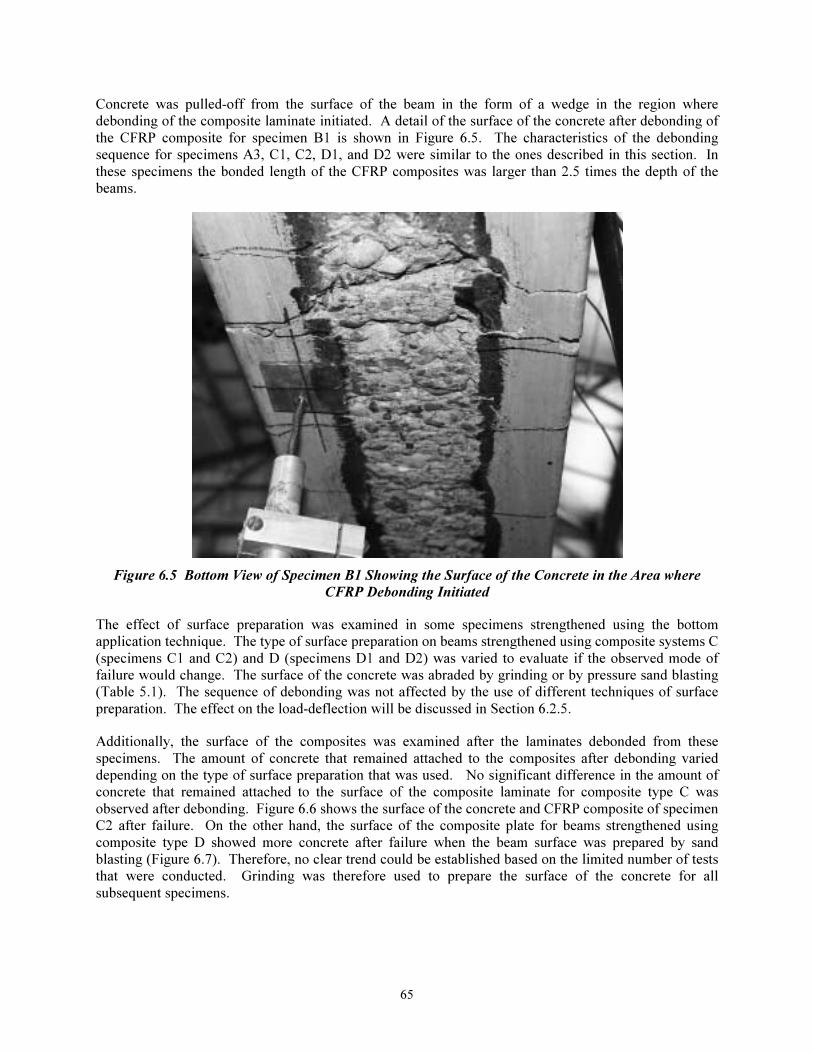
65
Concrete was pulled-off from the surface of the beam in the form of a wedge in the region where
debonding of the composite laminate initiated. A detail of the surface of the concrete after debonding of
the CFRP composite for specimen B1 is shown in Figure 6.5. The characteristics of the debonding
sequence for specimens A3, C1, C2, D1, and D2 were similar to the ones described in this section. In
these specimens the bonded length of the CFRP composites was larger than 2.5 times the depth of the
beams.
Figure 6.5 Bottom View of Specimen B1 Showing the Surface of the Concrete in the Area where
CFRP Debonding Initiated
The effect of surface preparation was examined in some specimens strengthened using the bottom
application technique. The type of surface preparation on beams strengthened using composite systems C
(specimens C1 and C2) and D (specimens D1 and D2) was varied to evaluate if the observed mode of
failure would change. The surface of the concrete was abraded by grinding or by pressure sand blasting
(Table 5.1). The sequence of debonding was not affected by the use of different techniques of surface
preparation. The effect on the load-deflection will be discussed in Section 6.2.5.
Additionally, the surface of the composites was examined after the laminates debonded from these
specimens. The amount of concrete that remained attached to the composites after debonding varied
depending on the type of surface preparation that was used. No significant difference in the amount of
concrete that remained attached to the surface of the composite laminate for composite type C was
observed after debonding. Figure 6.6 shows the surface of the concrete and CFRP composite of specimen
C2 after failure. On the other hand, the surface of the composite plate for beams strengthened using
composite type D showed more concrete after failure when the beam surface was prepared by sand
blasting (Figure 6.7). Therefore, no clear trend could be established based on the limited number of tests
that were conducted. Grinding was therefore used to prepare the surface of the concrete for all
subsequent specimens.
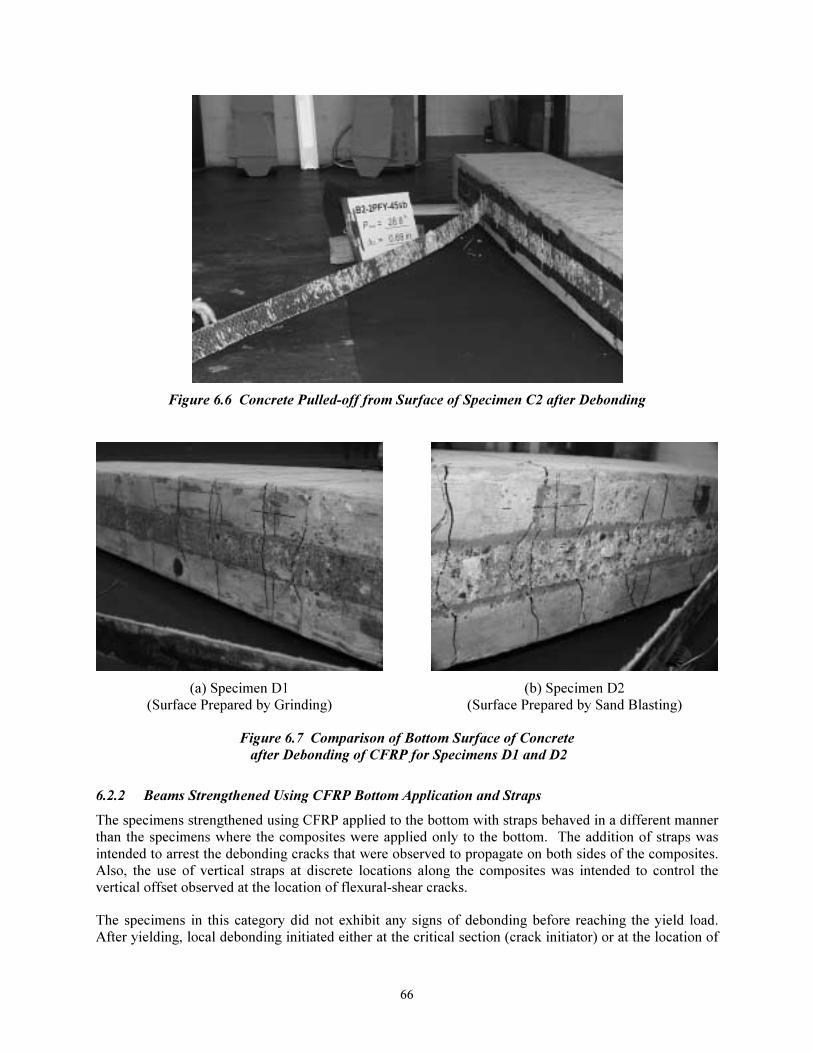
66
Figure 6.6 Concrete Pulled-off from Surface of Specimen C2 after Debonding
(a) Specimen D1 (b) Specimen D2
(Surface Prepared by Grinding) (Surface Prepared by Sand Blasting)
Figure 6.7 Comparison of Bottom Surface of Concrete
after Debonding of CFRP for Specimens D1 and D2
6.2.2 Beams Strengthened Using CFRP Bottom Application and Straps
The specimens strengthened using CFRP applied to the bottom with straps behaved in a different manner
than the specimens where the composites were applied only to the bottom. The addition of straps was
intended to arrest the debonding cracks that were observed to propagate on both sides of the composites.
Also, the use of vertical straps at discrete locations along the composites was intended to control the
vertical offset observed at the location of flexural-shear cracks.
The specimens in this category did not exhibit any signs of debonding before reaching the yield load.
After yielding, local debonding initiated either at the critical section (crack initiator) or at the location of
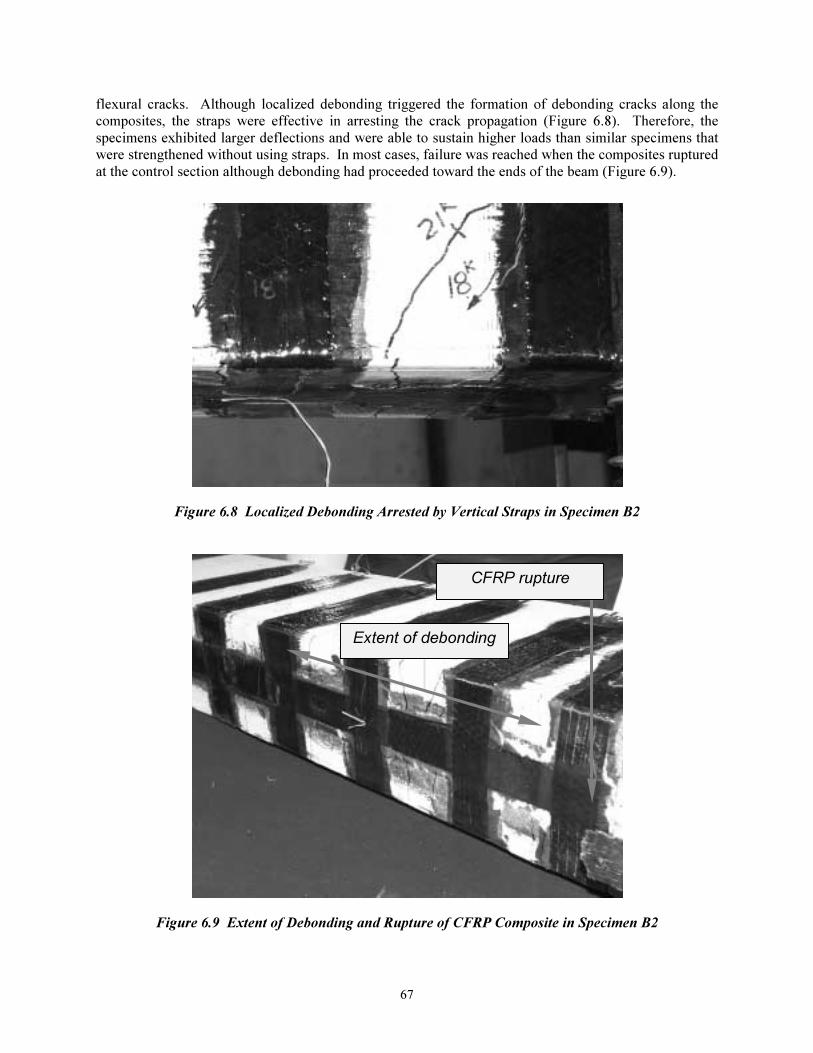
67
flexural cracks. Although localized debonding triggered the formation of debonding cracks along the
composites, the straps were effective in arresting the crack propagation (Figure 6.8). Therefore, the
specimens exhibited larger deflections and were able to sustain higher loads than similar specimens that
were strengthened without using straps. In most cases, failure was reached when the composites ruptured
at the control section although debonding had proceeded toward the ends of the beam (Figure 6.9).
Figure 6.8 Localized Debonding Arrested by Vertical Straps in Specimen B2
Figure 6.9 Extent of Debonding and Rupture of CFRP Composite in Specimen B2
Extent of debonding
CFRP rupture
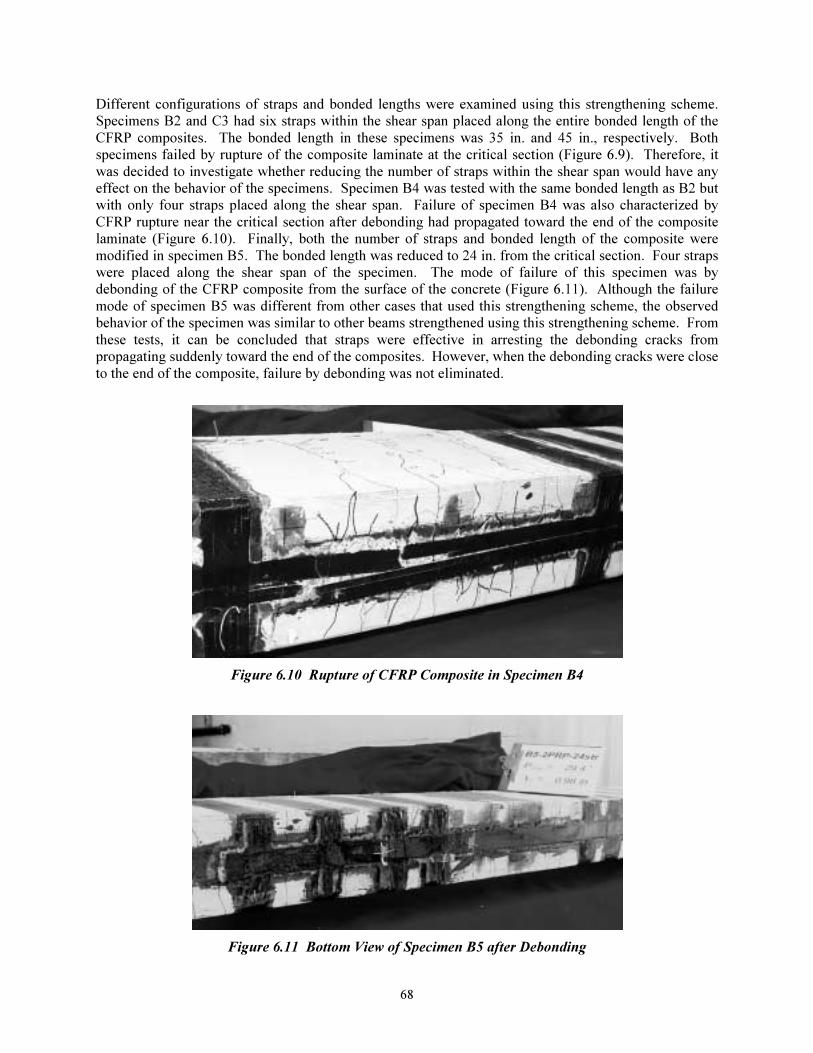
68
Different configurations of straps and bonded lengths were examined using this strengthening scheme.
Specimens B2 and C3 had six straps within the shear span placed along the entire bonded length of the
CFRP composites. The bonded length in these specimens was 35 in. and 45 in., respectively. Both
specimens failed by rupture of the composite laminate at the critical section (Figure 6.9). Therefore, it
was decided to investigate whether reducing the number of straps within the shear span would have any
effect on the behavior of the specimens. Specimen B4 was tested with the same bonded length as B2 but
with only four straps placed along the shear span. Failure of specimen B4 was also characterized by
CFRP rupture near the critical section after debonding had propagated toward the end of the composite
laminate (Figure 6.10). Finally, both the number of straps and bonded length of the composite were
modified in specimen B5. The bonded length was reduced to 24 in. from the critical section. Four straps
were placed along the shear span of the specimen. The mode of failure of this specimen was by
debonding of the CFRP composite from the surface of the concrete (Figure 6.11). Although the failure
mode of specimen B5 was different from other cases that used this strengthening scheme, the observed
behavior of the specimen was similar to other beams strengthened using this strengthening scheme. From
these tests, it can be concluded that straps were effective in arresting the debonding cracks from
propagating suddenly toward the end of the composites. However, when the debonding cracks were close
to the end of the composite, failure by debonding was not eliminated.
Figure 6.10 Rupture of CFRP Composite in Specimen B4
Figure 6.11 Bottom View of Specimen B5 after Debonding
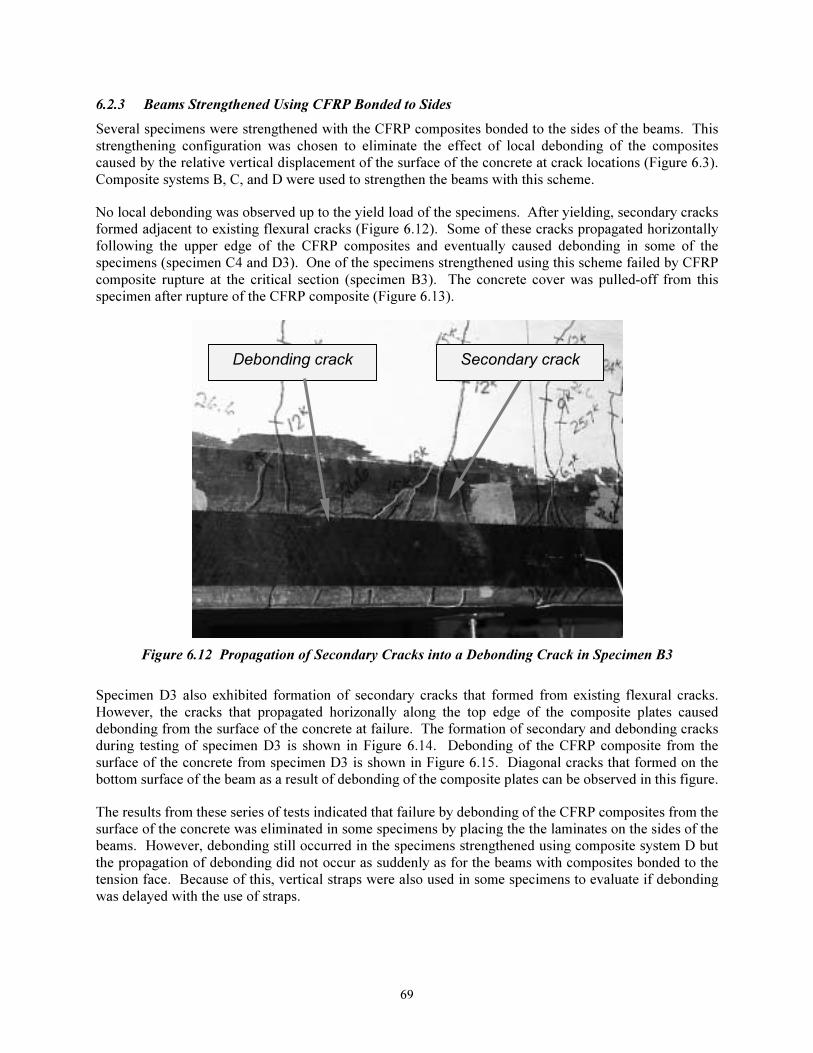
69
6.2.3 Beams Strengthened Using CFRP Bonded to Sides
Several specimens were strengthened with the CFRP composites bonded to the sides of the beams. This
strengthening configuration was chosen to eliminate the effect of local debonding of the composites
caused by the relative vertical displacement of the surface of the concrete at crack locations (Figure 6.3).
Composite systems B, C, and D were used to strengthen the beams with this scheme.
No local debonding was observed up to the yield load of the specimens. After yielding, secondary cracks
formed adjacent to existing flexural cracks (Figure 6.12). Some of these cracks propagated horizontally
following the upper edge of the CFRP composites and eventually caused debonding in some of the
specimens (specimen C4 and D3). One of the specimens strengthened using this scheme failed by CFRP
composite rupture at the critical section (specimen B3). The concrete cover was pulled-off from this
specimen after rupture of the CFRP composite (Figure 6.13).
Figure 6.12 Propagation of Secondary Cracks into a Debonding Crack in Specimen B3
Specimen D3 also exhibited formation of secondary cracks that formed from existing flexural cracks.
However, the cracks that propagated horizonally along the top edge of the composite plates caused
debonding from the surface of the concrete at failure. The formation of secondary and debonding cracks
during testing of specimen D3 is shown in Figure 6.14. Debonding of the CFRP composite from the
surface of the concrete from specimen D3 is shown in Figure 6.15. Diagonal cracks that formed on the
bottom surface of the beam as a result of debonding of the composite plates can be observed in this figure.
The results from these series of tests indicated that failure by debonding of the CFRP composites from the
surface of the concrete was eliminated in some specimens by placing the the laminates on the sides of the
beams. However, debonding still occurred in the specimens strengthened using composite system D but
the propagation of debonding did not occur as suddenly as for the beams with composites bonded to the
tension face. Because of this, vertical straps were also used in some specimens to evaluate if debonding
was delayed with the use of straps.
Secondary crack Debonding crack
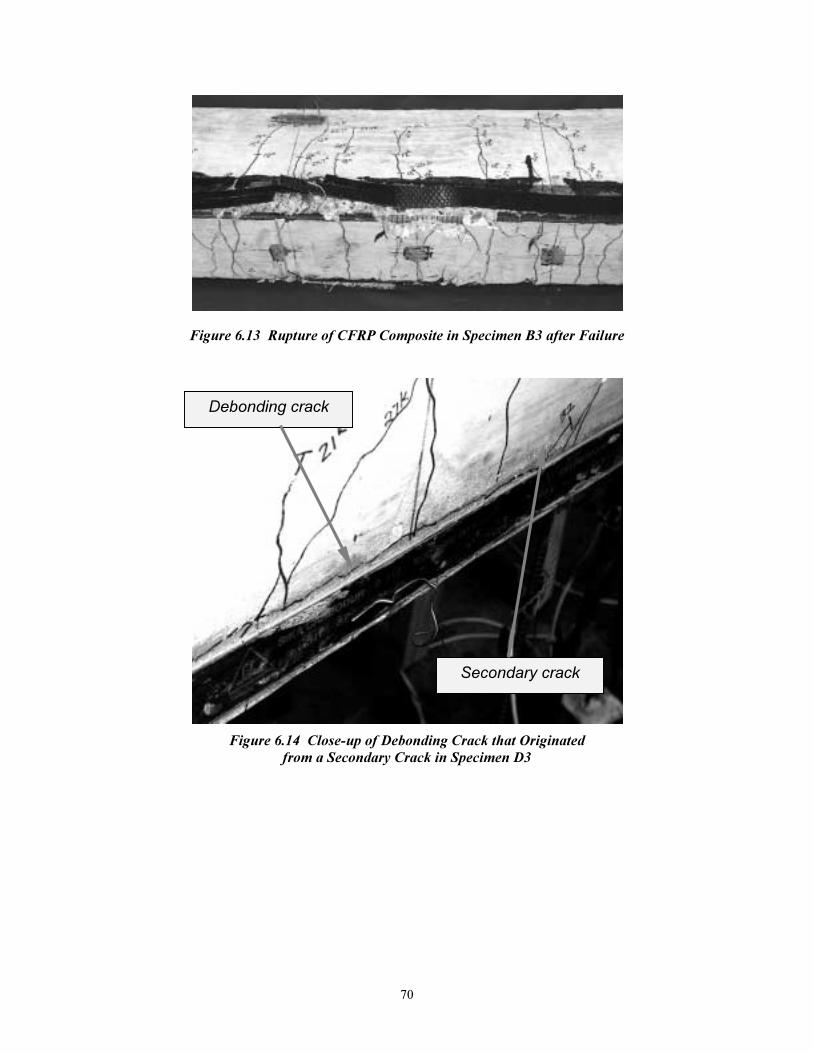
70
Figure 6.13 Rupture of CFRP Composite in Specimen B3 after Failure
Figure 6.14 Close-up of Debonding Crack that Originated
from a Secondary Crack in Specimen D3
Secondary crack
Debonding crack
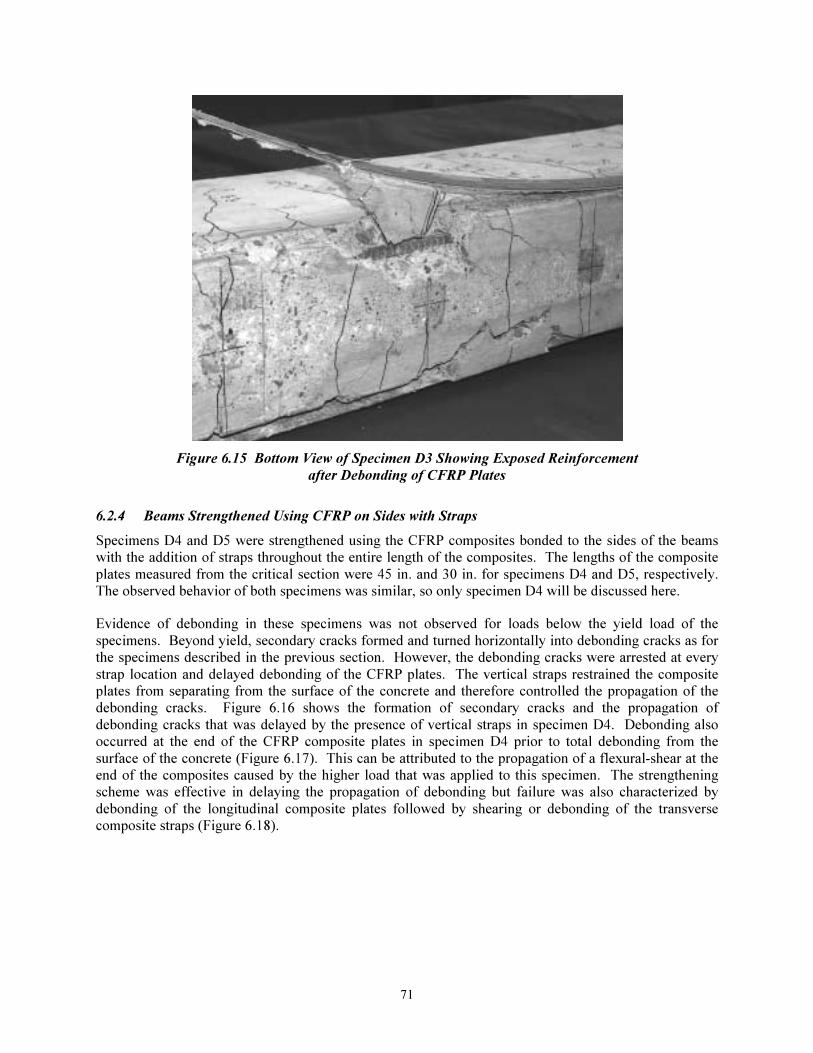
71
Figure 6.15 Bottom View of Specimen D3 Showing Exposed Reinforcement
after Debonding of CFRP Plates
6.2.4 Beams Strengthened Using CFRP on Sides with Straps
Specimens D4 and D5 were strengthened using the CFRP composites bonded to the sides of the beams
with the addition of straps throughout the entire length of the composites. The lengths of the composite
plates measured from the critical section were 45 in. and 30 in. for specimens D4 and D5, respectively.
The observed behavior of both specimens was similar, so only specimen D4 will be discussed here.
Evidence of debonding in these specimens was not observed for loads below the yield load of the
specimens. Beyond yield, secondary cracks formed and turned horizontally into debonding cracks as for
the specimens described in the previous section. However, the debonding cracks were arrested at every
strap location and delayed debonding of the CFRP plates. The vertical straps restrained the composite
plates from separating from the surface of the concrete and therefore controlled the propagation of the
debonding cracks. Figure 6.16 shows the formation of secondary cracks and the propagation of
debonding cracks that was delayed by the presence of vertical straps in specimen D4. Debonding also
occurred at the end of the CFRP composite plates in specimen D4 prior to total debonding from the
surface of the concrete (Figure 6.17). This can be attributed to the propagation of a flexural-shear at the
end of the composites caused by the higher load that was applied to this specimen. The strengthening
scheme was effective in delaying the propagation of debonding but failure was also characterized by
debonding of the longitudinal composite plates followed by shearing or debonding of the transverse
composite straps (Figure 6.18).
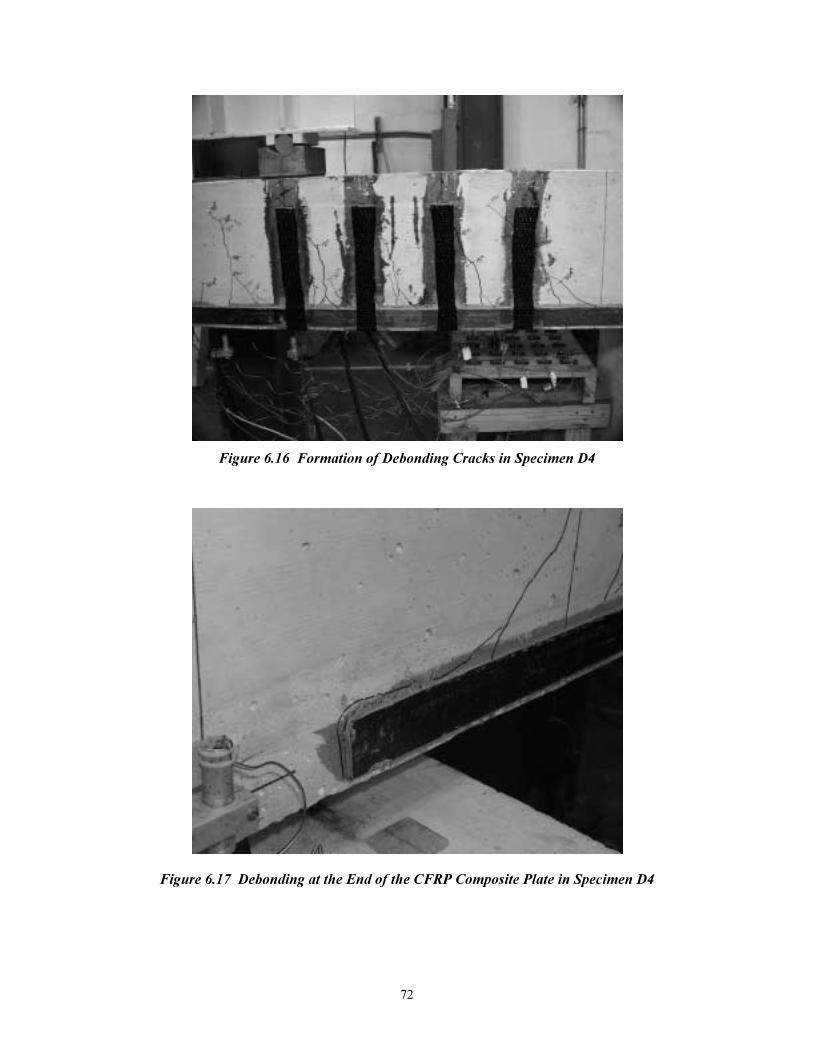
72
Figure 6.16 Formation of Debonding Cracks in Specimen D4
Figure 6.17 Debonding at the End of the CFRP Composite Plate in Specimen D4

73
Figure 6.18 Shearing of Transverse Composite Straps
after Debonding of CFRP Composites in Specimen D4
6.2.5 Beams Subjected to Cycles of Moisture and Environmental Exposure
Specimens A-LT1 and A-LT2 were strengthened using the same strengthening scheme as specimen B4.
These beams were cracked before the application of the composite system. After the beams were
strengthened, they were placed outside the laboratory to subject them to periodic moisture and exposure
to the environment. Specimen A-LT2 was also subjected to a sustained load approximately equal to 20%
of the yield load of the strengthened specimen. After 8 months of exposure, the beams were then tested
statically to failure inside the laboratory.
The observed response of the beams during testing was similar to the response of specimen B4. No
evidence of debonding was observable at load levels below the yield load. Debonding cracks formed at
each of the existing flexural cracks and were arrested at every strap location along the shear span. Both
specimens failed by rupture of the CFRP composite at or near the maximum moment section. At failure,
debonding of the CFRP composite from the surface of the concrete had propagated approximately 14 in.
toward the supports. The load at failure of specimen A-LT2 was slightly lower than the failure load of
specimen A-LT1. The differences in the measured load-deflection response between these specimens will
be discussed in Section 6.3. The cracking patterns and crack widths of the specimens at failure are
presented in Appendix B. Figure 6.19 shows specimen A-LT1 after rupture of the CFRP composite.
Figure 6.20 shows specimen A-LT2 after failure. In this case, failure of the specimen was characterized
by longitudinal splitting of the CFRP composite and fiber rupture at the sections of maximum moment.
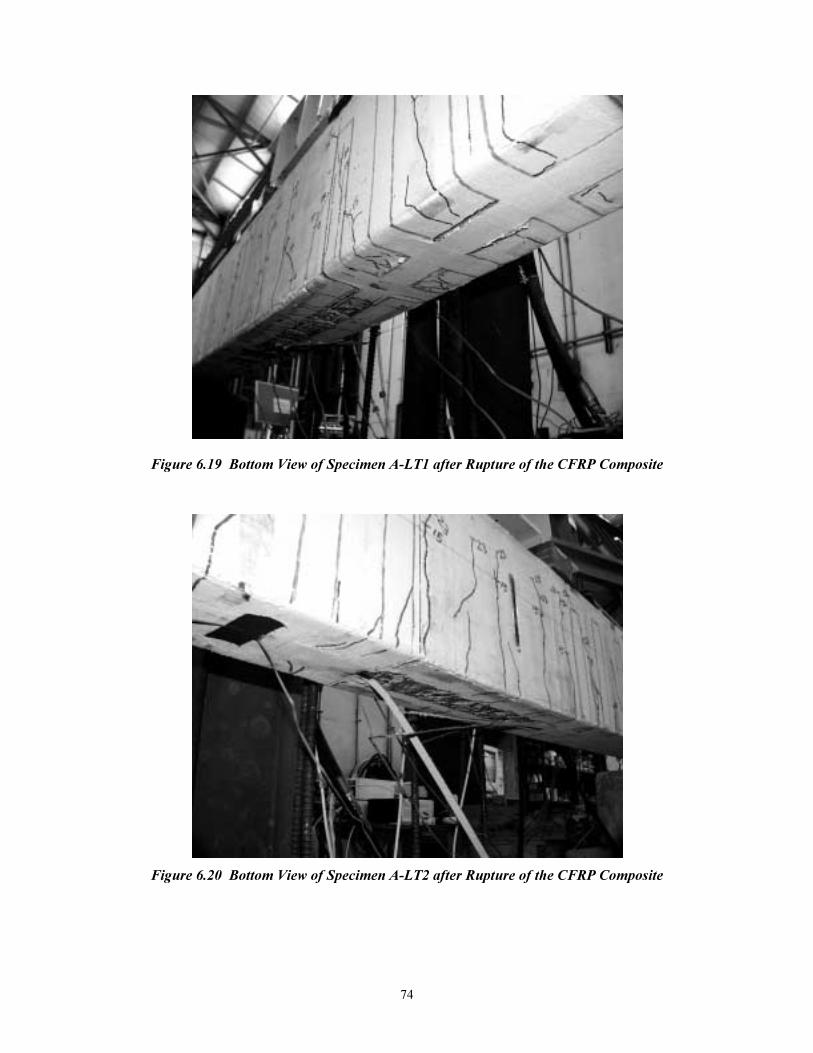
74
Figure 6.19 Bottom View of Specimen A-LT1 after Rupture of the CFRP Composite
Figure 6.20 Bottom View of Specimen A-LT2 after Rupture of the CFRP Composite
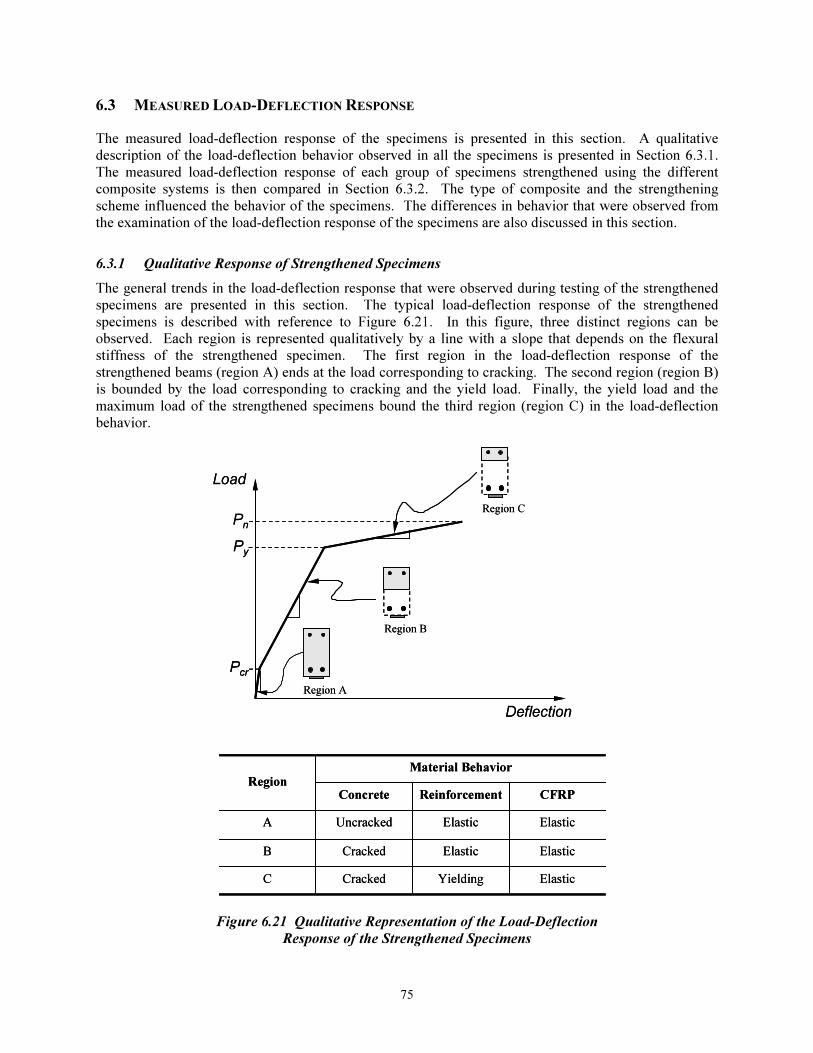
75
6.3 MEASURED LOAD-DEFLECTION RESPONSE
The measured load-deflection response of the specimens is presented in this section. A qualitative
description of the load-deflection behavior observed in all the specimens is presented in Section 6.3.1.
The measured load-deflection response of each group of specimens strengthened using the different
composite systems is then compared in Section 6.3.2. The type of composite and the strengthening
scheme influenced the behavior of the specimens. The differences in behavior that were observed from
the examination of the load-deflection response of the specimens are also discussed in this section.
6.3.1 Qualitative Response of Strengthened Specimens
The general trends in the load-deflection response that were observed during testing of the strengthened
specimens are presented in this section. The typical load-deflection response of the strengthened
specimens is described with reference to Figure 6.21. In this figure, three distinct regions can be
observed. Each region is represented qualitatively by a line with a slope that depends on the flexural
stiffness of the strengthened specimen. The first region in the load-deflection response of the
strengthened beams (region A) ends at the load corresponding to cracking. The second region (region B)
is bounded by the load corresponding to cracking and the yield load. Finally, the yield load and the
maximum load of the strengthened specimens bound the third region (region C) in the load-deflection
behavior.
Deflection
Load
Py
Pcr
Pn
Region C
Region B
Region A
Deflection
Load
Py
Pcr
Pn
Region C
Region B
Region A
Yielding
Elastic
Elastic
Reinforcement
Material BehaviorRegion
Cracked
Cracked
Uncracked
Concrete
ElasticC
ElasticB
ElasticA
CFRP
Yielding
Elastic
Elastic
Reinforcement
Material BehaviorRegion
Cracked
Cracked
Uncracked
Concrete
ElasticC
ElasticB
ElasticA
CFRP
Figure 6.21 Qualitative Representation of the Load-Deflection
Response of the Strengthened Specimens
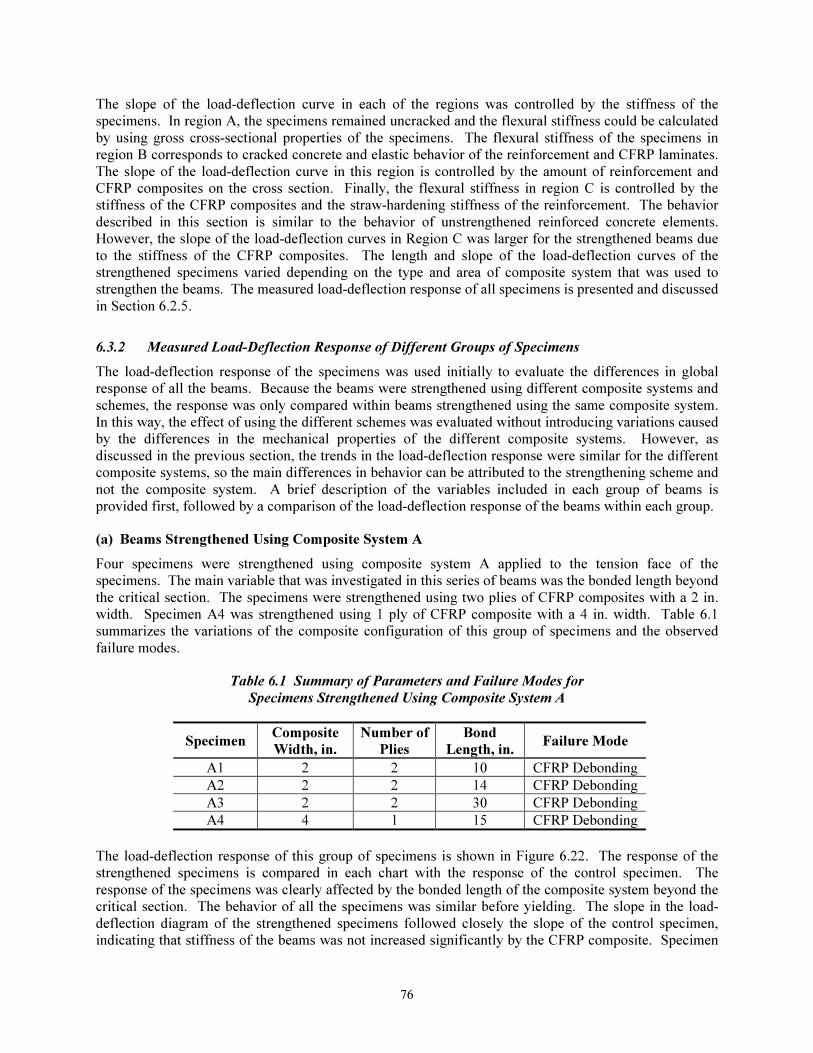
76
The slope of the load-deflection curve in each of the regions was controlled by the stiffness of the
specimens. In region A, the specimens remained uncracked and the flexural stiffness could be calculated
by using gross cross-sectional properties of the specimens. The flexural stiffness of the specimens in
region B corresponds to cracked concrete and elastic behavior of the reinforcement and CFRP laminates.
The slope of the load-deflection curve in this region is controlled by the amount of reinforcement and
CFRP composites on the cross section. Finally, the flexural stiffness in region C is controlled by the
stiffness of the CFRP composites and the straw-hardening stiffness of the reinforcement. The behavior
described in this section is similar to the behavior of unstrengthened reinforced concrete elements.
However, the slope of the load-deflection curves in Region C was larger for the strengthened beams due
to the stiffness of the CFRP composites. The length and slope of the load-deflection curves of the
strengthened specimens varied depending on the type and area of composite system that was used to
strengthen the beams. The measured load-deflection response of all specimens is presented and discussed
in Section 6.2.5.
6.3.2 Measured Load-Deflection Response of Different Groups of Specimens
The load-deflection response of the specimens was used initially to evaluate the differences in global
response of all the beams. Because the beams were strengthened using different composite systems and
schemes, the response was only compared within beams strengthened using the same composite system.
In this way, the effect of using the different schemes was evaluated without introducing variations caused
by the differences in the mechanical properties of the different composite systems. However, as
discussed in the previous section, the trends in the load-deflection response were similar for the different
composite systems, so the main differences in behavior can be attributed to the strengthening scheme and
not the composite system. A brief description of the variables included in each group of beams is
provided first, followed by a comparison of the load-deflection response of the beams within each group.
(a) Beams Strengthened Using Composite System A
Four specimens were strengthened using composite system A applied to the tension face of the
specimens. The main variable that was investigated in this series of beams was the bonded length beyond
the critical section. The specimens were strengthened using two plies of CFRP composites with a 2 in.
width. Specimen A4 was strengthened using 1 ply of CFRP composite with a 4 in. width. Table 6.1
summarizes the variations of the composite configuration of this group of specimens and the observed
failure modes.
Table 6.1 Summary of Parameters and Failure Modes for
Specimens Strengthened Using Composite System A
Specimen Composite
Width, in.
Number of
Plies
Bond
Length, in. Failure Mode
A1 2 2 10 CFRP Debonding
A2 2 2 14 CFRP Debonding
A3 2 2 30 CFRP Debonding
A4 4 1 15 CFRP Debonding
The load-deflection response of this group of specimens is shown in Figure 6.22. The response of the
strengthened specimens is compared in each chart with the response of the control specimen. The
response of the specimens was clearly affected by the bonded length of the composite system beyond the
critical section. The behavior of all the specimens was similar before yielding. The slope in the load-
deflection diagram of the strengthened specimens followed closely the slope of the control specimen,
indicating that stiffness of the beams was not increased significantly by the CFRP composite. Specimen

77
A4 exhibited the largest increase in cracking load from the cracking load of the control specimen.
However, this difference can be attributed to the difference in strength of the concrete that was used in the
fabrication of the specimens.
0
10
20
30
40
0 0.4 0.8 1.2 1.6 2
Midspan Deflection (in.)
Lo
ad
(kip
)
Specimen A1
Control Specimen
0
10
20
30
40
0 0.4 0.8 1.2 1.6 2
Midspan Deflection (in.)
Lo
ad
(k
ip)
Specimen A3
Control Specimen
(a) Specimen A1 (c) Specimen A3
0
10
20
30
40
0 0.4 0.8 1.2 1.6 2
Midspan Deflection (in.)
Lo
ad
(k
ip)
Specimen A2
Control Specimen
0
10
20
30
40
0 0.4 0.8 1.2 1.6 2
Midspan Deflection (in.)
Lo
ad
(k
ip)
Specimen A4
Control Specimen
(b) Specimen A2 (d) Specimen A4
Figure 6.22 Comparison of the Load-Deflection Response of
Specimens Strengthened Using Composite System A
The yield load of the strengthened specimens was approximately 10% larger than the yield load of the
control specimen. After yielding, the behavior of the specimens was influenced by the length of the
composite laminates. The deformation capacity of the specimens before debonding of the CFRP
composite from the surface of the concrete increased with bonded length as evidenced from these load-
deflection plots. However the slope of the load-deflection diagrams was approximately the same for all
the specimens. The main parameters of the measured load-deflection curves are listed in Table 6.2.
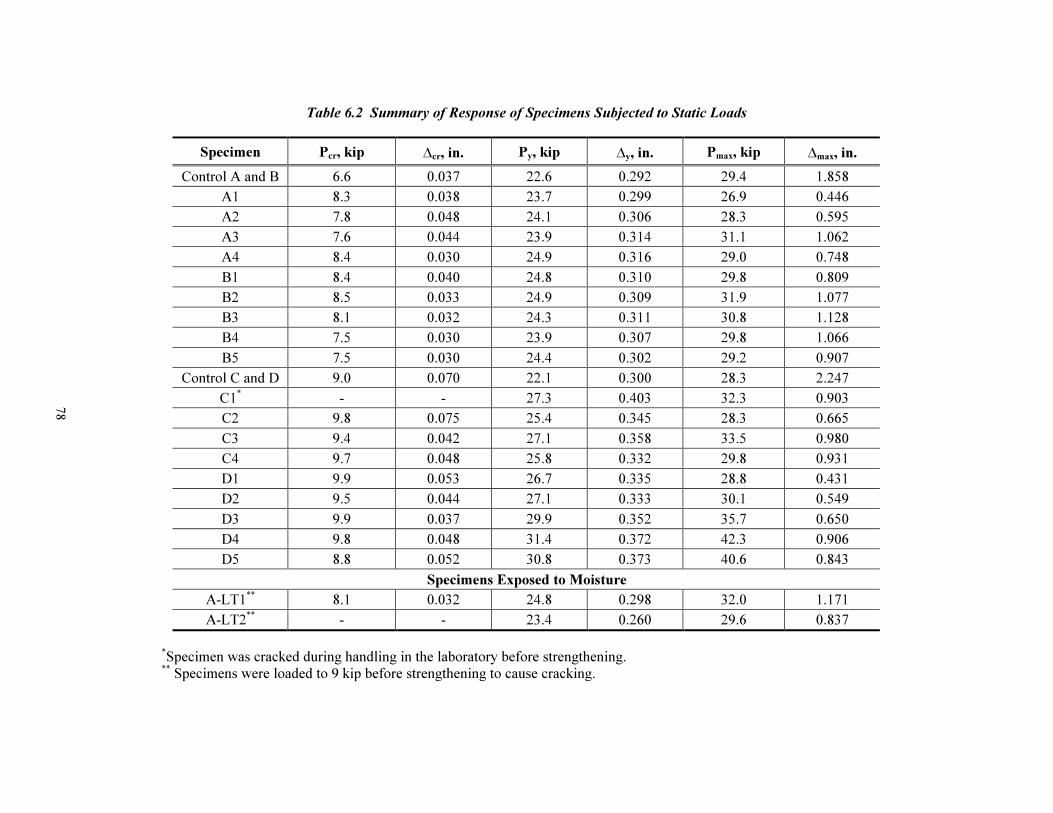
78
Table 6.2 Summary of Response of Specimens Subjected to Static Loads
Specimen Pcr, kip ∆cr, in. Py, kip ∆y, in. Pmax, kip ∆max, in.
Control A and B 6.6 0.037 22.6 0.292 29.4 1.858
A1 8.3 0.038 23.7 0.299 26.9 0.446
A2 7.8 0.048 24.1 0.306 28.3 0.595
A3 7.6 0.044 23.9 0.314 31.1 1.062
A4 8.4 0.030 24.9 0.316 29.0 0.748
B1 8.4 0.040 24.8 0.310 29.8 0.809
B2 8.5 0.033 24.9 0.309 31.9 1.077
B3 8.1 0.032 24.3 0.311 30.8 1.128
B4 7.5 0.030 23.9 0.307 29.8 1.066
B5 7.5 0.030 24.4 0.302 29.2 0.907
Control C and D 9.0 0.070 22.1 0.300 28.3 2.247
C1* - - 27.3 0.403 32.3 0.903
C2 9.8 0.075 25.4 0.345 28.3 0.665
C3 9.4 0.042 27.1 0.358 33.5 0.980
C4 9.7 0.048 25.8 0.332 29.8 0.931
D1 9.9 0.053 26.7 0.335 28.8 0.431
D2 9.5 0.044 27.1 0.333 30.1 0.549
D3 9.9 0.037 29.9 0.352 35.7 0.650
D4 9.8 0.048 31.4 0.372 42.3 0.906
D5 8.8 0.052 30.8 0.373 40.6 0.843
Specimens Exposed to Moisture
A-LT1**
8.1 0.032 24.8 0.298 32.0 1.171
A-LT2**
- - 23.4 0.260 29.6 0.837
*Specimen was cracked during handling in the laboratory before strengthening.
** Specimens were loaded to 9 kip before strengthening to cause cracking.

79
Specimens A3 and A4 were tested to evaluate equations contained as part of the literature from the
manufacturer of composite system A. These design guidelines contain equations to calculate the required
length for the CFRP composite to reach the rupture strength of the laminate [Master Builders, 1998]. The
design guidelines recommend the use of Equation 6.1 to calculate the required length of the composites to
reach the rupture stress. Equation 6.1 is a function of the rupture stress of the composite, thickness of the
laminate, and the concrete strength. Applying Equation 6.1 to calculate the required length of the
composite for specimens A3 and A4 results in bond lengths approximately equal to 30 in. and 15 in.,
respectively. Although the strength of the composites in specimens A3 and A4 was equal, the
deformation capacity of the specimens was different. Specimen A4 failed at a load approximately 8%
lower than specimen A3. Also, the midspan deflection of specimen A4 was approximately 25% smaller
than specimen A3. This result indicated that the use of Equation 6.1 might lead to unconservative designs
for particular configurations of CFRP composites.
c
ppu
dp' f 3
n t f l = (6.1)
where:
lpd = Bond length, in.
fpu = Rupture stress of the composite, psi
tp = Design thickness of the composite, in.
n = Number of plies
f 'c = Compressive strength of concrete, psi
(b) Beams Strengthened Using Composite System B
Five specimens were strengthened using composite system B. The composites were bonded
symmetrically about the centerline of the beams. The results from the tests of beams strengthened using
composite system A indicated that the strength of the composites was not reached before debonding, even
when the laminates extended nearly the entire length of the span. Therefore, the composite laminates in
the first four specimens in this group extended 35 in. from the critical section. The longitudinal
composites were formed using two plies of unidirectional carbon fibers. Three different schemes were
used to strengthen the beams. Therefore, the main variable investigated in these tests was the
strengthening scheme. Only specimen B5 was strengthened using a bond length equal to 24 in. after
observing that specimens B2 through B4 failed by rupture of the CFRP composite. Table 6.2 summarizes
the main parameters of the specimens in this group and the observed failure modes.
Table 6.3 Summary of Parameters and Failure Modes for
Specimens Strengthened Using Composite System B
Specimen
Bond
Length,
in.
Width of
CFRP,
in.
Number
of
Straps*
Composite Scheme Failure Mode
B1 35 3 - CFRP applied to the tension face CFRP Debonding
B2 35 2 6 Bottom application with straps CFRP Rupture
B3 35 2 - CFRP applied to sides of beam CFRP Rupture
B4 35 2 4 Bottom application with straps CFRP Rupture
B5 24 2 4 Bottom application with straps CFRP Debonding
*Number of straps placed along the shear span of the beams.
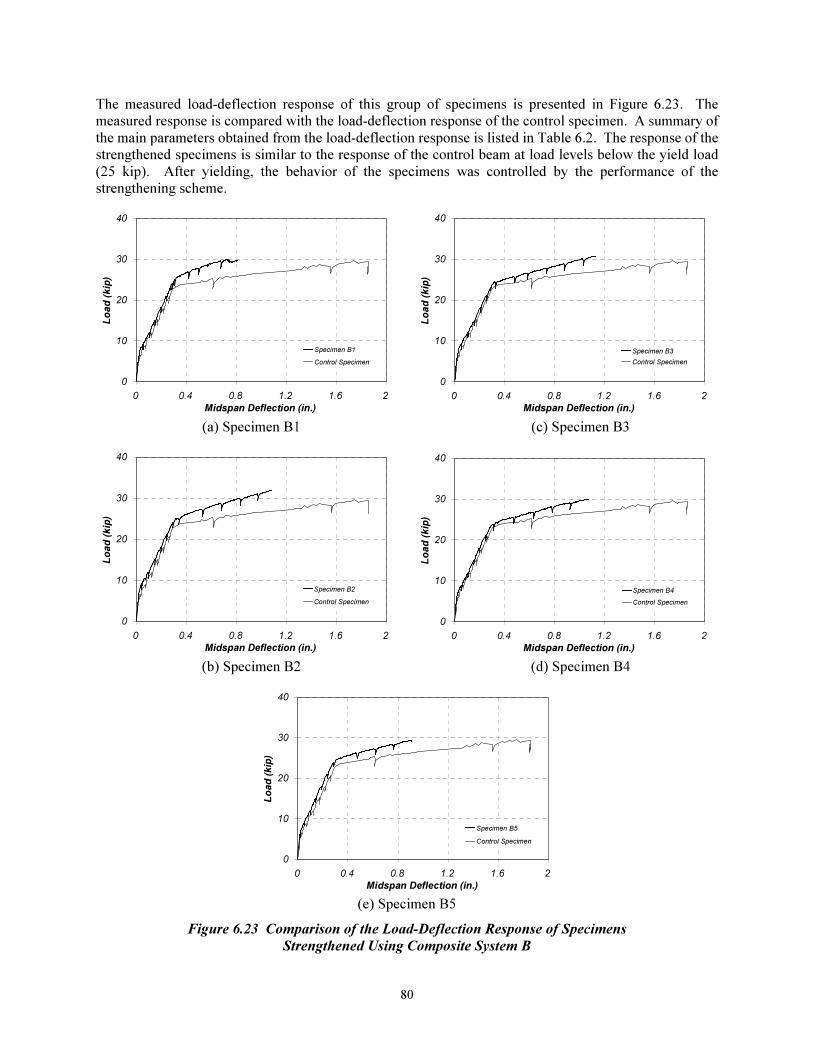
80
The measured load-deflection response of this group of specimens is presented in Figure 6.23. The
measured response is compared with the load-deflection response of the control specimen. A summary of
the main parameters obtained from the load-deflection response is listed in Table 6.2. The response of the
strengthened specimens is similar to the response of the control beam at load levels below the yield load
(25 kip). After yielding, the behavior of the specimens was controlled by the performance of the
strengthening scheme.
0
10
20
30
40
0 0.4 0.8 1.2 1.6 2
Midspan Deflection (in.)
Lo
ad
(k
ip)
Specimen B1
Control Specimen
0
10
20
30
40
0 0.4 0.8 1.2 1.6 2
Midspan Deflection (in.)
Lo
ad
(k
ip)
Specimen B3
Control Specimen
(a) Specimen B1 (c) Specimen B3
0
10
20
30
40
0 0.4 0.8 1.2 1.6 2
Midspan Deflection (in.)
Lo
ad
(k
ip)
Specimen B2
Control Specimen
0
10
20
30
40
0 0.4 0.8 1.2 1.6 2
Midspan Deflection (in.)
Lo
ad
(k
ip)
Specimen B4
Control Specimen
(b) Specimen B2 (d) Specimen B4
0
10
20
30
40
0 0.4 0.8 1.2 1.6 2
Midspan Deflection (in.)
Lo
ad
(k
ip)
Specimen B5
Control Specimen
(e) Specimen B5
Figure 6.23 Comparison of the Load-Deflection Response of Specimens
Strengthened Using Composite System B

81
Specimen B1 showed the smallest deflection at failure of this group of specimens (approximately 0.8 in.).
As observed, the deflection at failure was significantly increased in specimens B2 and B3 with the
addition of straps or by placing the composites on the sides, respectively. Also, failure of specimens B2
and B3 was characterized by composite rupture instead of debonding from the surface of the concrete.
The maximum measured midspan deflection of specimens B2 and B3 was approximately 1.1 in. The
beams reached higher ultimate loads by increasing the deformation capacity of the specimens.
Specimens B4 and B5 were fabricated using a different heat of steel than specimens B1 through B3. The
yield stress of the reinforcing bars of these specimens was slightly lower than the yield stress of the bars
used in specimens B1 to B3. Therefore, the slight difference in the slope of the load-deflection response
of these specimens after yielding as compared to specimens B1 to B3 can be attributed to this factor rather
than to differences in the performance of the composite system. The deformation capacity of specimens
B4 and B5 was approximately 1.1 in. and 0.9 in., respectively (Table 6.2). Therefore, reducing the bond
length of the composite in specimen B5 affected the deformation capacity of the specimen and the mode
of failure.
(c) Beams Strengthened Using Composite System C
Four specimens were strengthened using composite system C. The composites were bonded
symmetrically about the centerline of the beams using a 45-in. bonded length. The composites were 2 in.
wide and were formed using two plies of unidirectional carbon fiber woven fabric. Three different
strengthening schemes were used to strengthen the beams. In this group of tests, the variables
investigated were the type of preparation of the surface of the concrete and the strengthening scheme.
Table 6.4 summarizes the main parameters of the strengthened beams in this group and the observed
failure modes.
Table 6.4 Summary of Parameters and Failure Modes for
Specimens Strengthened Using Composite System C
Specimen Bond
Length, in.
Number
of Straps*
Surface
Preparation Composite Scheme Failure Mode
C1 45 - Grinding CFRP applied to the
tension face CFRP Debonding
C2 45 - Sandblasting CFRP applied to the
tension face CFRP Debonding
C3 45 6 Grinding Bottom application
with straps CFRP Rupture
C4 45 - Grinding CFRP applied to
sides of beam CFRP Debonding
*Number of straps placed along the shear span of the beams.
Figure 6.24 shows the measured load-deflection response of the beams strengthened using composite
system C. The response of the specimens are also compared with the response of the control specimen in
this figure. Similarly to the beams strengthened using composite systems A and B, the slope of the load-
deflection curve at load levels below the yield load is similar to the slope of the control specimen. The
yield load of the strengthened specimens, however, was approximately 15% higher than the yield load of
the control specimen (Table 6.2). After yielding, the slope in the load-deflection diagram of the
strengthened specimens was steeper than the control specimen. Therefore, it is evident that the response
of the specimens beyond yield was controlled by the strength and stiffness of the CFRP composites.
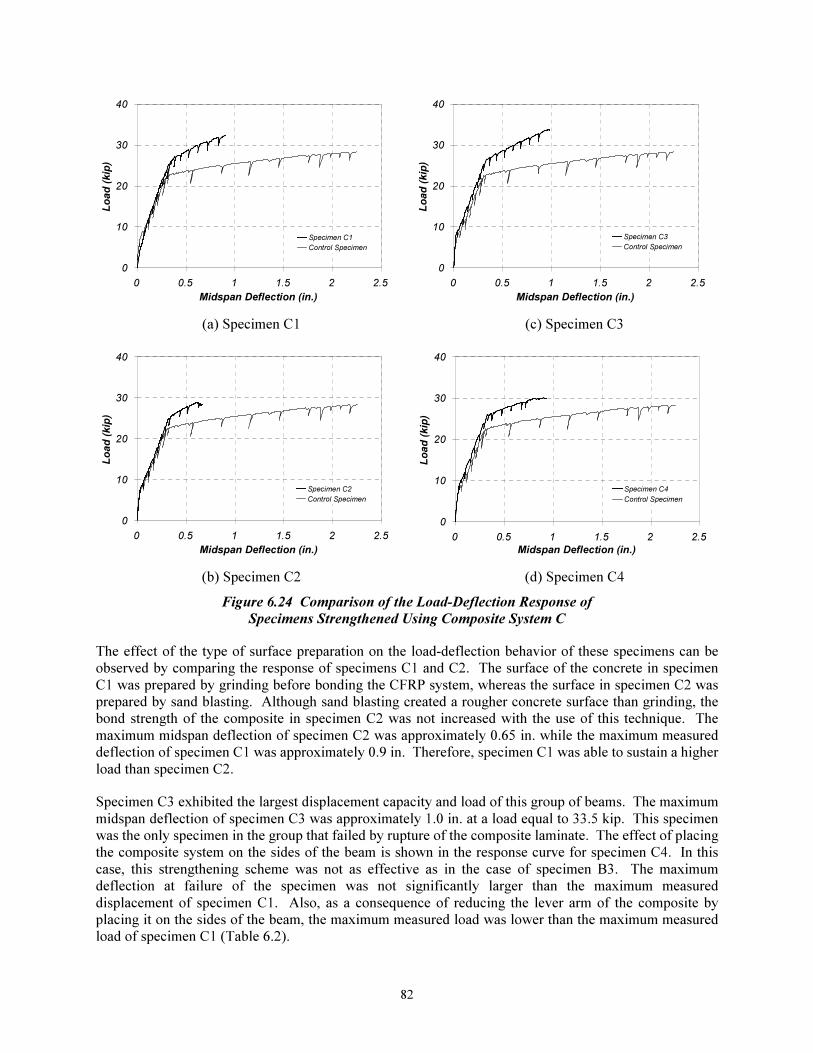
82
0
10
20
30
40
0 0.5 1 1.5 2 2.5
Midspan Deflection (in.)
Lo
ad
(k
ip)
Specimen C1
Control Specimen
0
10
20
30
40
0 0.5 1 1.5 2 2.5
Midspan Deflection (in.)
Lo
ad
(k
ip)
Specimen C3
Control Specimen
(a) Specimen C1 (c) Specimen C3
0
10
20
30
40
0 0.5 1 1.5 2 2.5
Midspan Deflection (in.)
Lo
ad
(k
ip)
Specimen C2
Control Specimen
0
10
20
30
40
0 0.5 1 1.5 2 2.5
Midspan Deflection (in.)
Lo
ad
(k
ip)
Specimen C4
Control Specimen
(b) Specimen C2 (d) Specimen C4
Figure 6.24 Comparison of the Load-Deflection Response of
Specimens Strengthened Using Composite System C
The effect of the type of surface preparation on the load-deflection behavior of these specimens can be
observed by comparing the response of specimens C1 and C2. The surface of the concrete in specimen
C1 was prepared by grinding before bonding the CFRP system, whereas the surface in specimen C2 was
prepared by sand blasting. Although sand blasting created a rougher concrete surface than grinding, the
bond strength of the composite in specimen C2 was not increased with the use of this technique. The
maximum midspan deflection of specimen C2 was approximately 0.65 in. while the maximum measured
deflection of specimen C1 was approximately 0.9 in. Therefore, specimen C1 was able to sustain a higher
load than specimen C2.
Specimen C3 exhibited the largest displacement capacity and load of this group of beams. The maximum
midspan deflection of specimen C3 was approximately 1.0 in. at a load equal to 33.5 kip. This specimen
was the only specimen in the group that failed by rupture of the composite laminate. The effect of placing
the composite system on the sides of the beam is shown in the response curve for specimen C4. In this
case, this strengthening scheme was not as effective as in the case of specimen B3. The maximum
deflection at failure of the specimen was not significantly larger than the maximum measured
displacement of specimen C1. Also, as a consequence of reducing the lever arm of the composite by
placing it on the sides of the beam, the maximum measured load was lower than the maximum measured
load of specimen C1 (Table 6.2).
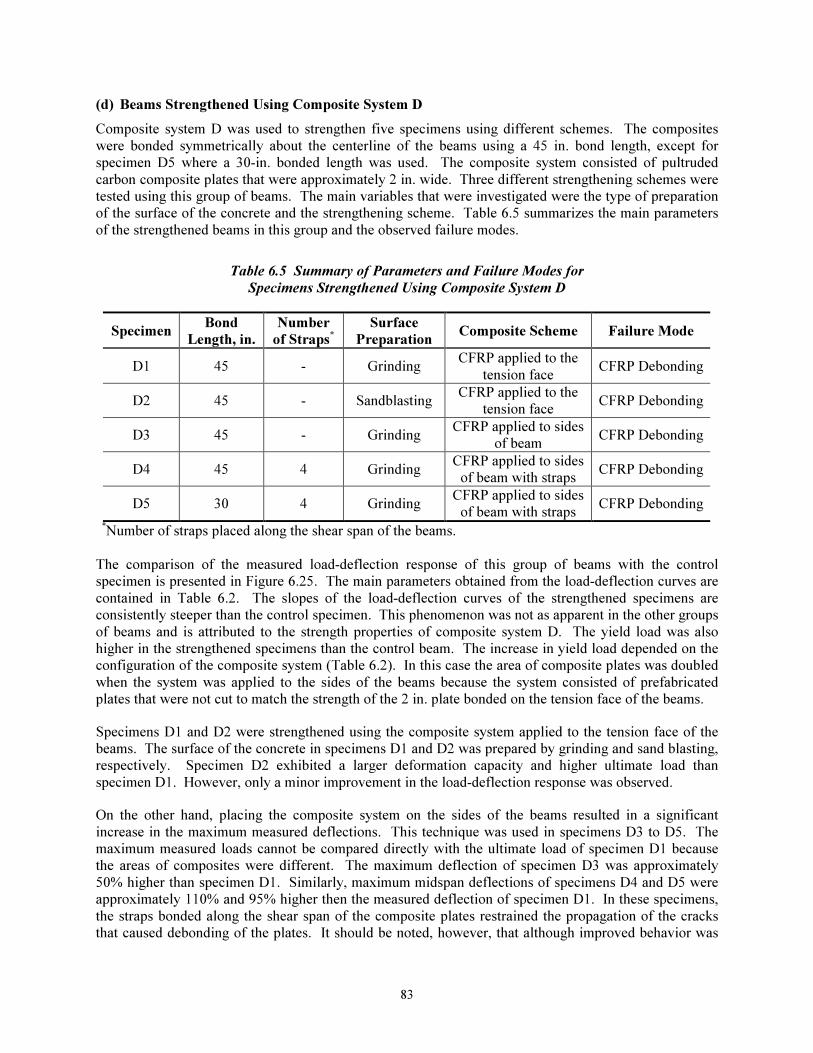
83
(d) Beams Strengthened Using Composite System D
Composite system D was used to strengthen five specimens using different schemes. The composites
were bonded symmetrically about the centerline of the beams using a 45 in. bond length, except for
specimen D5 where a 30-in. bonded length was used. The composite system consisted of pultruded
carbon composite plates that were approximately 2 in. wide. Three different strengthening schemes were
tested using this group of beams. The main variables that were investigated were the type of preparation
of the surface of the concrete and the strengthening scheme. Table 6.5 summarizes the main parameters
of the strengthened beams in this group and the observed failure modes.
Table 6.5 Summary of Parameters and Failure Modes for
Specimens Strengthened Using Composite System D
Specimen Bond
Length, in.
Number
of Straps*
Surface
Preparation Composite Scheme Failure Mode
D1 45 - Grinding CFRP applied to the
tension face CFRP Debonding
D2 45 - Sandblasting CFRP applied to the
tension face CFRP Debonding
D3 45 - Grinding CFRP applied to sides
of beam CFRP Debonding
D4 45 4 Grinding CFRP applied to sides
of beam with straps CFRP Debonding
D5 30 4 Grinding CFRP applied to sides
of beam with straps CFRP Debonding
*Number of straps placed along the shear span of the beams.
The comparison of the measured load-deflection response of this group of beams with the control
specimen is presented in Figure 6.25. The main parameters obtained from the load-deflection curves are
contained in Table 6.2. The slopes of the load-deflection curves of the strengthened specimens are
consistently steeper than the control specimen. This phenomenon was not as apparent in the other groups
of beams and is attributed to the strength properties of composite system D. The yield load was also
higher in the strengthened specimens than the control beam. The increase in yield load depended on the
configuration of the composite system (Table 6.2). In this case the area of composite plates was doubled
when the system was applied to the sides of the beams because the system consisted of prefabricated
plates that were not cut to match the strength of the 2 in. plate bonded on the tension face of the beams.
Specimens D1 and D2 were strengthened using the composite system applied to the tension face of the
beams. The surface of the concrete in specimens D1 and D2 was prepared by grinding and sand blasting,
respectively. Specimen D2 exhibited a larger deformation capacity and higher ultimate load than
specimen D1. However, only a minor improvement in the load-deflection response was observed.
On the other hand, placing the composite system on the sides of the beams resulted in a significant
increase in the maximum measured deflections. This technique was used in specimens D3 to D5. The
maximum measured loads cannot be compared directly with the ultimate load of specimen D1 because
the areas of composites were different. The maximum deflection of specimen D3 was approximately
50% higher than specimen D1. Similarly, maximum midspan deflections of specimens D4 and D5 were
approximately 110% and 95% higher then the measured deflection of specimen D1. In these specimens,
the straps bonded along the shear span of the composite plates restrained the propagation of the cracks
that caused debonding of the plates. It should be noted, however, that although improved behavior was
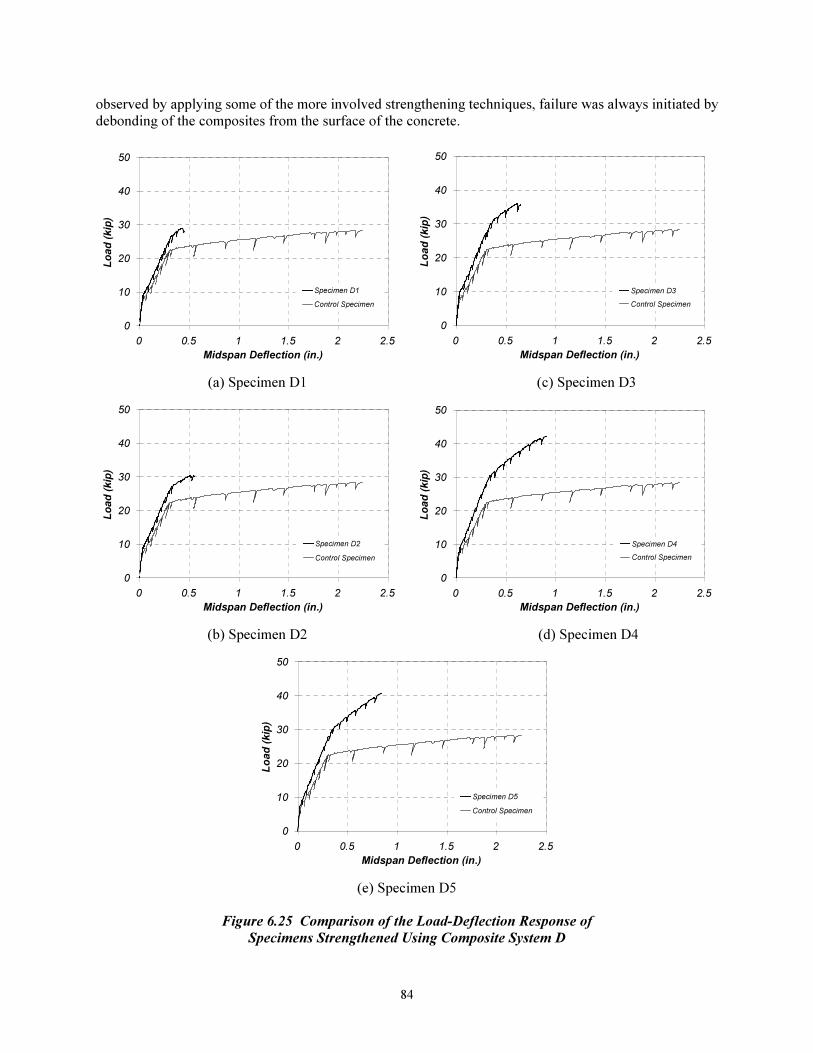
84
observed by applying some of the more involved strengthening techniques, failure was always initiated by
debonding of the composites from the surface of the concrete.
0
10
20
30
40
50
0 0.5 1 1.5 2 2.5
Midspan Deflection (in.)
Lo
ad
(k
ip)
Specimen D1
Control Specimen
0
10
20
30
40
50
0 0.5 1 1.5 2 2.5
Midspan Deflection (in.)
Lo
ad
(k
ip)
Specimen D3
Control Specimen
(a) Specimen D1 (c) Specimen D3
0
10
20
30
40
50
0 0.5 1 1.5 2 2.5
Midspan Deflection (in.)
Lo
ad
(k
ip)
Specimen D2
Control Specimen
0
10
20
30
40
50
0 0.5 1 1.5 2 2.5
Midspan Deflection (in.)
Lo
ad
(k
ip)
Specimen D4
Control Specimen
(b) Specimen D2 (d) Specimen D4
0
10
20
30
40
50
0 0.5 1 1.5 2 2.5
Midspan Deflection (in.)
Lo
ad
(k
ip)
Specimen D5
Control Specimen
(e) Specimen D5
Figure 6.25 Comparison of the Load-Deflection Response of
Specimens Strengthened Using Composite System D
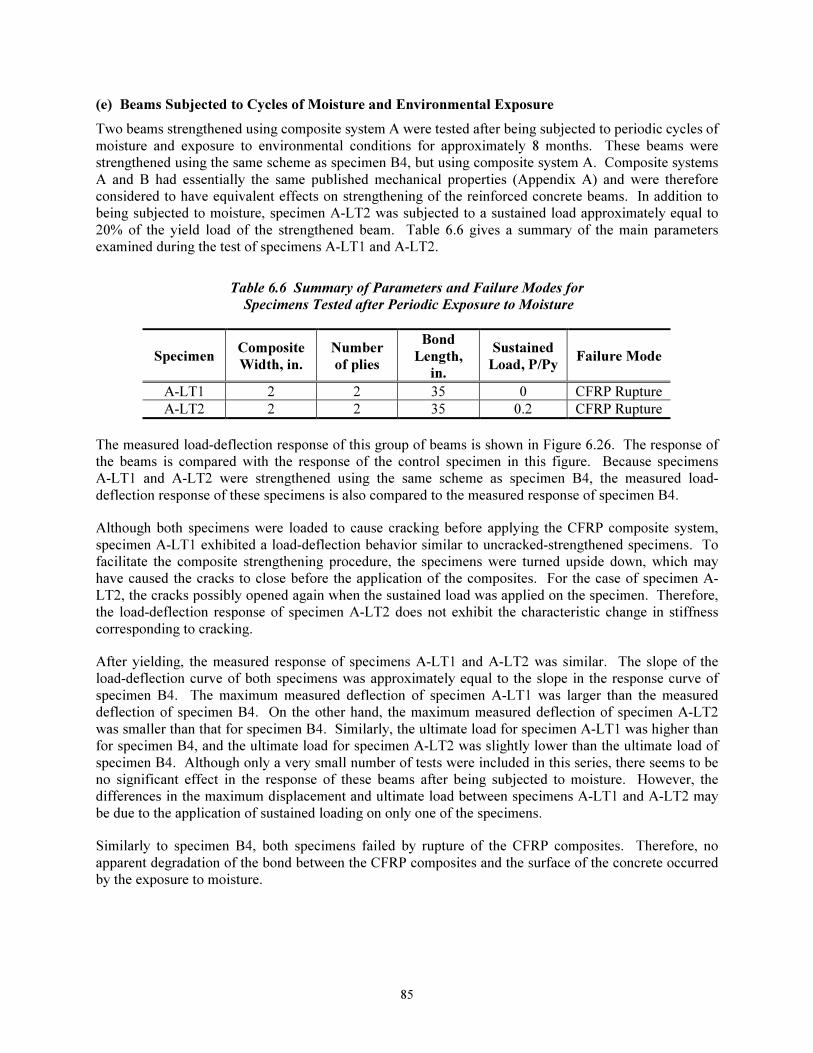
85
(e) Beams Subjected to Cycles of Moisture and Environmental Exposure
Two beams strengthened using composite system A were tested after being subjected to periodic cycles of
moisture and exposure to environmental conditions for approximately 8 months. These beams were
strengthened using the same scheme as specimen B4, but using composite system A. Composite systems
A and B had essentially the same published mechanical properties (Appendix A) and were therefore
considered to have equivalent effects on strengthening of the reinforced concrete beams. In addition to
being subjected to moisture, specimen A-LT2 was subjected to a sustained load approximately equal to
20% of the yield load of the strengthened beam. Table 6.6 gives a summary of the main parameters
examined during the test of specimens A-LT1 and A-LT2.
Table 6.6 Summary of Parameters and Failure Modes for
Specimens Tested after Periodic Exposure to Moisture
Specimen Composite
Width, in.
Number
of plies
Bond
Length,
in.
Sustained
Load, P/Py Failure Mode
A-LT1 2 2 35 0 CFRP Rupture
A-LT2 2 2 35 0.2 CFRP Rupture
The measured load-deflection response of this group of beams is shown in Figure 6.26. The response of
the beams is compared with the response of the control specimen in this figure. Because specimens
A-LT1 and A-LT2 were strengthened using the same scheme as specimen B4, the measured load-
deflection response of these specimens is also compared to the measured response of specimen B4.
Although both specimens were loaded to cause cracking before applying the CFRP composite system,
specimen A-LT1 exhibited a load-deflection behavior similar to uncracked-strengthened specimens. To
facilitate the composite strengthening procedure, the specimens were turned upside down, which may
have caused the cracks to close before the application of the composites. For the case of specimen A-
LT2, the cracks possibly opened again when the sustained load was applied on the specimen. Therefore,
the load-deflection response of specimen A-LT2 does not exhibit the characteristic change in stiffness
corresponding to cracking.
After yielding, the measured response of specimens A-LT1 and A-LT2 was similar. The slope of the
load-deflection curve of both specimens was approximately equal to the slope in the response curve of
specimen B4. The maximum measured deflection of specimen A-LT1 was larger than the measured
deflection of specimen B4. On the other hand, the maximum measured deflection of specimen A-LT2
was smaller than that for specimen B4. Similarly, the ultimate load for specimen A-LT1 was higher than
for specimen B4, and the ultimate load for specimen A-LT2 was slightly lower than the ultimate load of
specimen B4. Although only a very small number of tests were included in this series, there seems to be
no significant effect in the response of these beams after being subjected to moisture. However, the
differences in the maximum displacement and ultimate load between specimens A-LT1 and A-LT2 may
be due to the application of sustained loading on only one of the specimens.
Similarly to specimen B4, both specimens failed by rupture of the CFRP composites. Therefore, no
apparent degradation of the bond between the CFRP composites and the surface of the concrete occurred
by the exposure to moisture.
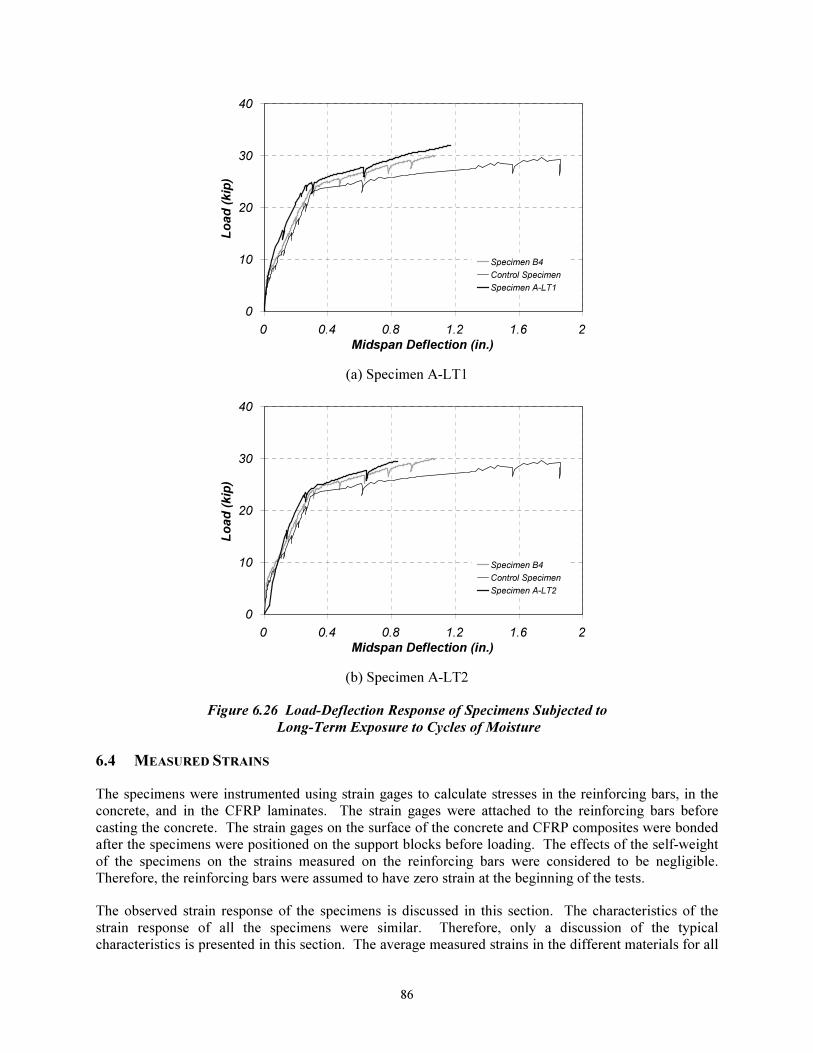
86
0
10
20
30
40
0 0.4 0.8 1.2 1.6 2
Midspan Deflection (in.)
Lo
ad
(k
ip)
Specimen B4
Control Specimen
Specimen A-LT1
(a) Specimen A-LT1
0
10
20
30
40
0 0.4 0.8 1.2 1.6 2
Midspan Deflection (in.)
Lo
ad
(k
ip)
Specimen B4
Control Specimen
Specimen A-LT2
(b) Specimen A-LT2
Figure 6.26 Load-Deflection Response of Specimens Subjected to
Long-Term Exposure to Cycles of Moisture
6.4 MEASURED STRAINS
The specimens were instrumented using strain gages to calculate stresses in the reinforcing bars, in the
concrete, and in the CFRP laminates. The strain gages were attached to the reinforcing bars before
casting the concrete. The strain gages on the surface of the concrete and CFRP composites were bonded
after the specimens were positioned on the support blocks before loading. The effects of the self-weight
of the specimens on the strains measured on the reinforcing bars were considered to be negligible.
Therefore, the reinforcing bars were assumed to have zero strain at the beginning of the tests.
The observed strain response of the specimens is discussed in this section. The characteristics of the
strain response of all the specimens were similar. Therefore, only a discussion of the typical
characteristics is presented in this section. The average measured strains in the different materials for all
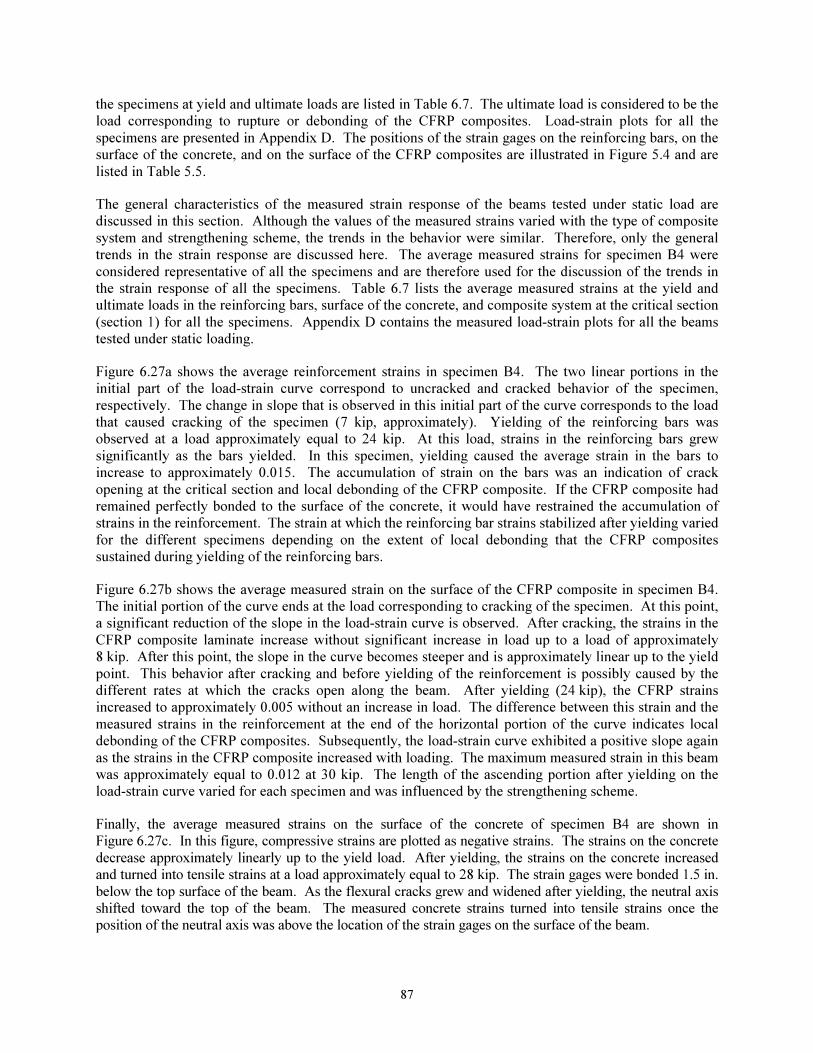
87
the specimens at yield and ultimate loads are listed in Table 6.7. The ultimate load is considered to be the
load corresponding to rupture or debonding of the CFRP composites. Load-strain plots for all the
specimens are presented in Appendix D. The positions of the strain gages on the reinforcing bars, on the
surface of the concrete, and on the surface of the CFRP composites are illustrated in Figure 5.4 and are
listed in Table 5.5.
The general characteristics of the measured strain response of the beams tested under static load are
discussed in this section. Although the values of the measured strains varied with the type of composite
system and strengthening scheme, the trends in the behavior were similar. Therefore, only the general
trends in the strain response are discussed here. The average measured strains for specimen B4 were
considered representative of all the specimens and are therefore used for the discussion of the trends in
the strain response of all the specimens. Table 6.7 lists the average measured strains at the yield and
ultimate loads in the reinforcing bars, surface of the concrete, and composite system at the critical section
(section 1) for all the specimens. Appendix D contains the measured load-strain plots for all the beams
tested under static loading.
Figure 6.27a shows the average reinforcement strains in specimen B4. The two linear portions in the
initial part of the load-strain curve correspond to uncracked and cracked behavior of the specimen,
respectively. The change in slope that is observed in this initial part of the curve corresponds to the load
that caused cracking of the specimen (7 kip, approximately). Yielding of the reinforcing bars was
observed at a load approximately equal to 24 kip. At this load, strains in the reinforcing bars grew
significantly as the bars yielded. In this specimen, yielding caused the average strain in the bars to
increase to approximately 0.015. The accumulation of strain on the bars was an indication of crack
opening at the critical section and local debonding of the CFRP composite. If the CFRP composite had
remained perfectly bonded to the surface of the concrete, it would have restrained the accumulation of
strains in the reinforcement. The strain at which the reinforcing bar strains stabilized after yielding varied
for the different specimens depending on the extent of local debonding that the CFRP composites
sustained during yielding of the reinforcing bars.
Figure 6.27b shows the average measured strain on the surface of the CFRP composite in specimen B4.
The initial portion of the curve ends at the load corresponding to cracking of the specimen. At this point,
a significant reduction of the slope in the load-strain curve is observed. After cracking, the strains in the
CFRP composite laminate increase without significant increase in load up to a load of approximately
8 kip. After this point, the slope in the curve becomes steeper and is approximately linear up to the yield
point. This behavior after cracking and before yielding of the reinforcement is possibly caused by the
different rates at which the cracks open along the beam. After yielding (24 kip), the CFRP strains
increased to approximately 0.005 without an increase in load. The difference between this strain and the
measured strains in the reinforcement at the end of the horizontal portion of the curve indicates local
debonding of the CFRP composites. Subsequently, the load-strain curve exhibited a positive slope again
as the strains in the CFRP composite increased with loading. The maximum measured strain in this beam
was approximately equal to 0.012 at 30 kip. The length of the ascending portion after yielding on the
load-strain curve varied for each specimen and was influenced by the strengthening scheme.
Finally, the average measured strains on the surface of the concrete of specimen B4 are shown in
Figure 6.27c. In this figure, compressive strains are plotted as negative strains. The strains on the concrete
decrease approximately linearly up to the yield load. After yielding, the strains on the concrete increased
and turned into tensile strains at a load approximately equal to 28 kip. The strain gages were bonded 1.5 in.
below the top surface of the beam. As the flexural cracks grew and widened after yielding, the neutral axis
shifted toward the top of the beam. The measured concrete strains turned into tensile strains once the
position of the neutral axis was above the location of the strain gages on the surface of the beam.

88
Figure 6.28 shows the average measured strains at section 2 in specimen B4. The strains in the
reinforcement and the surface of the concrete are shown in Figures 6.28a and 6.28c, respectively. The
strain response was essentially linear after cracking in these plots. However, the measured strain in the
CFRP composites increased substantially at a load approximately equal to 28 kip. This phenomenon can
be the consequence of propagation of debonding toward the end of the composite laminates. As
debonding of the CFRP composite reached section 2, the value increased to the strain at a section closer
to the maximum moment region. The magnitude of this increase depended on the extent of debonding at
section 2.
89
0
10
20
30
40
0 0.005 0.01 0.015 0.02 0.025
Strain
Lo
ad
, k
ip
(a) Average #5 Reinforcing Bar Strains
0
10
20
30
40
0 0.005 0.01 0.015 0.02 0.025
Strain
Lo
ad
, kip
(b) Average CFRP Composite Strains
0
10
20
30
40
-0.0015 -0.001 -0.0005 0 0.0005 0.001 0.0015
Strain
Lo
ad
, kip
(c) Average Concrete Strains
1.5 in
SG
CG
CF
CG – Concrete Gages
SG – Steel Gages
CF – CFRP Gages
1.5 in
SG
CG
CF
CG – Concrete Gages
SG – Steel Gages
CF – CFRP Gages
CG – Concrete Gages
SG – Steel Gages
CF – CFRP Gages
(d) Position of Strain Gages
Figure 6.27 Average Measured Strains in Specimen B4 (Section 1)

90
0
10
20
30
40
0 0.002 0.004 0.006 0.008 0.01
Strain
Lo
ad
, k
ip
(a) Average #5 Reinforcing Bar Strains
0
10
20
30
40
0 0.002 0.004 0.006 0.008 0.01
Strain
Lo
ad
, k
ip
(b) Average CFRP Composite Strains
0
10
20
30
40
-0.0015 -0.001 -0.0005 0 0.0005 0.001 0.0015
Strain
Lo
ad
, k
ip
(c) Average Concrete Strains
1.5 in
SG
CG
CF
CG – Concrete Gages
SG – Steel Gages
CF – CFRP Gages
1.5 in
SG
CG
CF
CG – Concrete Gages
SG – Steel Gages
CF – CFRP Gages
CG – Concrete Gages
SG – Steel Gages
CF – CFRP Gages
(d) Position of Strain Gages
Figure 6.28 Average Measured Strains in Specimen B4 (Section 2)
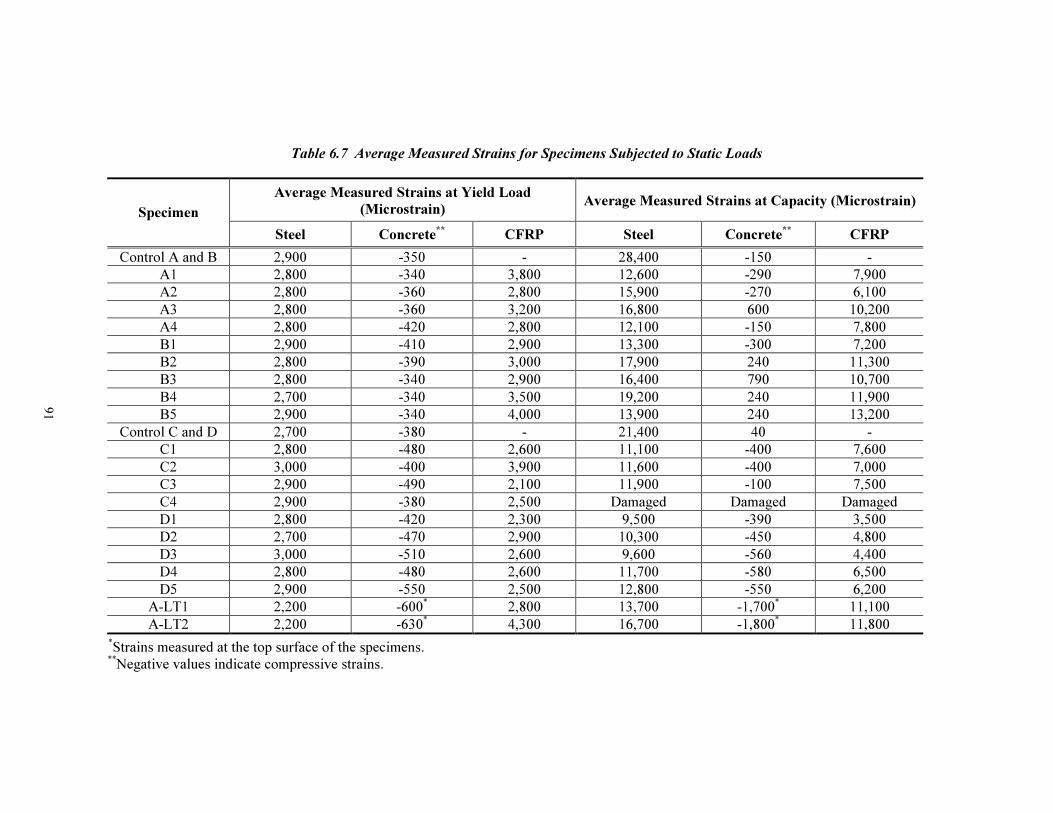
91
Table 6.7 Average Measured Strains for Specimens Subjected to Static Loads
Average Measured Strains at Yield Load
(Microstrain) Average Measured Strains at Capacity (Microstrain)
Specimen
Steel Concrete**
CFRP Steel Concrete**
CFRP
Control A and B 2,900 -350 - 28,400 -150 -
A1 2,800 -340 3,800 12,600 -290 7,900
A2 2,800 -360 2,800 15,900 -270 6,100
A3 2,800 -360 3,200 16,800 600 10,200
A4 2,800 -420 2,800 12,100 -150 7,800
B1 2,900 -410 2,900 13,300 -300 7,200
B2 2,800 -390 3,000 17,900 240 11,300
B3 2,800 -340 2,900 16,400 790 10,700
B4 2,700 -340 3,500 19,200 240 11,900
B5 2,900 -340 4,000 13,900 240 13,200
Control C and D 2,700 -380 - 21,400 40 -
C1 2,800 -480 2,600 11,100 -400 7,600
C2 3,000 -400 3,900 11,600 -400 7,000
C3 2,900 -490 2,100 11,900 -100 7,500
C4 2,900 -380 2,500 Damaged Damaged Damaged
D1 2,800 -420 2,300 9,500 -390 3,500
D2 2,700 -470 2,900 10,300 -450 4,800
D3 3,000 -510 2,600 9,600 -560 4,400
D4 2,800 -480 2,600 11,700 -580 6,500
D5 2,900 -550 2,500 12,800 -550 6,200
A-LT1 2,200 -600* 2,800 13,700 -1,700
* 11,100
A-LT2 2,200 -630* 4,300 16,700 -1,800
* 11,800
*Strains measured at the top surface of the specimens.
**Negative values indicate compressive strains.

92
6.5 SUMMARY
The observed and measured response of the specimens subjected to static loads were presented in this
chapter. The different mechanisms that led to failure of the specimens were presented and discussed in
Section 6.2. The measured load-deflection response was compared within the different groups of
specimens in Section 6.3. The effects of the different variables that were included in each of the groups
of beams were also discussed. Finally, the features of the strain response that were characteristic of all
the specimens were presented in Section 6.4. The average measured strains at yielding and ultimate of all
the specimens were summarized in this section. Chapter 7 presents a comparison of the response of
several specimens with the calculated response using the analytical model developed in Chapter 3.
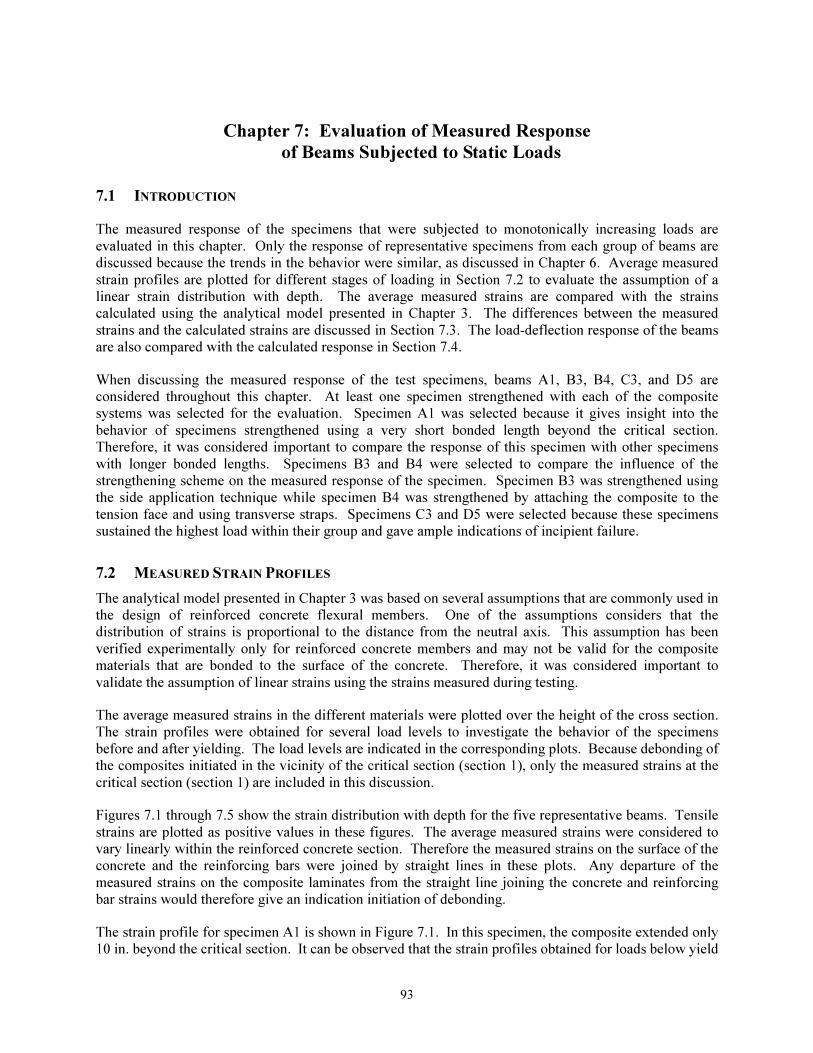
93
Chapter 7: Evaluation of Measured Response
of Beams Subjected to Static Loads
7.1 INTRODUCTION
The measured response of the specimens that were subjected to monotonically increasing loads are
evaluated in this chapter. Only the response of representative specimens from each group of beams are
discussed because the trends in the behavior were similar, as discussed in Chapter 6. Average measured
strain profiles are plotted for different stages of loading in Section 7.2 to evaluate the assumption of a
linear strain distribution with depth. The average measured strains are compared with the strains
calculated using the analytical model presented in Chapter 3. The differences between the measured
strains and the calculated strains are discussed in Section 7.3. The load-deflection response of the beams
are also compared with the calculated response in Section 7.4.
When discussing the measured response of the test specimens, beams A1, B3, B4, C3, and D5 are
considered throughout this chapter. At least one specimen strengthened with each of the composite
systems was selected for the evaluation. Specimen A1 was selected because it gives insight into the
behavior of specimens strengthened using a very short bonded length beyond the critical section.
Therefore, it was considered important to compare the response of this specimen with other specimens
with longer bonded lengths. Specimens B3 and B4 were selected to compare the influence of the
strengthening scheme on the measured response of the specimen. Specimen B3 was strengthened using
the side application technique while specimen B4 was strengthened by attaching the composite to the
tension face and using transverse straps. Specimens C3 and D5 were selected because these specimens
sustained the highest load within their group and gave ample indications of incipient failure.
7.2 MEASURED STRAIN PROFILES
The analytical model presented in Chapter 3 was based on several assumptions that are commonly used in
the design of reinforced concrete flexural members. One of the assumptions considers that the
distribution of strains is proportional to the distance from the neutral axis. This assumption has been
verified experimentally only for reinforced concrete members and may not be valid for the composite
materials that are bonded to the surface of the concrete. Therefore, it was considered important to
validate the assumption of linear strains using the strains measured during testing.
The average measured strains in the different materials were plotted over the height of the cross section.
The strain profiles were obtained for several load levels to investigate the behavior of the specimens
before and after yielding. The load levels are indicated in the corresponding plots. Because debonding of
the composites initiated in the vicinity of the critical section (section 1), only the measured strains at the
critical section (section 1) are included in this discussion.
Figures 7.1 through 7.5 show the strain distribution with depth for the five representative beams. Tensile
strains are plotted as positive values in these figures. The average measured strains were considered to
vary linearly within the reinforced concrete section. Therefore the measured strains on the surface of the
concrete and the reinforcing bars were joined by straight lines in these plots. Any departure of the
measured strains on the composite laminates from the straight line joining the concrete and reinforcing
bar strains would therefore give an indication initiation of debonding.
The strain profile for specimen A1 is shown in Figure 7.1. In this specimen, the composite extended only
10 in. beyond the critical section. It can be observed that the strain profiles obtained for loads below yield

94
are approximately linear throughout the cross section. However, at loads above yield, the measured strain
in the composite laminate does not follow the linear distribution that was assumed for the reinforced
concrete section. This change in behavior is attributed to local debonding of the composite from the
surface of the concrete at the critical section. The specimen failed at a load slightly higher than yield, due
to debonding of the composite laminate. The failure load was limited by the relatively short development
length beyond the critical section. It is interesting to note that at load levels that were slightly higher than
the observed yield load, the strain profiles depart significantly from the straight-line assumption.
Therefore, it can be concluded that debonding of the composites from the surface of the concrete took
place after yielding of the reinforcing bars occurred.
-14
-12
-10
-8
-6
-4
-2
0
-0.005 0 0.005 0.01 0.015 0.02 0.025
Strain
De
pth
(i
n.)
Cracking (P=7 kip)
50% Yield (P=12 kip)
Yield (P=24 kip)
P=24.3 kip
P=24.8 kip
Ultimate (P=26.9 kip)
-14
-12
-10
-8
-6
-4
-2
0
-0.005 0 0.005 0.01 0.015 0.02 0.025
Strain
De
pth
(i
n.)
Cracking (P=7 kip)
50% Yield (P=12 kip)
Yield (P=24 kip)
P=24.3 kip
P=24.8 kip
Ultimate (P=26.9 kip)
Figure 7.1 Strain Profiles for Specimen A1 (Section 1)
Other specimens included in this discussion were selected because the observed global behavior of the
strengthened beams was significantly different than specimen A1. In these specimens, the strengthening
configurations were selected to preclude failure by debonding of the composites from the surface of the
concrete and reach the rupture strength of the composite materials.
The strain profiles for specimens B3, B4, C3, and D5 are presented in Figures 7.2 through 7.5,
respectively. These specimens are representative of different composite systems and strengthening
schemes. Failure in specimens B3, B4, and C3 was characterized by rupture of the carbon fiber
composites, whereas failure in specimen D5 was by debonding of the composites from the surface of the
concrete. It can be observed that the behavior after yielding of the reinforcing bars in all the specimens is
similar to the behavior of specimen A1 although the observed global behavior and failure mode of the
specimens were significantly different. At load levels slightly above yield, the measured strain on the
surface of the composite laminates departs significantly from the assumption of linear strains with depth.
The strain plots give an indication of the local behavior at the critical section of the specimens and not the
overall response. Although local debonding of the composite is observed after yielding in these plots, the
composites remained attached to the surface of the concrete at other locations and the beams were able to
sustain loads well beyond the yield load.

95
-14
-12
-10
-8
-6
-4
-2
0
-0.005 0 0.005 0.01 0.015 0.02 0.025
Strain
Dep
th
(in
.)
Cracking (P=7 kip)
P=12 kip
Yield (P=23.9 kip)
P=24.6 kip
Ultimate (P=29.8 kip)
-14
-12
-10
-8
-6
-4
-2
0
-0.005 0 0.005 0.01 0.015 0.02 0.025
Strain
Dep
th
(in
.)
Cracking (P=7 kip)
P=12 kip
Yield (P=23.9 kip)
P=24.6 kip
Ultimate (P=29.8 kip)
Figure 7.2 Strain Profiles for Specimen B3 (Section 1)
-14
-12
-10
-8
-6
-4
-2
0
-0.005 0 0.005 0.01 0.015 0.02 0.025
Strain
De
pth
(i
n.)
Cracking (P=7 kip)
P=12 kip
Yield (P=23.9 kip)
P=24.3 kip
Ultimate (P=29.8 kip)
-14
-12
-10
-8
-6
-4
-2
0
-0.005 0 0.005 0.01 0.015 0.02 0.025
Strain
De
pth
(i
n.)
Cracking (P=7 kip)
P=12 kip
Yield (P=23.9 kip)
P=24.3 kip
Ultimate (P=29.8 kip)
Figure 7.3 Strain Profiles for Specimen B4 (Section 1)
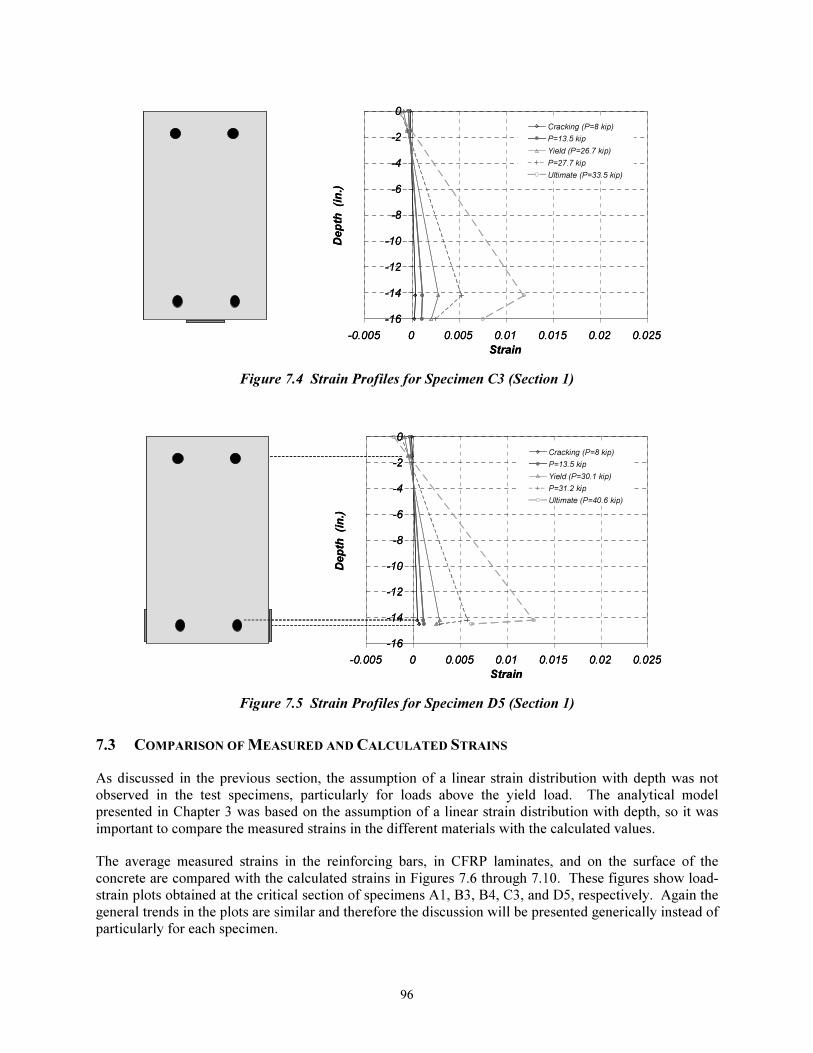
96
-16
-14
-12
-10
-8
-6
-4
-2
0
-0.005 0 0.005 0.01 0.015 0.02 0.025
Strain
De
pth
(i
n.)
Cracking (P=8 kip)
P=13.5 kip
Yield (P=26.7 kip)
P=27.7 kip
Ultimate (P=33.5 kip)
-16
-14
-12
-10
-8
-6
-4
-2
0
-0.005 0 0.005 0.01 0.015 0.02 0.025
Strain
De
pth
(i
n.)
Cracking (P=8 kip)
P=13.5 kip
Yield (P=26.7 kip)
P=27.7 kip
Ultimate (P=33.5 kip)
Figure 7.4 Strain Profiles for Specimen C3 (Section 1)
-16
-14
-12
-10
-8
-6
-4
-2
0
-0.005 0 0.005 0.01 0.015 0.02 0.025
Strain
Dep
th (i
n.)
Cracking (P=8 kip)
P=13.5 kip
Yield (P=30.1 kip)
P=31.2 kip
Ultimate (P=40.6 kip)
-16
-14
-12
-10
-8
-6
-4
-2
0
-0.005 0 0.005 0.01 0.015 0.02 0.025
Strain
Dep
th (i
n.)
Cracking (P=8 kip)
P=13.5 kip
Yield (P=30.1 kip)
P=31.2 kip
Ultimate (P=40.6 kip)
Figure 7.5 Strain Profiles for Specimen D5 (Section 1)
7.3 COMPARISON OF MEASURED AND CALCULATED STRAINS
As discussed in the previous section, the assumption of a linear strain distribution with depth was not
observed in the test specimens, particularly for loads above the yield load. The analytical model
presented in Chapter 3 was based on the assumption of a linear strain distribution with depth, so it was
important to compare the measured strains in the different materials with the calculated values.
The average measured strains in the reinforcing bars, in CFRP laminates, and on the surface of the
concrete are compared with the calculated strains in Figures 7.6 through 7.10. These figures show load-
strain plots obtained at the critical section of specimens A1, B3, B4, C3, and D5, respectively. Again the
general trends in the plots are similar and therefore the discussion will be presented generically instead of
particularly for each specimen.
97
The average measured strain in the reinforcing bars is compared with the calculated strain in Figures 7.6a
through 7.10a. The calculated strain in the reinforcing bars approximate the measured values for load
levels below yield. After yielding, the analytical model does not capture the measured strain response
because local debonding at the crack locations was not included in the model. Widening of cracks after
yielding of the reinforcement causes an increase of reinforcing bar strain under constant load. The
applied load in the specimens increased only after some debonding of the composites had occurred in the
vicinity of the cracks. The composites were not able to restrain the cracks from widening at yielding
because of local debonding.
Figures 7.6b through 7.10b show a comparison of the calculated strain and measured strain on the surface
of the composite laminates. After cracking, the calculated strains at load levels below yield were smaller
than the measured values in specimens A1, B3, and B4. On the other hand, the calculated values in
specimens C3 and D5 are approximately equal to the measured strains. This difference in the post-
cracking behavior can be caused by the variability in the tensile strength of concrete that causes the cracks
to widen and propagate differently after cracking for the different specimens. After yielding of the
specimens, however, the measured strains are in close agreement with the calculated strains. It is
interesting to note that because local debonding took place after yielding, the measured strains on the
surface of the composite did not increase although the cracks widened during yielding of the
reinforcement. A schematic representation of the strain distribution on the composite laminates as local
debonding occurs is presented in Figure 7.11. It can be seen that local debonding causes the strain in the
composite to increase in the vicinity of a crack that widens during yielding of the reinforcement. This
behavior is consistent with the measured strains at the critical section of the laboratory specimens.
Finally, a comparison of the measured and calculated strains on the surface of the concrete is presented in
Figures 7.6c through 7.10c. The calculated response agrees closely with the measured strains for load
levels below yield. The peak compressive strains were reached at yielding. After yielding, the measured
compressive strains decreased and in some specimens turned into tensile strains as a consequence of
cracks propagating toward the top of the specimens. This behavior was not observed in the plots of the
calculated strains because of the assumption of perfect bond between the composite and the surface of the
concrete. Crack propagation was restrained in the analytical model because the composites remained
attached to the surface of the concrete.
A summary of the maximum measured strains on the surface of the composites is listed in Table 7.1. The
strain at rupture as published by the different manufacturers of the composite materials is also listed in
this table. The published rupture strains were used in the analytical model to define failure of the
strengthened beams. The ratio of measured to published strains is included in the table to give a measure
of the efficiency of the strengthening scheme. It can be observed that although several specimens failed
by rupture of the CFRP composites, the published rupture strains were not achieved in any of the tests.
The average of the maximum strains developed for different strengthening schemes within the different
groups of beams are included in the table. These values were used to select a conservative value of CFRP
strain to design the strengthening scheme for specimens in the third phase of this research project.
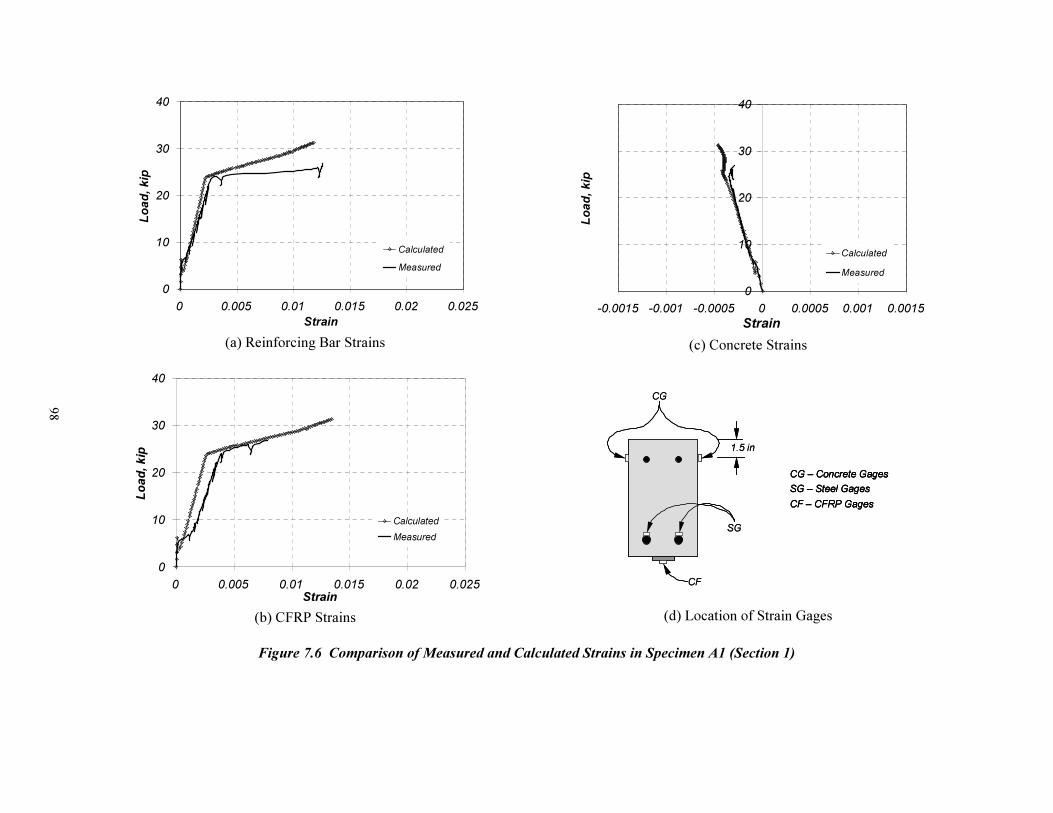
98
0
10
20
30
40
0 0.005 0.01 0.015 0.02 0.025
Strain
Lo
ad
, kip
Calculated
Measured
(a) Reinforcing Bar Strains
0
10
20
30
40
0 0.005 0.01 0.015 0.02 0.025
Strain
Lo
ad
, k
ip
Calculated
Measured
(b) CFRP Strains
0
10
20
30
40
-0.0015 -0.001 -0.0005 0 0.0005 0.001 0.0015
Strain
Lo
ad
, kip
Calculated
Measured
(c) Concrete Strains
1.5 in
SG
CG
CF
CG – Concrete Gages
SG – Steel Gages
CF – CFRP Gages
1.5 in
SG
CG
CF
CG – Concrete Gages
SG – Steel Gages
CF – CFRP Gages
CG – Concrete Gages
SG – Steel Gages
CF – CFRP Gages
(d) Location of Strain Gages
Figure 7.6 Comparison of Measured and Calculated Strains in Specimen A1 (Section 1)
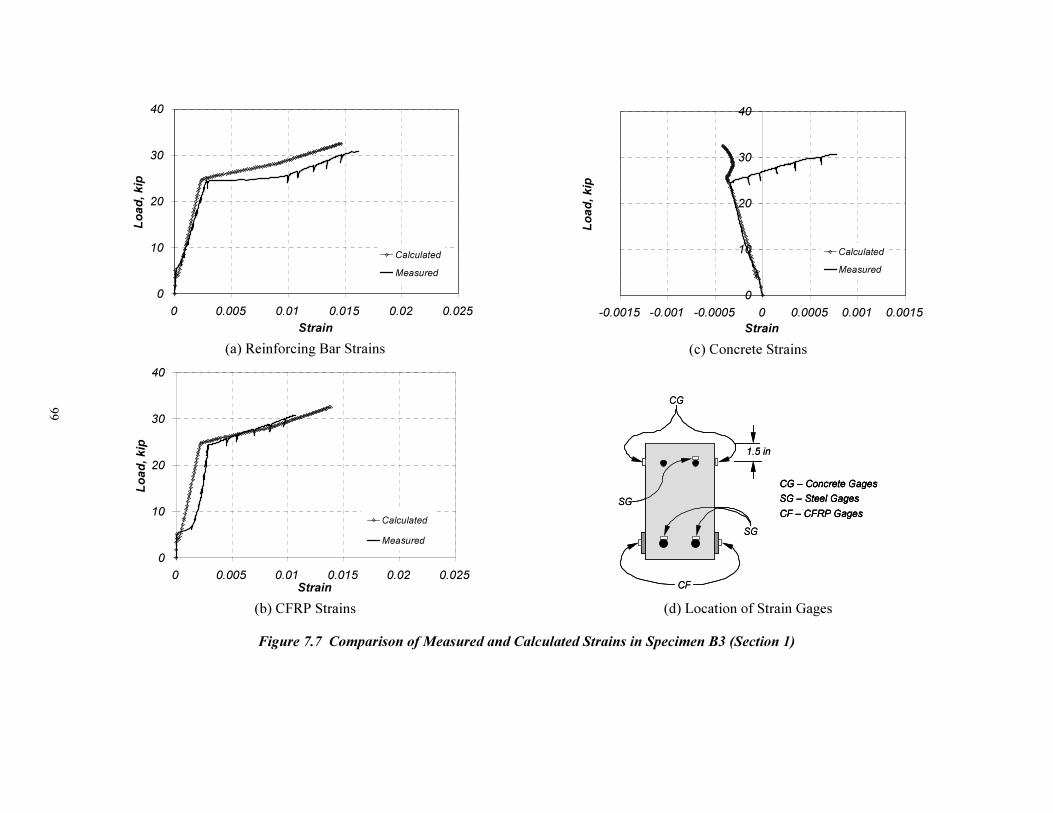
99
0
10
20
30
40
0 0.005 0.01 0.015 0.02 0.025
Strain
Lo
ad
, kip
Calculated
Measured
(a) Reinforcing Bar Strains
0
10
20
30
40
0 0.005 0.01 0.015 0.02 0.025
Strain
Lo
ad
, kip
Calculated
Measured
(b) CFRP Strains
0
10
20
30
40
-0.0015 -0.001 -0.0005 0 0.0005 0.001 0.0015
Strain
Lo
ad
, k
ip
Calculated
Measured
(c) Concrete Strains
CG – Concrete Gages
SG – Steel Gages
CF – CFRP Gages
1.5 in
SG
CG
CF
SG
CG – Concrete Gages
SG – Steel Gages
CF – CFRP Gages
CG – Concrete Gages
SG – Steel Gages
CF – CFRP Gages
1.5 in
SG
CG
CF
SG
(d) Location of Strain Gages
Figure 7.7 Comparison of Measured and Calculated Strains in Specimen B3 (Section 1)
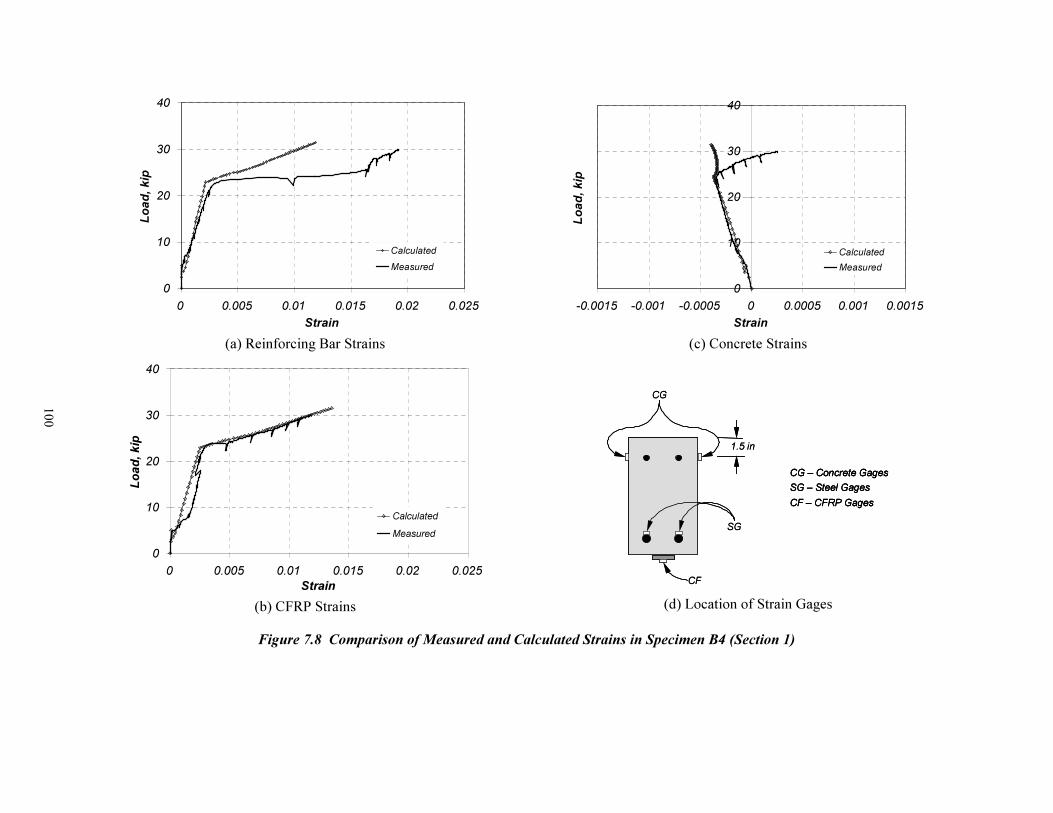
100
0
10
20
30
40
0 0.005 0.01 0.015 0.02 0.025
Strain
Lo
ad
, k
ip
Calculated
Measured
(a) Reinforcing Bar Strains
0
10
20
30
40
0 0.005 0.01 0.015 0.02 0.025
Strain
Lo
ad
, k
ip
Calculated
Measured
(b) CFRP Strains
0
10
20
30
40
-0.0015 -0.001 -0.0005 0 0.0005 0.001 0.0015
Strain
Lo
ad
, k
ip
Calculated
Measured
(c) Concrete Strains
1.5 in
SG
CG
CF
CG – Concrete Gages
SG – Steel Gages
CF – CFRP Gages
1.5 in
SG
CG
CF
CG – Concrete Gages
SG – Steel Gages
CF – CFRP Gages
CG – Concrete Gages
SG – Steel Gages
CF – CFRP Gages
(d) Location of Strain Gages
Figure 7.8 Comparison of Measured and Calculated Strains in Specimen B4 (Section 1)
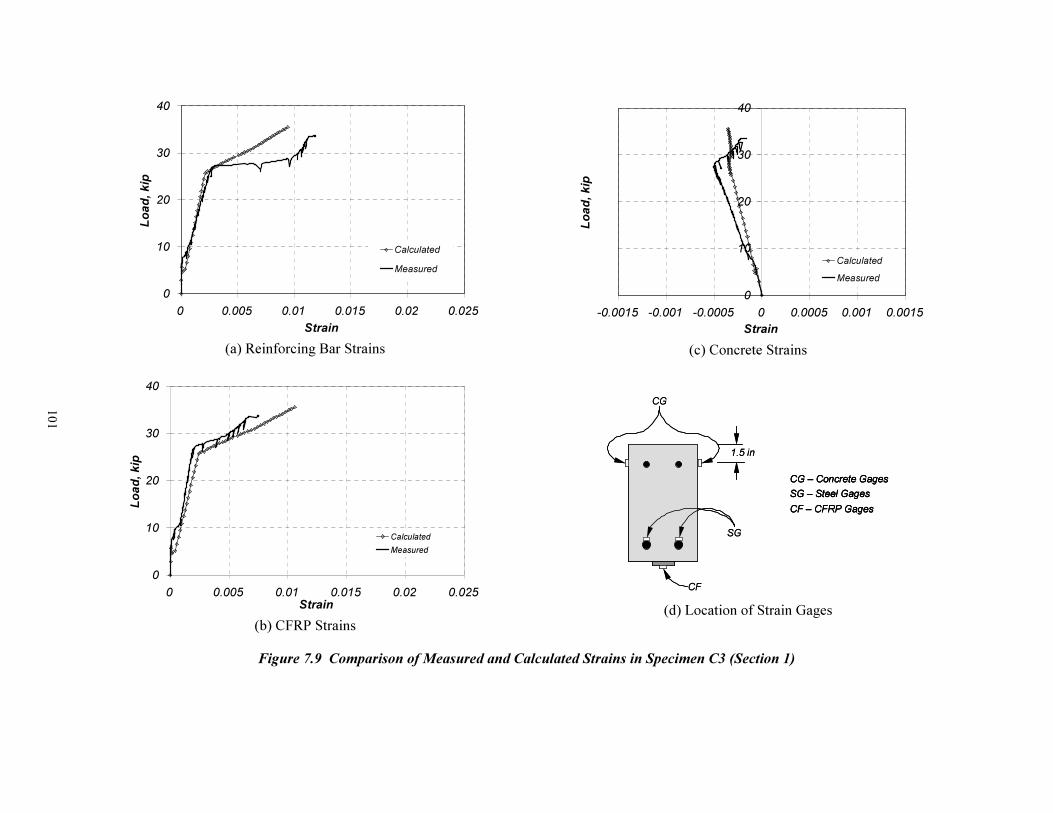
101
0
10
20
30
40
0 0.005 0.01 0.015 0.02 0.025
Strain
Lo
ad
, kip
Calculated
Measured
(a) Reinforcing Bar Strains
0
10
20
30
40
0 0.005 0.01 0.015 0.02 0.025
Strain
Lo
ad
, kip
Calculated
Measured
(b) CFRP Strains
0
10
20
30
40
-0.0015 -0.001 -0.0005 0 0.0005 0.001 0.0015
Strain
Lo
ad
, k
ip
Calculated
Measured
(c) Concrete Strains
1.5 in
SG
CG
CF
CG – Concrete Gages
SG – Steel Gages
CF – CFRP Gages
1.5 in
SG
CG
CF
CG – Concrete Gages
SG – Steel Gages
CF – CFRP Gages
CG – Concrete Gages
SG – Steel Gages
CF – CFRP Gages
(d) Location of Strain Gages
Figure 7.9 Comparison of Measured and Calculated Strains in Specimen C3 (Section 1)
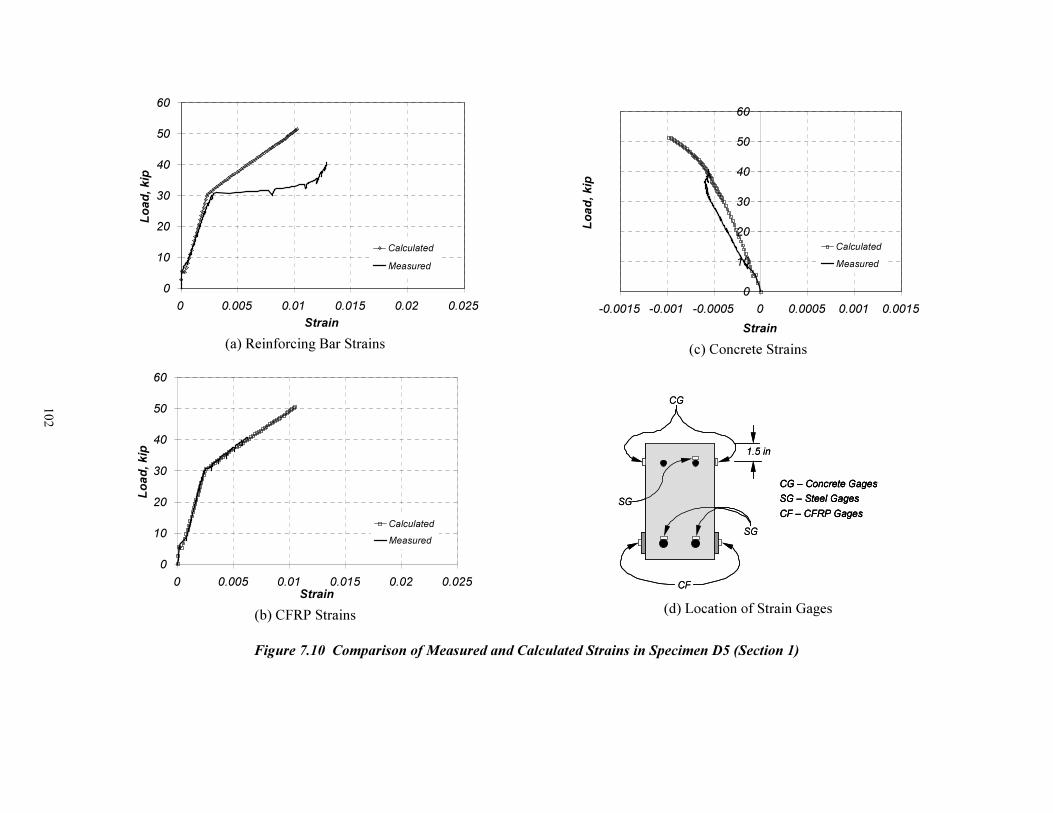
102
0
10
20
30
40
50
60
0 0.005 0.01 0.015 0.02 0.025
Strain
Lo
ad
, k
ip
Calculated
Measured
(a) Reinforcing Bar Strains
0
10
20
30
40
50
60
0 0.005 0.01 0.015 0.02 0.025
Strain
Lo
ad
, k
ip
Calculated
Measured
(b) CFRP Strains
0
10
20
30
40
50
60
-0.0015 -0.001 -0.0005 0 0.0005 0.001 0.0015
Strain
Lo
ad
, k
ip
Calculated
Measured
(c) Concrete Strains
CG – Concrete Gages
SG – Steel Gages
CF – CFRP Gages
1.5 in
SG
CG
CF
SG
CG – Concrete Gages
SG – Steel Gages
CF – CFRP Gages
CG – Concrete Gages
SG – Steel Gages
CF – CFRP Gages
1.5 in
SG
CG
CF
SG
(d) Location of Strain Gages
Figure 7.10 Comparison of Measured and Calculated Strains in Specimen D5 (Section 1)

103
εCFRPmax
*
εCFRPmax
* Localized CFRP debonding
(a) Perfect Bond Between CFRP
and Surface of Concrete
(b) Local Debonding Between CFRP
and Surface of Concrete
εCFRPmaxεCFRPmax
*
εCFRPmax
* Localized CFRP debonding*
εCFRPmax
* Localized CFRP debonding
(a) Perfect Bond Between CFRP
and Surface of Concrete
(b) Local Debonding Between CFRP
and Surface of Concrete
Figure 7.11 Schematic Distribution of Strains on the Surface of the CFRP Composites
7.4 COMPARISON OF MEASURED AND CALCULATED DEFLECTIONS
The load-deflection behavior of the strengthened specimens was also compared with the calculated
response using the procedure described in Chapter 3. The load-deflection response was calculated for the
same specimens that were discussed in the previous section. The same specimens were selected not only
because they are representative of each composite system, but also because it was considered important to
evaluate whether the differences in the measured and analytical strain responses would have any effect on
the global load-deflection response of the specimens.
A comparison between the measured and calculated load-deflection response of specimen A1 is shown in
Figure 7.12. The calculated response approximates very closely the measured response of the specimen
at load levels below the yield load. After yielding, the specimen failed at a much lower load than the
calculated capacity. This difference is attributable to debonding of the CFRP composite immediately
after yielding of the reinforcement during the laboratory test. While failure in the analytical model is
defined by carbon fiber rupture, failure during the test was by CFRP debonding from the surface of the
concrete.
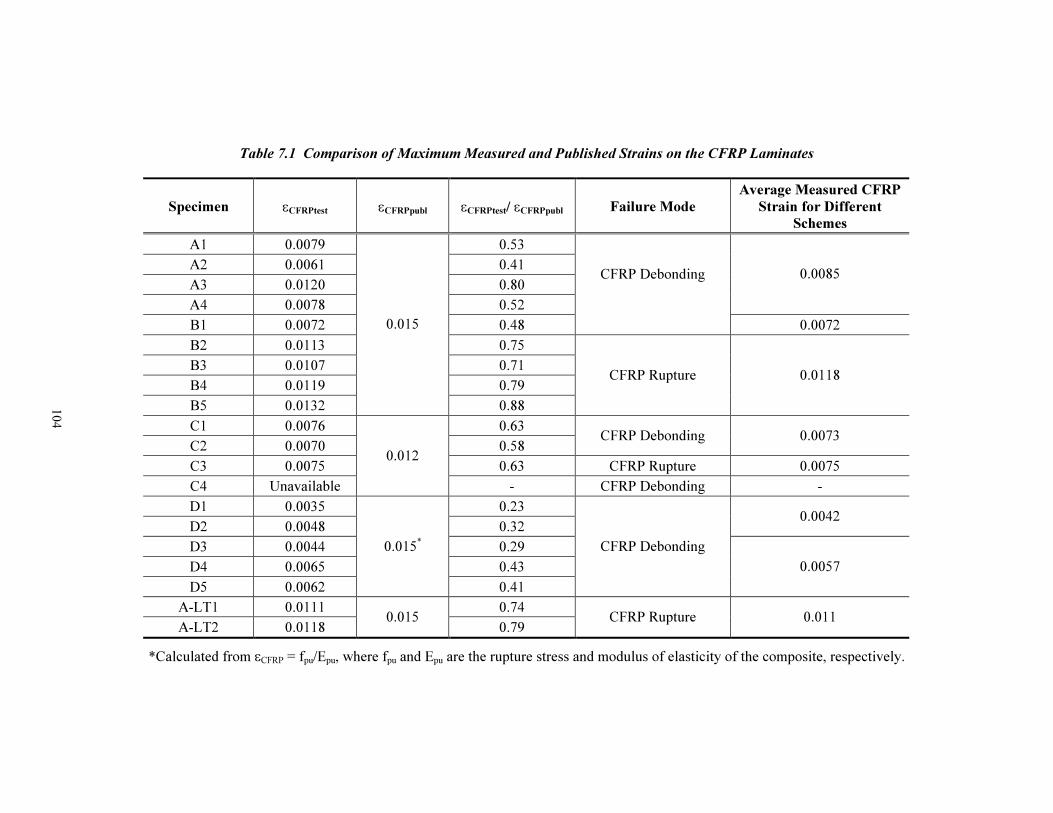
104
Table 7.1 Comparison of Maximum Measured and Published Strains on the CFRP Laminates
Specimen εCFRPtest εCFRPpubl εCFRPtest/ εCFRPpubl Failure Mode
Average Measured CFRP
Strain for Different
Schemes
A1 0.0079 0.53
A2 0.0061 0.41
A3 0.0120 0.80
A4 0.0078 0.52
0.0085
B1 0.0072 0.48
CFRP Debonding
0.0072
B2 0.0113 0.75
B3 0.0107 0.71
B4 0.0119 0.79
B5 0.0132
0.015
0.88
CFRP Rupture 0.0118
C1 0.0076 0.63
C2 0.0070 0.58 CFRP Debonding 0.0073
C3 0.0075 0.63 CFRP Rupture 0.0075
C4 Unavailable
0.012
- CFRP Debonding -
D1 0.0035 0.23
D2 0.0048 0.32 0.0042
D3 0.0044 0.29
D4 0.0065 0.43
D5 0.0062
0.015*
0.41
CFRP Debonding
0.0057
A-LT1 0.0111 0.74
A-LT2 0.0118 0.015
0.79 CFRP Rupture 0.011
*Calculated from εCFRP = fpu/Epu, where fpu and Epu are the rupture stress and modulus of elasticity of the composite, respectively.

105
0
10
20
30
40
0 0.4 0.8 1.2 1.6 2
Midspan Deflection (in.)
Lo
ad
(k
ip)
Calculated
Specimen A1
Figure 7.12 Comparison of Measured and Calculated
Load-Deflection Response of Specimen A1
The measured and calculated responses of specimens B3, B4, C3, and D5 with the calculated response are
presented in Figures 7.13 through 7.16. The load-deflection behavior in these specimens was similar and
was considered representative of other specimens within their respective beam groups. The primary
difference in behavior was observed in the post-yield region of the load-deflection curves. The slope and
the length of the post-yield region of the measured load-deflection curves varied for the different
specimens subjected to monotonically increasing loads.
0
10
20
30
40
0 0.4 0.8 1.2 1.6
Midspan Deflection (in.)
Lo
ad
(k
ip)
Calculated
Specimen B3
Figure 7.13 Comparison of Measured and Calculated
Load-Deflection Response of Specimen B3
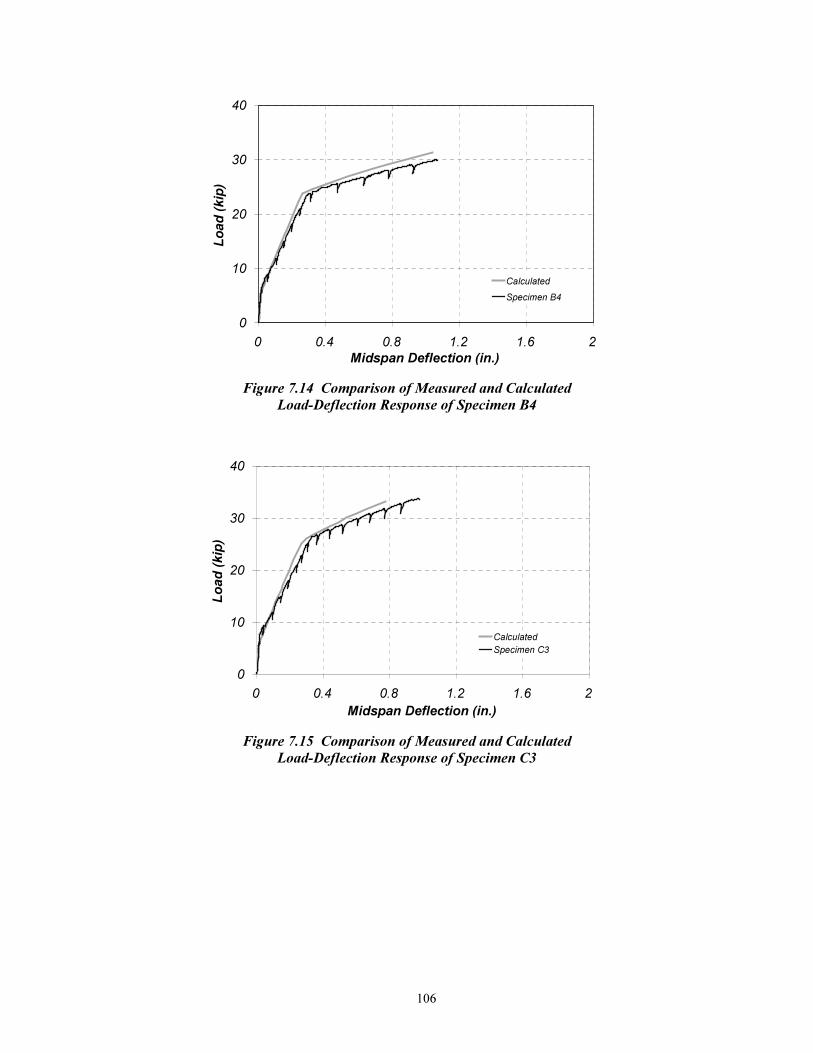
106
0
10
20
30
40
0 0.4 0.8 1.2 1.6 2
Midspan Deflection (in.)
Lo
ad
(k
ip)
Calculated
Specimen B4
Figure 7.14 Comparison of Measured and Calculated
Load-Deflection Response of Specimen B4
0
10
20
30
40
0 0.4 0.8 1.2 1.6 2
Midspan Deflection (in.)
Lo
ad
(k
ip)
Calculated
Specimen C3
Figure 7.15 Comparison of Measured and Calculated
Load-Deflection Response of Specimen C3
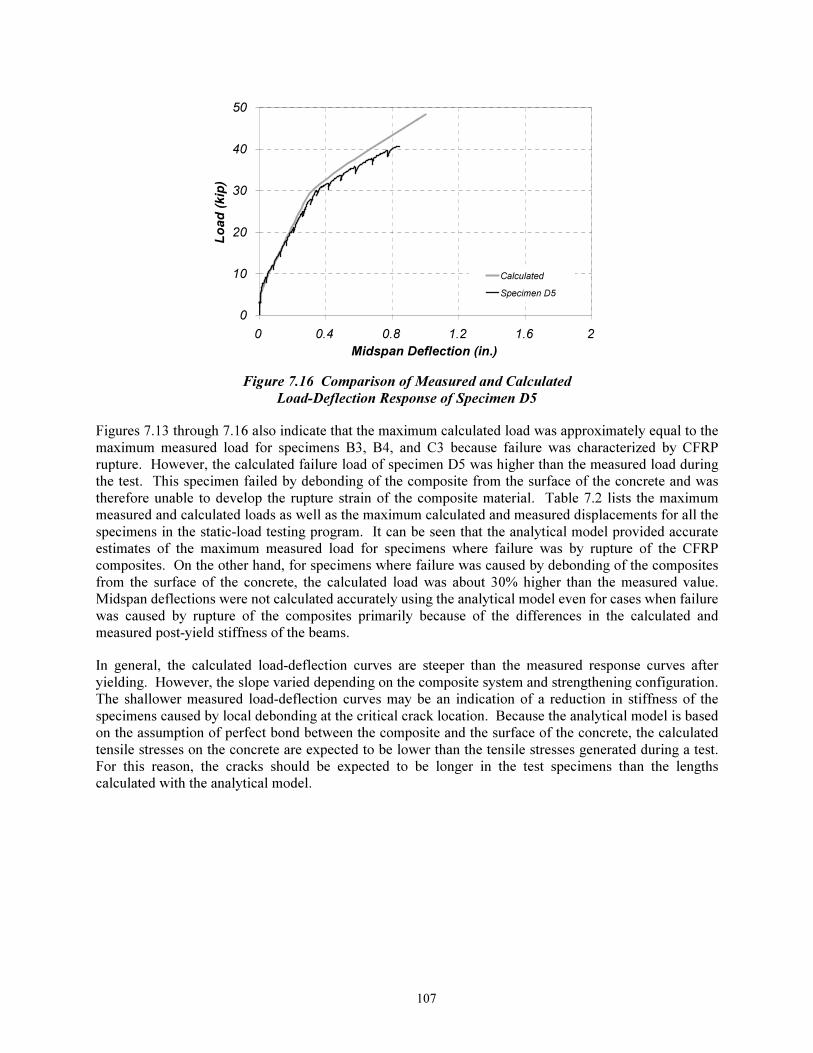
107
0
10
20
30
40
50
0 0.4 0.8 1.2 1.6 2
Midspan Deflection (in.)
Lo
ad
(kip
)
Calculated
Specimen D5
Figure 7.16 Comparison of Measured and Calculated
Load-Deflection Response of Specimen D5
Figures 7.13 through 7.16 also indicate that the maximum calculated load was approximately equal to the
maximum measured load for specimens B3, B4, and C3 because failure was characterized by CFRP
rupture. However, the calculated failure load of specimen D5 was higher than the measured load during
the test. This specimen failed by debonding of the composite from the surface of the concrete and was
therefore unable to develop the rupture strain of the composite material. Table 7.2 lists the maximum
measured and calculated loads as well as the maximum calculated and measured displacements for all the
specimens in the static-load testing program. It can be seen that the analytical model provided accurate
estimates of the maximum measured load for specimens where failure was by rupture of the CFRP
composites. On the other hand, for specimens where failure was caused by debonding of the composites
from the surface of the concrete, the calculated load was about 30% higher than the measured value.
Midspan deflections were not calculated accurately using the analytical model even for cases when failure
was caused by rupture of the composites primarily because of the differences in the calculated and
measured post-yield stiffness of the beams.
In general, the calculated load-deflection curves are steeper than the measured response curves after
yielding. However, the slope varied depending on the composite system and strengthening configuration.
The shallower measured load-deflection curves may be an indication of a reduction in stiffness of the
specimens caused by local debonding at the critical crack location. Because the analytical model is based
on the assumption of perfect bond between the composite and the surface of the concrete, the calculated
tensile stresses on the concrete are expected to be lower than the tensile stresses generated during a test.
For this reason, the cracks should be expected to be longer in the test specimens than the lengths
calculated with the analytical model.
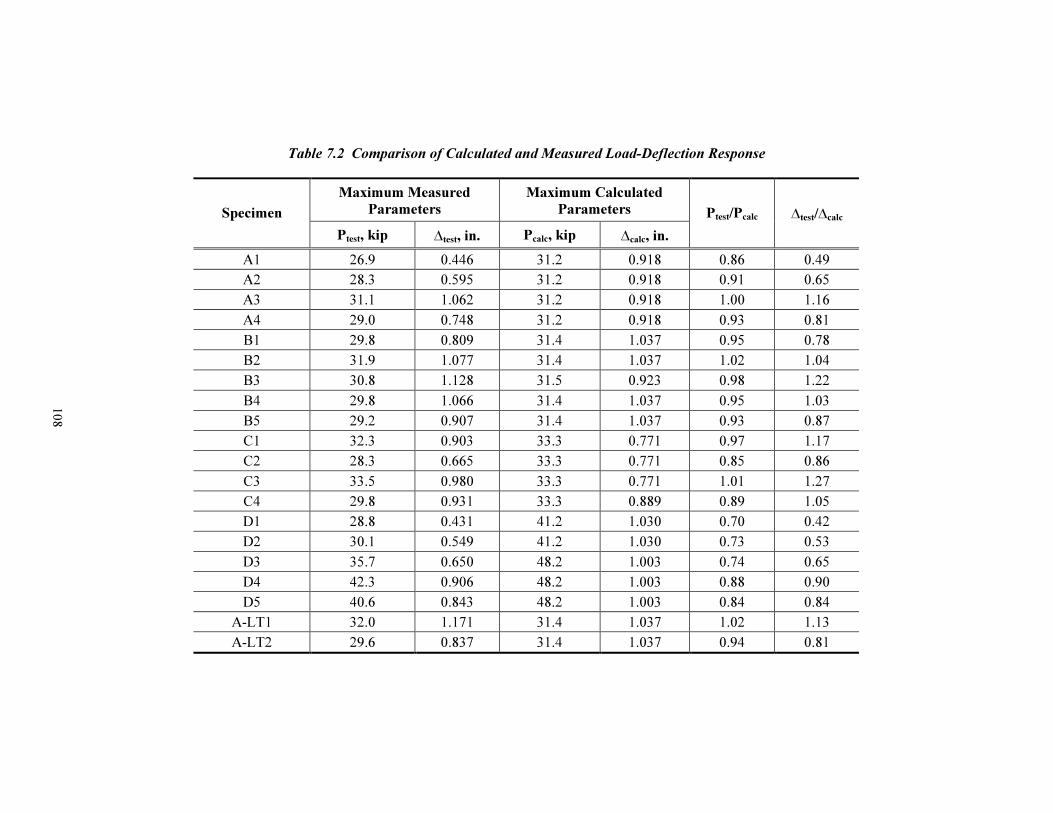
108
Table 7.2 Comparison of Calculated and Measured Load-Deflection Response
Maximum Measured
Parameters
Maximum Calculated
Parameters Specimen
Ptest, kip ∆test, in. Pcalc, kip ∆calc, in.
Ptest/Pcalc ∆test/∆calc
A1 26.9 0.446 31.2 0.918 0.86 0.49
A2 28.3 0.595 31.2 0.918 0.91 0.65
A3 31.1 1.062 31.2 0.918 1.00 1.16
A4 29.0 0.748 31.2 0.918 0.93 0.81
B1 29.8 0.809 31.4 1.037 0.95 0.78
B2 31.9 1.077 31.4 1.037 1.02 1.04
B3 30.8 1.128 31.5 0.923 0.98 1.22
B4 29.8 1.066 31.4 1.037 0.95 1.03
B5 29.2 0.907 31.4 1.037 0.93 0.87
C1 32.3 0.903 33.3 0.771 0.97 1.17
C2 28.3 0.665 33.3 0.771 0.85 0.86
C3 33.5 0.980 33.3 0.771 1.01 1.27
C4 29.8 0.931 33.3 0.889 0.89 1.05
D1 28.8 0.431 41.2 1.030 0.70 0.42
D2 30.1 0.549 41.2 1.030 0.73 0.53
D3 35.7 0.650 48.2 1.003 0.74 0.65
D4 42.3 0.906 48.2 1.003 0.88 0.90
D5 40.6 0.843 48.2 1.003 0.84 0.84
A-LT1 32.0 1.171 31.4 1.037 1.02 1.13
A-LT2 29.6 0.837 31.4 1.037 0.94 0.81
109
7.5 SUMMARY
The measured response of the beams subjected to monotonically increasing loads was evaluated in this
chapter. Strain profiles were obtained for representative specimens in Section 7.2 to evaluate the
assumption of a linear distribution of strains with depth of the cross section. It was concluded that the
strains did not follow a linear distribution particularly after yielding of the reinforcement because of local
debonding of the composites from the surface of the concrete. A comparison between measured and
calculated strains on the different materials was presented in Section 7.3. For load levels below the yield
load, the calculated strains were reasonably closed to the measured values. After yielding, however, the
calculated strains did not provide an accurate representation of the measured strains because of the
occurrence of local debonding in the vicinity of the critical section. In particular, the analytical model did
not capture the accumulation of plastic strains on the reinforcement after yielding. Finally, the measured
load-deflection response of the specimens was compared with the calculated response in Section 7.4.
Only representative specimens from each of the beam groups were used for the comparison because the
general trends in the response were similar for all the tests. It was found that although not all the
characteristics of the strain response were captured using the analytical model, the global response of the
specimens was well represented.

110
111
Chapter 8: Measured Response of Beams Subjected to Fatigue Loading
8.1 INTRODUCTION
The measured response of the specimens subjected to fatigue loads are presented in this chapter. The
observed behavior of the specimens during the tests is presented in Section 8.2. The observed response
during cycling and during the subsequent monotonically increasing loads to failure of some of the
specimens is presented in detail in this section. A discussion of the measured load-deflection response of
the two groups of beams tested under fatigue loading is presented in Section 8.3. The measured load-
deflection response is compared with the response of companion specimens subjected to static loads.
Finally, the measured strain response of the specimens is presented in Section 8.4. The effects of cycling
on the load-strain response of the specimens are also discussed in this section.
8.2 OBSERVED RESPONSE OF SPECIMENS DURING TESTING
The observed response of the specimens during testing is presented in this section. The application of
cyclic loads was stopped periodically during testing to conduct a static-load cycle and collect readings
from the instrumentation connected to the specimens. During the static-load cycles, cracks were also
marked and measured to relate the extension of cracks caused by the application of repeated loads to
specimen failure. Typical sequences of crack growths are presented in the description of each of the
beam groups that were tested in this part of the research program. The cracking patterns and crack width
sequences of all the specimens are presented in Appendix B.
The specimens were also examined during the static-load cycles to observe if any debonding cracks were
formed at different stages in the cyclic load history. The discussion in this section concentrates therefore
on the observed differences in the behavior of the specimens among the beams within each group. The
differences in the measured load-deflection response and the measured strain response are discussed in
Sections 8.3 and 8.4, respectively.
Two composite systems were used to strengthen the beams that were subjected to fatigue loads. The
beams were subjected to different load amplitudes and number of cycles. Beams that were subjected to
amplitudes of loading approximately equal to 33% or 50% of the measured yield load of companion
strengthened specimens were tested statically to failure after being subjected to one million cycles.
Beams subjected to load amplitudes of approximately 90% or 110% of the measured yield load were
subjected to fatigue loading until failure. A detailed discussion of the specimen characteristics and
loading schemes were presented in Chapter 5.
8.2.1 Beams Strengthened Using Composite System A
The specimens in this group were strengthened using the strengthening scheme used for specimen B4 in
the static-load tests. The strengthening configuration was chosen because failure in specimen B4 was
characterized by CFRP rupture accompanied by significant deflections. Therefore, the observed response
of the specimens in this group were compared with the response of specimen B4 to evaluate the influence
of repeated loading on the behavior of the beams. Specimens A-F1, A-F2, and A-F3 were subjected to
load amplitudes representative of service-load conditions, whereas specimen A-F4 was subjected to loads
representative of overload conditions on a bridge. Specimens A-F1 through A-F3 were subjected to a
static-load test to failure after the application of 10,000 or one million loading cycles.
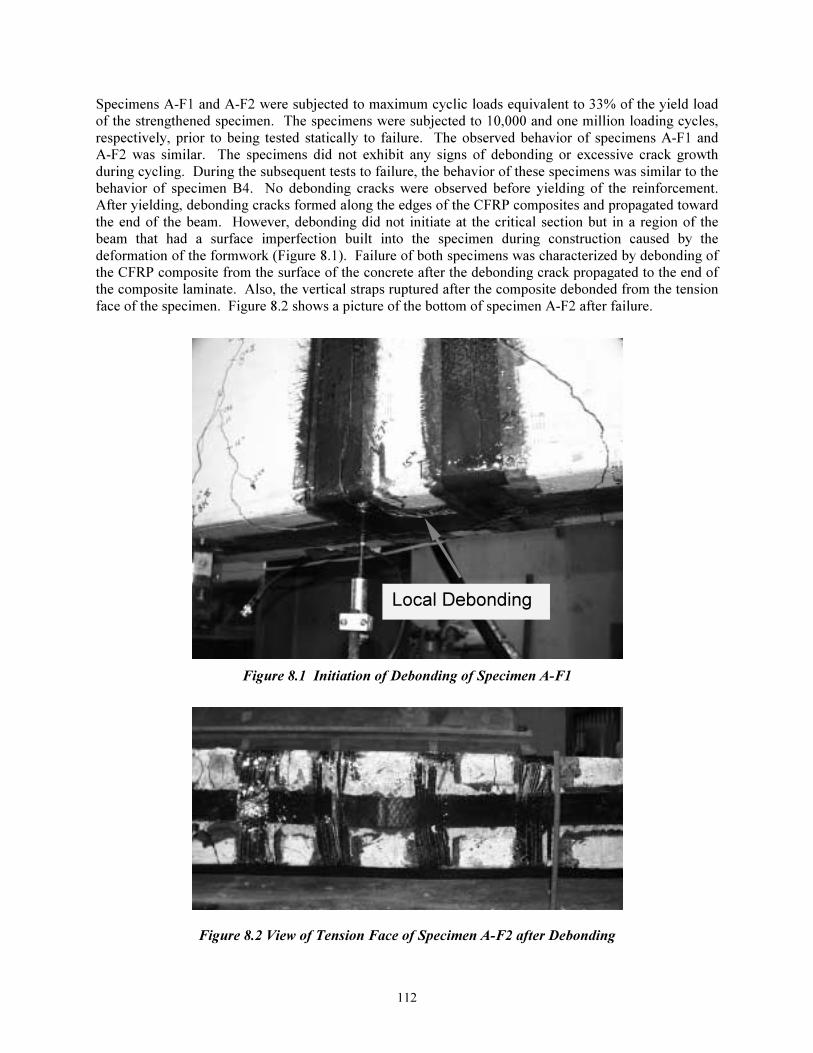
112
Specimens A-F1 and A-F2 were subjected to maximum cyclic loads equivalent to 33% of the yield load
of the strengthened specimen. The specimens were subjected to 10,000 and one million loading cycles,
respectively, prior to being tested statically to failure. The observed behavior of specimens A-F1 and
A-F2 was similar. The specimens did not exhibit any signs of debonding or excessive crack growth
during cycling. During the subsequent tests to failure, the behavior of these specimens was similar to the
behavior of specimen B4. No debonding cracks were observed before yielding of the reinforcement.
After yielding, debonding cracks formed along the edges of the CFRP composites and propagated toward
the end of the beam. However, debonding did not initiate at the critical section but in a region of the
beam that had a surface imperfection built into the specimen during construction caused by the
deformation of the formwork (Figure 8.1). Failure of both specimens was characterized by debonding of
the CFRP composite from the surface of the concrete after the debonding crack propagated to the end of
the composite laminate. Also, the vertical straps ruptured after the composite debonded from the tension
face of the specimen. Figure 8.2 shows a picture of the bottom of specimen A-F2 after failure.
Figure 8.1 Initiation of Debonding of Specimen A-F1
Figure 8.2 View of Tension Face of Specimen A-F2 after Debonding
Local Debonding
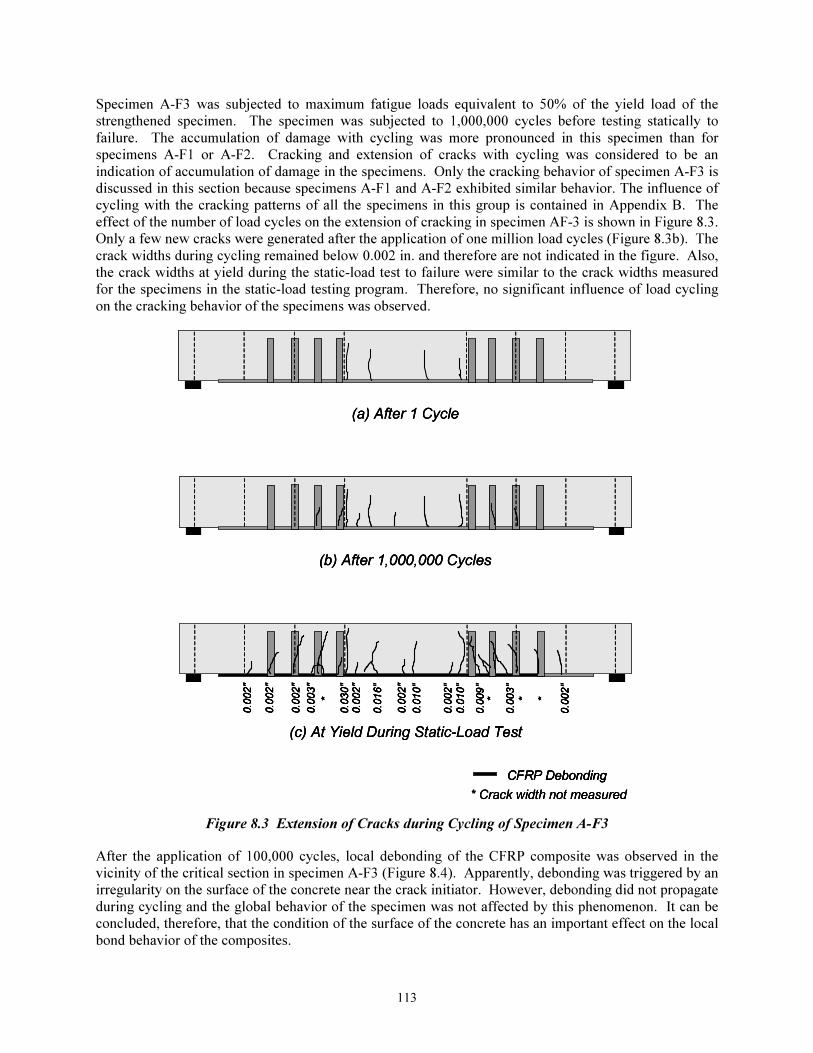
113
Specimen A-F3 was subjected to maximum fatigue loads equivalent to 50% of the yield load of the
strengthened specimen. The specimen was subjected to 1,000,000 cycles before testing statically to
failure. The accumulation of damage with cycling was more pronounced in this specimen than for
specimens A-F1 or A-F2. Cracking and extension of cracks with cycling was considered to be an
indication of accumulation of damage in the specimens. Only the cracking behavior of specimen A-F3 is
discussed in this section because specimens A-F1 and A-F2 exhibited similar behavior. The influence of
cycling with the cracking patterns of all the specimens in this group is contained in Appendix B. The
effect of the number of load cycles on the extension of cracking in specimen AF-3 is shown in Figure 8.3.
Only a few new cracks were generated after the application of one million load cycles (Figure 8.3b). The
crack widths during cycling remained below 0.002 in. and therefore are not indicated in the figure. Also,
the crack widths at yield during the static-load test to failure were similar to the crack widths measured
for the specimens in the static-load testing program. Therefore, no significant influence of load cycling
on the cracking behavior of the specimens was observed.
(a) After 1 Cycle
* Crack width not measured
CFRP Debonding
(c) At Yield During Static-Load Test
0.030"
0.016"
0.010"
0.002"
0.010"
0.003"
0.002"
0.009"
* *
0.002"
0.003"
0.002"
0.002"
*
0.002"
0.002"
*
(b) After 1,000,000 Cycles
(a) After 1 Cycle(a) After 1 Cycle
* Crack width not measured
CFRP Debonding
* Crack width not measured
CFRP DebondingCFRP Debonding
(c) At Yield During Static-Load Test
0.030"
0.016"
0.010"
0.002"
0.010"
0.003"
0.002"
0.009"
* *
0.002"
0.003"
0.002"
0.002"
*
0.002"
0.002"
*
(c) At Yield During Static-Load Test
0.030"
0.016"
0.010"
0.002"
0.010"
0.003"
0.002"
0.009"
* *
0.002"
0.003"
0.002"
0.002"
*
0.002"
0.002"
*
0.030"
0.016"
0.010"
0.002"
0.010"
0.003"
0.002"
0.009"
* *
0.002"
0.003"
0.002"
0.002"
*
0.002"
0.002"
*
(b) After 1,000,000 Cycles(b) After 1,000,000 Cycles
Figure 8.3 Extension of Cracks during Cycling of Specimen A-F3
After the application of 100,000 cycles, local debonding of the CFRP composite was observed in the
vicinity of the critical section in specimen A-F3 (Figure 8.4). Apparently, debonding was triggered by an
irregularity on the surface of the concrete near the crack initiator. However, debonding did not propagate
during cycling and the global behavior of the specimen was not affected by this phenomenon. It can be
concluded, therefore, that the condition of the surface of the concrete has an important effect on the local
bond behavior of the composites.
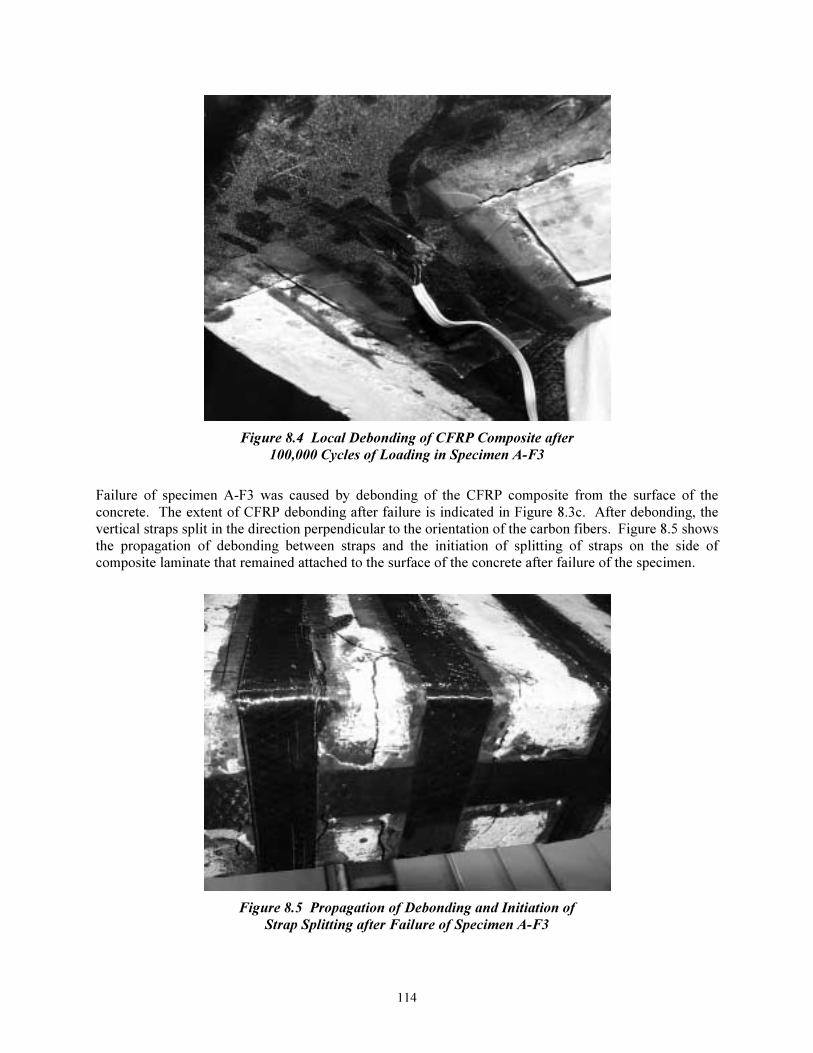
114
Figure 8.4 Local Debonding of CFRP Composite after
100,000 Cycles of Loading in Specimen A-F3
Failure of specimen A-F3 was caused by debonding of the CFRP composite from the surface of the
concrete. The extent of CFRP debonding after failure is indicated in Figure 8.3c. After debonding, the
vertical straps split in the direction perpendicular to the orientation of the carbon fibers. Figure 8.5 shows
the propagation of debonding between straps and the initiation of splitting of straps on the side of
composite laminate that remained attached to the surface of the concrete after failure of the specimen.
Figure 8.5 Propagation of Debonding and Initiation of
Strap Splitting after Failure of Specimen A-F3

115
Specimen A-F4 was subjected to maximum cyclic loads equivalent to 90% of the yield load of the
strengthened specimen. Due to the larger amplitude of cycling, the cracks were significantly wider than
the cracks measured during cycling of specimens A-F1 through A-F3. Also, the accumulation of damage
was more pronounced in this case and was apparent after fewer cycles of applied load. Figure 8.6
illustrates the observed crack growth of specimen A-F4 after 10,000 cycles of loading. Similarly to other
specimens in this group, new cracks formed with cycling but the crack widths did not change.
(a) After 1 Cycle
0.003"
0.003"
0.005"
0.009"
0.002"
0.007"
0.009"
0.002"
0.002"
0.002"
* *
0.003"
0.002"
*
(b) After 10,000 Cycles
0.003"
0.003"
0.005"
0.009"
0.002"
0.007"
0.009"
0.002"
0.002"
0.002"
* *
0.003"
0.002"
*
0.003"
0.002"
(c) After 155,490 Cycles (Failure)
0.003"
0.003"
0.005"
0.125"
0.002"
0.007"
0.009"
0.002"
0.002"
0.002"
* *
0.003"
0.002"
*
0.003"
0.002"
* Crack width not measured
CFRP Debonding
(a) After 1 Cycle
0.003"
0.003"
0.005"
0.009"
0.002"
0.007"
0.009"
0.002"
0.002"
0.002"
* *
0.003"
0.002"
*
(a) After 1 Cycle
0.003"
0.003"
0.005"
0.009"
0.002"
0.007"
0.009"
0.002"
0.002"
0.002"
* *
0.003"
0.002"
*
0.003"
0.003"
0.005"
0.009"
0.002"
0.007"
0.009"
0.002"
0.002"
0.002"
* *
0.003"
0.002"
*
(b) After 10,000 Cycles
0.003"
0.003"
0.005"
0.009"
0.002"
0.007"
0.009"
0.002"
0.002"
0.002"
* *
0.003"
0.002"
*
0.003"
0.002"
(b) After 10,000 Cycles
0.003"
0.003"
0.005"
0.009"
0.002"
0.007"
0.009"
0.002"
0.002"
0.002"
* *
0.003"
0.002"
*
0.003"
0.002"
0.003"
0.003"
0.005"
0.009"
0.002"
0.007"
0.009"
0.002"
0.002"
0.002"
* *
0.003"
0.002"
*
0.003"
0.002"
(c) After 155,490 Cycles (Failure)
0.003"
0.003"
0.005"
0.125"
0.002"
0.007"
0.009"
0.002"
0.002"
0.002"
* *
0.003"
0.002"
*
0.003"
0.002"
(c) After 155,490 Cycles (Failure)
0.003"
0.003"
0.005"
0.125"
0.002"
0.007"
0.009"
0.002"
0.002"
0.002"
* *
0.003"
0.002"
*
0.003"
0.002"
0.003"
0.003"
0.005"
0.125"
0.002"
0.007"
0.009"
0.002"
0.002"
0.002"
* *
0.003"
0.002"
*
0.003"
0.002"
* Crack width not measured
CFRP Debonding
* Crack width not measured
CFRP DebondingCFRP Debonding
Figure 8.6 Extension of Cracks during Cycling of Specimen A-F4
Local debonding in the vicinity of the crack initiator was observed after 25,000 cycles. Also, secondary
cracks formed adjacent to existing flexural cracks indicating the initiation of local debonding of the CFRP
composites from the surface of the concrete (Figure 8.7). However, these cracks did not propagate
beyond the location of the first transverse strap with subsequent cycling.
Failure of specimen A-F4 was caused by fatigue fracture of the reinforcing bars approximately 2 in. from
the crack initiator after approximately 155,500 cycles. However, no indication of incipient failure of the
beam was observed prior to fracture of the reinforcement. Excessive crack widening or substantial
debonding of the CFRP composite was not observed prior to failure. After fracture of the reinforcement,
the CFRP composite debonded from the surface of the concrete symmetrically about the centerline of the
specimen as indicated in Figure 8.6c. However, debonding did not propagate to the end of the composite
laminate, as was characteristic of debonding failures. Figure 8.8 shows a detail of the reinforcing bar
fracture after removal of the concrete cover in specimen A-F4. The performance of this specimen

116
indicated that the bond between the composite laminate and the surface of the concrete exhibited a better
fatigue performance than the reinforcing bars.
Figure 8.7 Bottom View of Specimen A-F4 Showing the Formation of
Secondary Cracks during Cycling in the Vicinity of the Crack Initiator
Figure 8.8 Detail Showing Fatigue Fracture of Reinforcing Bar in Specimen A-F4
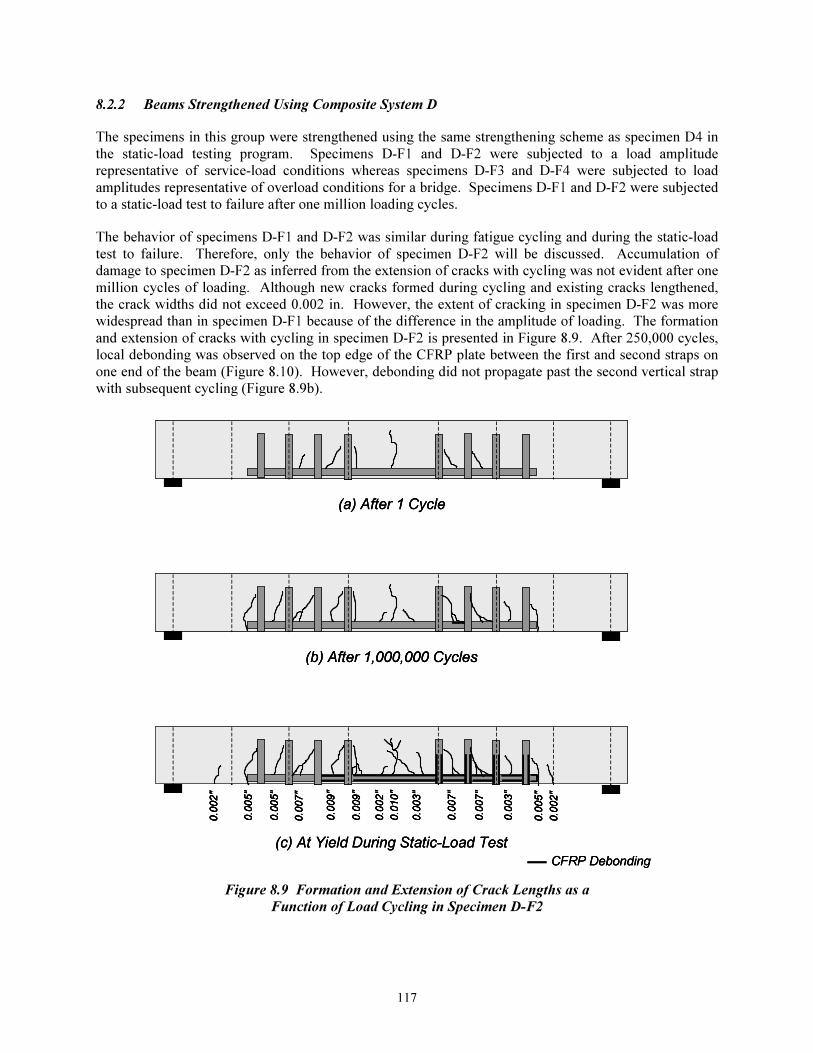
117
8.2.2 Beams Strengthened Using Composite System D
The specimens in this group were strengthened using the same strengthening scheme as specimen D4 in
the static-load testing program. Specimens D-F1 and D-F2 were subjected to a load amplitude
representative of service-load conditions whereas specimens D-F3 and D-F4 were subjected to load
amplitudes representative of overload conditions for a bridge. Specimens D-F1 and D-F2 were subjected
to a static-load test to failure after one million loading cycles.
The behavior of specimens D-F1 and D-F2 was similar during fatigue cycling and during the static-load
test to failure. Therefore, only the behavior of specimen D-F2 will be discussed. Accumulation of
damage to specimen D-F2 as inferred from the extension of cracks with cycling was not evident after one
million cycles of loading. Although new cracks formed during cycling and existing cracks lengthened,
the crack widths did not exceed 0.002 in. However, the extent of cracking in specimen D-F2 was more
widespread than in specimen D-F1 because of the difference in the amplitude of loading. The formation
and extension of cracks with cycling in specimen D-F2 is presented in Figure 8.9. After 250,000 cycles,
local debonding was observed on the top edge of the CFRP plate between the first and second straps on
one end of the beam (Figure 8.10). However, debonding did not propagate past the second vertical strap
with subsequent cycling (Figure 8.9b).
(a) After 1 Cycle
CFRP Debonding
(b) After 1,000,000 Cycles
(c) At Yield During Static-Load Test
0.005"
0.005"
0.009"
0.002"
0.010"
0.003"
0.009"
0.007"
0.007"
0.003"
0.005"
0.002"
0.007"
0.002"
(a) After 1 Cycle(a) After 1 Cycle
CFRP DebondingCFRP Debonding
(b) After 1,000,000 Cycles(b) After 1,000,000 Cycles
(c) At Yield During Static-Load Test
0.005"
0.005"
0.009"
0.002"
0.010"
0.003"
0.009"
0.007"
0.007"
0.003"
0.005"
0.002"
0.007"
0.002"
(c) At Yield During Static-Load Test
0.005"
0.005"
0.009"
0.002"
0.010"
0.003"
0.009"
0.007"
0.007"
0.003"
0.005"
0.002"
0.007"
0.002"
0.005"
0.005"
0.009"
0.002"
0.010"
0.003"
0.009"
0.007"
0.007"
0.003"
0.005"
0.002"
0.007"
0.002"
Figure 8.9 Formation and Extension of Crack Lengths as a
Function of Load Cycling in Specimen D-F2
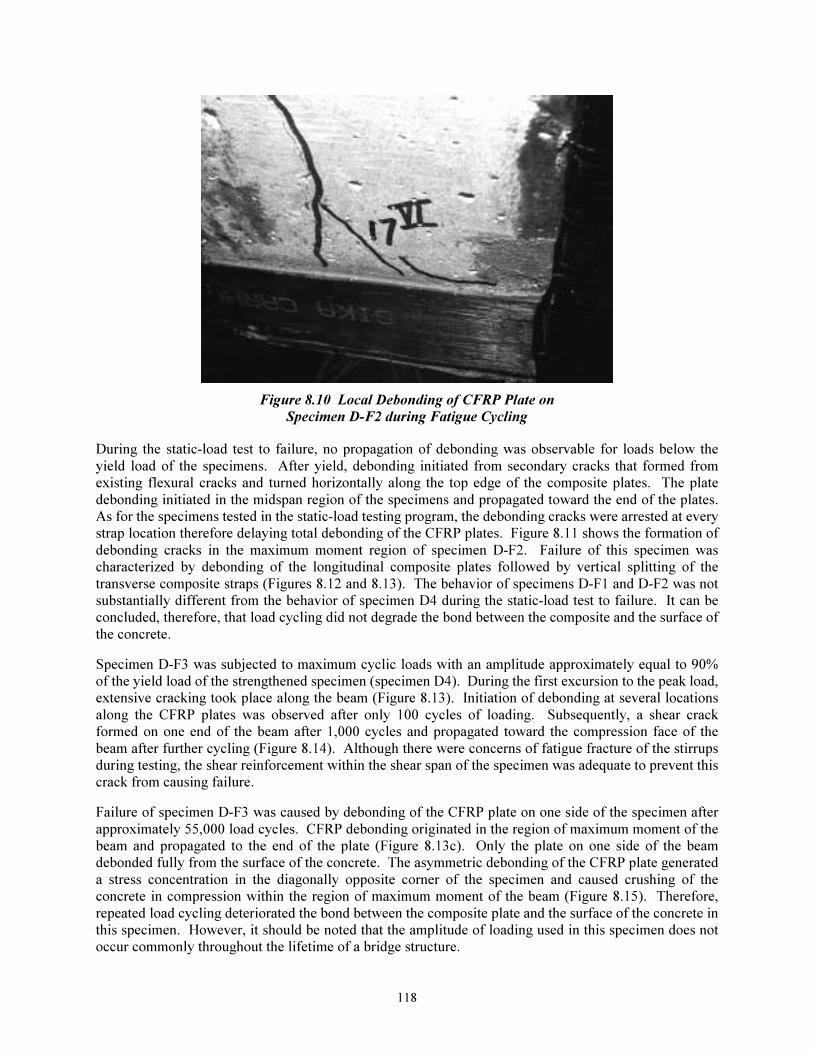
118
Figure 8.10 Local Debonding of CFRP Plate on
Specimen D-F2 during Fatigue Cycling
During the static-load test to failure, no propagation of debonding was observable for loads below the
yield load of the specimens. After yield, debonding initiated from secondary cracks that formed from
existing flexural cracks and turned horizontally along the top edge of the composite plates. The plate
debonding initiated in the midspan region of the specimens and propagated toward the end of the plates.
As for the specimens tested in the static-load testing program, the debonding cracks were arrested at every
strap location therefore delaying total debonding of the CFRP plates. Figure 8.11 shows the formation of
debonding cracks in the maximum moment region of specimen D-F2. Failure of this specimen was
characterized by debonding of the longitudinal composite plates followed by vertical splitting of the
transverse composite straps (Figures 8.12 and 8.13). The behavior of specimens D-F1 and D-F2 was not
substantially different from the behavior of specimen D4 during the static-load test to failure. It can be
concluded, therefore, that load cycling did not degrade the bond between the composite and the surface of
the concrete.
Specimen D-F3 was subjected to maximum cyclic loads with an amplitude approximately equal to 90%
of the yield load of the strengthened specimen (specimen D4). During the first excursion to the peak load,
extensive cracking took place along the beam (Figure 8.13). Initiation of debonding at several locations
along the CFRP plates was observed after only 100 cycles of loading. Subsequently, a shear crack
formed on one end of the beam after 1,000 cycles and propagated toward the compression face of the
beam after further cycling (Figure 8.14). Although there were concerns of fatigue fracture of the stirrups
during testing, the shear reinforcement within the shear span of the specimen was adequate to prevent this
crack from causing failure.
Failure of specimen D-F3 was caused by debonding of the CFRP plate on one side of the specimen after
approximately 55,000 load cycles. CFRP debonding originated in the region of maximum moment of the
beam and propagated to the end of the plate (Figure 8.13c). Only the plate on one side of the beam
debonded fully from the surface of the concrete. The asymmetric debonding of the CFRP plate generated
a stress concentration in the diagonally opposite corner of the specimen and caused crushing of the
concrete in compression within the region of maximum moment of the beam (Figure 8.15). Therefore,
repeated load cycling deteriorated the bond between the composite plate and the surface of the concrete in
this specimen. However, it should be noted that the amplitude of loading used in this specimen does not
occur commonly throughout the lifetime of a bridge structure.
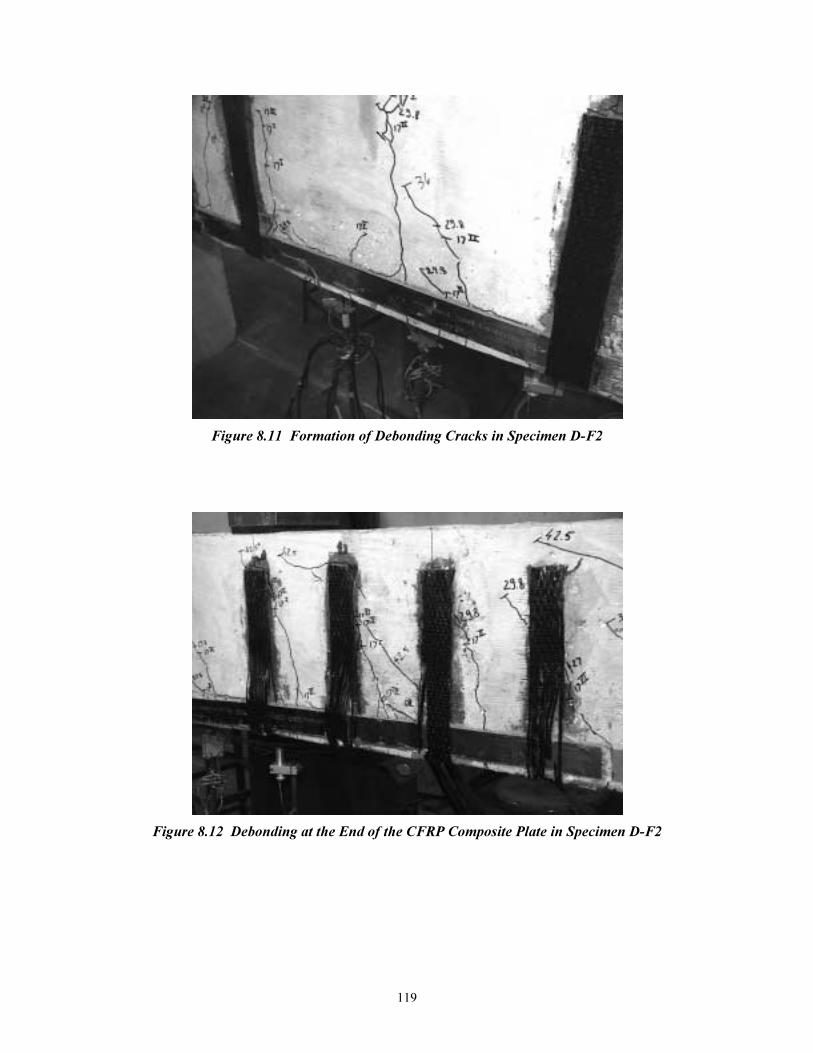
119
Figure 8.11 Formation of Debonding Cracks in Specimen D-F2
Figure 8.12 Debonding at the End of the CFRP Composite Plate in Specimen D-F2
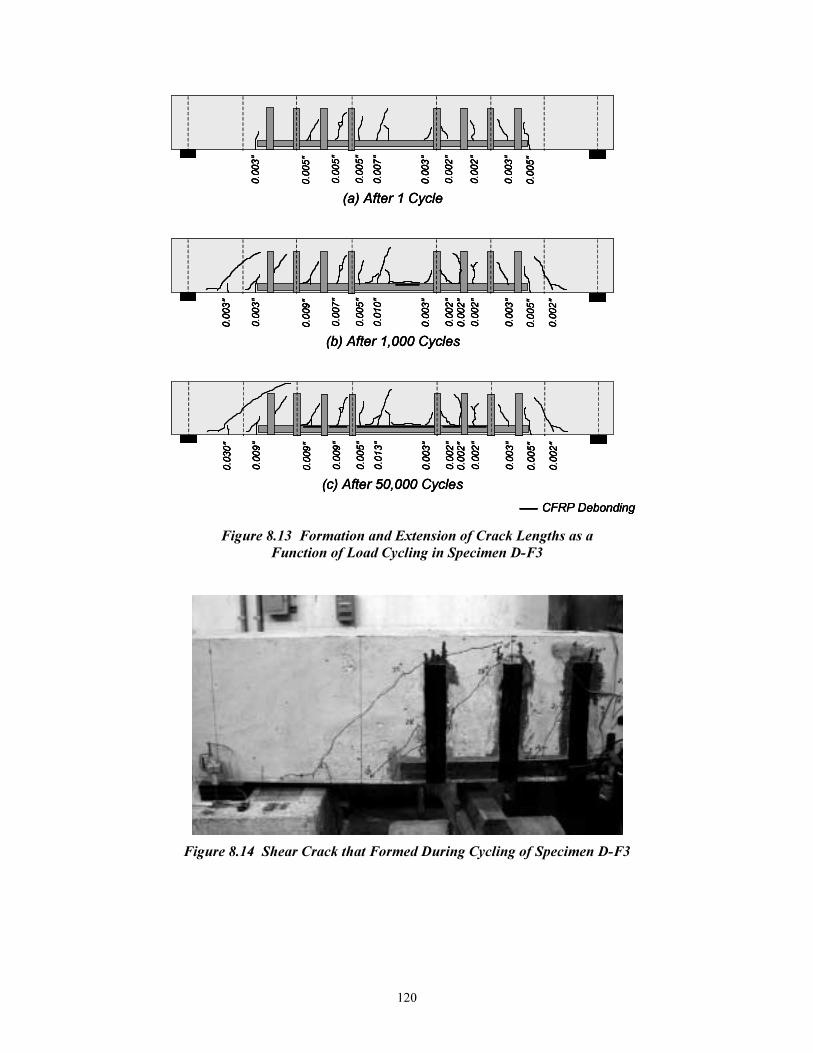
120
(a) After 1 Cycle
0.003"
0.005"
0.003"
0.005"
0.002"
0.002"
0.003"
0.005"
0.005"
0.007"
CFRP Debonding
(c) After 50,000 Cycles
0.009"
0.009"
0.003"
0.005"
0.002"
0.002"
0.003"
0.005"
0.030"
0.009"
0.013"
0.002"
0.002"
(b) After 1,000 Cycles
0.003"
0.007"
0.003"
0.005"
0.002"
0.002"
0.003"
0.005"
0.003"
0.009"
0.010"
0.002"
0.002"
(a) After 1 Cycle
0.003"
0.005"
0.003"
0.005"
0.002"
0.002"
0.003"
0.005"
0.005"
0.007"
(a) After 1 Cycle
0.003"
0.005"
0.003"
0.005"
0.002"
0.002"
0.003"
0.005"
0.005"
0.007"
0.003"
0.005"
0.003"
0.005"
0.002"
0.002"
0.003"
0.005"
0.005"
0.007"
CFRP DebondingCFRP Debonding
(c) After 50,000 Cycles
0.009"
0.009"
0.003"
0.005"
0.002"
0.002"
0.003"
0.005"
0.030"
0.009"
0.013"
0.002"
0.002"
(c) After 50,000 Cycles
0.009"
0.009"
0.003"
0.005"
0.002"
0.002"
0.003"
0.005"
0.030"
0.009"
0.013"
0.002"
0.002"
0.009"
0.009"
0.003"
0.005"
0.002"
0.002"
0.003"
0.005"
0.030"
0.009"
0.013"
0.002"
0.002"
(b) After 1,000 Cycles
0.003"
0.007"
0.003"
0.005"
0.002"
0.002"
0.003"
0.005"
0.003"
0.009"
0.010"
0.002"
0.002"
(b) After 1,000 Cycles
0.003"
0.007"
0.003"
0.005"
0.002"
0.002"
0.003"
0.005"
0.003"
0.009"
0.010"
0.002"
0.002"
0.003"
0.007"
0.003"
0.005"
0.002"
0.002"
0.003"
0.005"
0.003"
0.009"
0.010"
0.002"
0.002"
Figure 8.13 Formation and Extension of Crack Lengths as a
Function of Load Cycling in Specimen D-F3
Figure 8.14 Shear Crack that Formed During Cycling of Specimen D-F3
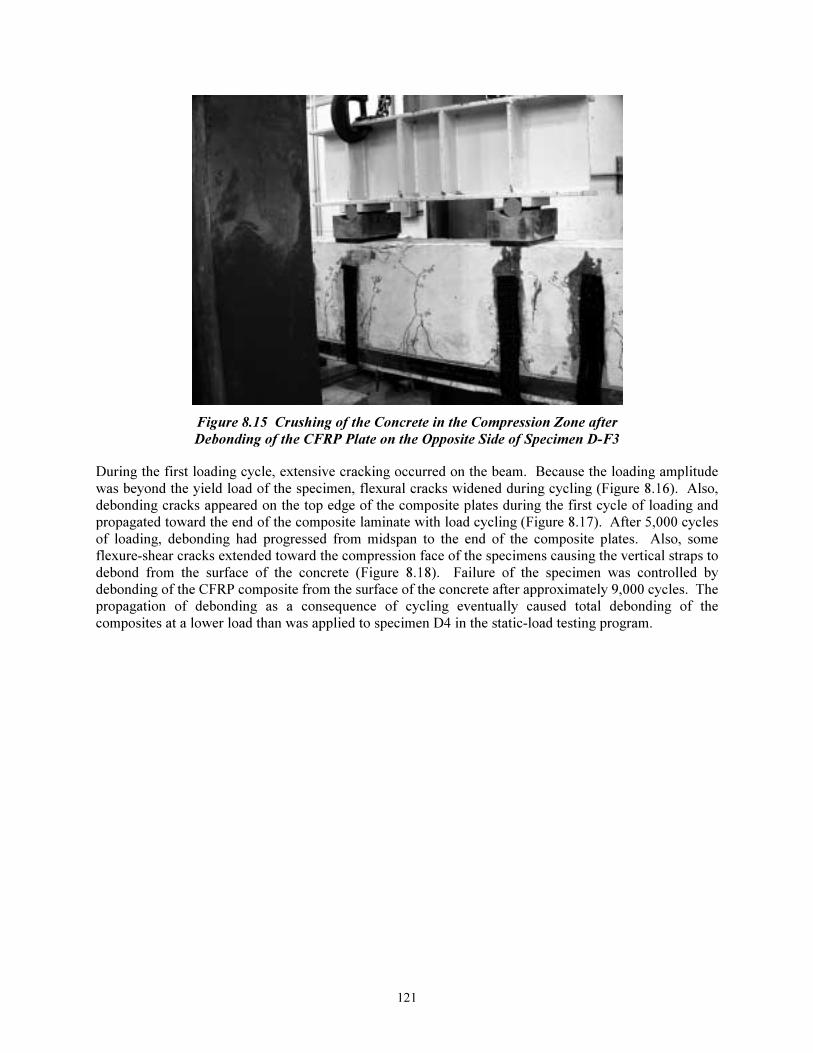
121
Figure 8.15 Crushing of the Concrete in the Compression Zone after
Debonding of the CFRP Plate on the Opposite Side of Specimen D-F3
During the first loading cycle, extensive cracking occurred on the beam. Because the loading amplitude
was beyond the yield load of the specimen, flexural cracks widened during cycling (Figure 8.16). Also,
debonding cracks appeared on the top edge of the composite plates during the first cycle of loading and
propagated toward the end of the composite laminate with load cycling (Figure 8.17). After 5,000 cycles
of loading, debonding had progressed from midspan to the end of the composite plates. Also, some
flexure-shear cracks extended toward the compression face of the specimens causing the vertical straps to
debond from the surface of the concrete (Figure 8.18). Failure of the specimen was controlled by
debonding of the CFRP composite from the surface of the concrete after approximately 9,000 cycles. The
propagation of debonding as a consequence of cycling eventually caused total debonding of the
composites at a lower load than was applied to specimen D4 in the static-load testing program.

122
(a) After 1 Cycle
0.005"
0.025"
0.020"
0.010"
0.005"
0.025"
0.005"
0.005"
0.003"
0.002"
0.002"
0.002"
CFRP Debonding
(b) After 3,000 Cycles
0.005"
0.030"
0.020"
0.025"
0.010"
0.025"
0.005"
0.002"
0.003"
0.009"
0.003"
0.025"
(c) After 8,990 (Failure)
0.005"
0.030"
0.020"
0.025"
0.010"
0.025"
0.005"
0.002"
0.003"
0.009"
0.003"
0.025"
(a) After 1 Cycle
0.005"
0.025"
0.020"
0.010"
0.005"
0.025"
0.005"
0.005"
0.003"
0.002"
0.002"
0.002"
(a) After 1 Cycle
0.005"
0.025"
0.020"
0.010"
0.005"
0.025"
0.005"
0.005"
0.003"
0.002"
0.002"
0.002"
0.005"
0.025"
0.020"
0.010"
0.005"
0.025"
0.005"
0.005"
0.003"
0.002"
0.002"
0.002"
CFRP DebondingCFRP Debonding
(b) After 3,000 Cycles
0.005"
0.030"
0.020"
0.025"
0.010"
0.025"
0.005"
0.002"
0.003"
0.009"
0.003"
0.025"
(b) After 3,000 Cycles
0.005"
0.030"
0.020"
0.025"
0.010"
0.025"
0.005"
0.002"
0.003"
0.009"
0.003"
0.025"
0.005"
0.030"
0.020"
0.025"
0.010"
0.025"
0.005"
0.002"
0.003"
0.009"
0.003"
0.025"
(c) After 8,990 (Failure)
0.005"
0.030"
0.020"
0.025"
0.010"
0.025"
0.005"
0.002"
0.003"
0.009"
0.003"
0.025"
(c) After 8,990 (Failure)
0.005"
0.030"
0.020"
0.025"
0.010"
0.025"
0.005"
0.002"
0.003"
0.009"
0.003"
0.025"
0.005"
0.030"
0.020"
0.025"
0.010"
0.025"
0.005"
0.002"
0.003"
0.009"
0.003"
0.025"
Figure 8.16 Formation and Extension of Crack Lengths as a
Function of Load Cycling in Specimen D-F4
Figure 8.17 Detail Showing Propagation of Debonding Along the Top Edge of the
Composite Laminate in Specimen D-F4 during the First Cycle of Loading
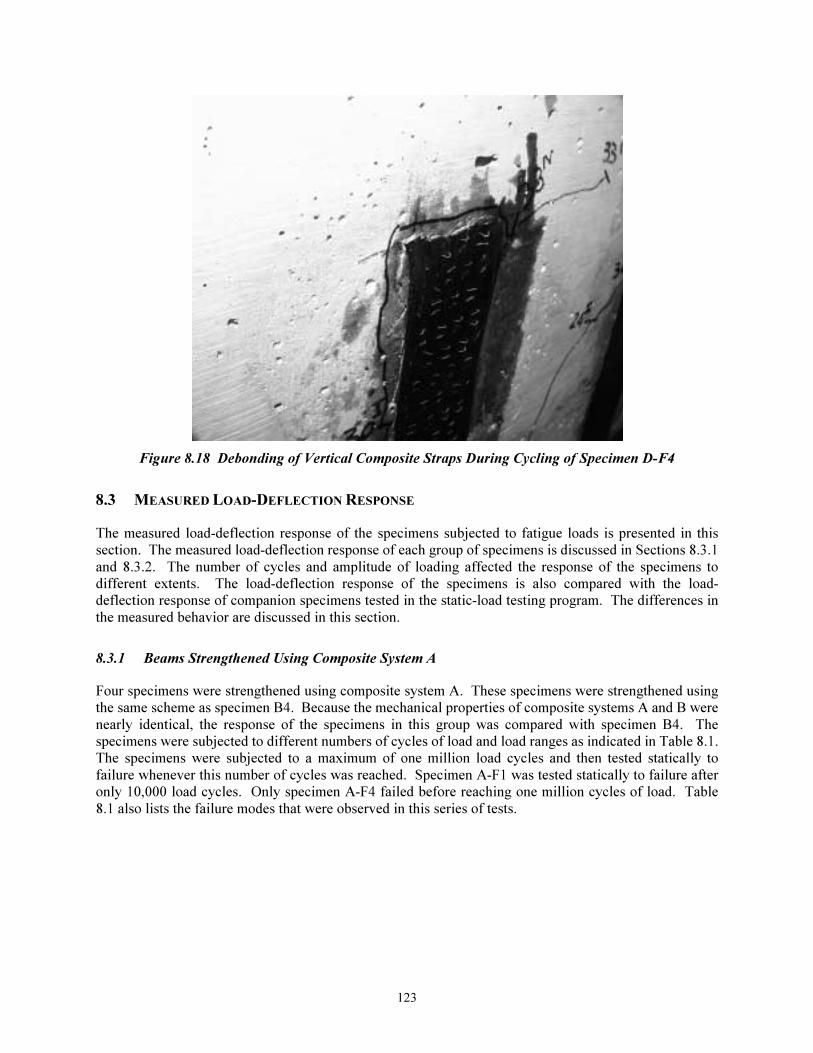
123
Figure 8.18 Debonding of Vertical Composite Straps During Cycling of Specimen D-F4
8.3 MEASURED LOAD-DEFLECTION RESPONSE
The measured load-deflection response of the specimens subjected to fatigue loads is presented in this
section. The measured load-deflection response of each group of specimens is discussed in Sections 8.3.1
and 8.3.2. The number of cycles and amplitude of loading affected the response of the specimens to
different extents. The load-deflection response of the specimens is also compared with the load-
deflection response of companion specimens tested in the static-load testing program. The differences in
the measured behavior are discussed in this section.
8.3.1 Beams Strengthened Using Composite System A
Four specimens were strengthened using composite system A. These specimens were strengthened using
the same scheme as specimen B4. Because the mechanical properties of composite systems A and B were
nearly identical, the response of the specimens in this group was compared with specimen B4. The
specimens were subjected to different numbers of cycles of load and load ranges as indicated in Table 8.1.
The specimens were subjected to a maximum of one million load cycles and then tested statically to
failure whenever this number of cycles was reached. Specimen A-F1 was tested statically to failure after
only 10,000 load cycles. Only specimen A-F4 failed before reaching one million cycles of load. Table
8.1 also lists the failure modes that were observed in this series of tests.
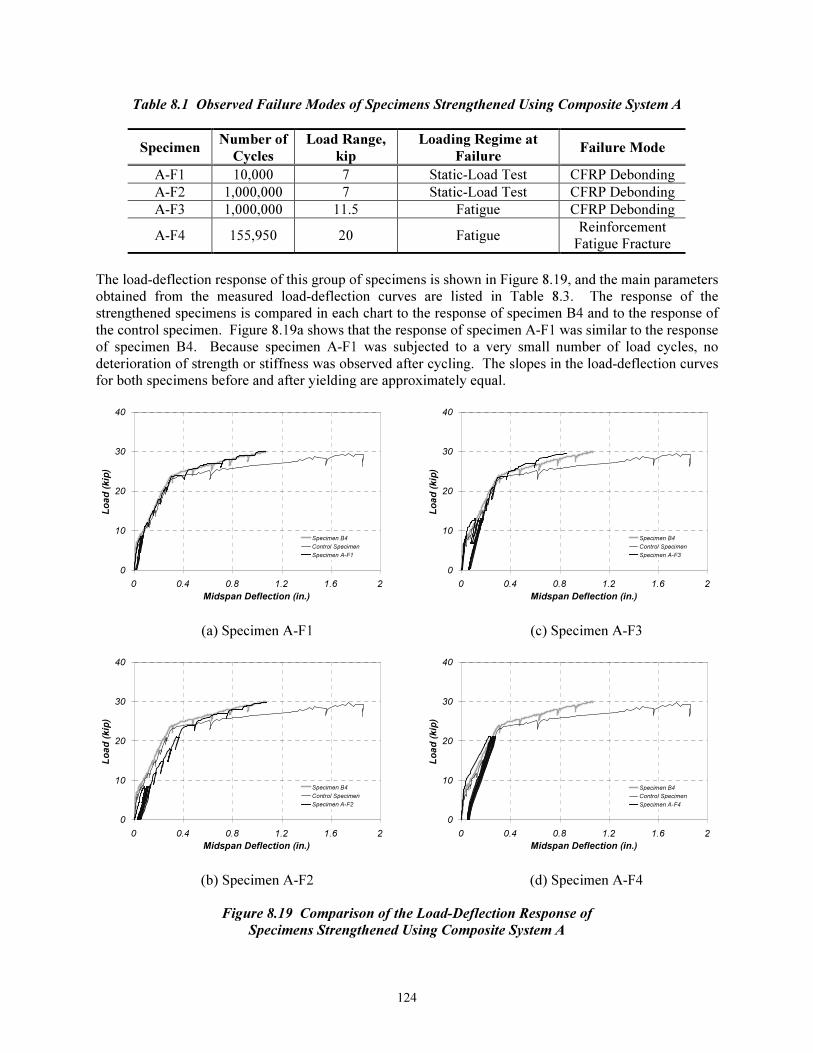
124
Table 8.1 Observed Failure Modes of Specimens Strengthened Using Composite System A
Specimen Number of
Cycles
Load Range,
kip
Loading Regime at
Failure Failure Mode
A-F1 10,000 7 Static-Load Test CFRP Debonding
A-F2 1,000,000 7 Static-Load Test CFRP Debonding
A-F3 1,000,000 11.5 Fatigue CFRP Debonding
A-F4 155,950 20 Fatigue Reinforcement
Fatigue Fracture
The load-deflection response of this group of specimens is shown in Figure 8.19, and the main parameters
obtained from the measured load-deflection curves are listed in Table 8.3. The response of the
strengthened specimens is compared in each chart to the response of specimen B4 and to the response of
the control specimen. Figure 8.19a shows that the response of specimen A-F1 was similar to the response
of specimen B4. Because specimen A-F1 was subjected to a very small number of load cycles, no
deterioration of strength or stiffness was observed after cycling. The slopes in the load-deflection curves
for both specimens before and after yielding are approximately equal.
0
10
20
30
40
0 0.4 0.8 1.2 1.6 2
Midspan Deflection (in.)
Lo
ad
(kip
)
Specimen B4
Control Specimen
Specimen A-F1
0
10
20
30
40
0 0.4 0.8 1.2 1.6 2
Midspan Deflection (in.)
Lo
ad
(kip
)
Specimen B4
Control Specimen
Specimen A-F3
(a) Specimen A-F1 (c) Specimen A-F3
0
10
20
30
40
0 0.4 0.8 1.2 1.6 2
Midspan Deflection (in.)
Lo
ad
(kip
)
Specimen B4
Control Specimen
Specimen A-F2
0
10
20
30
40
0 0.4 0.8 1.2 1.6 2
Midspan Deflection (in.)
Lo
ad
(kip
)
Specimen B4
Control Specimen
Specimen A-F4
(b) Specimen A-F2 (d) Specimen A-F4
Figure 8.19 Comparison of the Load-Deflection Response of
Specimens Strengthened Using Composite System A

125
Specimen A-F2 was subjected to the same load range as specimen A-F1. However, the number of cycles
was increased to one million after observing that specimen A-F1 did not exhibit any apparent degradation
of strength or stiffness. The midspan deflection of specimen A-F2 increased during cycling as can be
observed in Figure 8.19b. During the static test to failure, the specimen did not exhibit a cracking point in
the load-deflection response curve. Therefore, the slope in the initial portion of the load-deflection curve
resembled the slope of a pre-cracked specimen. Although the yield load of specimen A-F2 and specimen
B4 were approximately equal, the yield displacement of specimen A-F2 was higher because of the
accumulation of deflection with cycling. The load-deflection curve for specimen A-F2 joined the curve
for specimen B4 in the post-yield region before failure. The load at failure of specimen A-F2 was
approximately equal to the capacity of specimen B4. This result indicates that cycling at approximately
33% of the yield load did not affect the ultimate behavior of the specimen.
Specimen A-F3 was subjected to one million cycles to a load approximately equal to 50% of the yield
load in the strengthened specimen. The behavior of the specimen during cycling was similar to specimen
A-F2. During the static test to failure, the specimen also behaved similarly to a pre-cracked specimen.
The measured load-deflection curve for this specimen approximated the load-deflection curve for
specimen B4 after yielding. Similarly to other specimens in this group, the behavior beyond the yield
load was similar to the behavior of specimen B4. In this case, the specimen failed at a load slightly lower
than the capacity of specimen B4, but specimen variability rather than fatigue loading probably caused
this slight difference.
Finally, specimen A-F4 was subjected to cyclic loads with amplitudes approximately equal to 90% of the
yield load of the strengthened specimen. The specimen exhibited a slightly higher initial stiffness during
the first loading cycle to the peak load as can be observed in Figure 8.19d. Midspan deflections also
increased with cycling in this case. Failure of this specimen was controlled by fracture of the reinforcing
bars near the critical section although no signs of degradation were apparent from the load-deflection
curve.
8.3.2 Beams Strengthened Using Composite System D
Four specimens were strengthened using composite system D. The beams were strengthened by attaching
the composites to the sides of the beams and placing straps along the shear span. This strengthening
scheme was identical to the one used for specimen D5. The load-deflection response of the specimens in
this series of tests was compared with the response of specimen D5. The beams were subjected to
varying numbers of cycles and load ranges. Table 8.2 summarizes the main parameters that were studied
in this group of specimens and the observed failure modes. A detailed discussion of the loading sequence
was presented in Section 5.3 and summarized in Table 5.3.
Table 8.2 Observed Failure Modes of Specimens Strengthened Using Composite System D
Specimen Number
of Cycles
Load Range,
kip
Load Sequence at
Failure Failure Mode
D-F1 1,000,000 11 Static-Load Test CFRP
Debonding
D-F2 1,000,000 16 Static-Load Test CFRP
Debonding
D-F3 55,490 27 Fatigue CFRP
Debonding
D-F4 8,990 32 Fatigue CFRP
Debonding
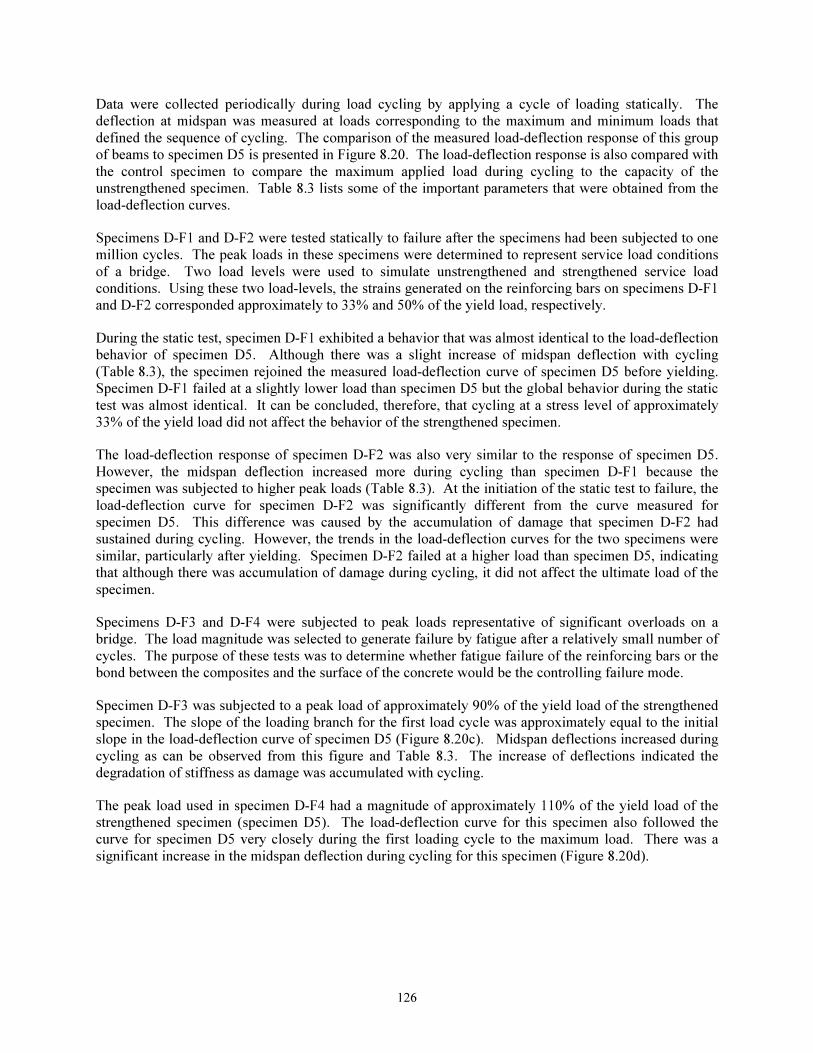
126
Data were collected periodically during load cycling by applying a cycle of loading statically. The
deflection at midspan was measured at loads corresponding to the maximum and minimum loads that
defined the sequence of cycling. The comparison of the measured load-deflection response of this group
of beams to specimen D5 is presented in Figure 8.20. The load-deflection response is also compared with
the control specimen to compare the maximum applied load during cycling to the capacity of the
unstrengthened specimen. Table 8.3 lists some of the important parameters that were obtained from the
load-deflection curves.
Specimens D-F1 and D-F2 were tested statically to failure after the specimens had been subjected to one
million cycles. The peak loads in these specimens were determined to represent service load conditions
of a bridge. Two load levels were used to simulate unstrengthened and strengthened service load
conditions. Using these two load-levels, the strains generated on the reinforcing bars on specimens D-F1
and D-F2 corresponded approximately to 33% and 50% of the yield load, respectively.
During the static test, specimen D-F1 exhibited a behavior that was almost identical to the load-deflection
behavior of specimen D5. Although there was a slight increase of midspan deflection with cycling
(Table 8.3), the specimen rejoined the measured load-deflection curve of specimen D5 before yielding.
Specimen D-F1 failed at a slightly lower load than specimen D5 but the global behavior during the static
test was almost identical. It can be concluded, therefore, that cycling at a stress level of approximately
33% of the yield load did not affect the behavior of the strengthened specimen.
The load-deflection response of specimen D-F2 was also very similar to the response of specimen D5.
However, the midspan deflection increased more during cycling than specimen D-F1 because the
specimen was subjected to higher peak loads (Table 8.3). At the initiation of the static test to failure, the
load-deflection curve for specimen D-F2 was significantly different from the curve measured for
specimen D5. This difference was caused by the accumulation of damage that specimen D-F2 had
sustained during cycling. However, the trends in the load-deflection curves for the two specimens were
similar, particularly after yielding. Specimen D-F2 failed at a higher load than specimen D5, indicating
that although there was accumulation of damage during cycling, it did not affect the ultimate load of the
specimen.
Specimens D-F3 and D-F4 were subjected to peak loads representative of significant overloads on a
bridge. The load magnitude was selected to generate failure by fatigue after a relatively small number of
cycles. The purpose of these tests was to determine whether fatigue failure of the reinforcing bars or the
bond between the composites and the surface of the concrete would be the controlling failure mode.
Specimen D-F3 was subjected to a peak load of approximately 90% of the yield load of the strengthened
specimen. The slope of the loading branch for the first load cycle was approximately equal to the initial
slope in the load-deflection curve of specimen D5 (Figure 8.20c). Midspan deflections increased during
cycling as can be observed from this figure and Table 8.3. The increase of deflections indicated the
degradation of stiffness as damage was accumulated with cycling.
The peak load used in specimen D-F4 had a magnitude of approximately 110% of the yield load of the
strengthened specimen (specimen D5). The load-deflection curve for this specimen also followed the
curve for specimen D5 very closely during the first loading cycle to the maximum load. There was a
significant increase in the midspan deflection during cycling for this specimen (Figure 8.20d).
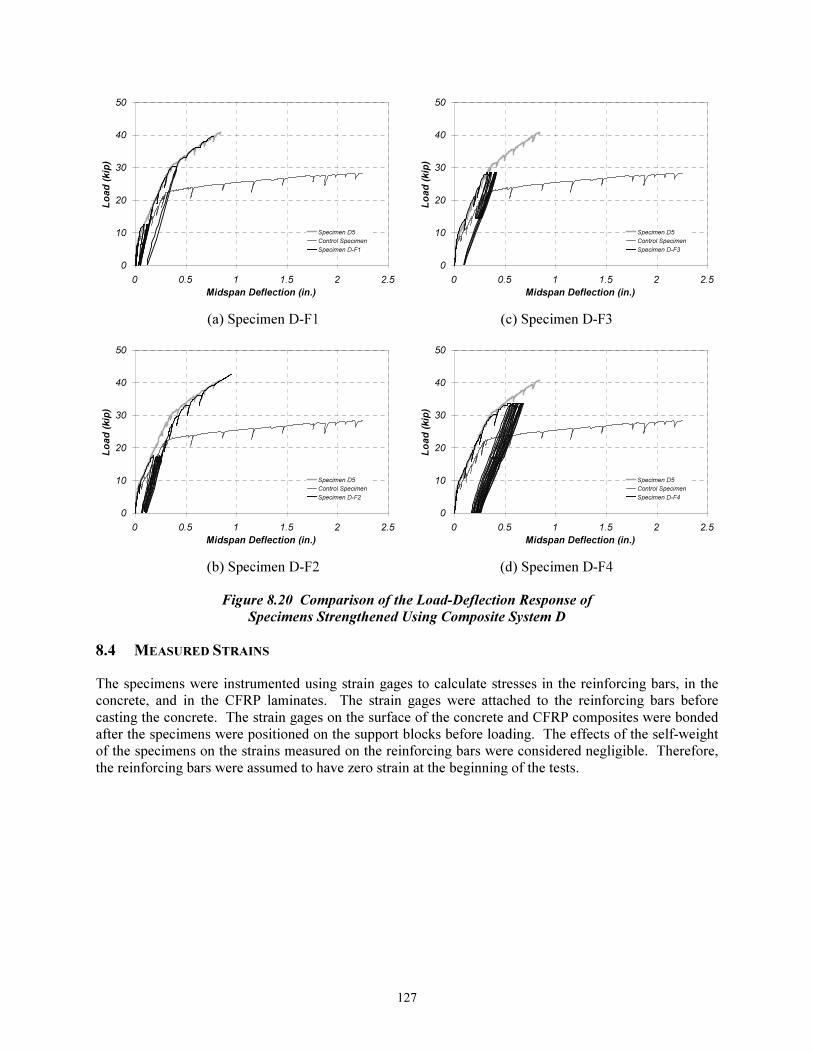
127
0
10
20
30
40
50
0 0.5 1 1.5 2 2.5
Midspan Deflection (in.)
Lo
ad
(k
ip)
Specimen D5
Control Specimen
Specimen D-F1
0
10
20
30
40
50
0 0.5 1 1.5 2 2.5
Midspan Deflection (in.)
Lo
ad
(k
ip)
Specimen D5
Control Specimen
Specimen D-F3
(a) Specimen D-F1 (c) Specimen D-F3
0
10
20
30
40
50
0 0.5 1 1.5 2 2.5
Midspan Deflection (in.)
Lo
ad
(k
ip)
Specimen D5
Control Specimen
Specimen D-F2
0
10
20
30
40
50
0 0.5 1 1.5 2 2.5
Midspan Deflection (in.)
Lo
ad
(k
ip)
Specimen D5
Control Specimen
Specimen D-F4
(b) Specimen D-F2 (d) Specimen D-F4
Figure 8.20 Comparison of the Load-Deflection Response of
Specimens Strengthened Using Composite System D
8.4 MEASURED STRAINS
The specimens were instrumented using strain gages to calculate stresses in the reinforcing bars, in the
concrete, and in the CFRP laminates. The strain gages were attached to the reinforcing bars before
casting the concrete. The strain gages on the surface of the concrete and CFRP composites were bonded
after the specimens were positioned on the support blocks before loading. The effects of the self-weight
of the specimens on the strains measured on the reinforcing bars were considered negligible. Therefore,
the reinforcing bars were assumed to have zero strain at the beginning of the tests.

128
Table 8.3 Summary of Results from Load-Deflection Response of Specimens in the Fatigue-Load Testing Program
Parameters Measured During Fatigue Loads Parameters Measured During First Excursion Beyond Yield Specimen
Ppeak, kip ∆1, in. ∆N, in. Py, kip ∆y, in. Pmax, kip ∆max, in.
A-F1 8 0.057 0.072 23.7 0.309 26.9 0.446
A-F2 8 0.085 0.131 23.5 0.398 28.3 0.595
A-F3 12.5 0.114 0.174 23.7 0.321 31.1 1.062
A-F4 21 0.238 0.276 - - * *
D-F1 12 0.086 0.134 30.3 0.376 28.8 0.431
D-F2 17 0.178 0.264 29.8 0.424 30.1 0.549
D-F3 28 0.326 0.416 - - * *
D-F4 33 0.551 0.673 30.1 0.393 * *
∆1 represents the midspan deflection measured at the peak load on the first cycle of loading.
∆N represents the midspan deflection measured at the peak load after the last cycle of loading.
* Failure occurred during fatigue loads.
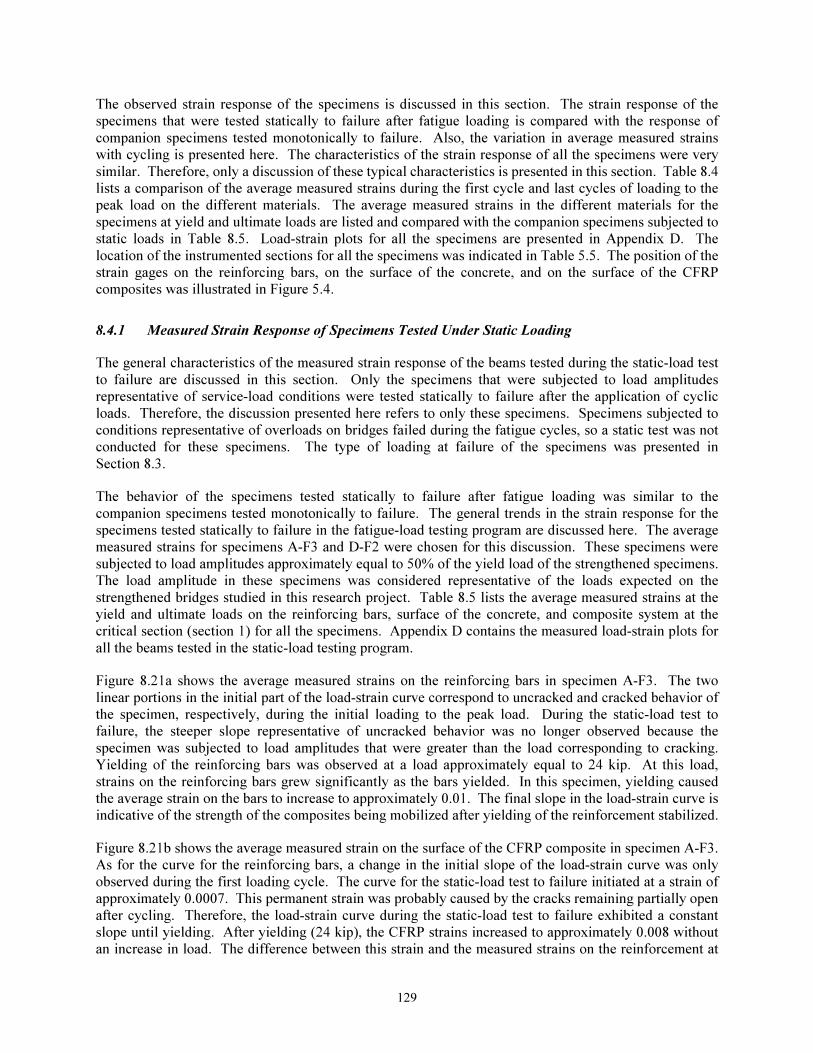
129
The observed strain response of the specimens is discussed in this section. The strain response of the
specimens that were tested statically to failure after fatigue loading is compared with the response of
companion specimens tested monotonically to failure. Also, the variation in average measured strains
with cycling is presented here. The characteristics of the strain response of all the specimens were very
similar. Therefore, only a discussion of these typical characteristics is presented in this section. Table 8.4
lists a comparison of the average measured strains during the first cycle and last cycles of loading to the
peak load on the different materials. The average measured strains in the different materials for the
specimens at yield and ultimate loads are listed and compared with the companion specimens subjected to
static loads in Table 8.5. Load-strain plots for all the specimens are presented in Appendix D. The
location of the instrumented sections for all the specimens was indicated in Table 5.5. The position of the
strain gages on the reinforcing bars, on the surface of the concrete, and on the surface of the CFRP
composites was illustrated in Figure 5.4.
8.4.1 Measured Strain Response of Specimens Tested Under Static Loading
The general characteristics of the measured strain response of the beams tested during the static-load test
to failure are discussed in this section. Only the specimens that were subjected to load amplitudes
representative of service-load conditions were tested statically to failure after the application of cyclic
loads. Therefore, the discussion presented here refers to only these specimens. Specimens subjected to
conditions representative of overloads on bridges failed during the fatigue cycles, so a static test was not
conducted for these specimens. The type of loading at failure of the specimens was presented in
Section 8.3.
The behavior of the specimens tested statically to failure after fatigue loading was similar to the
companion specimens tested monotonically to failure. The general trends in the strain response for the
specimens tested statically to failure in the fatigue-load testing program are discussed here. The average
measured strains for specimens A-F3 and D-F2 were chosen for this discussion. These specimens were
subjected to load amplitudes approximately equal to 50% of the yield load of the strengthened specimens.
The load amplitude in these specimens was considered representative of the loads expected on the
strengthened bridges studied in this research project. Table 8.5 lists the average measured strains at the
yield and ultimate loads on the reinforcing bars, surface of the concrete, and composite system at the
critical section (section 1) for all the specimens. Appendix D contains the measured load-strain plots for
all the beams tested in the static-load testing program.
Figure 8.21a shows the average measured strains on the reinforcing bars in specimen A-F3. The two
linear portions in the initial part of the load-strain curve correspond to uncracked and cracked behavior of
the specimen, respectively, during the initial loading to the peak load. During the static-load test to
failure, the steeper slope representative of uncracked behavior was no longer observed because the
specimen was subjected to load amplitudes that were greater than the load corresponding to cracking.
Yielding of the reinforcing bars was observed at a load approximately equal to 24 kip. At this load,
strains on the reinforcing bars grew significantly as the bars yielded. In this specimen, yielding caused
the average strain on the bars to increase to approximately 0.01. The final slope in the load-strain curve is
indicative of the strength of the composites being mobilized after yielding of the reinforcement stabilized.
Figure 8.21b shows the average measured strain on the surface of the CFRP composite in specimen A-F3.
As for the curve for the reinforcing bars, a change in the initial slope of the load-strain curve was only
observed during the first loading cycle. The curve for the static-load test to failure initiated at a strain of
approximately 0.0007. This permanent strain was probably caused by the cracks remaining partially open
after cycling. Therefore, the load-strain curve during the static-load test to failure exhibited a constant
slope until yielding. After yielding (24 kip), the CFRP strains increased to approximately 0.008 without
an increase in load. The difference between this strain and the measured strains on the reinforcement at

130
the end of the horizontal portion of the curve indicates local debonding of the CFRP composites.
Subsequently, the load-strain curve exhibited a positive slope again as the strains in the CFRP composite
increased with loading. The maximum measured strain in this beam was approximately equal to 0.012 at
30 kip.
The average measured strains on the surface of the concrete of specimen A-F3 are shown in Figure 8.21c.
In this figure, compressive strains are plotted as negative strains. The strains on the concrete decrease
approximately linearly up to the yield load. After yielding, the strains on the concrete increased slightly
as the neutral axis shifted toward the top of the beam after yielding.
Figure 8.22 shows the average measured strains in specimen D-F2. The strain gages on the reinforcing
bars debonded during load cycling and therefore no information was available during the static-load test
to failure. The measured strains on the surface of the composite plates show different characteristics from
the measured response of specimen A-F3. At the load corresponding to yielding of the reinforcement, the
slope on the measured strain curve for the composite plates decreases without becoming horizontal
(Figure 8.22b). Because all the specimens in the fatigue-load testing program were fabricated using the
same heat of steel, it is expected that the load-strain behavior of the reinforcing bars would have been
similar to specimen A-F3. Therefore, the fact that a horizontal slope is not observed on the load-strain
curve for the composite plates indicates that local debonding took place because the composite strains do
not follow the general shape of the load-strain curve for the reinforcement. However, the measured
strains in the composite plates are similar to the measured strains of the companion specimen (specimen
D5) in the static-load testing program (Appendix D). The measured strains on the surface of the concrete
exhibited similar characteristics to the response of specimen A-F3 and are therefore not discussed further.
The measured strains in the different materials varied during load cycling. Figures 8.23 through 8.26
show the variation of strain with number of load cycles for all the specimens tested in the fatigue-load
testing program. Figures 8.23 and 8.25 show the variation of strain with load at the critical section
(section 1). The strains in all the specimens increased at an approximately constant rate with cycling.
However, the rate of increase was a function of the magnitude of the load amplitude. In general, the
strains in specimens subjected to load amplitudes corresponding to service-load conditions (specimens
A-F1 through A-F3, and D-F1 through D-F2) increased at lower rates than the specimens subjected to
higher load amplitudes.
Figures 8.24 and 8.26 show the variation of strain in the different materials for all the specimens at
section 2. In this case, the rate of change of strain with cycling varied for the different specimens and
materials. This effect was probably caused by the redistribution of strains that took place after cracks
formed during cycling of the specimens. Cracks forming in the vicinity of the location of the strain gages
would cause the strains to increase suddenly after a specific number of cycles. On the other hand, a
decrease in the measured strains with increasing number of cycles can be the result of cracks forming far
from the location of the strain gage. This phenomenon was not observed in the plots for section 1 because
in those cases a crack always formed in the vicinity of the strain gages because of the presence of the
crack initiator.
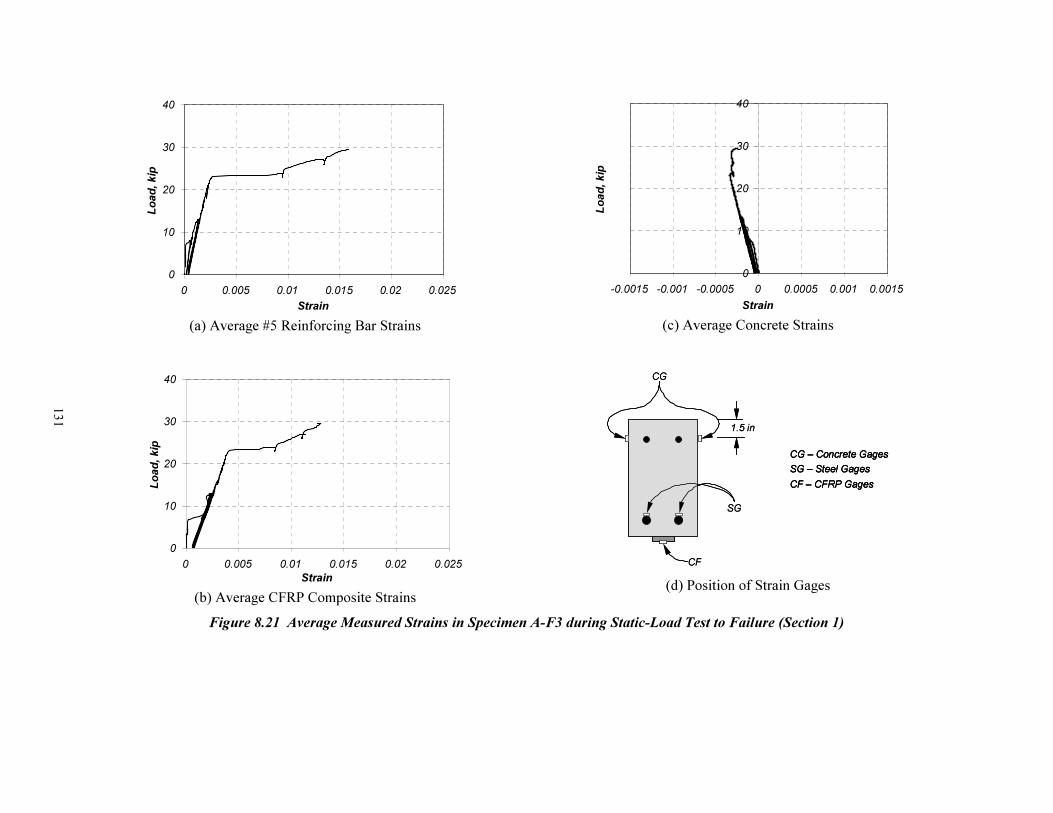
131
0
10
20
30
40
0 0.005 0.01 0.015 0.02 0.025
Strain
Lo
ad
, k
ip
(a) Average #5 Reinforcing Bar Strains
0
10
20
30
40
0 0.005 0.01 0.015 0.02 0.025
Strain
Lo
ad
, k
ip
(b) Average CFRP Composite Strains
0
10
20
30
40
-0.0015 -0.001 -0.0005 0 0.0005 0.001 0.0015
Strain
Lo
ad
, k
ip
(c) Average Concrete Strains
1.5 in
SG
CG
CF
CG – Concrete Gages
SG – Steel Gages
CF – CFRP Gages
1.5 in
SG
CG
CF
CG – Concrete Gages
SG – Steel Gages
CF – CFRP Gages
CG – Concrete Gages
SG – Steel Gages
CF – CFRP Gages
(d) Position of Strain Gages
Figure 8.21 Average Measured Strains in Specimen A-F3 during Static-Load Test to Failure (Section 1)
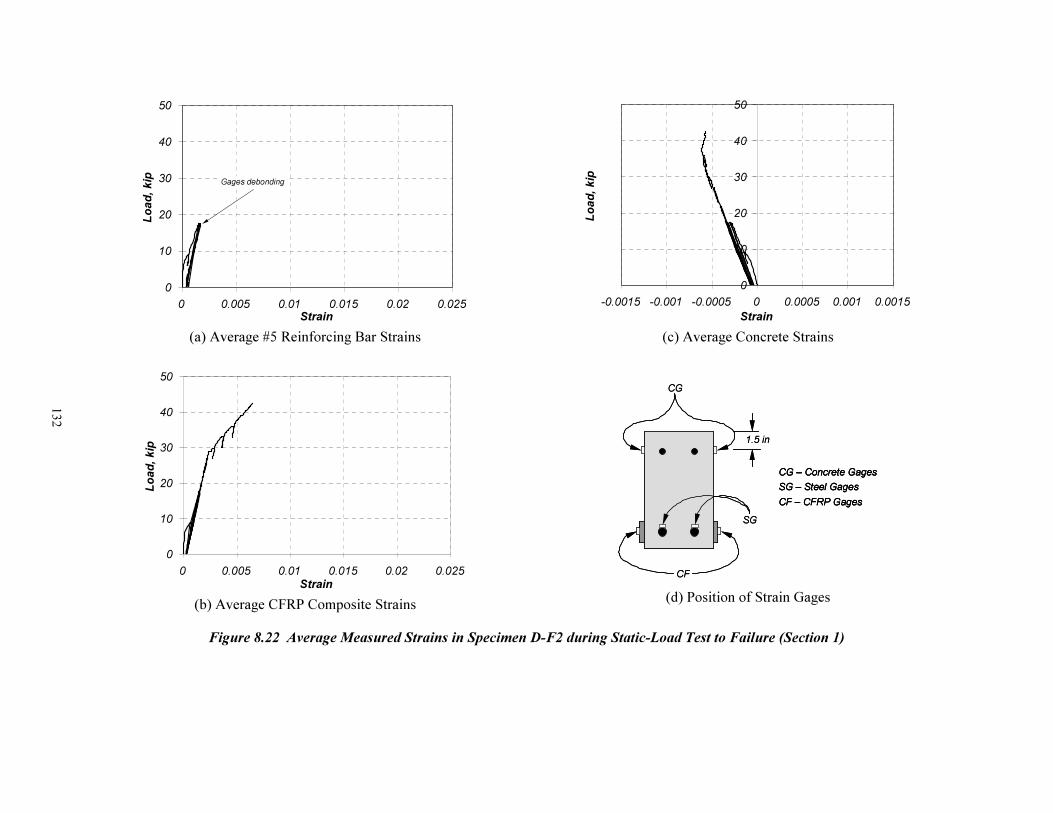
132
0
10
20
30
40
50
0 0.005 0.01 0.015 0.02 0.025
Strain
Lo
ad
, k
ip Gages debonding
(a) Average #5 Reinforcing Bar Strains
0
10
20
30
40
50
0 0.005 0.01 0.015 0.02 0.025
Strain
Lo
ad
, kip
(b) Average CFRP Composite Strains
0
10
20
30
40
50
-0.0015 -0.001 -0.0005 0 0.0005 0.001 0.0015
Strain
Lo
ad
, k
ip
(c) Average Concrete Strains
CG – Concrete Gages
SG – Steel Gages
CF – CFRP Gages
1.5 in
SG
CG
CF
CG – Concrete Gages
SG – Steel Gages
CF – CFRP Gages
CG – Concrete Gages
SG – Steel Gages
CF – CFRP Gages
1.5 in
SG
CG
CF
(d) Position of Strain Gages
Figure 8.22 Average Measured Strains in Specimen D-F2 during Static-Load Test to Failure (Section 1)
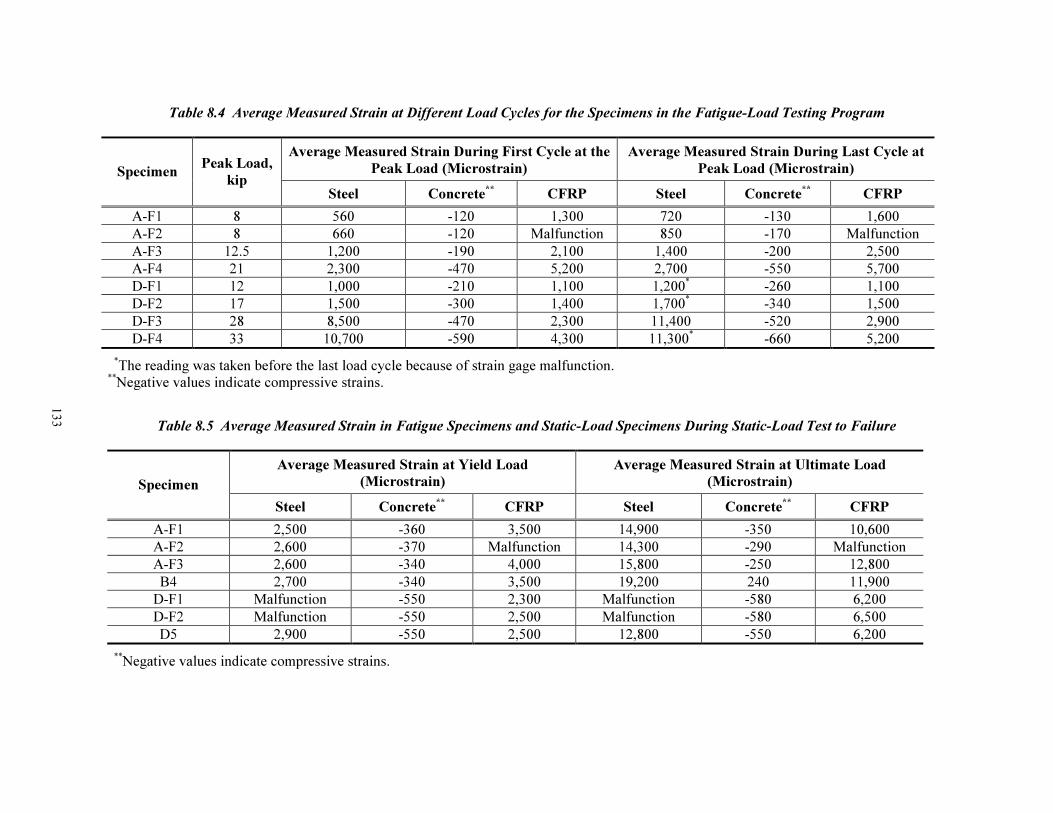
133
Table 8.4 Average Measured Strain at Different Load Cycles for the Specimens in the Fatigue-Load Testing Program
Average Measured Strain During First Cycle at the
Peak Load (Microstrain)
Average Measured Strain During Last Cycle at
Peak Load (Microstrain) Specimen Peak Load,
kip Steel Concrete
** CFRP Steel Concrete
** CFRP
A-F1 8 560 -120 1,300 720 -130 1,600
A-F2 8 660 -120 Malfunction 850 -170 Malfunction
A-F3 12.5 1,200 -190 2,100 1,400 -200 2,500
A-F4 21 2,300 -470 5,200 2,700 -550 5,700
D-F1 12 1,000 -210 1,100 1,200* -260 1,100
D-F2 17 1,500 -300 1,400 1,700* -340 1,500
D-F3 28 8,500 -470 2,300 11,400 -520 2,900
D-F4 33 10,700 -590 4,300 11,300* -660 5,200
*The reading was taken before the last load cycle because of strain gage malfunction.
**Negative values indicate compressive strains.
Table 8.5 Average Measured Strain in Fatigue Specimens and Static-Load Specimens During Static-Load Test to Failure
Average Measured Strain at Yield Load
(Microstrain)
Average Measured Strain at Ultimate Load
(Microstrain) Specimen
Steel Concrete**
CFRP Steel Concrete**
CFRP
A-F1 2,500 -360 3,500 14,900 -350 10,600
A-F2 2,600 -370 Malfunction 14,300 -290 Malfunction
A-F3 2,600 -340 4,000 15,800 -250 12,800
B4 2,700 -340 3,500 19,200 240 11,900
D-F1 Malfunction -550 2,300 Malfunction -580 6,200
D-F2 Malfunction -550 2,500 Malfunction -580 6,500
D5 2,900 -550 2,500 12,800 -550 6,200
**Negative values indicate compressive strains.
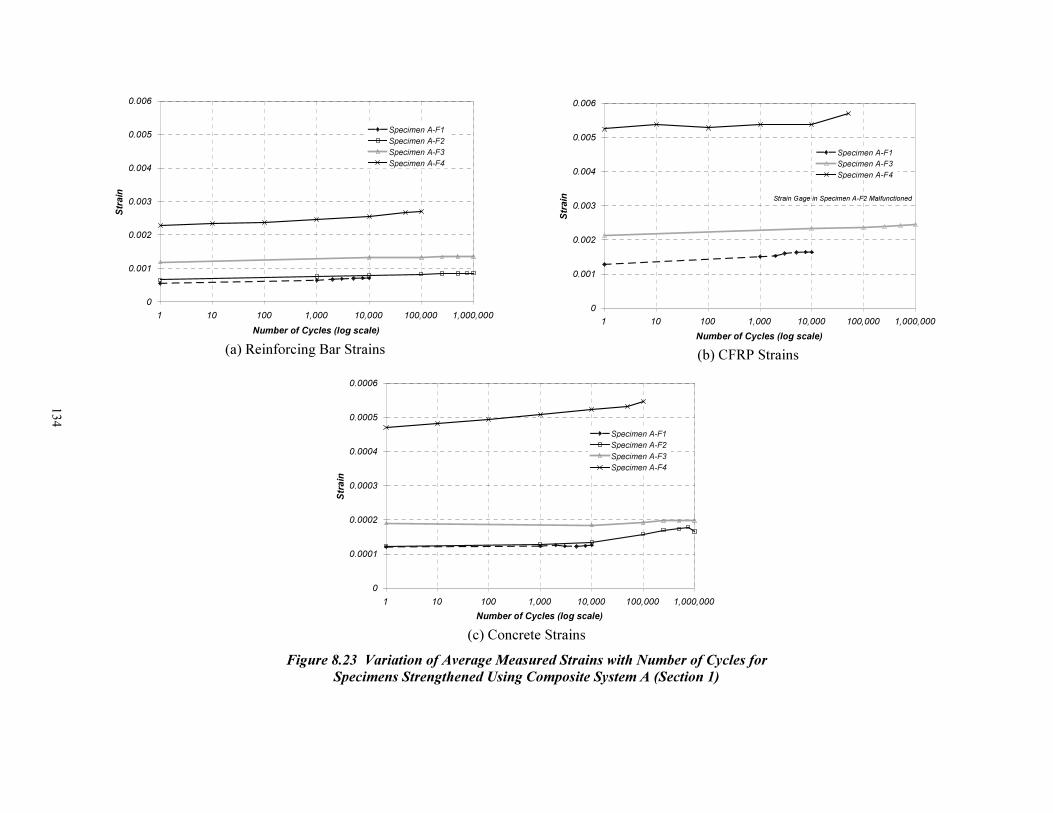
134
0
0.001
0.002
0.003
0.004
0.005
0.006
1 10 100 1,000 10,000 100,000 1,000,000
Number of Cycles (log scale)
Strain
Specimen A-F1
Specimen A-F2
Specimen A-F3
Specimen A-F4
(a) Reinforcing Bar Strains
0
0.001
0.002
0.003
0.004
0.005
0.006
1 10 100 1,000 10,000 100,000 1,000,000
Number of Cycles (log scale)
Strain
Specimen A-F1
Specimen A-F3
Specimen A-F4
Strain Gage in Specimen A-F2 Malfunctioned
(b) CFRP Strains
0
0.0001
0.0002
0.0003
0.0004
0.0005
0.0006
1 10 100 1,000 10,000 100,000 1,000,000
Number of Cycles (log scale)
Strain
Specimen A-F1
Specimen A-F2
Specimen A-F3
Specimen A-F4
(c) Concrete Strains
Figure 8.23 Variation of Average Measured Strains with Number of Cycles for
Specimens Strengthened Using Composite System A (Section 1)
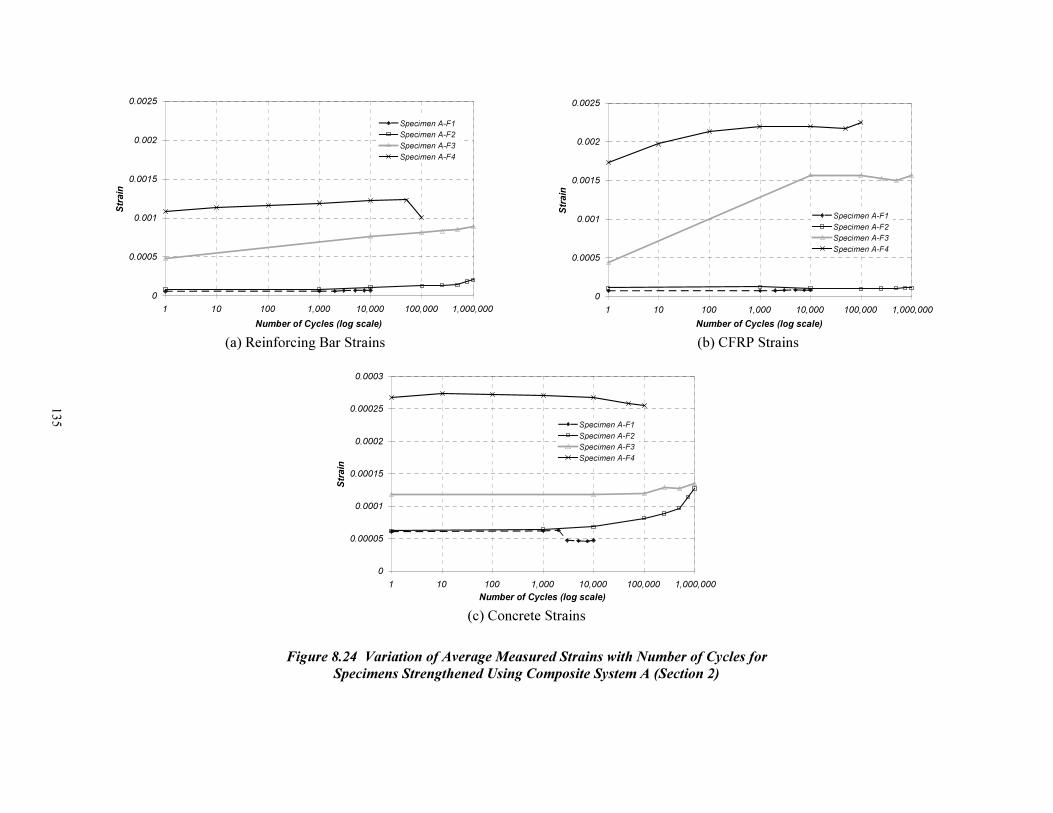
135
0
0.0005
0.001
0.0015
0.002
0.0025
1 10 100 1,000 10,000 100,000 1,000,000
Number of Cycles (log scale)
Strain
Specimen A-F1
Specimen A-F2
Specimen A-F3
Specimen A-F4
(a) Reinforcing Bar Strains
0
0.0005
0.001
0.0015
0.002
0.0025
1 10 100 1,000 10,000 100,000 1,000,000
Number of Cycles (log scale)
Strain
Specimen A-F1
Specimen A-F2
Specimen A-F3
Specimen A-F4
(b) CFRP Strains
0
0.00005
0.0001
0.00015
0.0002
0.00025
0.0003
1 10 100 1,000 10,000 100,000 1,000,000
Number of Cycles (log scale)
Strain
Specimen A-F1
Specimen A-F2
Specimen A-F3
Specimen A-F4
(c) Concrete Strains
Figure 8.24 Variation of Average Measured Strains with Number of Cycles for
Specimens Strengthened Using Composite System A (Section 2)
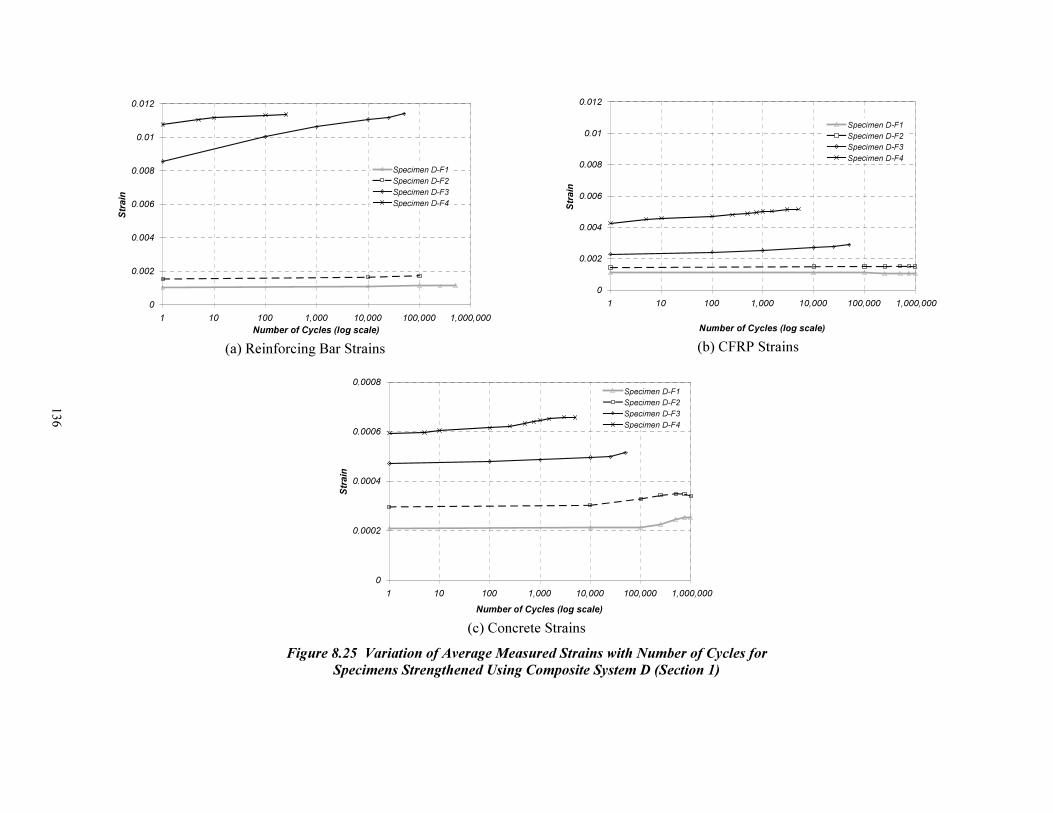
136
0
0.002
0.004
0.006
0.008
0.01
0.012
1 10 100 1,000 10,000 100,000 1,000,000
Number of Cycles (log scale)
Strain
Specimen D-F1
Specimen D-F2
Specimen D-F3
Specimen D-F4
(a) Reinforcing Bar Strains
0
0.002
0.004
0.006
0.008
0.01
0.012
1 10 100 1,000 10,000 100,000 1,000,000
Number of Cycles (log scale)
Strain
Specimen D-F1
Specimen D-F2
Specimen D-F3
Specimen D-F4
(b) CFRP Strains
0
0.0002
0.0004
0.0006
0.0008
1 10 100 1,000 10,000 100,000 1,000,000
Number of Cycles (log scale)
Strain
Specimen D-F1
Specimen D-F2
Specimen D-F3
Specimen D-F4
(c) Concrete Strains
Figure 8.25 Variation of Average Measured Strains with Number of Cycles for
Specimens Strengthened Using Composite System D (Section 1)

137
0
0.001
0.002
0.003
0.004
1 10 100 1,000 10,000 100,000 1,000,000
Number of Cycles (log scale)
Strain
Specimen D-F1
Specimen D-F2
Specimen D-F3
Specimen D-F4
(a) Reinforcing Bar Strains
0
0.001
0.002
0.003
0.004
1 10 100 1,000 10,000 100,000 1,000,000
Number of Cycles (log scale)
Strain
Specimen D-F1
Specimen D-F2
Specimen D-F3
Specimen D-F4
(b) CFRP Strains
0
0.0001
0.0002
0.0003
0.0004
0.0005
1 10 100 1,000 10,000 100,000 1,000,000
Number of Cycles (log scale)
Strain
Specimen D-F1
Specimen D-F2
Specimen D-F3
Specimen D-F4
(c) Concrete Strains
Figure 8.26 Variation of Average Measured Strains with Number of Cycles for
Specimens Strengthened Using Composite System D (Section 2)

138
8.5 SUMMARY
The observed and measured response of the specimens subjected to fatigue loads was presented in this
chapter. The observed response of the specimens during the fatigue tests was presented in Section 8.2
and the accumulation of damage with cycling was described. The measured load-deflection response of
the different groups of specimens was presented in Section 8.3. Finally, the characteristics of the
measured strain response of all the specimens was discussed for the two groups of specimens in
Section 8.4. The average measured strains at yielding and ultimate of all the specimens and the variation
of strains as a function of the number of applied load cycles were summarized in this section.

139
Chapter 9: Summary and Conclusions
9.1 SUMMARY
The objective of the research project was to investigate the effects of strengthening existing reinforced
concrete bridges using composites and to develop reliable design procedures for these systems. Available
fiber types were determined at the onset of the work and carbon fiber composites were selected as a result
of the initial literature review. The research project was divided into three phases to investigate the
behavior of strengthened elements. The first two phases of the research project were discussed in this
report.
The first phase of the research project included testing 22 rectangular beam specimens strengthened using
different types of CFRP composite systems. The main goal of this part of the research project was to
identify strengthening schemes to develop the rupture strength of the composite systems. The beams
were tested monotonically to failure. Twenty specimens were tested as soon as the composite systems
had cured for a period of seven days. Two specimens were subjected to periodic cycles of moisture for
approximately 8 months before loading the beams to failure.
Four different manufacturers provided the composite systems tested in these specimens. Initially, the
composites were attached to the tension face of the beams using different bonded lengths. Subsequently,
the composites were applied along the entire beam span on the bottom face or sides of the beams.
Additionally, vertical straps along the shear span of the specimens were used to delay the onset of
debonding of the composite systems from the surface of the concrete.
The predominant failure mode in this series of tests was characterized by debonding of the composite
from the surface of the concrete. However, the use of transverse straps along the shear span, and the
application of the composite to the side surface of the beams delayed or precluded debonding in some of
the specimens. The average measured strain in the composite laminates at the critical section at failure
depended on the type of strengthening scheme and composite system. However, the measured values
were generally lower than the values published by the manufacturers of the composite systems even for
specimens that failed by rupture of the composite laminates.
The second phase of the research project consisted of evaluating the fatigue performance of strengthened
specimens using two of the composite strengthening schemes identified from phase 1. Eight specimens
were tested under various stress ranges representative of service-load and overload conditions on a bridge.
Monotonic tests to failure were conducted on five specimens after they had undergone a repeated loading
sequence to a maximum of 1,000,000 cycles. The amplitude of loading during the repeated loading
sequence for these specimens generated stresses representative of service load conditions in the
reinforcing bars. Three specimens were subjected to loading amplitudes that generated stresses in the
reinforcement that were representative of overload conditions.
All the beams that were tested monotonically to failure after the repeated load sequence failed by
debonding of the composites from the surface of the concrete. The observed behavior was not
substantially different from the companion specimens tested in phase 1. The beams subjected to cyclic
overload conditions failed during the fatigue-load cycles. Two of these beams failed by fatigue of the
interface between the composite and the surface of the concrete. One specimen failed by fracture of the
reinforcing bars during the repeated-load sequence.
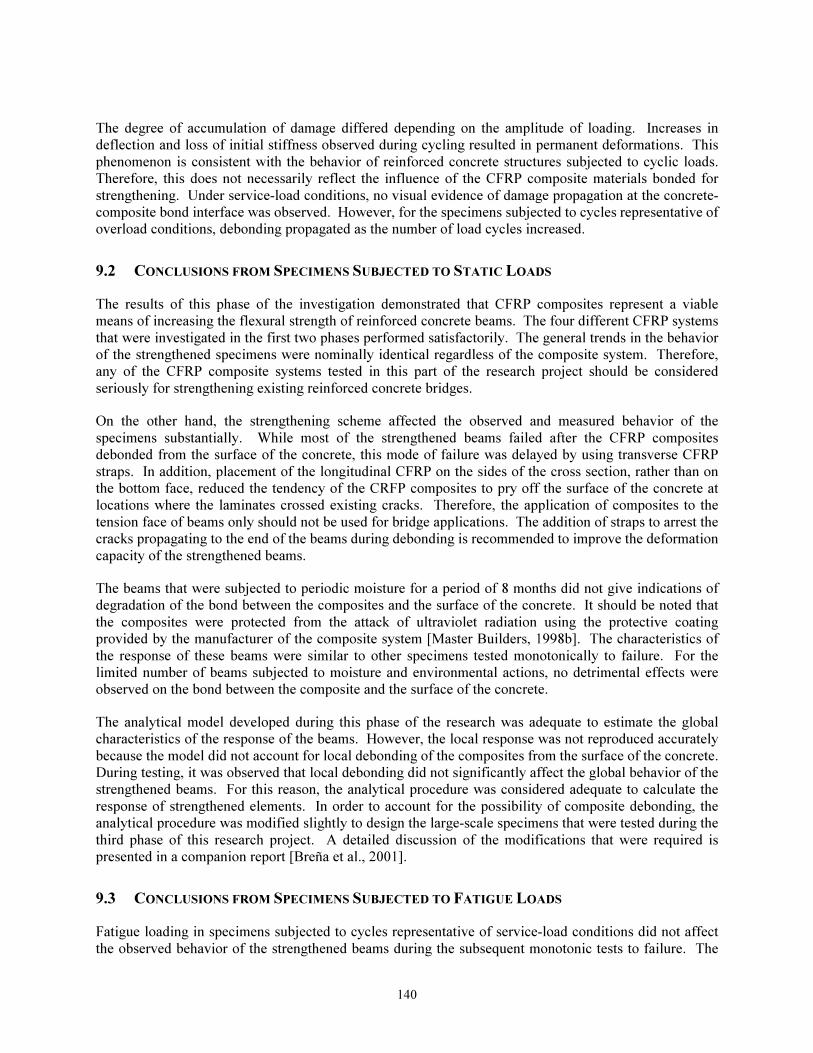
140
The degree of accumulation of damage differed depending on the amplitude of loading. Increases in
deflection and loss of initial stiffness observed during cycling resulted in permanent deformations. This
phenomenon is consistent with the behavior of reinforced concrete structures subjected to cyclic loads.
Therefore, this does not necessarily reflect the influence of the CFRP composite materials bonded for
strengthening. Under service-load conditions, no visual evidence of damage propagation at the concrete-
composite bond interface was observed. However, for the specimens subjected to cycles representative of
overload conditions, debonding propagated as the number of load cycles increased.
9.2 CONCLUSIONS FROM SPECIMENS SUBJECTED TO STATIC LOADS
The results of this phase of the investigation demonstrated that CFRP composites represent a viable
means of increasing the flexural strength of reinforced concrete beams. The four different CFRP systems
that were investigated in the first two phases performed satisfactorily. The general trends in the behavior
of the strengthened specimens were nominally identical regardless of the composite system. Therefore,
any of the CFRP composite systems tested in this part of the research project should be considered
seriously for strengthening existing reinforced concrete bridges.
On the other hand, the strengthening scheme affected the observed and measured behavior of the
specimens substantially. While most of the strengthened beams failed after the CFRP composites
debonded from the surface of the concrete, this mode of failure was delayed by using transverse CFRP
straps. In addition, placement of the longitudinal CFRP on the sides of the cross section, rather than on
the bottom face, reduced the tendency of the CRFP composites to pry off the surface of the concrete at
locations where the laminates crossed existing cracks. Therefore, the application of composites to the
tension face of beams only should not be used for bridge applications. The addition of straps to arrest the
cracks propagating to the end of the beams during debonding is recommended to improve the deformation
capacity of the strengthened beams.
The beams that were subjected to periodic moisture for a period of 8 months did not give indications of
degradation of the bond between the composites and the surface of the concrete. It should be noted that
the composites were protected from the attack of ultraviolet radiation using the protective coating
provided by the manufacturer of the composite system [Master Builders, 1998b]. The characteristics of
the response of these beams were similar to other specimens tested monotonically to failure. For the
limited number of beams subjected to moisture and environmental actions, no detrimental effects were
observed on the bond between the composite and the surface of the concrete.
The analytical model developed during this phase of the research was adequate to estimate the global
characteristics of the response of the beams. However, the local response was not reproduced accurately
because the model did not account for local debonding of the composites from the surface of the concrete.
During testing, it was observed that local debonding did not significantly affect the global behavior of the
strengthened beams. For this reason, the analytical procedure was considered adequate to calculate the
response of strengthened elements. In order to account for the possibility of composite debonding, the
analytical procedure was modified slightly to design the large-scale specimens that were tested during the
third phase of this research project. A detailed discussion of the modifications that were required is
presented in a companion report [Breña et al., 2001].
9.3 CONCLUSIONS FROM SPECIMENS SUBJECTED TO FATIGUE LOADS
Fatigue loading in specimens subjected to cycles representative of service-load conditions did not affect
the observed behavior of the strengthened beams during the subsequent monotonic tests to failure. The
141
capacity of the specimens was apparently not affected by the fatigue loading. However, the deformations
of the strengthened beams increased with cycling.
On the other hand, the behavior of specimens subjected to loads representative of overload conditions was
affected significantly by load cycling. The capacity of the specimens was controlled by the fatigue
performance of the composite-concrete interface or the reinforcing bars. At this load level, damage at the
bond interface propagated toward the end of the composite with increasing number of cycles and fatigue
failure occurred by sudden debonding of the laminate in two of the specimens. One specimen failed by
fracture of the reinforcement indicating that the bond between the surface of the concrete and the
composite exceeded the fatigue life of the reinforcement.
None of the specimens tested under fatigue loading at different stress levels failed by rupture of the fibers
in the composite laminates. Bond fatigue was only observed in two specimens during fatigue cycling at
extremely high stress levels. Therefore, it can be concluded that the fatigue performance of strengthened
specimens will be at least equivalent to that of reinforced concrete elements.
9.4 LARGE-SCALE TESTS OF STRENGTHENED BRIDGE COMPONENTS
The last phase of this research project included laboratory tests of selected strengthening schemes on full-
scale bridge components. The results of the first two phases of the research project, presented in this
research report, were used to design and detail the strengthening schemes for the large-scale tests of
bridge components. Details of phase 3 are discussed in detail in a companion research report [Breña
et al., 2001].

142
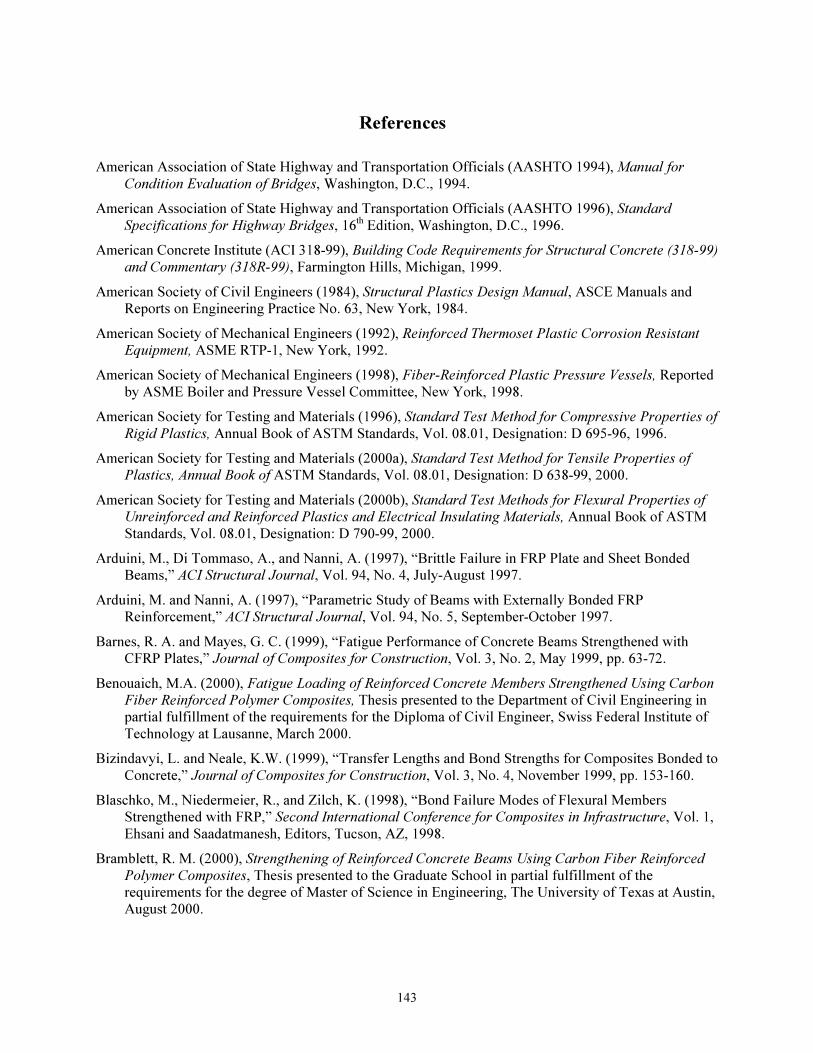
143
References
American Association of State Highway and Transportation Officials (AASHTO 1994), Manual for
Condition Evaluation of Bridges, Washington, D.C., 1994.
American Association of State Highway and Transportation Officials (AASHTO 1996), Standard
Specifications for Highway Bridges, 16th Edition, Washington, D.C., 1996.
American Concrete Institute (ACI 318-99), Building Code Requirements for Structural Concrete (318-99)
and Commentary (318R-99), Farmington Hills, Michigan, 1999.
American Society of Civil Engineers (1984), Structural Plastics Design Manual, ASCE Manuals and
Reports on Engineering Practice No. 63, New York, 1984.
American Society of Mechanical Engineers (1992), Reinforced Thermoset Plastic Corrosion Resistant
Equipment, ASME RTP-1, New York, 1992.
American Society of Mechanical Engineers (1998), Fiber-Reinforced Plastic Pressure Vessels, Reported
by ASME Boiler and Pressure Vessel Committee, New York, 1998.
American Society for Testing and Materials (1996), Standard Test Method for Compressive Properties of
Rigid Plastics, Annual Book of ASTM Standards, Vol. 08.01, Designation: D 695-96, 1996.
American Society for Testing and Materials (2000a), Standard Test Method for Tensile Properties of
Plastics, Annual Book of ASTM Standards, Vol. 08.01, Designation: D 638-99, 2000.
American Society for Testing and Materials (2000b), Standard Test Methods for Flexural Properties of
Unreinforced and Reinforced Plastics and Electrical Insulating Materials, Annual Book of ASTM
Standards, Vol. 08.01, Designation: D 790-99, 2000.
Arduini, M., Di Tommaso, A., and Nanni, A. (1997), “Brittle Failure in FRP Plate and Sheet Bonded
Beams,” ACI Structural Journal, Vol. 94, No. 4, July-August 1997.
Arduini, M. and Nanni, A. (1997), “Parametric Study of Beams with Externally Bonded FRP
Reinforcement,” ACI Structural Journal, Vol. 94, No. 5, September-October 1997.
Barnes, R. A. and Mayes, G. C. (1999), “Fatigue Performance of Concrete Beams Strengthened with
CFRP Plates,” Journal of Composites for Construction, Vol. 3, No. 2, May 1999, pp. 63-72.
Benouaich, M.A. (2000), Fatigue Loading of Reinforced Concrete Members Strengthened Using Carbon
Fiber Reinforced Polymer Composites, Thesis presented to the Department of Civil Engineering in
partial fulfillment of the requirements for the Diploma of Civil Engineer, Swiss Federal Institute of
Technology at Lausanne, March 2000.
Bizindavyi, L. and Neale, K.W. (1999), “Transfer Lengths and Bond Strengths for Composites Bonded to
Concrete,” Journal of Composites for Construction, Vol. 3, No. 4, November 1999, pp. 153-160.
Blaschko, M., Niedermeier, R., and Zilch, K. (1998), “Bond Failure Modes of Flexural Members
Strengthened with FRP,” Second International Conference for Composites in Infrastructure, Vol. 1,
Ehsani and Saadatmanesh, Editors, Tucson, AZ, 1998.
Bramblett, R. M. (2000), Strengthening of Reinforced Concrete Beams Using Carbon Fiber Reinforced
Polymer Composites, Thesis presented to the Graduate School in partial fulfillment of the
requirements for the degree of Master of Science in Engineering, The University of Texas at Austin,
August 2000.

144
Breña, S. F., Wood, S. L., and Kreger, M. E., (2001), “Increasing the Flexural Capacity of Typical
Reinforced Concrete Bridges in Texas Using Carbon Fiber Reinforced Polymer Composites.”
Brosens, K. and VanGemert, D. (1997), “Anchoring Stresses between Concrete and Carbon Fibre
Reinforced Laminates,” International Conference: Composite Construction – Conventional and
Innovative, Innsbruck, 1997, pp. 181-186.
Chajes, M.J., Finch, W.W., Januszka, T.F., and Thomson, T.A., “Bond and Force Transfer of Composite
Material Plates Bonded to Concrete,” ACI Structural Journal, Vol. 93, No. 2, March-April 1996, pp.
208-217.
David, E., Djelal, C., and Buyle-Bodin, F. (1997), “Repair and Strengthening of Reinforced Concrete
Beams using Composite Materials,” Proceedings of the Seventh International Conference on
Structural Faults and Repair, Vol. 2, Engineering Technics Press, University of Edinburgh,
Scotland, 1997, pp. 169-173.
Deuring, M. (1993), Post-strengthening of Concrete Structures with Pretensioned Advanced Composites,
Research Report No. 224, EMPA Duebendorf, Duebendorf, Switzerland.
Ferguson, P.M., Reinforced Concrete Fundamentals, 3rd
Ed., John Wiley & Sons, 1958.
Federal Highway Administration (1997), FHWA Study for Advanced Composites in Bridges in Europe
and Japan, United States Department of Transportation, December 1997.
Federal Highway Administration (1999), Strategic Goals for Deficient Bridges, Memorandum
http://www.fhwa.dot.gov/bridge/defbrid.htm, July 1999.
Fyfe, Co. LLC (1997), Comparative Properties of Composite Material Systems, December 1997.
GangaRao, H.V.S. and Vijay, P.V. (1998), “Bending Behavior of Concrete Beams Wrapped with Carbon
Fabric,” Journal of Structural Engineering, Vol. 124, No. 1, January 1998, pp. 3-10.
Garden, H.N. and Hollaway, L.C. (1998), “An Experimental Study on the Influence of Plate End
Anchorage of Carbon Fibre Composite Plates Used to Strengthen Reinforced Concrete Beams,”
Composite Structures, Vol. 42, No. 2, June 1998, pp. 175-188.
Grace, N.F., Sayed, G.A., Soliman, A.K., and Saleh, K.R. (1999), “Strengthening Reinforced Concrete
Beams Using Fiber Reinforced Polymer (FRP) Laminates,” ACI Structural Journal, Vol. 96, No. 5,
September-October 1999, pp. 865-874.
He, J.H., Pilakoutas, K., and Waldron, P. (1997), “CFRP Plate Strengthening of RC Beams,” Proceedings
of the Seventh International Conference on Structural Faults and Repair, Vol. 2, Engineering
Technics Press, University of Edinburgh, Scotland, 1997, pp. 119-127.
Hognestad, E. (1950), An Experimental Study of Combined Bending and Axial Load in Reinforced
Concrete Members, University of Illinois, Engineering Experiment Station, October 1950.
Hognestad, E., Hanson, N.W., and McHenry D. (1955), “Concrete Stress Distribution in Ultimate
Strength Design,” Journal of the American Concrete Institute, Vol. 27, No. 4, December 1955, pp.
455-479.
Hollaway, L.C. and Leeming, M.B., Editors (1999), Strengthening of Reinforced Concrete Structures
Using Externally-Bonded FRP Composites in Structural and Civil Engineering, CRC Press LLC,
1999.
Iketani, J. and Jinno, Y. (1997), “Adhesive Properties of a Carbon Fiber Blanket on to the Concrete
Surfaces,” Proceedings of the 42nd
International SAMPE Symposium, May 1997, pp. 109-116.
Kaiser, H.P. (1989), Strengthening of Reinforced Concrete with Epoxy-Bonded Carbon-Fiber Plastics (In
German), Doctoral Thesis, Diss. ETH No. 8918, ETH Zurich, Switzerland, 1989.
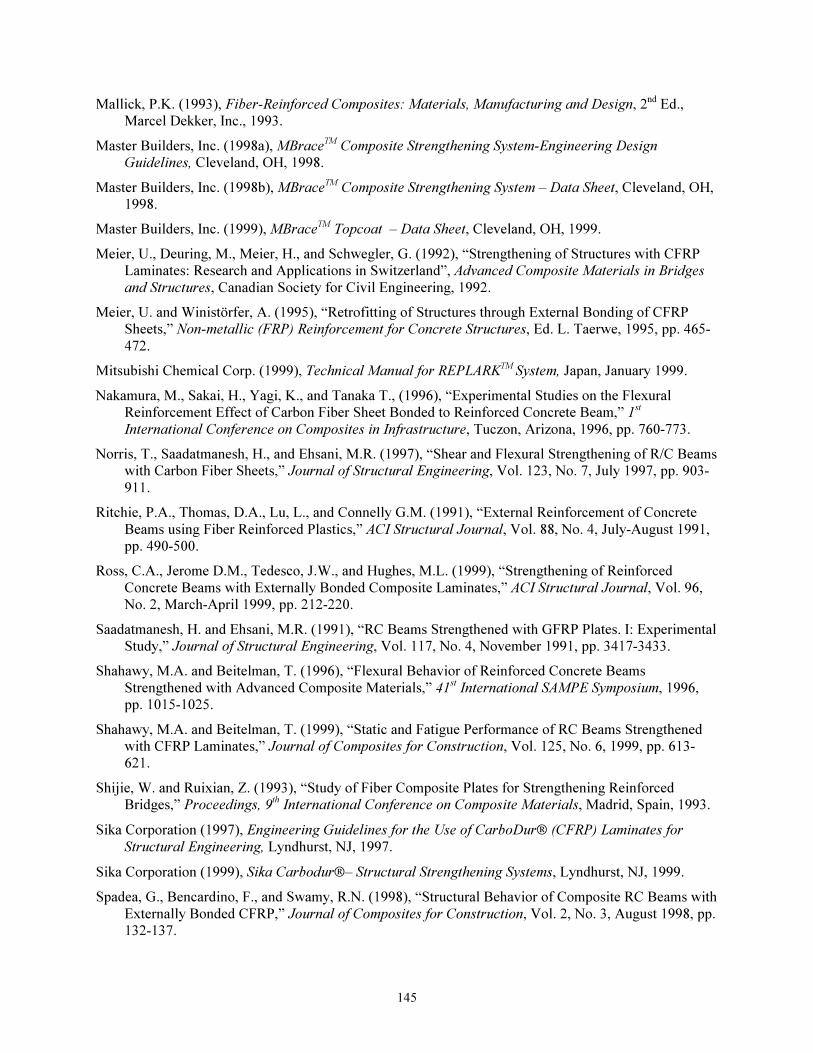
145
Mallick, P.K. (1993), Fiber-Reinforced Composites: Materials, Manufacturing and Design, 2nd
Ed.,
Marcel Dekker, Inc., 1993.
Master Builders, Inc. (1998a), MBraceTM
Composite Strengthening System-Engineering Design
Guidelines, Cleveland, OH, 1998.
Master Builders, Inc. (1998b), MBraceTM Composite Strengthening System – Data Sheet, Cleveland, OH,
1998.
Master Builders, Inc. (1999), MBraceTM
Topcoat – Data Sheet, Cleveland, OH, 1999.
Meier, U., Deuring, M., Meier, H., and Schwegler, G. (1992), “Strengthening of Structures with CFRP
Laminates: Research and Applications in Switzerland”, Advanced Composite Materials in Bridges
and Structures, Canadian Society for Civil Engineering, 1992.
Meier, U. and Winistörfer, A. (1995), “Retrofitting of Structures through External Bonding of CFRP
Sheets,” Non-metallic (FRP) Reinforcement for Concrete Structures, Ed. L. Taerwe, 1995, pp. 465-
472.
Mitsubishi Chemical Corp. (1999), Technical Manual for REPLARKTM
System, Japan, January 1999.
Nakamura, M., Sakai, H., Yagi, K., and Tanaka T., (1996), “Experimental Studies on the Flexural
Reinforcement Effect of Carbon Fiber Sheet Bonded to Reinforced Concrete Beam,” 1st
International Conference on Composites in Infrastructure, Tuczon, Arizona, 1996, pp. 760-773.
Norris, T., Saadatmanesh, H., and Ehsani, M.R. (1997), “Shear and Flexural Strengthening of R/C Beams
with Carbon Fiber Sheets,” Journal of Structural Engineering, Vol. 123, No. 7, July 1997, pp. 903-
911.
Ritchie, P.A., Thomas, D.A., Lu, L., and Connelly G.M. (1991), “External Reinforcement of Concrete
Beams using Fiber Reinforced Plastics,” ACI Structural Journal, Vol. 88, No. 4, July-August 1991,
pp. 490-500.
Ross, C.A., Jerome D.M., Tedesco, J.W., and Hughes, M.L. (1999), “Strengthening of Reinforced
Concrete Beams with Externally Bonded Composite Laminates,” ACI Structural Journal, Vol. 96,
No. 2, March-April 1999, pp. 212-220.
Saadatmanesh, H. and Ehsani, M.R. (1991), “RC Beams Strengthened with GFRP Plates. I: Experimental
Study,” Journal of Structural Engineering, Vol. 117, No. 4, November 1991, pp. 3417-3433.
Shahawy, M.A. and Beitelman, T. (1996), “Flexural Behavior of Reinforced Concrete Beams
Strengthened with Advanced Composite Materials,” 41st International SAMPE Symposium, 1996,
pp. 1015-1025.
Shahawy, M.A. and Beitelman, T. (1999), “Static and Fatigue Performance of RC Beams Strengthened
with CFRP Laminates,” Journal of Composites for Construction, Vol. 125, No. 6, 1999, pp. 613-
621.
Shijie, W. and Ruixian, Z. (1993), “Study of Fiber Composite Plates for Strengthening Reinforced
Bridges,” Proceedings, 9th International Conference on Composite Materials, Madrid, Spain, 1993.
Sika Corporation (1997), Engineering Guidelines for the Use of CarboDur® (CFRP) Laminates for
Structural Engineering, Lyndhurst, NJ, 1997.
Sika Corporation (1999), Sika Carbodur®– Structural Strengthening Systems, Lyndhurst, NJ, 1999.
Spadea, G., Bencardino, F., and Swamy, R.N. (1998), “Structural Behavior of Composite RC Beams with
Externally Bonded CFRP,” Journal of Composites for Construction, Vol. 2, No. 3, August 1998, pp.
132-137.

146
Texas Department of Transportation (TxDOT 1999), Bridge Inventory, Inspection, and Appraisal
Program (BRINSAP) Load Rating Spreadsheet, 1999.

147
Appendix A: Measured Material Properties
This appendix contains information on the material properties for the specimens tested under static and
repeated loading. The appendix is divided into three sections. Concrete material properties are
summarized in Section A.1, reinforcing steel properties are summarized in Section A.2, and CFRP
properties are summarized in Section A.3. Concrete cylinders and steel coupons were tested as part of
this research program to determine the material properties. Material properties reported by the
manufacturers are summarized for the composite material systems.
A.1 CONCRETE
Concrete cylinders (6 in. diameter by 12 in. in height) were fabricated using standard ASTM procedures
as specified in ASTM C-40 [ASTM, 1996]. The concrete cylinders were extracted from their molds at
the time the rectangular beams were removed from the forms to subject the concrete to similar conditions.
The concrete cylinders were cured under ambient conditions in the laboratory next to the beams. Three
concrete batches were required to fabricate all the rectangular beam specimens subjected to static loads,
and one concrete batch was required to fabricate the specimens tested for the repeated-load testing
program. All the concrete batches used the same mix design and were supplied by a local ready-mix
plant. Two or three cylinders were tested in compression 3, 7, 14, and 28 days after casting to evaluate
the change in strength with time for the concrete used in each batch. Due to the limited number of
cylinders for each batch, compression tests were conducted after testing the first and last beams within a
group, while split cylinder tests were conducted after testing the last beam of each group.
A.1.1 Beam Specimens Tested under Static Loading
Twenty rectangular beam specimens were fabricated using three different concrete batches. Batches 1
and 2 were used to fabricate eight, 8-in. by 14-in. and eight, 8-in. by 16-in. beam specimens. Four, 8-in.
by 14-in. specimens and two, 8-in. by 16-in. specimens were fabricated with concrete batch 3. Two of the
8 by 14-in. beams from batch 3 were tested after 8 months of exposure to periods of moist and dry
conditions. The batch number corresponding to each of the beam specimens tested under static loading
was summarized in Table 3.1.
Concrete compressive strength versus time curves for batches 1, 2, and 3 are shown in Figure A.1,
Figure A.2, and Figure A.3, respectively. The figures show the points when the first and last beam
specimens were tested within each group. The concrete age at the time of testing the beam specimens
varied for each of the concrete batches. However, very little variation of concrete strength was
experienced at ages beyond 28 days, so the average compressive strength measured after the last beam
specimen was tested in each group was used in all calculations.
Stress-strain curves for concrete were measured for the concrete from batch 3 (Figure A.4). The curves
were determined at ages of 70 and 306 days. The 70-day test corresponds to the last beam tested in this
beam group, while the 306-day test corresponds to the last beam test conducted after environmental
exposure. Cylinder strains were measured using a compressometer with an 8-in. gage length. The
cylinders were tested under force control using a 600-kip Forney testing machine at an average loading
rate of 800 lb/sec.
148
The concrete model [Hognestad, 1950] used to calculate internal compressive stresses for all specimens is
superimposed to the cylinder test data in Figure A.4. The stress-strain parameters used in the material
model for batch 3 are reported in Table A.1. These values were obtained from the concrete cylinder tests
after testing the last beam in the group.
Split-cylinder tests were also conducted for the concrete from batches 1 and 2. The results are
summarized in Table A.2.
A.1.2 Beam Specimens Tested under Repeated Loading
Eight rectangular beams were fabricated for the repeated-load testing series using concrete from a single
batch. Four, 8-in. by 14-in. beams and four, 8-in. by 16-in. beams were fabricated using batch 4. The
28-day compressive strength of the concrete from batch 4 was significantly higher than the strength
developed by the batches used for the static tests, even though the same concrete mix was used. This can
be attributed to different ambient conditions at the time of casting.
The concrete compressive strength versus time curve for batch 4 is shown in Figure A.5. The age of
testing the first and last specimens in this group is also indicated in the figure. The concrete strength
showed a small variation beyond the 28-day compressive strength, except for the test conducted at
104 days. This variation can be attributed to experimental error rather than increase in concrete strength
due to the limited number of tests conducted at each age. Therefore, the compressive strength of concrete
at 142 days was used in all calculations.
Stress-strain curves for concrete were measured for the concrete from batch 4 (Figure A.6). The curves
were determined at an age of 69 days. The curve corresponding to the material model for this concrete
batch is superimposed on the test data in Figure A.6. The parameters used for the concrete model are
listed in Table A.1.
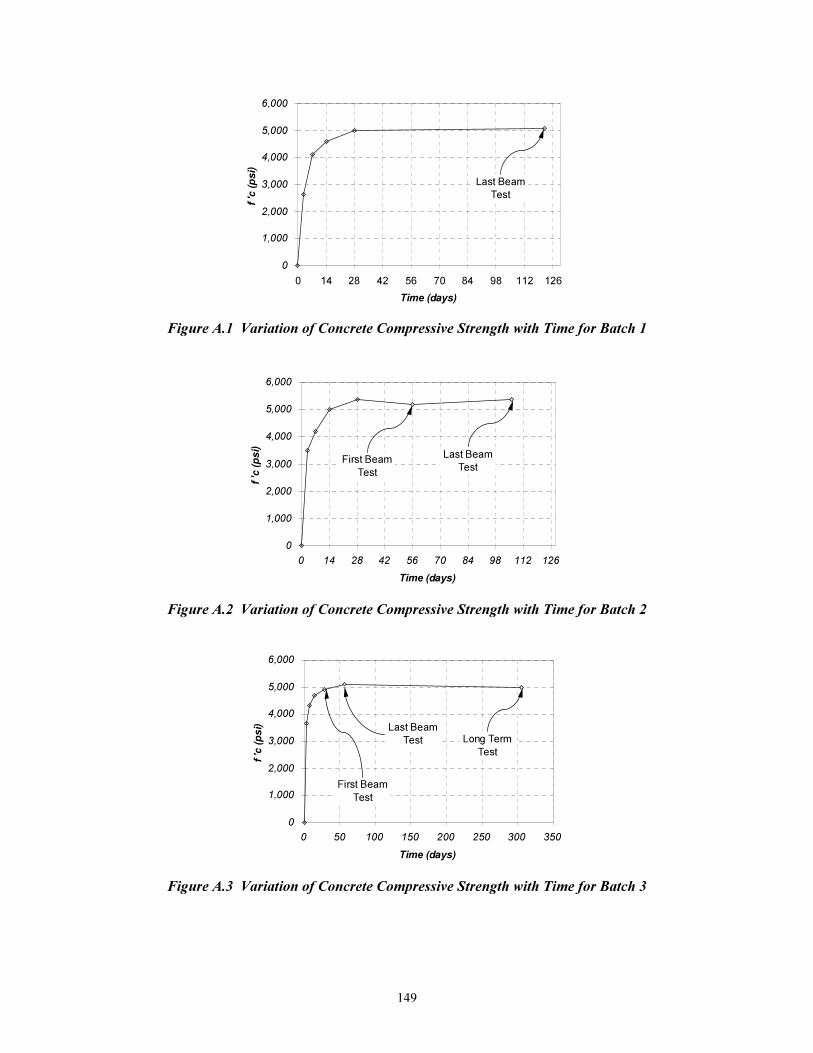
149
0
1,000
2,000
3,000
4,000
5,000
6,000
0 14 28 42 56 70 84 98 112 126
Time (days)
f 'c
(p
si)
Last Beam
Test
Figure A.1 Variation of Concrete Compressive Strength with Time for Batch 1
0
1,000
2,000
3,000
4,000
5,000
6,000
0 14 28 42 56 70 84 98 112 126
Time (days)
f 'c
(p
si)
Last Beam
TestFirst Beam
Test
Figure A.2 Variation of Concrete Compressive Strength with Time for Batch 2
0
1,000
2,000
3,000
4,000
5,000
6,000
0 50 100 150 200 250 300 350
Time (days)
f 'c
(p
si) Last Beam
Test Long Term
Test
First Beam
Test
Figure A.3 Variation of Concrete Compressive Strength with Time for Batch 3
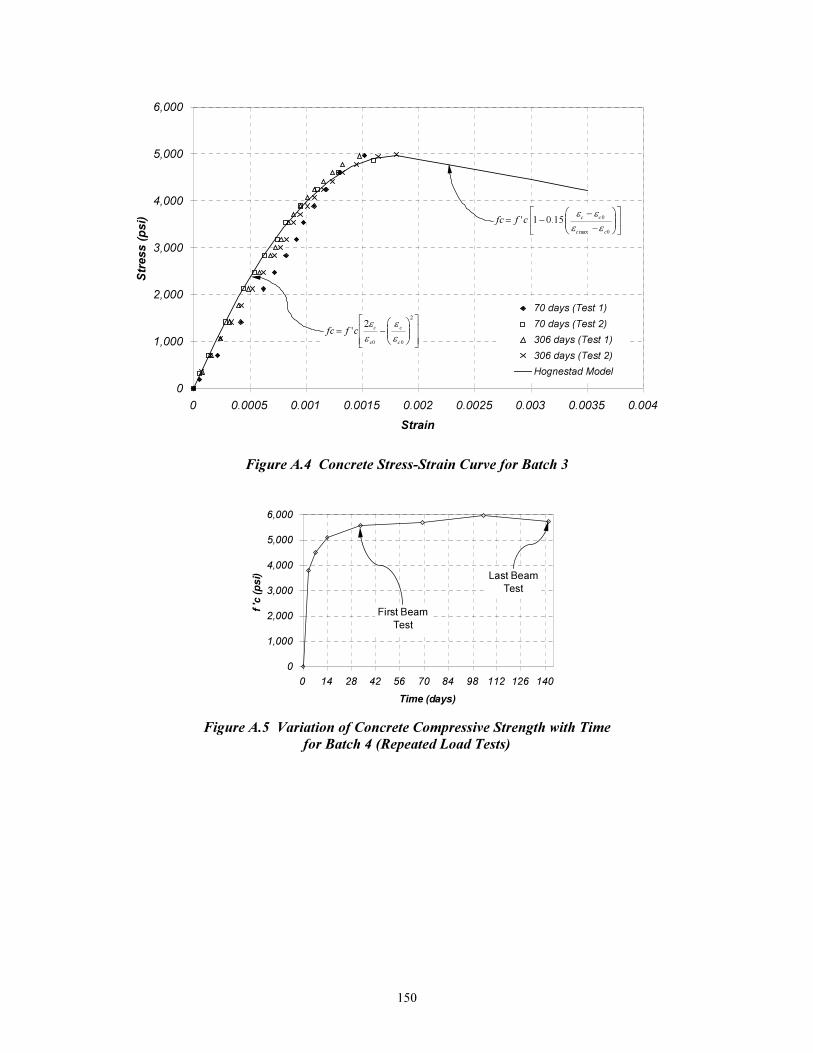
150
0
1,000
2,000
3,000
4,000
5,000
6,000
0 0.0005 0.001 0.0015 0.002 0.0025 0.003 0.0035 0.004
Strain
Str
ess (
psi)
70 days (Test 1)
70 days (Test 2)
306 days (Test 1)
306 days (Test 2)
Hognestad Model
−=
2
00
2'
c
c
c
ccffcε
ε
ε
ε
−
−−=
0max
0 15.01 '
cc
cccffcεε
εε
Figure A.4 Concrete Stress-Strain Curve for Batch 3
0
1,000
2,000
3,000
4,000
5,000
6,000
0 14 28 42 56 70 84 98 112 126 140
Time (days)
f 'c
(p
si)
First Beam
Test
Last Beam
Test
Figure A.5 Variation of Concrete Compressive Strength with Time
for Batch 4 (Repeated Load Tests)
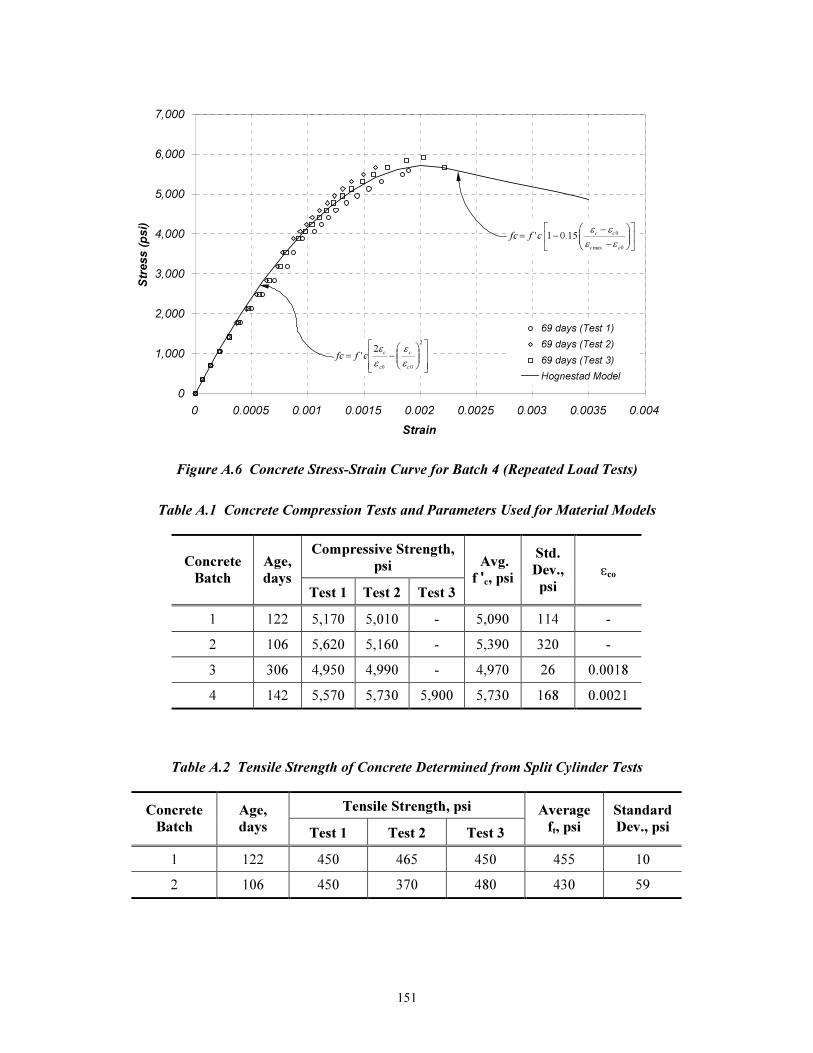
151
0
1,000
2,000
3,000
4,000
5,000
6,000
7,000
0 0.0005 0.001 0.0015 0.002 0.0025 0.003 0.0035 0.004
Strain
Str
ess (
psi)
69 days (Test 1)
69 days (Test 2)
69 days (Test 3)
Hognestad Model
−=
2
00
2'
c
c
c
ccffcε
ε
ε
ε
−
−−=
0max
0 15.01 '
cc
cccffcεε
εε
Figure A.6 Concrete Stress-Strain Curve for Batch 4 (Repeated Load Tests)
Table A.1 Concrete Compression Tests and Parameters Used for Material Models
Compressive Strength,
psi Concrete
Batch
Age,
days Test 1 Test 2 Test 3
Avg.
f 'c, psi
Std.
Dev.,
psi εco
1 122 5,170 5,010 - 5,090 114 -
2 106 5,620 5,160 - 5,390 320 -
3 306 4,950 4,990 - 4,970 26 0.0018
4 142 5,570 5,730 5,900 5,730 168 0.0021
Table A.2 Tensile Strength of Concrete Determined from Split Cylinder Tests
Tensile Strength, psi Concrete
Batch
Age,
days Test 1 Test 2 Test 3
Average
ft, psi
Standard
Dev., psi
1 122 450 465 450 455 10
2 106 450 370 480 430 59
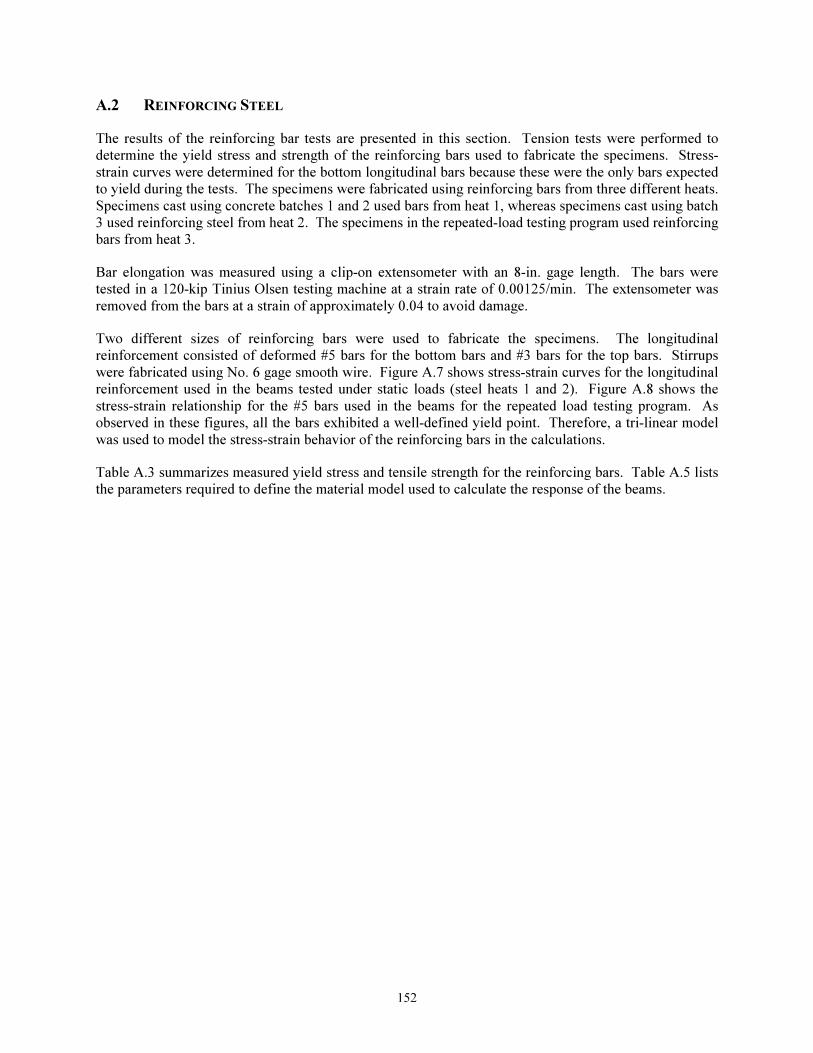
152
A.2 REINFORCING STEEL
The results of the reinforcing bar tests are presented in this section. Tension tests were performed to
determine the yield stress and strength of the reinforcing bars used to fabricate the specimens. Stress-
strain curves were determined for the bottom longitudinal bars because these were the only bars expected
to yield during the tests. The specimens were fabricated using reinforcing bars from three different heats.
Specimens cast using concrete batches 1 and 2 used bars from heat 1, whereas specimens cast using batch
3 used reinforcing steel from heat 2. The specimens in the repeated-load testing program used reinforcing
bars from heat 3.
Bar elongation was measured using a clip-on extensometer with an 8-in. gage length. The bars were
tested in a 120-kip Tinius Olsen testing machine at a strain rate of 0.00125/min. The extensometer was
removed from the bars at a strain of approximately 0.04 to avoid damage.
Two different sizes of reinforcing bars were used to fabricate the specimens. The longitudinal
reinforcement consisted of deformed #5 bars for the bottom bars and #3 bars for the top bars. Stirrups
were fabricated using No. 6 gage smooth wire. Figure A.7 shows stress-strain curves for the longitudinal
reinforcement used in the beams tested under static loads (steel heats 1 and 2). Figure A.8 shows the
stress-strain relationship for the #5 bars used in the beams for the repeated load testing program. As
observed in these figures, all the bars exhibited a well-defined yield point. Therefore, a tri-linear model
was used to model the stress-strain behavior of the reinforcing bars in the calculations.
Table A.3 summarizes measured yield stress and tensile strength for the reinforcing bars. Table A.5 lists
the parameters required to define the material model used to calculate the response of the beams.
153
0
10,000
20,000
30,000
40,000
50,000
60,000
70,000
80,000
90,000
100,000
0 0.004 0.008 0.012 0.016 0.02 0.024 0.028 0.032 0.036 0.04
Strain
Str
ess (
psi)
Test 1
Test 2
Tri-linear Model
a) Heat 1 - #5 Reinforcing Bars
0
10,000
20,000
30,000
40,000
50,000
60,000
70,000
80,000
90,000
100,000
0 0.004 0.008 0.012 0.016 0.02 0.024 0.028 0.032 0.036 0.04
Strain
Str
ess (
psi)
Test 1
Test 2
Test 3
Tri-Linear Model
b) Heat 2 - #5 Reinforcing Bars
Figure A.7 Stress-Strain Curves for #5 Bars in Beams Tested Under Static Load
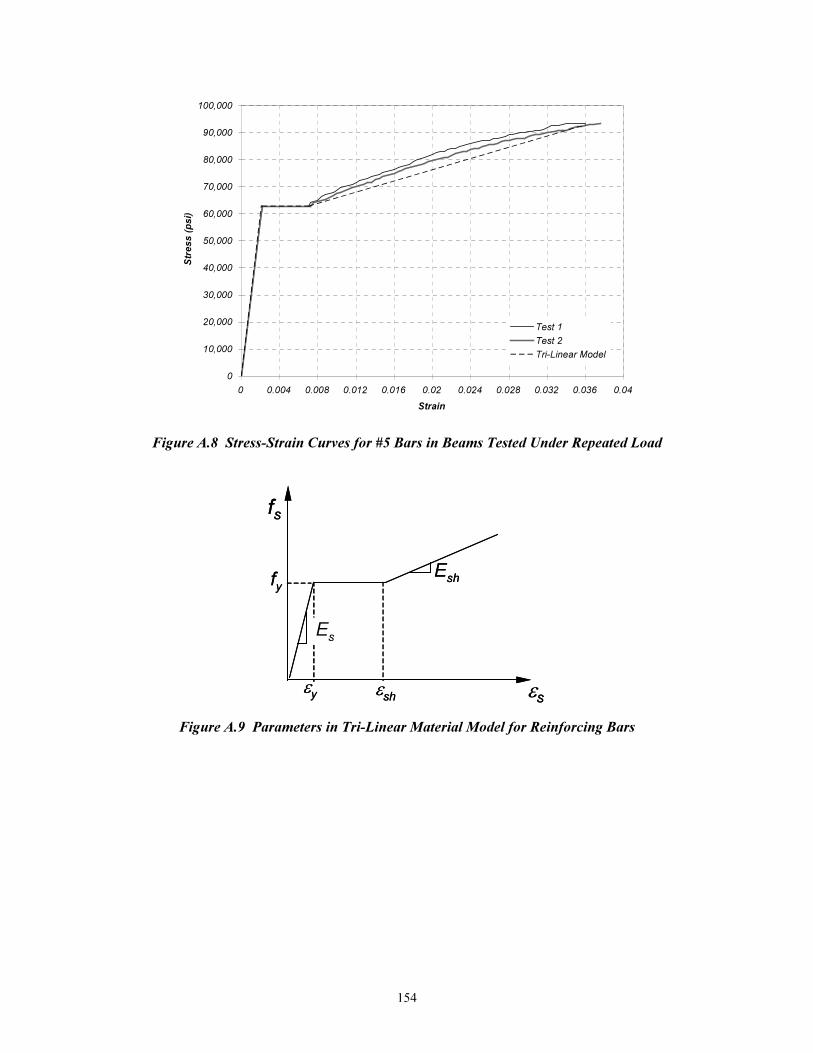
154
0
10,000
20,000
30,000
40,000
50,000
60,000
70,000
80,000
90,000
100,000
0 0.004 0.008 0.012 0.016 0.02 0.024 0.028 0.032 0.036 0.04
Strain
Str
ess (
psi)
Test 1
Test 2
Tri-Linear Model
Figure A.8 Stress-Strain Curves for #5 Bars in Beams Tested Under Repeated Load
fy
εy εsh
Es
Esh
εs
fs
fy
εy εsh
Es
Esh
εs
fs
Figure A.9 Parameters in Tri-Linear Material Model for Reinforcing Bars
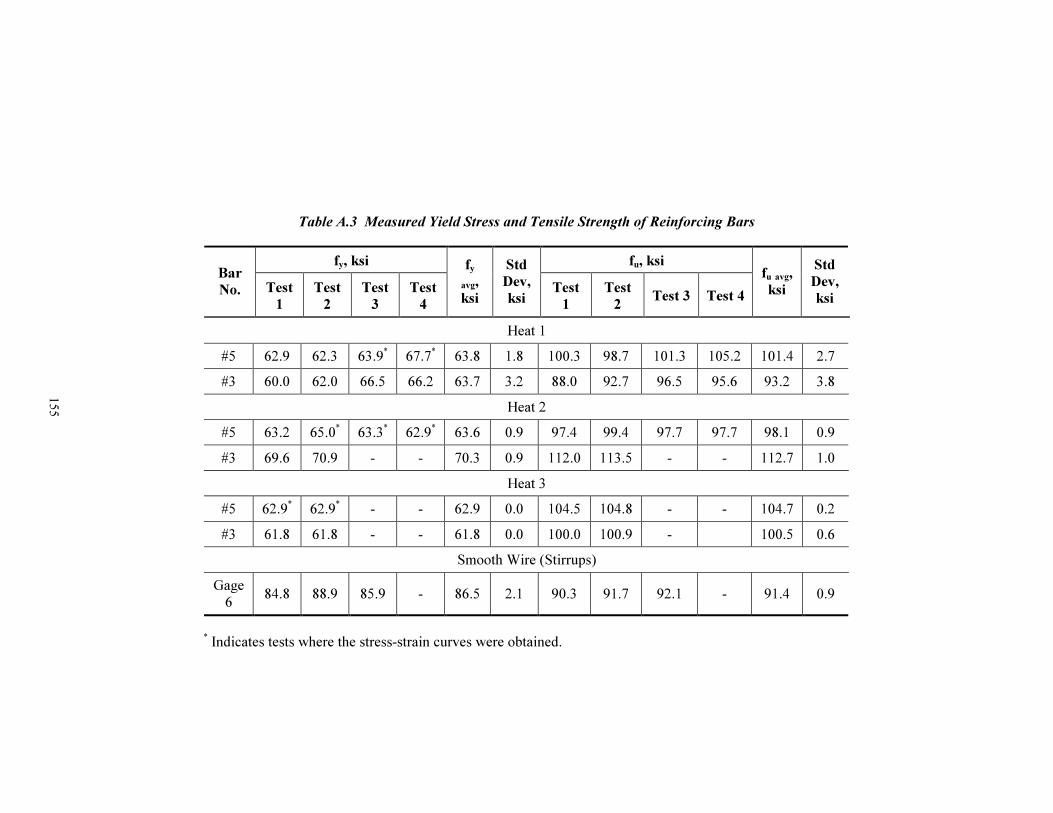
15
5
Table A.3 Measured Yield Stress and Tensile Strength of Reinforcing Bars
fy, ksi fu, ksi Bar
No. Test
1
Test
2
Test
3
Test
4
fy
avg,
ksi
Std
Dev,
ksi Test
1
Test
2 Test 3 Test 4
fu avg,
ksi
Std
Dev,
ksi
Heat 1
#5 62.9 62.3 63.9* 67.7
* 63.8 1.8 100.3 98.7 101.3 105.2 101.4 2.7
#3 60.0 62.0 66.5 66.2 63.7 3.2 88.0 92.7 96.5 95.6 93.2 3.8
Heat 2
#5 63.2 65.0* 63.3
* 62.9
* 63.6 0.9 97.4 99.4 97.7 97.7 98.1 0.9
#3 69.6 70.9 - - 70.3 0.9 112.0 113.5 - - 112.7 1.0
Heat 3
#5 62.9* 62.9
* - - 62.9 0.0 104.5 104.8 - - 104.7 0.2
#3 61.8 61.8 - - 61.8 0.0 100.0 100.9 - 100.5 0.6
Smooth Wire (Stirrups)
Gage
6 84.8 88.9 85.9 - 86.5 2.1 90.3 91.7 92.1 - 91.4 0.9
*
Indicates tests where the stress-strain curves were obtained.
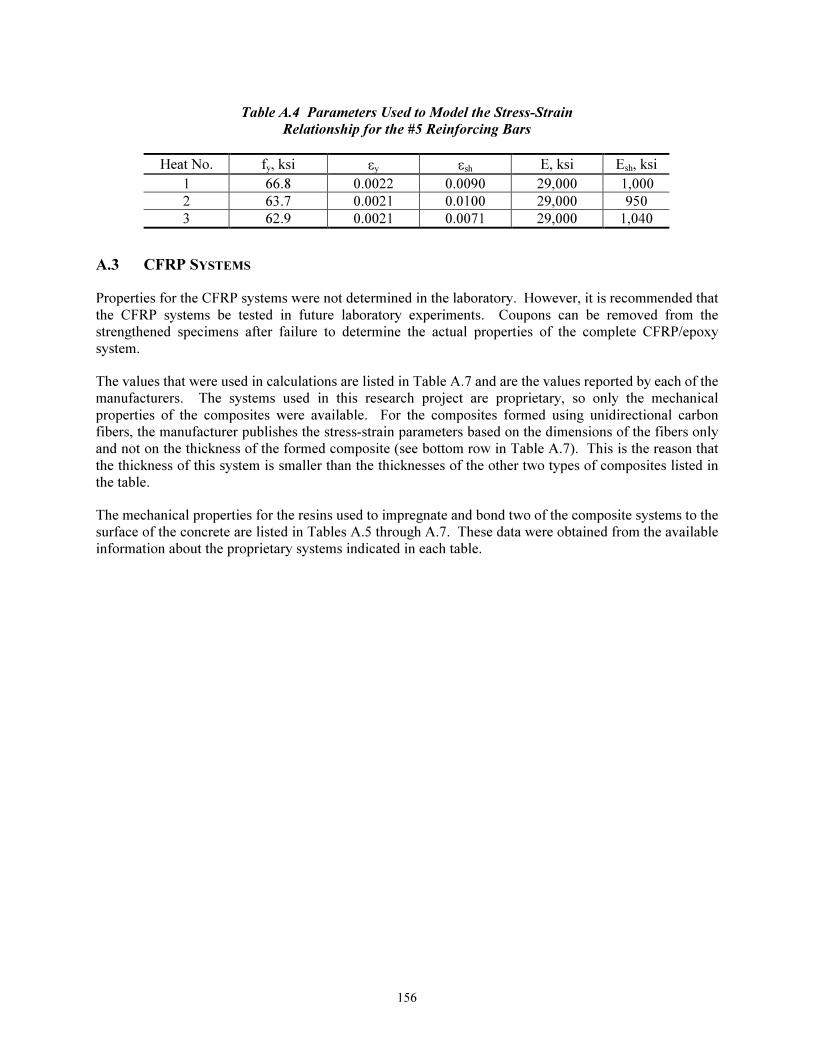
156
Table A.4 Parameters Used to Model the Stress-Strain
Relationship for the #5 Reinforcing Bars
Heat No. fy, ksi εy εsh E, ksi Esh, ksi
1 66.8 0.0022 0.0090 29,000 1,000
2 63.7 0.0021 0.0100 29,000 950
3 62.9 0.0021 0.0071 29,000 1,040
A.3 CFRP SYSTEMS
Properties for the CFRP systems were not determined in the laboratory. However, it is recommended that
the CFRP systems be tested in future laboratory experiments. Coupons can be removed from the
strengthened specimens after failure to determine the actual properties of the complete CFRP/epoxy
system.
The values that were used in calculations are listed in Table A.7 and are the values reported by each of the
manufacturers. The systems used in this research project are proprietary, so only the mechanical
properties of the composites were available. For the composites formed using unidirectional carbon
fibers, the manufacturer publishes the stress-strain parameters based on the dimensions of the fibers only
and not on the thickness of the formed composite (see bottom row in Table A.7). This is the reason that
the thickness of this system is smaller than the thicknesses of the other two types of composites listed in
the table.
The mechanical properties for the resins used to impregnate and bond two of the composite systems to the
surface of the concrete are listed in Tables A.5 through A.7. These data were obtained from the available
information about the proprietary systems indicated in each table.
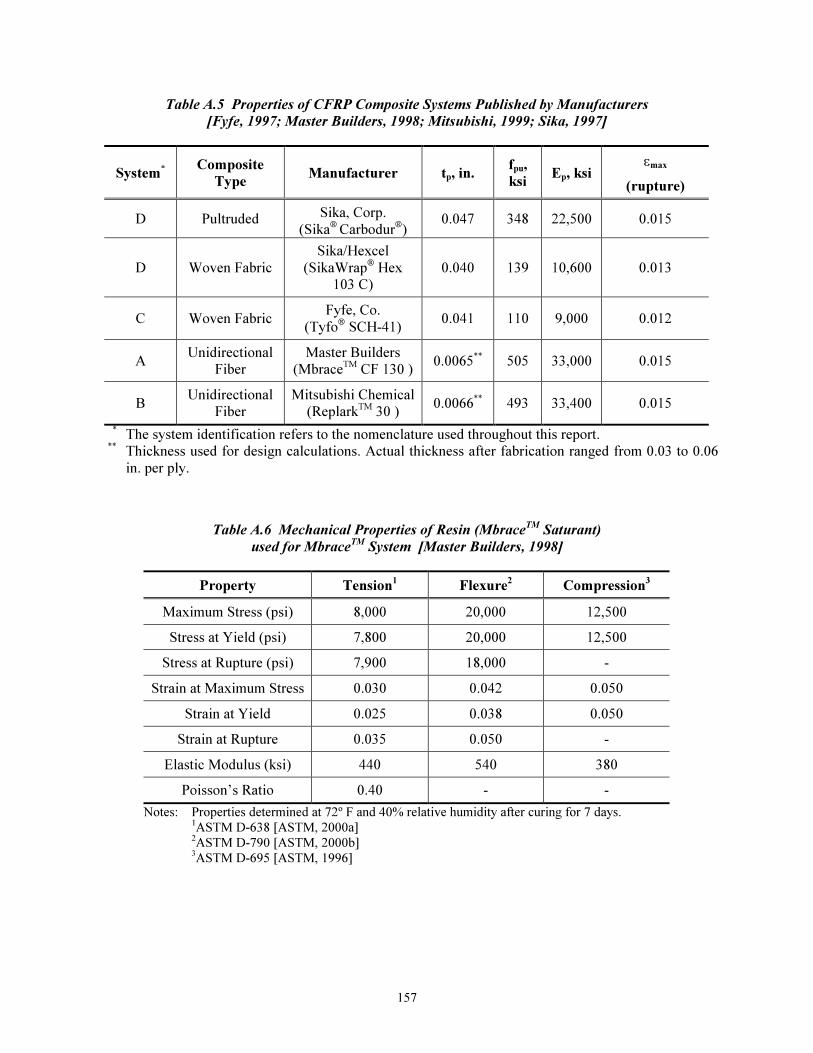
157
Table A.5 Properties of CFRP Composite Systems Published by Manufacturers
[Fyfe, 1997; Master Builders, 1998; Mitsubishi, 1999; Sika, 1997]
System*
Composite
Type Manufacturer tp, in.
fpu,
ksi Ep, ksi
εmax
(rupture)
D Pultruded Sika, Corp.
(Sika®
Carbodur®)
0.047 348 22,500 0.015
D Woven Fabric
Sika/Hexcel
(SikaWrap® Hex
103 C)
0.040 139 10,600 0.013
C Woven Fabric Fyfe, Co.
(Tyfo® SCH-41)
0.041 110 9,000 0.012
A Unidirectional
Fiber
Master Builders
(MbraceTM CF 130 )
0.0065**
505 33,000 0.015
B Unidirectional
Fiber
Mitsubishi Chemical
(ReplarkTM
30 ) 0.0066
** 493 33,400 0.015
* The system identification refers to the nomenclature used throughout this report.
** Thickness used for design calculations. Actual thickness after fabrication ranged from 0.03 to 0.06
in. per ply.
Table A.6 Mechanical Properties of Resin (MbraceTM
Saturant)
used for MbraceTM
System [Master Builders, 1998]
Property Tension1 Flexure
2 Compression
3
Maximum Stress (psi) 8,000 20,000 12,500
Stress at Yield (psi) 7,800 20,000 12,500
Stress at Rupture (psi) 7,900 18,000 -
Strain at Maximum Stress 0.030 0.042 0.050
Strain at Yield 0.025 0.038 0.050
Strain at Rupture 0.035 0.050 -
Elastic Modulus (ksi) 440 540 380
Poisson’s Ratio 0.40 - -
Notes: Properties determined at 72º F and 40% relative humidity after curing for 7 days. 1ASTM D-638 [ASTM, 2000a] 2ASTM D-790 [ASTM, 2000b] 3ASTM D-695 [ASTM, 1996]
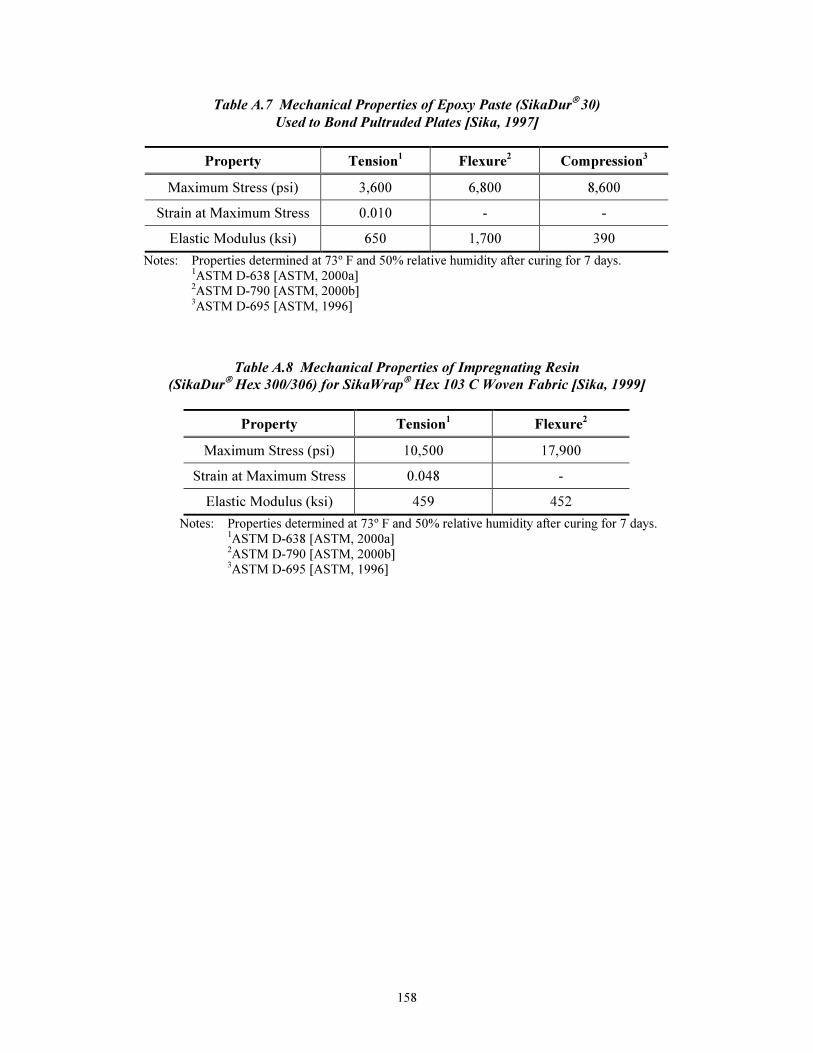
158
Table A.7 Mechanical Properties of Epoxy Paste (SikaDur®
30)
Used to Bond Pultruded Plates [Sika, 1997]
Property Tension1 Flexure
2 Compression
3
Maximum Stress (psi) 3,600 6,800 8,600
Strain at Maximum Stress 0.010 - -
Elastic Modulus (ksi) 650 1,700 390
Notes: Properties determined at 73º F and 50% relative humidity after curing for 7 days. 1ASTM D-638 [ASTM, 2000a] 2ASTM D-790 [ASTM, 2000b] 3ASTM D-695 [ASTM, 1996]
Table A.8 Mechanical Properties of Impregnating Resin
(SikaDur® Hex 300/306) for SikaWrap
® Hex 103 C Woven Fabric [Sika, 1999]
Property Tension1 Flexure
2
Maximum Stress (psi) 10,500 17,900
Strain at Maximum Stress 0.048 -
Elastic Modulus (ksi) 459 452
Notes: Properties determined at 73º F and 50% relative humidity after curing for 7 days. 1ASTM D-638 [ASTM, 2000a] 2ASTM D-790 [ASTM, 2000b] 3ASTM D-695 [ASTM, 1996]

159
Appendix B: Crack Patterns
B.1 SPECIMENS SUBJECTED TO STATIC LOADS
Observed crack patterns in each of the specimens subjected to static loads are presented in this section.
The crack widths indicated in the figures correspond to loads immediately before failure of the specimens.
Control A & B
0.010"
0.010"
0.020"
0.040"
>0.060"
>0.060"
0.020"
0.040"
>0.060"
>0.060"
>0.060"
0.020"
0.020"
0.010"
0.010"
>0.060"
0.020"
A1
0.002"
0.002"
0.002"
0.003"
0.007"
0.002"
0.009"
0.002"
0.040"
0.007"
0.010"
0.002"
0.002"
0.002"
0.010"
0.009"
0.002"
0.009"
0.002"
0.005"
0.002"
0.002"
0.002"
A2
0.002"
0.002"
0.007"
0.007"
0.005"
0.005"
0.030"
0.002"
0.003"
0.020"
0.002"
0.020"
0.002"
0.030"
0.003"
0.003"
0.005"
0.002"
0.003"
0.002"
0.002"
0.002"
0.002"
0.002"
0.002"
0.035"
0.016"
0.002"
0.040"
0.005"
0.030"
0.005"
0.002"
0.025"
0.002"
0.030"
0.020"
0.005"
0.003"
0.003"
0.003"
0.003"
0.003"
A3
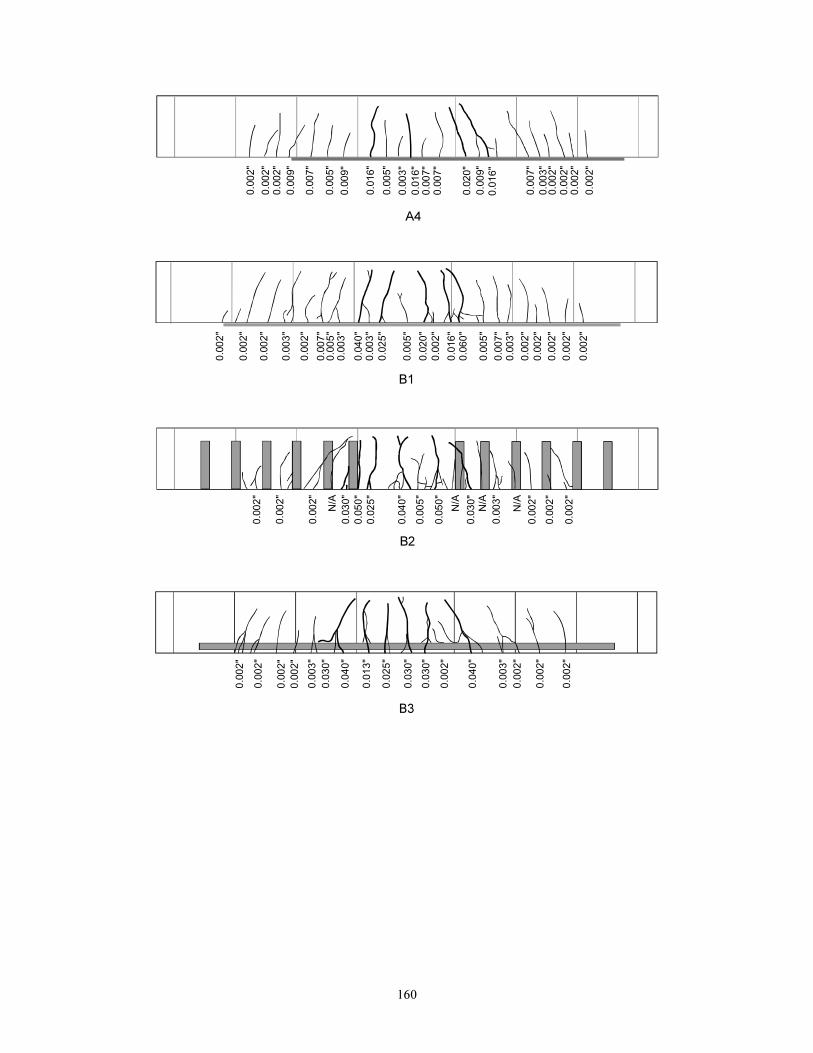
160
A4
0.002"
0.002"
0.009"
0.007"
0.005"
0.009"
0.016"
0.005"
0.016"
0.003"
0.007"
0.007"
0.020"
0.009"
0.016"
0.007"
0.003"
0.002"
0.002"
0.002"
0.002"
0.002"
0.002"
0.002"
0.002"
N/A
0.030"
0.050"
0.025"
0.040"
0.005"
0.050"
N/A
0.003"
N/A
0.002"
0.002"
0.002"
B2
N/A
0.030"
B3
0.002"
0.002"
0.002"
0.003"
0.030"
0.013"
0.025"
0.030"
0.030"
0.002"
0.040"
0.003"
0.002"
0.002"
0.040"
0.002"
0.002"
B1
0.002"
0.002"
0.002"
0.003"
0.002"
0.007"
0.005"
0.040"
0.003"
0.005"
0.025"
0.020"
0.002"
0.016"
0.060"
0.005"
0.007"
0.003"
0.002"
0.002"
0.002"
0.002"
0.003"
0.002"

161
B5
0.003"
0.002"
0.005"
0.010"
0.030"
>0.060"
0.050"
0.060"
0.010"
0.030"
0.060"
0.040"
0.005"
0.003"
0.005"
B4
0.050"
>0.060"
>0.060"
0.030"
>0.060"
0.040"
0.040"
0.060"
A-LT2
0.002"
0.002"
0.050"
0.030"
0.025"
0.025"
0.040"
0.007"
0.050"
0.002"
0.002"
0.005"
0.002"
0.003"
0.016"
0.002"
A-LT1
0.002"
0.016"
0.002"
0.030"
0.013"
0.013"
0.060"
0.002"
0.003"
0.007"
0.002"
0.060"
0.040"
0.003"
0.002"
0.002"
A-LT2
0.002"
0.002"
0.050"
0.030"
0.025"
0.025"
0.040"
0.007"
0.050"
0.002"
0.002"
0.005"
0.002"
0.003"
0.016"
0.002"
A-LT2
0.002"
0.002"
0.050"
0.030"
0.025"
0.025"
0.040"
0.007"
0.050"
0.002"
0.002"
0.005"
0.002"
0.003"
0.016"
0.002"
0.002"
0.002"
0.050"
0.030"
0.025"
0.025"
0.040"
0.007"
0.050"
0.002"
0.002"
0.005"
0.002"
0.003"
0.016"
0.002"
A-LT1
0.002"
0.016"
0.002"
0.030"
0.013"
0.013"
0.060"
0.002"
0.003"
0.007"
0.002"
0.060"
0.040"
0.003"
0.002"
0.002"
A-LT1
0.002"
0.016"
0.002"
0.030"
0.013"
0.013"
0.060"
0.002"
0.003"
0.007"
0.002"
0.060"
0.040"
0.003"
0.002"
0.002"
0.002"
0.016"
0.002"
0.030"
0.013"
0.013"
0.060"
0.002"
0.003"
0.007"
0.002"
0.060"
0.040"
0.003"
0.002"
0.002"
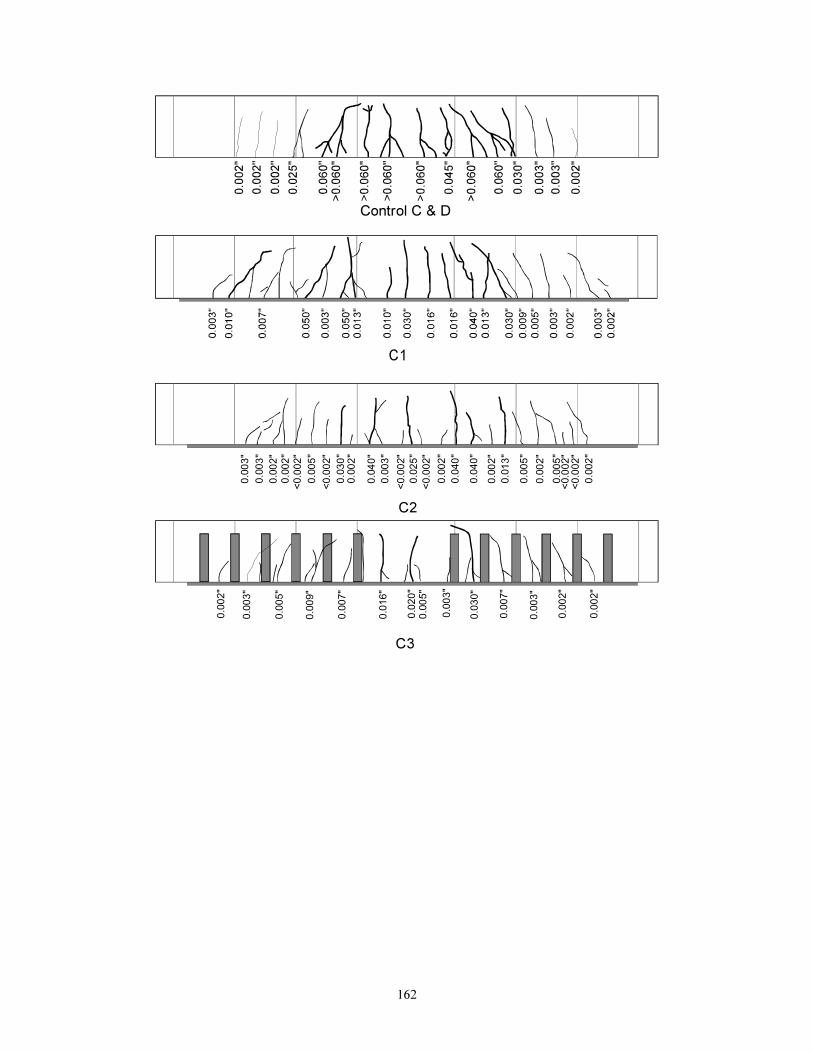
162
C2
0.040"
0.025"
0.040"
0.040"
0.030"
0.013"
0.005"
0.005"
<0. 002"
0.003"
0.002"
0.003"
0.002"
<0. 002"
0.005"
<0.002"
0.002"
0.003"
<0.002"
0.002"
0.002"
0.002"
0.002"
<0.002"
<0.002"
0.003"
0.005"
0.009"
0.007"
0.016"
0.020"
0.030"
0.007"
0.003"
0.002"
0.002"
0.003"
0.005"
C3
0.002"
Control C & D
C1
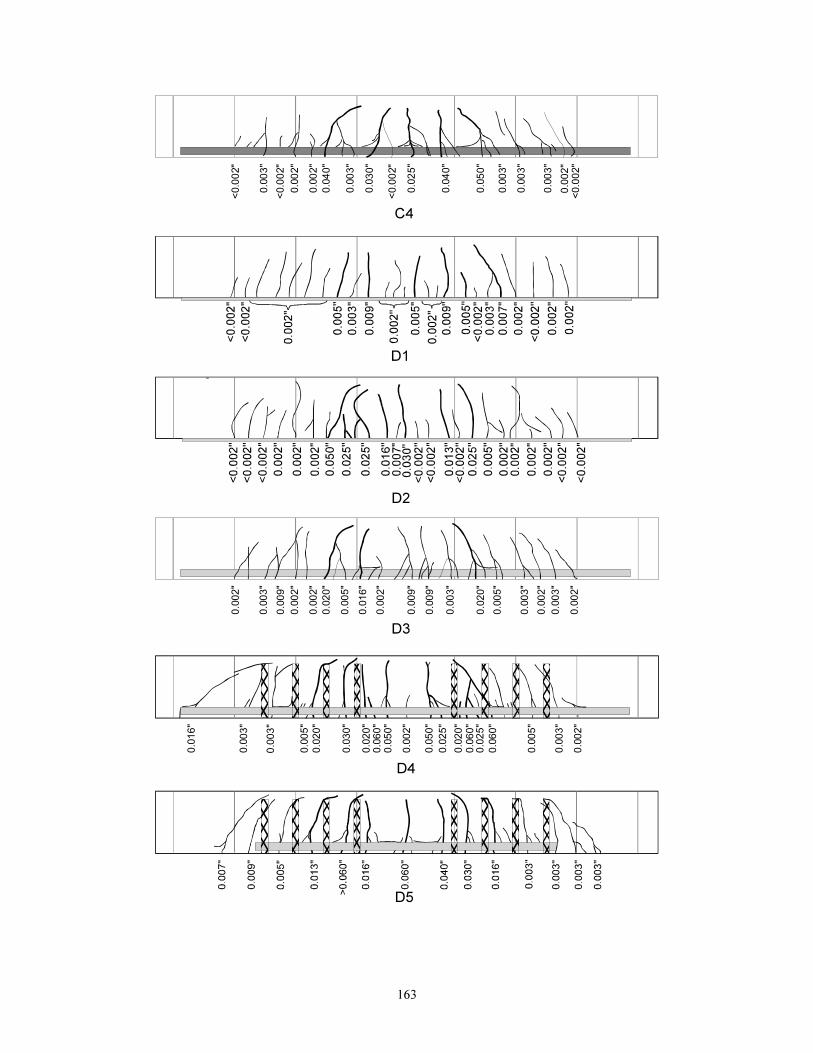
163
D2
0.002"
0.009"
0.003"
0.002"
0.002"
0.020"
0.005"
0.016"
0.002"
0.009"
0.009"
0.020"
0.005"
0.003"
0.003"
0.002"
0.003"
0.002"
D3
<0.002"
<0.002"
0.003"
0.002"
0.002"
0.040"
0.003"
0.030"
<0.002"
0.025"
0.040"
0.050"
0.003"
0.003"
0.002"
<0.002"
0.003"
C4
D1
D5
0.003"
0.020"
0.005"
0.030"
0.060"
0.020"
0.050"
0.002"
0.050"
0.020"
0.060"
0.025"
0.025"
0.060"
0.003"
0.002"
0.016"
0.003"
0.005"
D4
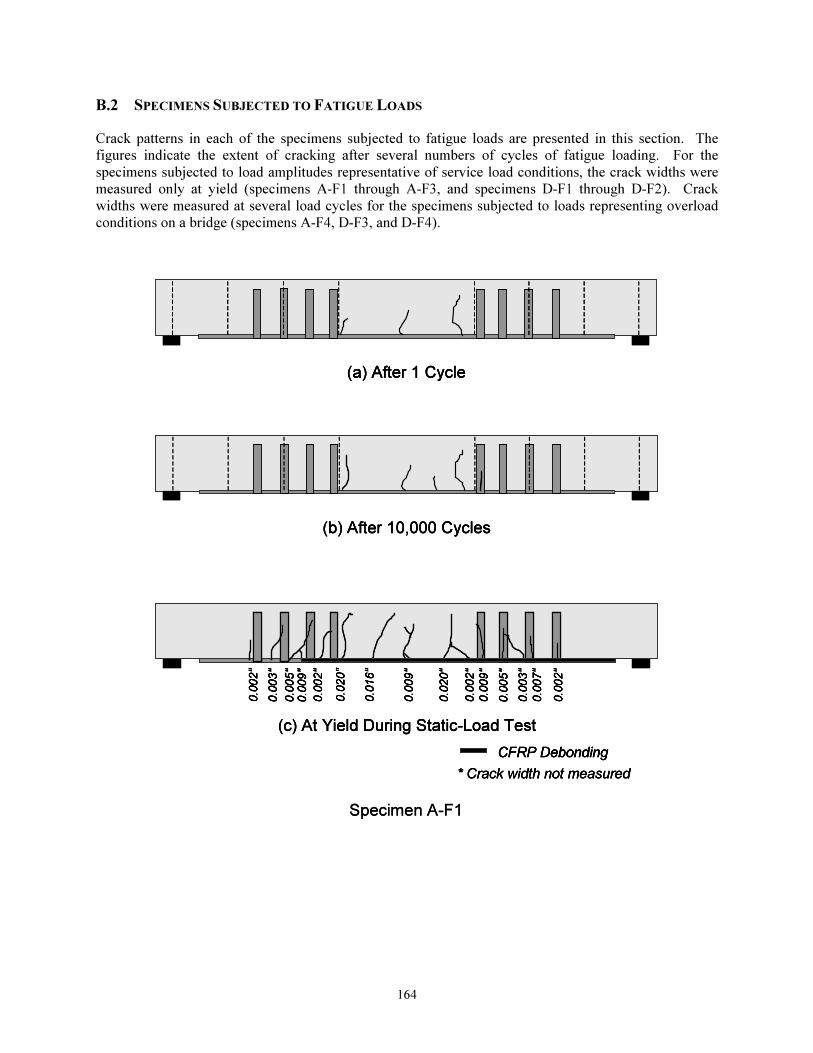
164
B.2 SPECIMENS SUBJECTED TO FATIGUE LOADS
Crack patterns in each of the specimens subjected to fatigue loads are presented in this section. The
figures indicate the extent of cracking after several numbers of cycles of fatigue loading. For the
specimens subjected to load amplitudes representative of service load conditions, the crack widths were
measured only at yield (specimens A-F1 through A-F3, and specimens D-F1 through D-F2). Crack
widths were measured at several load cycles for the specimens subjected to loads representing overload
conditions on a bridge (specimens A-F4, D-F3, and D-F4).
(a) After 1 Cycle
(c) At Yield During Static-Load Test
0.003"
0.005"
0.002"
0.020"
0.016"
0.009"
0.020"
0.002"
0.009"
0.005"
0.007"
0.002"
0.002"
0.009"
0.003"
* Crack width not measured
CFRP Debonding
(b) After 10,000 Cycles
Specimen A-F1
(a) After 1 Cycle(a) After 1 Cycle
(c) At Yield During Static-Load Test
0.003"
0.005"
0.002"
0.020"
0.016"
0.009"
0.020"
0.002"
0.009"
0.005"
0.007"
0.002"
0.002"
0.009"
0.003"
(c) At Yield During Static-Load Test
0.003"
0.005"
0.002"
0.020"
0.016"
0.009"
0.020"
0.002"
0.009"
0.005"
0.007"
0.002"
0.002"
0.009"
0.003"
0.003"
0.005"
0.002"
0.020"
0.016"
0.009"
0.020"
0.002"
0.009"
0.005"
0.007"
0.002"
0.002"
0.009"
0.003"
* Crack width not measured
CFRP Debonding
* Crack width not measured
CFRP DebondingCFRP Debonding
(b) After 10,000 Cycles(b) After 10,000 Cycles
Specimen A-F1
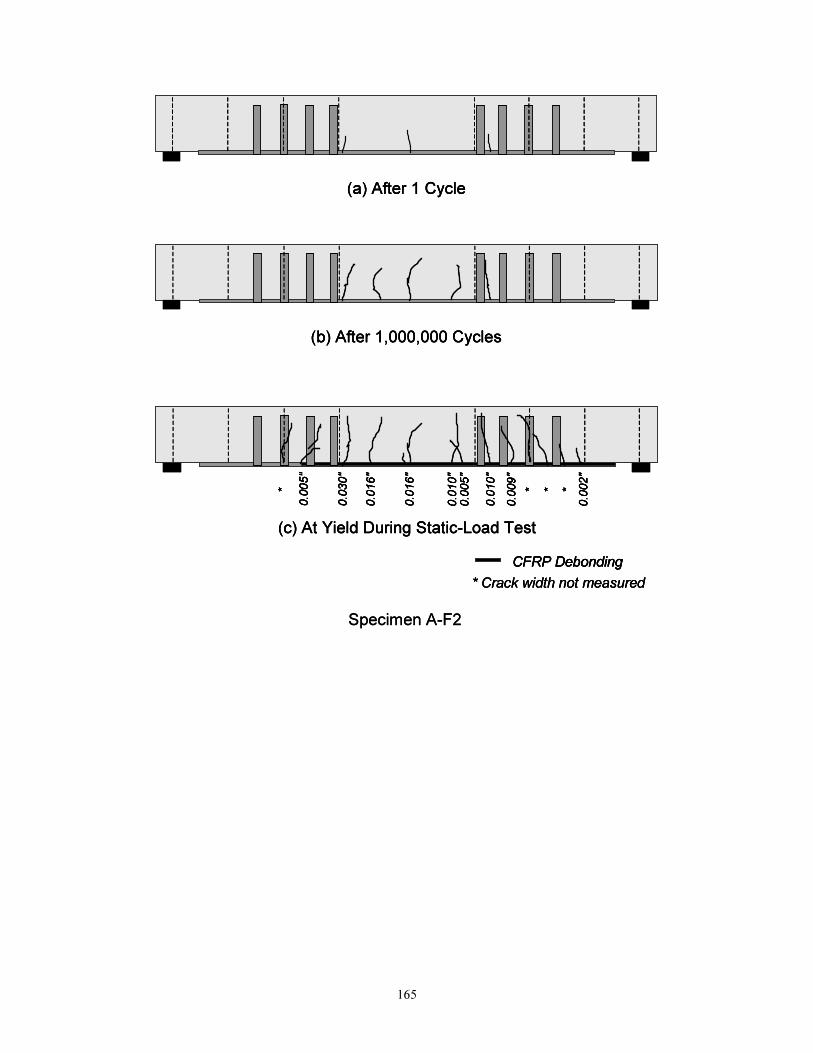
165
(a) After 1 Cycle
(b) After 1,000,000 Cycles
(c) At Yield During Static-Load Test
*
0.030"
0.016"
0.016"
0.010"
0.005"
0.010"
0.005"
0.009"
* * *
0.002"
* Crack width not measured
CFRP Debonding
Specimen A-F2
(a) After 1 Cycle(a) After 1 Cycle
(b) After 1,000,000 Cycles(b) After 1,000,000 Cycles
(c) At Yield During Static-Load Test
*
0.030"
0.016"
0.016"
0.010"
0.005"
0.010"
0.005"
0.009"
* * *
0.002"
(c) At Yield During Static-Load Test
*
0.030"
0.016"
0.016"
0.010"
0.005"
0.010"
0.005"
0.009"
* * *
0.002"
*
0.030"
0.016"
0.016"
0.010"
0.005"
0.010"
0.005"
0.009"
* * *
0.002"
* Crack width not measured
CFRP Debonding
* Crack width not measured
CFRP DebondingCFRP Debonding
Specimen A-F2

166
(a) After 1 Cycle
* Crack width not measured
CFRP Debonding
(c) At Yield During Static-Load Test
0.030"
0.016"
0.010"
0.002"
0.010"
0.003"
0.002"
0.009"
* *
0.002"
0.003"
0.002"
0.002"
*
0.002"
0.002"
*
(b) After 1,000,000 Cycles
Specimen A-F3
(a) After 1 Cycle(a) After 1 Cycle
* Crack width not measured
CFRP Debonding
* Crack width not measured
CFRP DebondingCFRP Debonding
(c) At Yield During Static-Load Test
0.030"
0.016"
0.010"
0.002"
0.010"
0.003"
0.002"
0.009"
* *
0.002"
0.003"
0.002"
0.002"
*
0.002"
0.002"
*
(c) At Yield During Static-Load Test
0.030"
0.016"
0.010"
0.002"
0.010"
0.003"
0.002"
0.009"
* *
0.002"
0.003"
0.002"
0.002"
*
0.002"
0.002"
*
0.030"
0.016"
0.010"
0.002"
0.010"
0.003"
0.002"
0.009"
* *
0.002"
0.003"
0.002"
0.002"
*
0.002"
0.002"
*
(b) After 1,000,000 Cycles(b) After 1,000,000 Cycles
Specimen A-F3
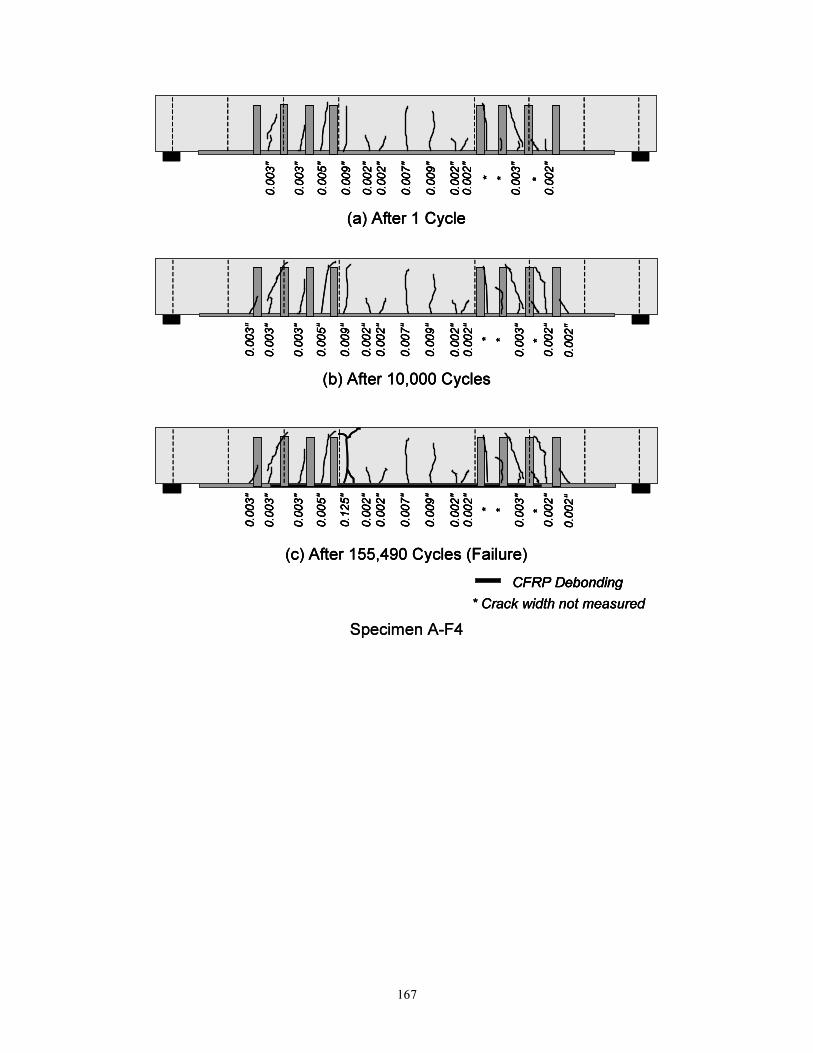
167
(a) After 1 Cycle
0.003"
0.003"
0.005"
0.009"
0.002"
0.007"
0.009"
0.002"
0.002"
0.002"
* *
0.003"
0.002"
*
(b) After 10,000 Cycles
0.003"
0.003"
0.005"
0.009"
0.002"
0.007"
0.009"
0.002"
0.002"
0.002"
* *
0.003"
0.002"
*
0.003"
0.002"
(c) After 155,490 Cycles (Failure)
0.003"
0.003"
0.005"
0.125"
0.002"
0.007"
0.009"
0.002"
0.002"
0.002"
* *
0.003"
0.002"
*
0.003"
0.002"
* Crack width not measured
CFRP Debonding
Specimen A-F4
(a) After 1 Cycle
0.003"
0.003"
0.005"
0.009"
0.002"
0.007"
0.009"
0.002"
0.002"
0.002"
* *
0.003"
0.002"
*
(a) After 1 Cycle
0.003"
0.003"
0.005"
0.009"
0.002"
0.007"
0.009"
0.002"
0.002"
0.002"
* *
0.003"
0.002"
*
0.003"
0.003"
0.005"
0.009"
0.002"
0.007"
0.009"
0.002"
0.002"
0.002"
* *
0.003"
0.002"
*
(b) After 10,000 Cycles
0.003"
0.003"
0.005"
0.009"
0.002"
0.007"
0.009"
0.002"
0.002"
0.002"
* *
0.003"
0.002"
*
0.003"
0.002"
(b) After 10,000 Cycles
0.003"
0.003"
0.005"
0.009"
0.002"
0.007"
0.009"
0.002"
0.002"
0.002"
* *
0.003"
0.002"
*
0.003"
0.002"
0.003"
0.003"
0.005"
0.009"
0.002"
0.007"
0.009"
0.002"
0.002"
0.002"
* *
0.003"
0.002"
*
0.003"
0.002"
(c) After 155,490 Cycles (Failure)
0.003"
0.003"
0.005"
0.125"
0.002"
0.007"
0.009"
0.002"
0.002"
0.002"
* *
0.003"
0.002"
*
0.003"
0.002"
(c) After 155,490 Cycles (Failure)
0.003"
0.003"
0.005"
0.125"
0.002"
0.007"
0.009"
0.002"
0.002"
0.002"
* *
0.003"
0.002"
*
0.003"
0.002"
0.003"
0.003"
0.005"
0.125"
0.002"
0.007"
0.009"
0.002"
0.002"
0.002"
* *
0.003"
0.002"
*
0.003"
0.002"
* Crack width not measured
CFRP Debonding
* Crack width not measured
CFRP DebondingCFRP Debonding
Specimen A-F4
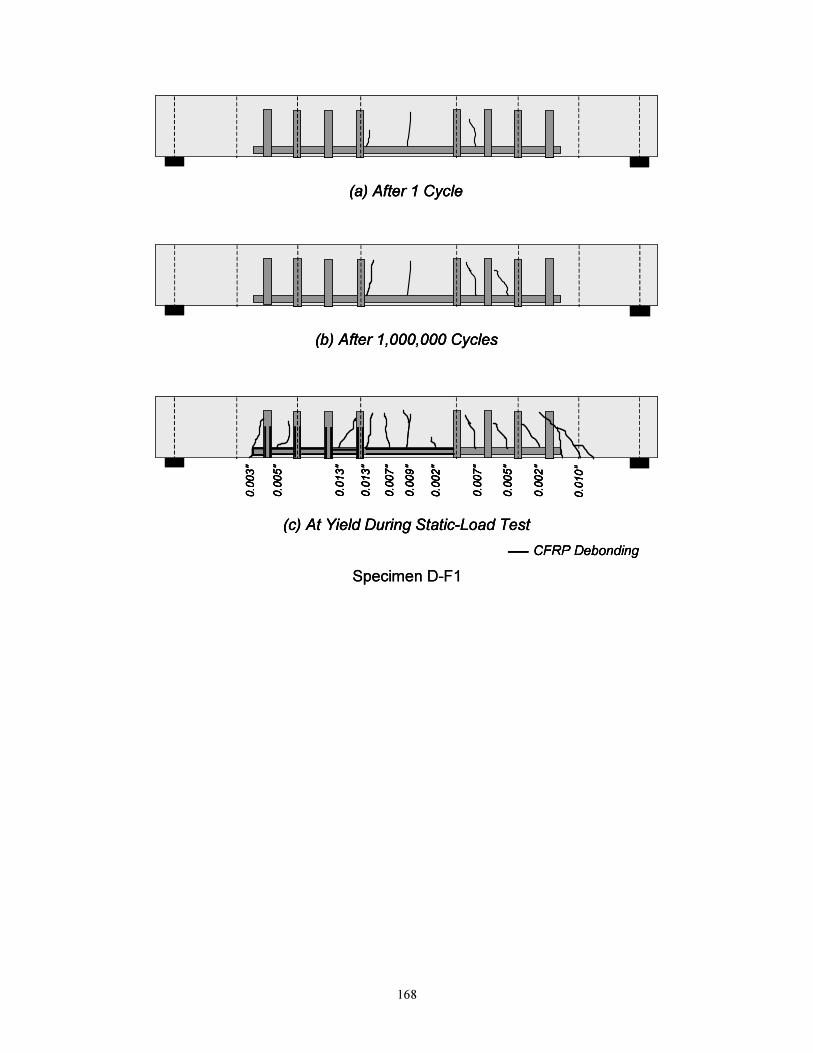
168
(a) After 1 Cycle
(b) After 1,000,000 Cycles
CFRP Debonding
(c) At Yield During Static-Load Test
0.003"
0.005"
0.013"
0.013"
0.009"
0.002"
0.007"
0.007"
0.005"
0.002"
0.010"
Specimen D-F1
(a) After 1 Cycle(a) After 1 Cycle
(b) After 1,000,000 Cycles(b) After 1,000,000 Cycles
CFRP DebondingCFRP Debonding
(c) At Yield During Static-Load Test
0.003"
0.005"
0.013"
0.013"
0.009"
0.002"
0.007"
0.007"
0.005"
0.002"
0.010"
(c) At Yield During Static-Load Test
0.003"
0.005"
0.013"
0.013"
0.009"
0.002"
0.007"
0.007"
0.005"
0.002"
0.010"
0.003"
0.005"
0.013"
0.013"
0.009"
0.002"
0.007"
0.007"
0.005"
0.002"
0.010"
Specimen D-F1
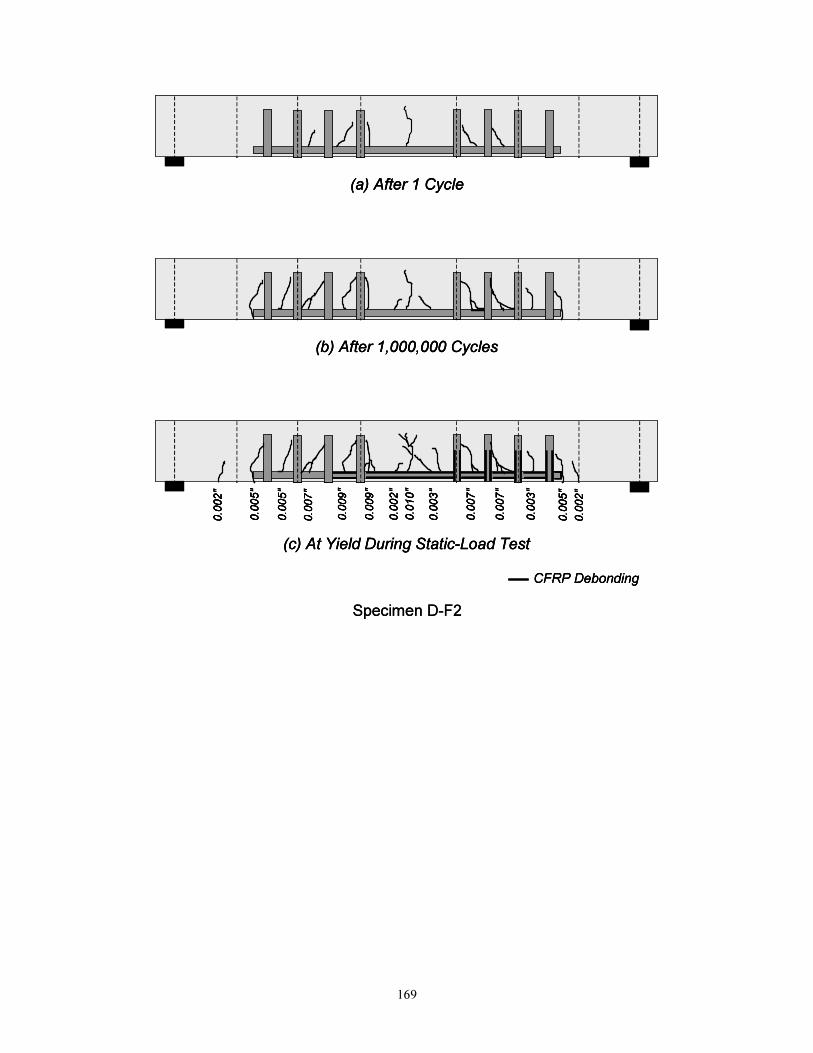
169
(a) After 1 Cycle
CFRP Debonding
(b) After 1,000,000 Cycles
(c) At Yield During Static-Load Test
0.005"
0.005"
0.009"
0.002"
0.010"
0.003"
0.009"
0.007"
0.007"
0.003"
0.005"
0.002"
0.007"
0.002"
Specimen D-F2
(a) After 1 Cycle(a) After 1 Cycle
CFRP DebondingCFRP Debonding
(b) After 1,000,000 Cycles(b) After 1,000,000 Cycles
(c) At Yield During Static-Load Test
0.005"
0.005"
0.009"
0.002"
0.010"
0.003"
0.009"
0.007"
0.007"
0.003"
0.005"
0.002"
0.007"
0.002"
(c) At Yield During Static-Load Test
0.005"
0.005"
0.009"
0.002"
0.010"
0.003"
0.009"
0.007"
0.007"
0.003"
0.005"
0.002"
0.007"
0.002"
0.005"
0.005"
0.009"
0.002"
0.010"
0.003"
0.009"
0.007"
0.007"
0.003"
0.005"
0.002"
0.007"
0.002"
Specimen D-F2
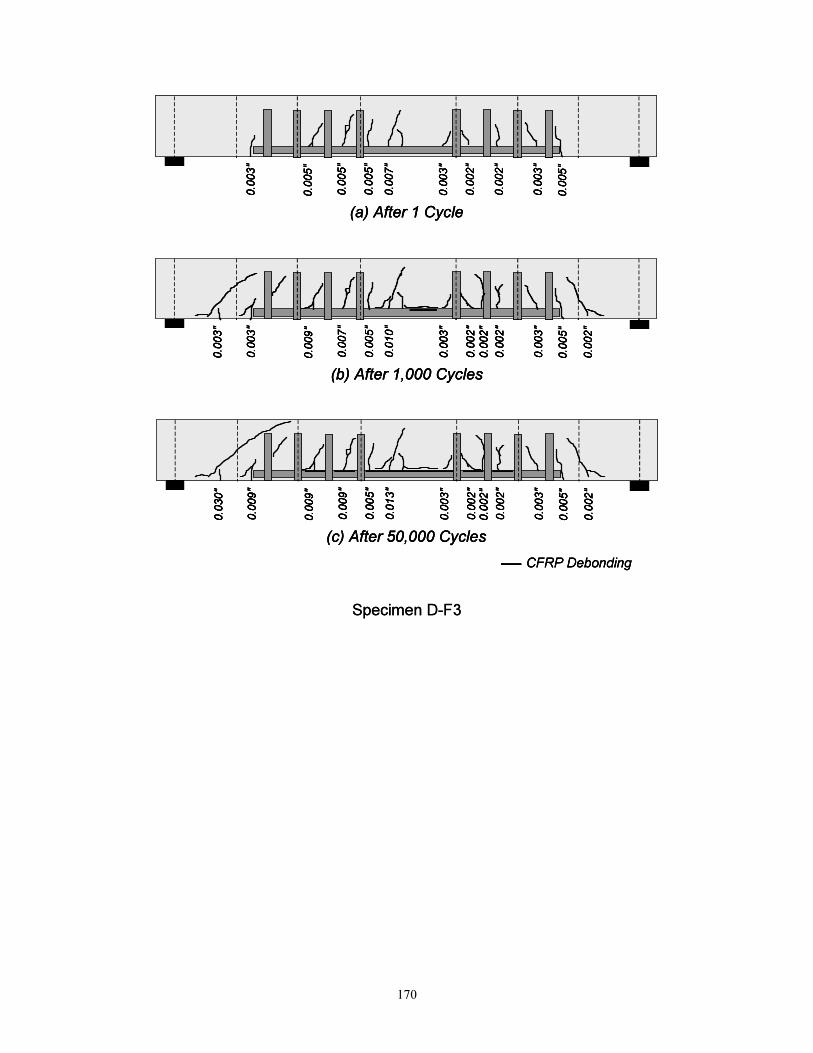
170
(a) After 1 Cycle
0.003"
0.005"
0.003"
0.005"
0.002"
0.002"
0.003"
0.005"
0.005"
0.007"
CFRP Debonding
(c) After 50,000 Cycles
0.009"
0.009"
0.003"
0.005"
0.002"
0.002"
0.003"
0.005"
0.030"
0.009"
0.013"
0.002"
0.002"
(b) After 1,000 Cycles
0.003"
0.007"
0.003"
0.005"
0.002"
0.002"
0.003"
0.005"
0.003"
0.009"
0.010"
0.002"
0.002"
Specimen D-F3
(a) After 1 Cycle
0.003"
0.005"
0.003"
0.005"
0.002"
0.002"
0.003"
0.005"
0.005"
0.007"
(a) After 1 Cycle
0.003"
0.005"
0.003"
0.005"
0.002"
0.002"
0.003"
0.005"
0.005"
0.007"
0.003"
0.005"
0.003"
0.005"
0.002"
0.002"
0.003"
0.005"
0.005"
0.007"
CFRP DebondingCFRP Debonding
(c) After 50,000 Cycles
0.009"
0.009"
0.003"
0.005"
0.002"
0.002"
0.003"
0.005"
0.030"
0.009"
0.013"
0.002"
0.002"
(c) After 50,000 Cycles
0.009"
0.009"
0.003"
0.005"
0.002"
0.002"
0.003"
0.005"
0.030"
0.009"
0.013"
0.002"
0.002"
0.009"
0.009"
0.003"
0.005"
0.002"
0.002"
0.003"
0.005"
0.030"
0.009"
0.013"
0.002"
0.002"
(b) After 1,000 Cycles
0.003"
0.007"
0.003"
0.005"
0.002"
0.002"
0.003"
0.005"
0.003"
0.009"
0.010"
0.002"
0.002"
(b) After 1,000 Cycles
0.003"
0.007"
0.003"
0.005"
0.002"
0.002"
0.003"
0.005"
0.003"
0.009"
0.010"
0.002"
0.002"
0.003"
0.007"
0.003"
0.005"
0.002"
0.002"
0.003"
0.005"
0.003"
0.009"
0.010"
0.002"
0.002"
Specimen D-F3

171
(a) After 1 Cycle
0.005"
0.025"
0.020"
0.010"
0.005"
0.025"
0.005"
0.005"
0.003"
0.002"
0.002"
0.002"
CFRP Debonding
(b) After 3,000 Cycles
0.005"
0.030"
0.020"
0.025"
0.010"
0.025"
0.005"
0.002"
0.003"
0.009"
0.003"
0.025"
(c) After 8,990 (Failure)
0.005"
0.030"
0.020"
0.025"
0.010"
0.025"
0.005"
0.002"
0.003"
0.009"
0.003"
0.025"
Specimen D-F4
(a) After 1 Cycle
0.005"
0.025"
0.020"
0.010"
0.005"
0.025"
0.005"
0.005"
0.003"
0.002"
0.002"
0.002"
(a) After 1 Cycle
0.005"
0.025"
0.020"
0.010"
0.005"
0.025"
0.005"
0.005"
0.003"
0.002"
0.002"
0.002"
0.005"
0.025"
0.020"
0.010"
0.005"
0.025"
0.005"
0.005"
0.003"
0.002"
0.002"
0.002"
CFRP DebondingCFRP Debonding
(b) After 3,000 Cycles
0.005"
0.030"
0.020"
0.025"
0.010"
0.025"
0.005"
0.002"
0.003"
0.009"
0.003"
0.025"
(b) After 3,000 Cycles
0.005"
0.030"
0.020"
0.025"
0.010"
0.025"
0.005"
0.002"
0.003"
0.009"
0.003"
0.025"
0.005"
0.030"
0.020"
0.025"
0.010"
0.025"
0.005"
0.002"
0.003"
0.009"
0.003"
0.025"
(c) After 8,990 (Failure)
0.005"
0.030"
0.020"
0.025"
0.010"
0.025"
0.005"
0.002"
0.003"
0.009"
0.003"
0.025"
(c) After 8,990 (Failure)
0.005"
0.030"
0.020"
0.025"
0.010"
0.025"
0.005"
0.002"
0.003"
0.009"
0.003"
0.025"
0.005"
0.030"
0.020"
0.025"
0.010"
0.025"
0.005"
0.002"
0.003"
0.009"
0.003"
0.025"
Specimen D-F4

172
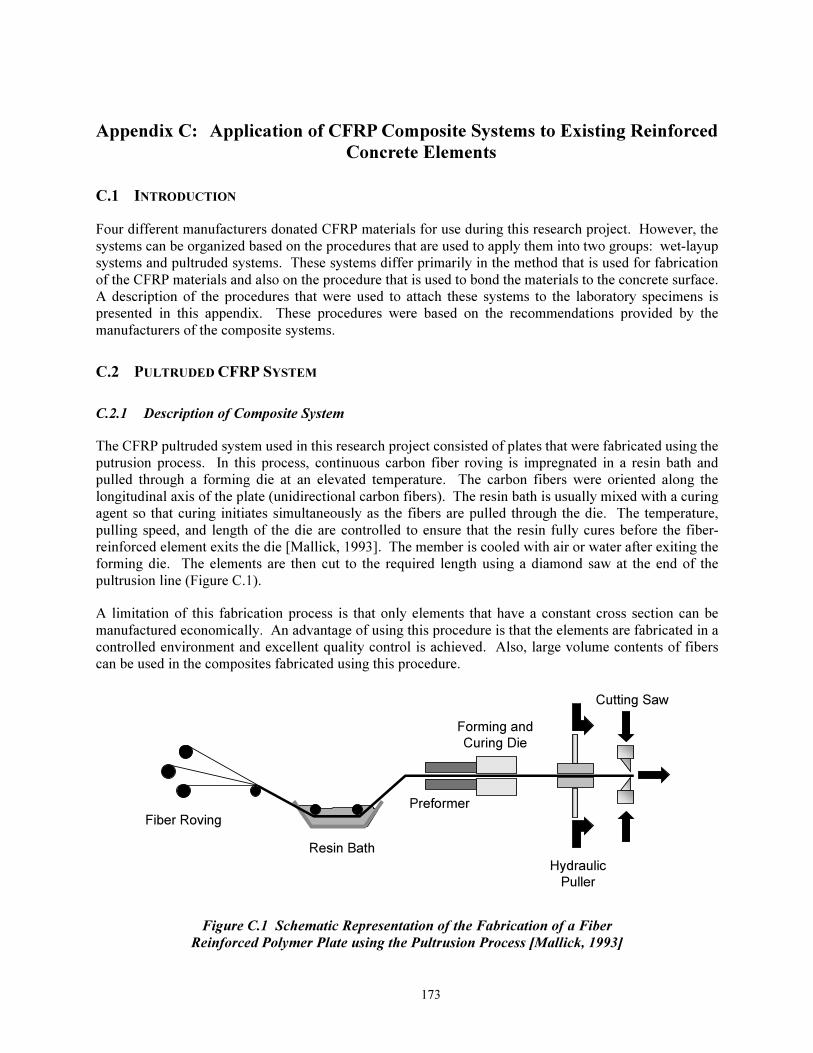
173
Appendix C: Application of CFRP Composite Systems to Existing Reinforced
Concrete Elements
C.1 INTRODUCTION
Four different manufacturers donated CFRP materials for use during this research project. However, the
systems can be organized based on the procedures that are used to apply them into two groups: wet-layup
systems and pultruded systems. These systems differ primarily in the method that is used for fabrication
of the CFRP materials and also on the procedure that is used to bond the materials to the concrete surface.
A description of the procedures that were used to attach these systems to the laboratory specimens is
presented in this appendix. These procedures were based on the recommendations provided by the
manufacturers of the composite systems.
C.2 PULTRUDED CFRP SYSTEM
C.2.1 Description of Composite System
The CFRP pultruded system used in this research project consisted of plates that were fabricated using the
putrusion process. In this process, continuous carbon fiber roving is impregnated in a resin bath and
pulled through a forming die at an elevated temperature. The carbon fibers were oriented along the
longitudinal axis of the plate (unidirectional carbon fibers). The resin bath is usually mixed with a curing
agent so that curing initiates simultaneously as the fibers are pulled through the die. The temperature,
pulling speed, and length of the die are controlled to ensure that the resin fully cures before the fiber-
reinforced element exits the die [Mallick, 1993]. The member is cooled with air or water after exiting the
forming die. The elements are then cut to the required length using a diamond saw at the end of the
pultrusion line (Figure C.1).
A limitation of this fabrication process is that only elements that have a constant cross section can be
manufactured economically. An advantage of using this procedure is that the elements are fabricated in a
controlled environment and excellent quality control is achieved. Also, large volume contents of fibers
can be used in the composites fabricated using this procedure.
Resin Bath
Forming and
Curing Die
Preformer
Hydraulic
Puller
Fiber Roving
Cutting Saw
Figure C.1 Schematic Representation of the Fabrication of a Fiber
Reinforced Polymer Plate using the Pultrusion Process [Mallick, 1993]
174
C.2.2 Application to Reinforced Concrete Element
The application of the pultruded CFRP system that was used to strengthen the reinforced concrete
laboratory specimens can be summarized in the following steps and is illustrated in Figure C.2:
a) Preparation of concrete surface and CFRP plate
• Prepare concrete surface by grinding or light sandblasting to expose aggregates.
• Remove loose concrete particles generated during surface preparation using pressurized air.
• Clean concrete surface and CFRP pultruded plates with acetone until a white cloth remains
white after wiping.
b) CFRP system application
• Mix epoxy paste and hardener for three minutes at approximately 400 to 600 RPM. The
mixing proportions should follow the values recommended by the manufacturer.
• Apply a thin layer (approximately 1/16-in.) of mixed epoxy paste to the concrete surface,
covering the area where the pultruded plates will be installed.
• Apply a layer of epoxy paste to the clean CFRP plate. The epoxy paste should have a
triangular section after application on the plate
• Place CFRP plate on concrete surface and apply hand pressure to force epoxy paste out from
beneath the plate.
• Clean excess epoxy from sides of plates.
A woven carbon fiber sheet was used to fabricate straps to wrap the CFRP pultruded plates at discrete
locations and avoid premature debonding of the pultruded plates. These straps were applied using the
procedures described for the CFRP wet-layup system in Section C.3. The procedure is illustrated in
Figure C.3.
The thickness of the pultruded plates system was approximately 1/8 in. after placement on the concrete
surface. Therefore, to place the woven fabric straps and avoid having a sharp bend at the plate boundary,
epoxy paste was built up to form a ramp. The woven fabric straps were placed on the reinforced concrete
element after the epoxy paste that formed the ramps had hardened.
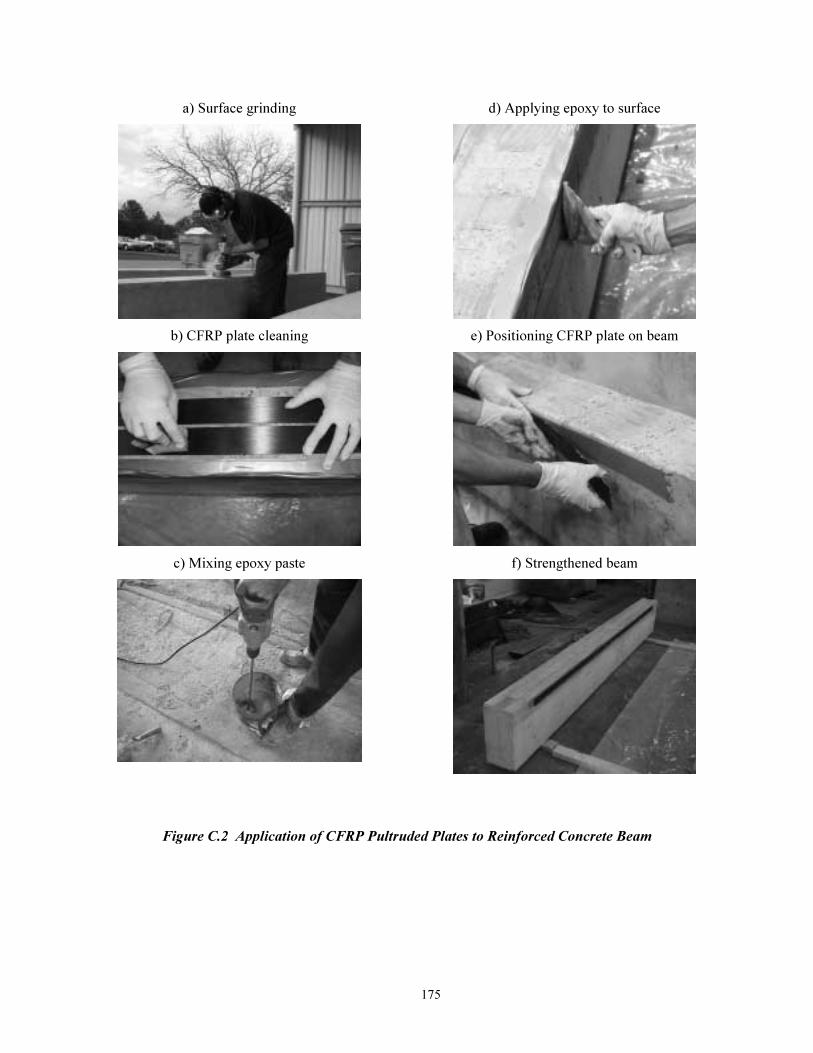
175
a) Surface grinding
b) CFRP plate cleaning
c) Mixing epoxy paste
d) Applying epoxy to surface
e) Positioning CFRP plate on beam
f) Strengthened beam
Figure C.2 Application of CFRP Pultruded Plates to Reinforced Concrete Beam
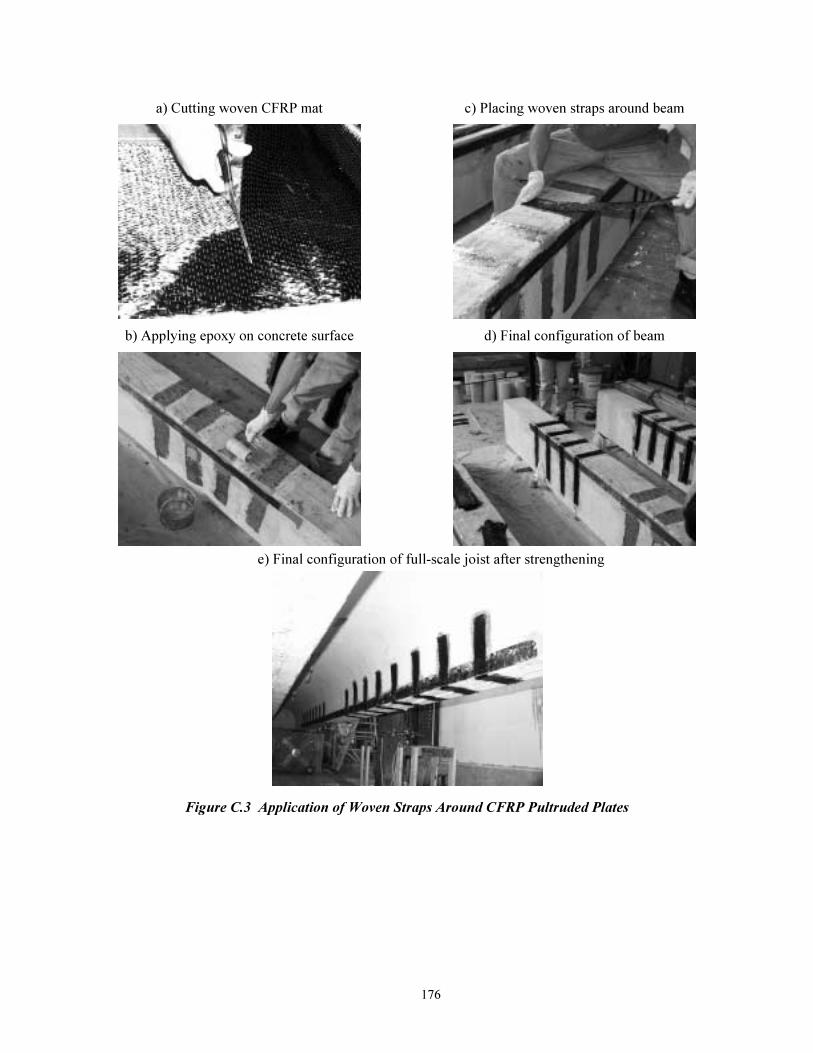
176
a) Cutting woven CFRP mat
b) Applying epoxy on concrete surface
c) Placing woven straps around beam
d) Final configuration of beam
e) Final configuration of full-scale joist after strengthening
Figure C.3 Application of Woven Straps Around CFRP Pultruded Plates

177
C.3 WET-LAYUP CFRP SYSTEMS
C.3.1 Description of Composite Systems
The CFRP composite systems that were used in this research project consisted of dry unidirectional
carbon fiber sheets that were impregnated with an epoxy resin to form the composite in the laboratory.
The fabrication process is termed “wet-layup process” because the carbon fiber sheets are impregnated
sequentially as they are positioned on the concrete element.
The main disadvantage of this composite system is caused by the large variability introduced by the
manufacturing process. Because the epoxy resin that forms the matrix of the composite is applied
manually, significant variations in the composite thickness can result. For the composites that were used
in this study, the actual composite thickness ranged from 0.04 to 0.06-in. per carbon fiber ply.
Recognizing this inherent variability, the manufacturer of this system suggests using the carbon fiber
thickness for design calculations because the uniaxial tensile stress behavior is controlled by the carbon
fibers.
C.3.2 Application to Reinforced Concrete Element
The procedure that was used in this research project to apply this CFRP composite system is summarized
below. These steps were followed according to recommendations from the manufacturer of the system
(Figure C.4):
a) Preparation of concrete surface
• Remove loose concrete particles from surface using a grinding tool. Remove dust generated
during grinding using compressed air.
• Fill concrete voids with epoxy putty.
b) CFRP system application
• Apply epoxy primer to seal the concrete surface. Wait until primer reaches a tack-free
condition before applying epoxy on the concrete surface.
• Mix two-component epoxy resin using the mixing ratio specified by the manufacturer. Mix
using a power drill at a low speed (approximately 400 RPM) using an epoxy paddle.
• Apply a coat of mixed epoxy resin on the concrete surface. This layer will partially
impregnate the carbon fibers after they are placed on the concrete element.
• Cut carbon fiber sheets to the required width and length.
• Place carbon fiber sheets on concrete surface over area that was previously coated with epoxy
resin. Placement should begin on one end of the concrete element and continue toward the
other end.

178
• Remove backing paper and use a ribbed roller to remove air bubbles that are trapped behind
the carbon fiber sheet. Let carbon fibers impregnate in the epoxy resin for approximately 30
minutes.
• Apply a coat of epoxy resin on top of the carbon fibers to enhance impregnation and to form
the composite matrix.
• Apply subsequent layers (plies) of carbon fiber sheets and epoxy coat, if required by design,
following the procedure described above.
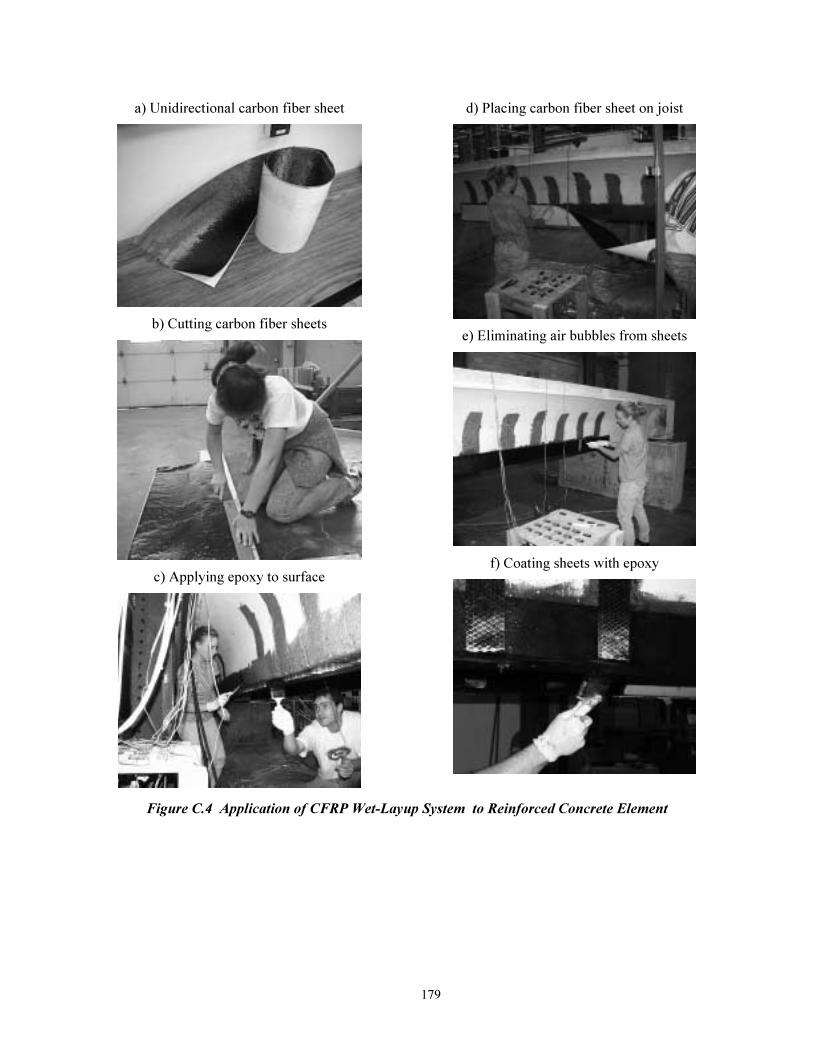
179
a) Unidirectional carbon fiber sheet
b) Cutting carbon fiber sheets
c) Applying epoxy to surface
d) Placing carbon fiber sheet on joist
e) Eliminating air bubbles from sheets
f) Coating sheets with epoxy
Figure C.4 Application of CFRP Wet-Layup System to Reinforced Concrete Element

180
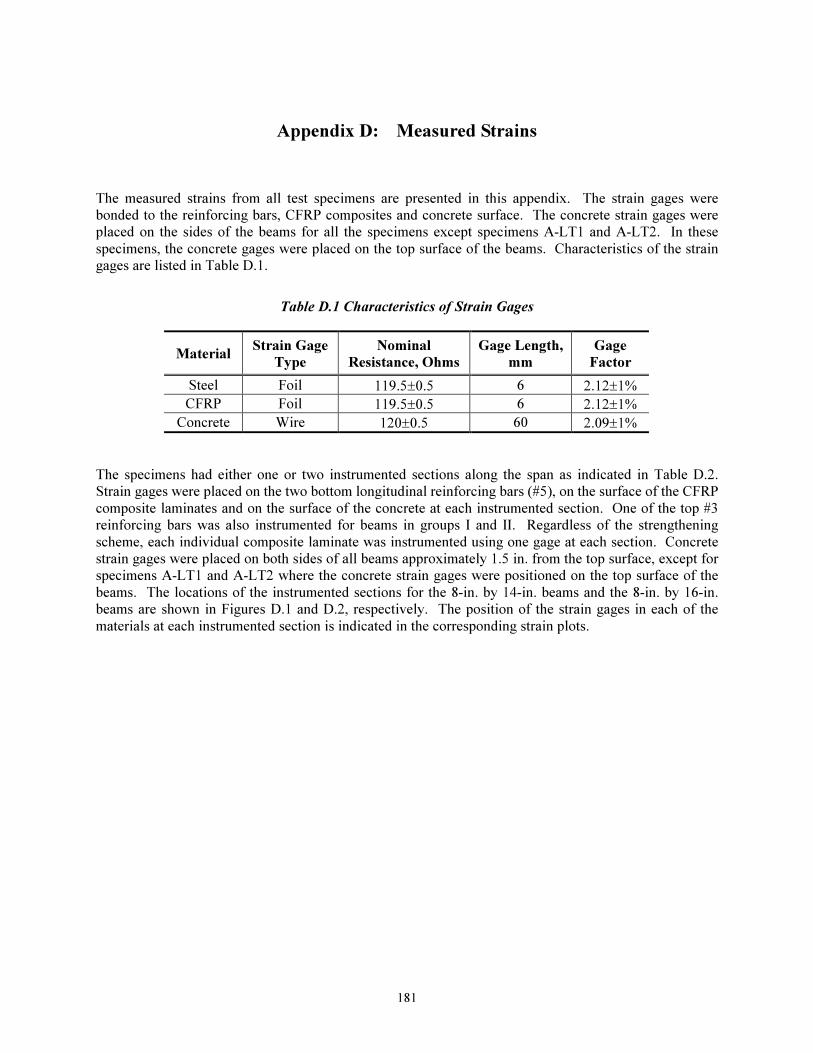
181
Appendix D: Measured Strains
The measured strains from all test specimens are presented in this appendix. The strain gages were
bonded to the reinforcing bars, CFRP composites and concrete surface. The concrete strain gages were
placed on the sides of the beams for all the specimens except specimens A-LT1 and A-LT2. In these
specimens, the concrete gages were placed on the top surface of the beams. Characteristics of the strain
gages are listed in Table D.1.
Table D.1 Characteristics of Strain Gages
Material Strain Gage
Type
Nominal
Resistance, Ohms
Gage Length,
mm
Gage
Factor
Steel Foil 119.5±0.5 6 2.12±1%
CFRP Foil 119.5±0.5 6 2.12±1%
Concrete Wire 120±0.5 60 2.09±1%
The specimens had either one or two instrumented sections along the span as indicated in Table D.2.
Strain gages were placed on the two bottom longitudinal reinforcing bars (#5), on the surface of the CFRP
composite laminates and on the surface of the concrete at each instrumented section. One of the top #3
reinforcing bars was also instrumented for beams in groups I and II. Regardless of the strengthening
scheme, each individual composite laminate was instrumented using one gage at each section. Concrete
strain gages were placed on both sides of all beams approximately 1.5 in. from the top surface, except for
specimens A-LT1 and A-LT2 where the concrete strain gages were positioned on the top surface of the
beams. The locations of the instrumented sections for the 8-in. by 14-in. beams and the 8-in. by 16-in.
beams are shown in Figures D.1 and D.2, respectively. The position of the strain gages in each of the
materials at each instrumented section is indicated in the corresponding strain plots.
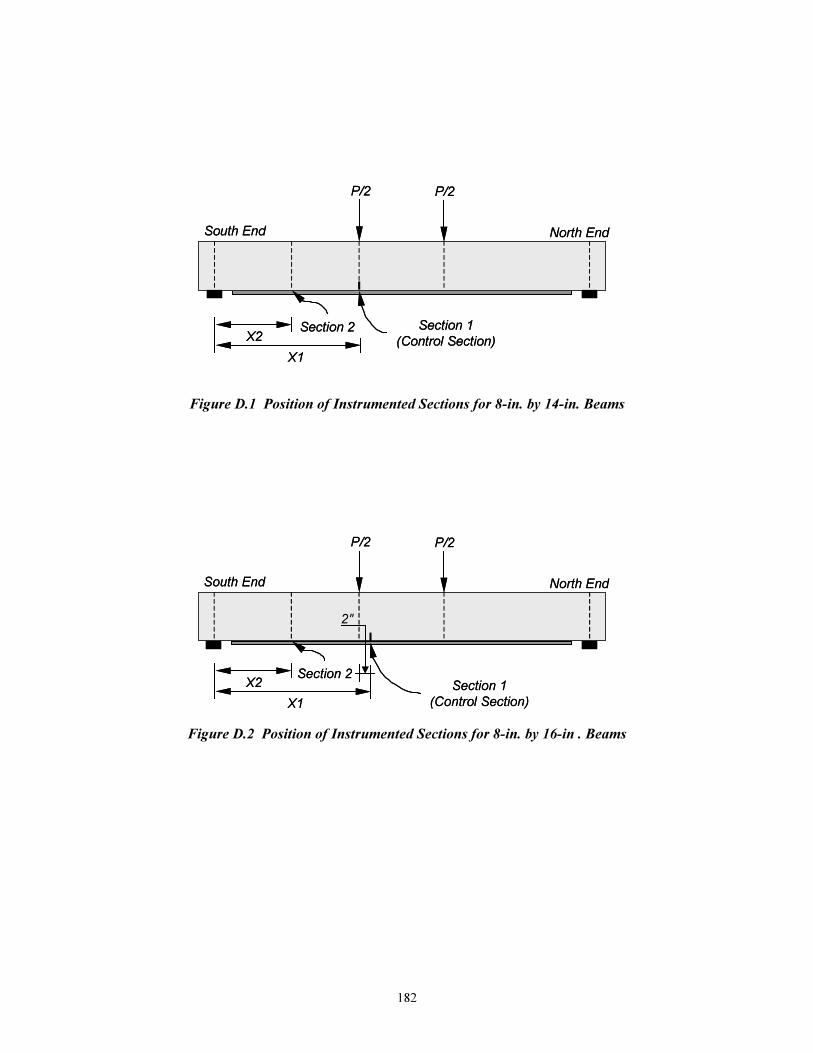
182
P/2 P/2
X1
Section 1
(Control Section)X2
South End North End
Section 2
P/2 P/2
X1
Section 1
(Control Section)X2
South End North End
Section 2
Figure D.1 Position of Instrumented Sections for 8-in. by 14-in. Beams
P/2 P/2
X1
Section 1
(Control Section)
X2
South End North End
2"
Section 2
P/2 P/2
X1
Section 1
(Control Section)
X2
South End North End
2"
Section 2
Figure D.2 Position of Instrumented Sections for 8-in. by 16-in . Beams
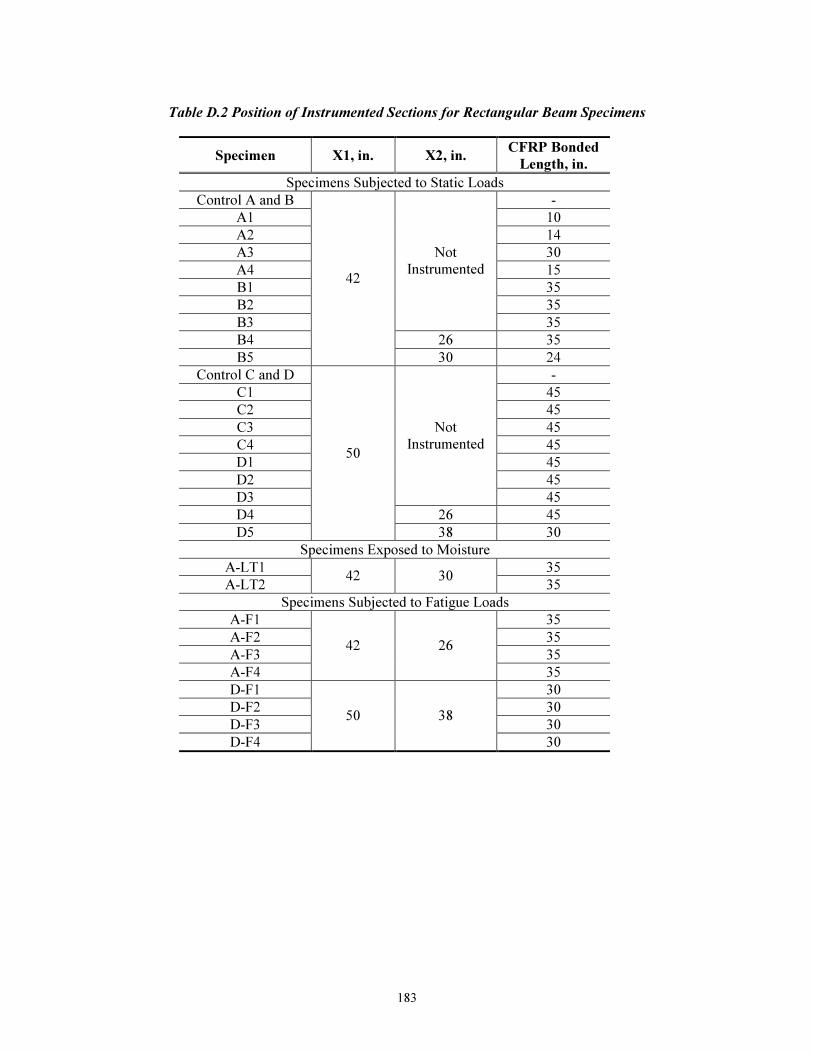
183
Table D.2 Position of Instrumented Sections for Rectangular Beam Specimens
Specimen X1, in. X2, in. CFRP Bonded
Length, in.
Specimens Subjected to Static Loads
Control A and B -
A1 10
A2 14
A3 30
A4 15
B1 35
B2 35
B3
Not
Instrumented
35
B4 26 35
B5
42
30 24
Control C and D -
C1 45
C2 45
C3 45
C4 45
D1 45
D2 45
D3
Not
Instrumented
45
D4 26 45
D5
50
38 30
Specimens Exposed to Moisture
A-LT1 35
A-LT2 42 30
35
Specimens Subjected to Fatigue Loads
A-F1 35
A-F2 35
A-F3 35
A-F4
42 26
35
D-F1 30
D-F2 30
D-F3 30
D-F4
50 38
30

184
The individual strain gage readings and the average readings are presented in this appendix. The average
strain gage readings were used in all calculations. Only the outputs from the instruments as were
recorded during the tests without any modification are presented in this appendix. In some cases,
instruments either malfunctioned or debonded during the tests. Instrument malfunction is indicated in the
individual strain plots.
The strains measured in the specimens that were tested monotonically to failure are presented in
Figures D.3 to D.30. Figures D.3 to D.14 show load vs. strain plots for the instrumented sections in
specimen groups A and B. Figures D.15 to D.26 show load vs. strain plots of the instrumented sections in
beam groups C and D. Figures D.27 to D.30 show load vs. strain plots for the beams exposed to moisture
cycles (specimens A-LT1 and A-LT2).
The strains measured in the specimens subjected to fatigue loads are presented in Figures D.31 to D.46.
The load vs. strain plots for specimens A-F1 to A-F4 are presented in Figures D.31 to D.38. Finally, load
vs. strain plots for specimens D-F1 to D-F4 are presented in Figures D.39 to D.46.

185
(a) #5 Reinforcing Bar Strains
0
10
20
30
40
0 0.01 0.02 0.03 0.04
Strain
Lo
ad
, kip
East Bar
West Bar
Average
(b) #3 Reinforcing Bar Strains
0
10
20
30
40
-0.0015 -0.001 -0.0005 0 0.0005 0.001 0.0015
Strain
Lo
ad
, k
ip
(c) Concrete Strains
0
10
20
30
40
-0.0015 -0.001 -0.0005 0 0.0005 0.001 0.0015
Strain
Lo
ad
, kip
East Side
West Side
Average
(d) Position of Strain Gages
1.5 in
SG
CG
SG
CG – Concrete Gages
SG – Steel Gages
1.5 in
SG
CG
SG
CG – Concrete Gages
SG – Steel Gages
Figure D.3 Measured Strains in Control Specimen A & B (Section 1)

186
(a) #5 Reinforcing Bar Strains
0
10
20
30
40
0 0.005 0.01 0.015 0.02 0.025
Strain
Lo
ad
, kip
East Bar
West Bar
Average
(b) #3 Reinforcing Bar Strains
0
10
20
30
40
-0.0015 -0.001 -0.0005 0 0.0005 0.001 0.0015
Strain
Lo
ad
, kip
(c) CFRP Strains
0
10
20
30
40
0 0.005 0.01 0.015 0.02 0.025
Strain
Lo
ad
, kip
(d) Concrete Strains
0
10
20
30
40
-0.0015 -0.001 -0.0005 0 0.0005 0.001 0.0015
Strain
Lo
ad
, kip
East Side
West Side
Average
(e) Position of Strain Gages
1.5 in
SG
CG
CF
SG
CG – Concrete Gages
SG – Steel Gages
CF – CFRP Gages
1.5 in
SG
CG
CF
SG
CG – Concrete Gages
SG – Steel Gages
CF – CFRP Gages
CG – Concrete Gages
SG – Steel Gages
CF – CFRP Gages
Figure D.4 Measured Strains in Specimen A-1 (Section 1)
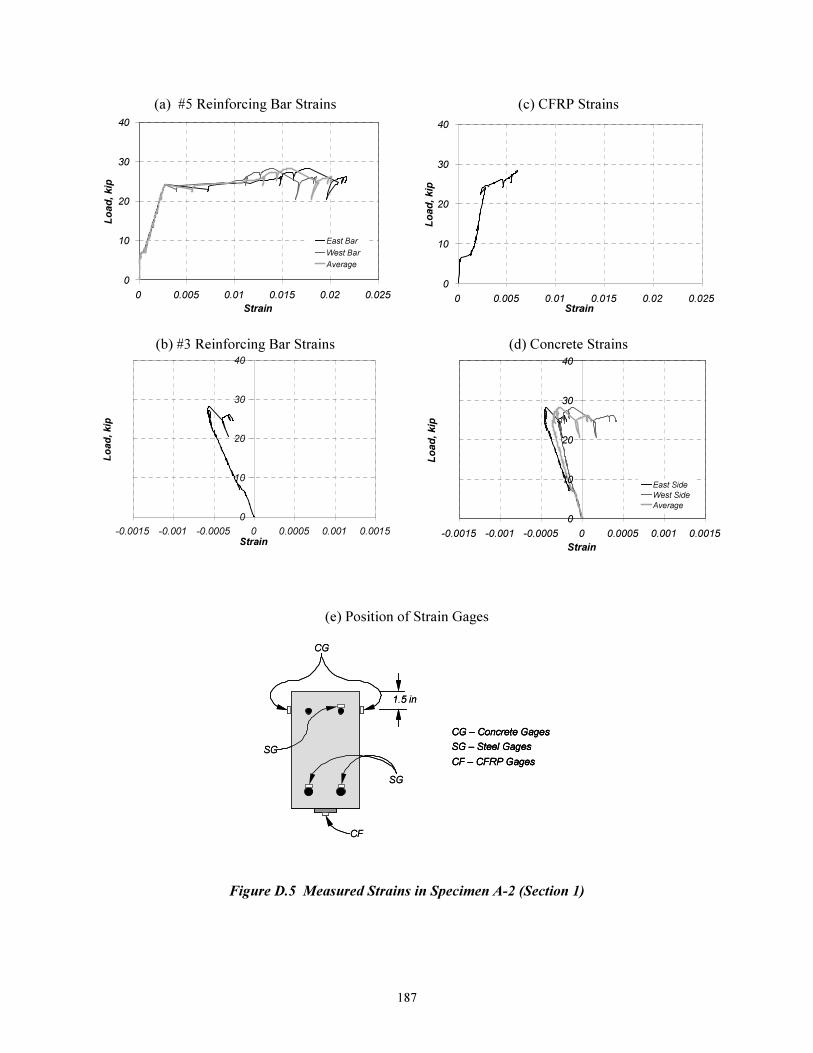
187
(a) #5 Reinforcing Bar Strains
0
10
20
30
40
0 0.005 0.01 0.015 0.02 0.025
Strain
Lo
ad
, kip
East Bar
West Bar
Average
(b) #3 Reinforcing Bar Strains
0
10
20
30
40
-0.0015 -0.001 -0.0005 0 0.0005 0.001 0.0015
Strain
Lo
ad
, kip
(c) CFRP Strains
0
10
20
30
40
0 0.005 0.01 0.015 0.02 0.025
Strain
Lo
ad
, kip
(d) Concrete Strains
0
10
20
30
40
-0.0015 -0.001 -0.0005 0 0.0005 0.001 0.0015
Strain
Lo
ad
, kip
East Side
West Side
Average
(e) Position of Strain Gages
1.5 in
SG
CG
CF
SG
CG – Concrete Gages
SG – Steel Gages
CF – CFRP Gages
1.5 in
SG
CG
CF
SG
CG – Concrete Gages
SG – Steel Gages
CF – CFRP Gages
CG – Concrete Gages
SG – Steel Gages
CF – CFRP Gages
Figure D.5 Measured Strains in Specimen A-2 (Section 1)
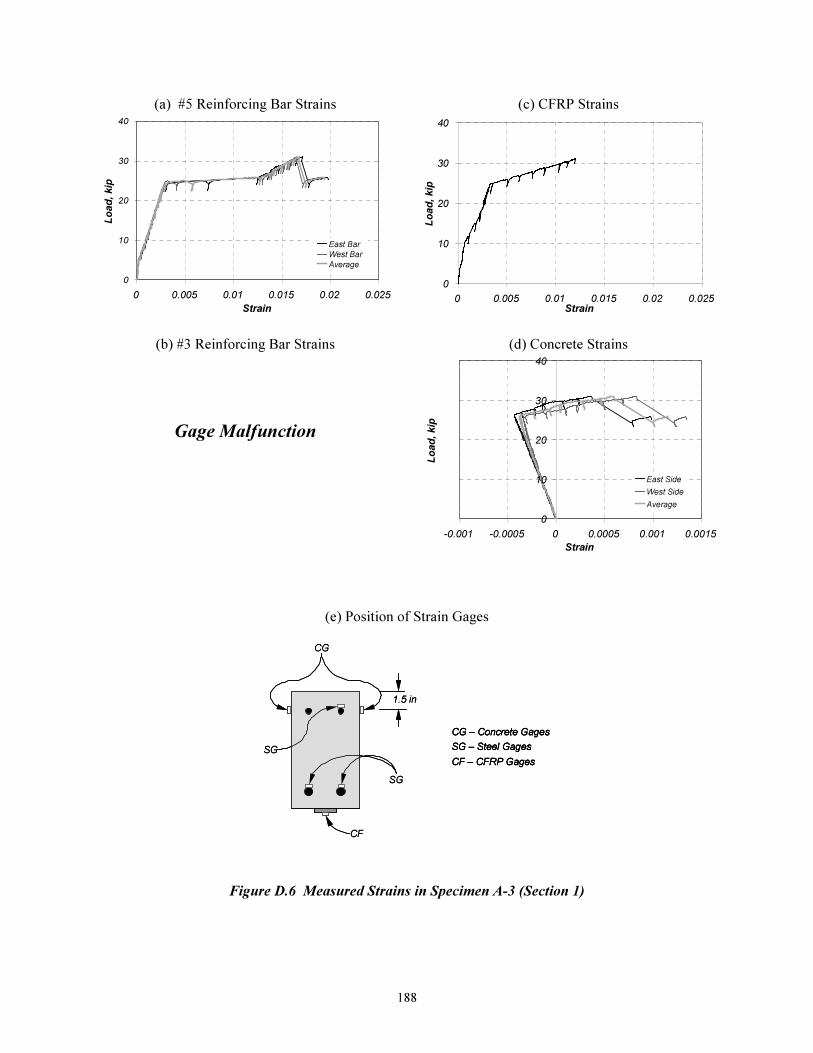
188
(a) #5 Reinforcing Bar Strains
0
10
20
30
40
0 0.005 0.01 0.015 0.02 0.025
Strain
Lo
ad
, kip
East Bar
West Bar
Average
(b) #3 Reinforcing Bar Strains
Gage Malfunction
(c) CFRP Strains
0
10
20
30
40
0 0.005 0.01 0.015 0.02 0.025
Strain
Lo
ad
, kip
(d) Concrete Strains
0
10
20
30
40
-0.001 -0.0005 0 0.0005 0.001 0.0015
Strain
Lo
ad
, kip
East Side
West Side
Average
(e) Position of Strain Gages
1.5 in
SG
CG
CF
SG
CG – Concrete Gages
SG – Steel Gages
CF – CFRP Gages
1.5 in
SG
CG
CF
SG
CG – Concrete Gages
SG – Steel Gages
CF – CFRP Gages
CG – Concrete Gages
SG – Steel Gages
CF – CFRP Gages
Figure D.6 Measured Strains in Specimen A-3 (Section 1)
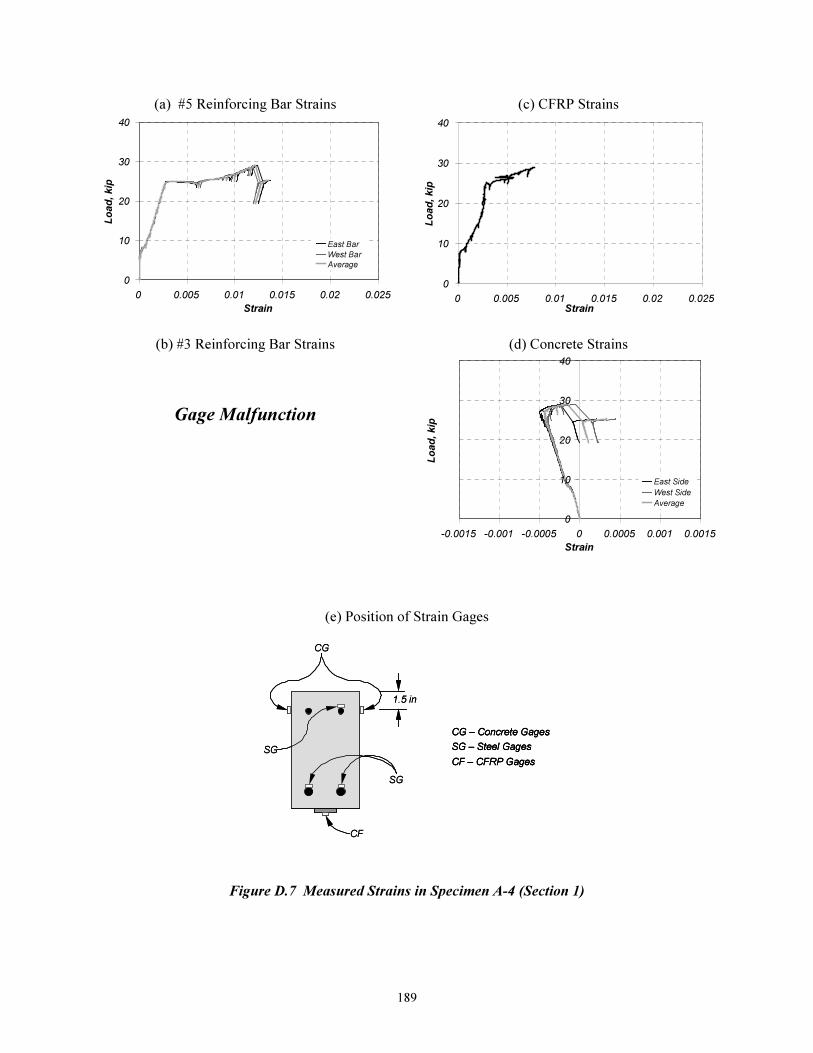
189
(a) #5 Reinforcing Bar Strains
0
10
20
30
40
0 0.005 0.01 0.015 0.02 0.025
Strain
Lo
ad
, kip
East Bar
West Bar
Average
(b) #3 Reinforcing Bar Strains
Gage Malfunction
(c) CFRP Strains
0
10
20
30
40
0 0.005 0.01 0.015 0.02 0.025
Strain
Lo
ad
, kip
(d) Concrete Strains
0
10
20
30
40
-0.0015 -0.001 -0.0005 0 0.0005 0.001 0.0015
Strain
Lo
ad
, kip
East Side
West Side
Average
(e) Position of Strain Gages
1.5 in
SG
CG
CF
SG
CG – Concrete Gages
SG – Steel Gages
CF – CFRP Gages
1.5 in
SG
CG
CF
SG
CG – Concrete Gages
SG – Steel Gages
CF – CFRP Gages
CG – Concrete Gages
SG – Steel Gages
CF – CFRP Gages
Figure D.7 Measured Strains in Specimen A-4 (Section 1)
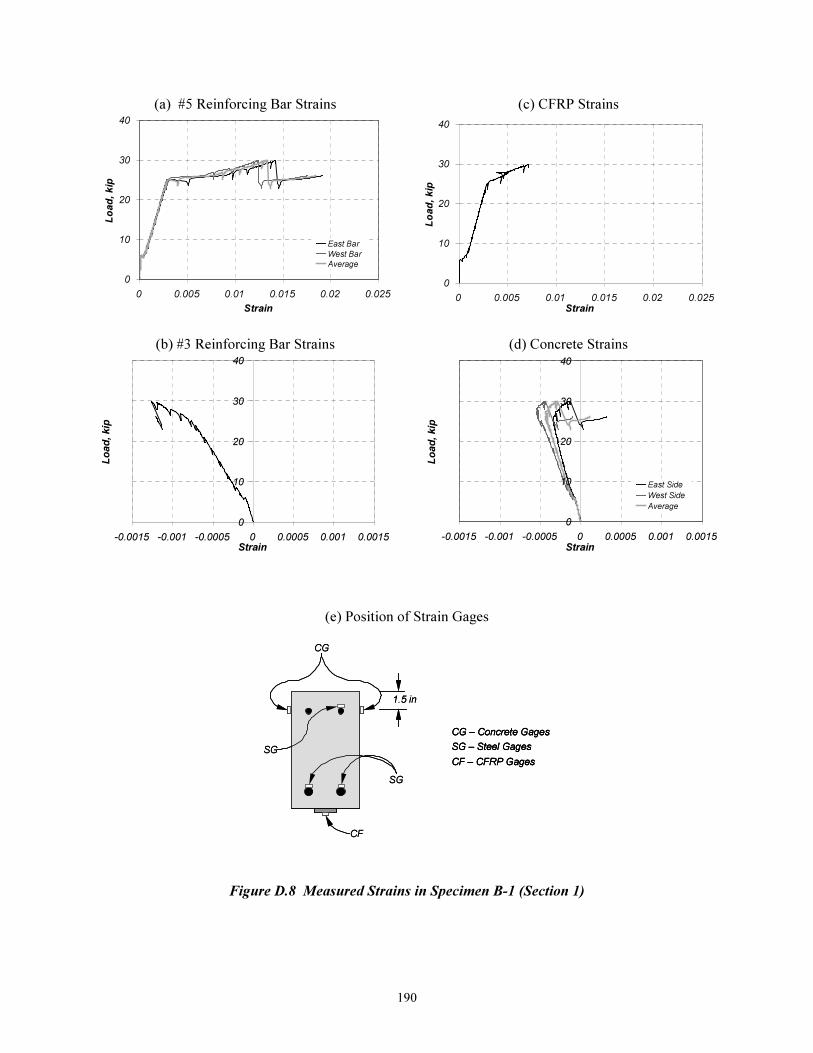
190
(a) #5 Reinforcing Bar Strains
0
10
20
30
40
0 0.005 0.01 0.015 0.02 0.025
Strain
Lo
ad
, kip
East Bar
West Bar
Average
(b) #3 Reinforcing Bar Strains
0
10
20
30
40
-0.0015 -0.001 -0.0005 0 0.0005 0.001 0.0015
Strain
Lo
ad
, kip
(c) CFRP Strains
0
10
20
30
40
0 0.005 0.01 0.015 0.02 0.025
Strain
Lo
ad
, kip
(d) Concrete Strains
0
10
20
30
40
-0.0015 -0.001 -0.0005 0 0.0005 0.001 0.0015
Strain
Lo
ad
, kip
East Side
West Side
Average
(e) Position of Strain Gages
1.5 in
SG
CG
CF
SG
CG – Concrete Gages
SG – Steel Gages
CF – CFRP Gages
1.5 in
SG
CG
CF
SG
CG – Concrete Gages
SG – Steel Gages
CF – CFRP Gages
CG – Concrete Gages
SG – Steel Gages
CF – CFRP Gages
Figure D.8 Measured Strains in Specimen B-1 (Section 1)
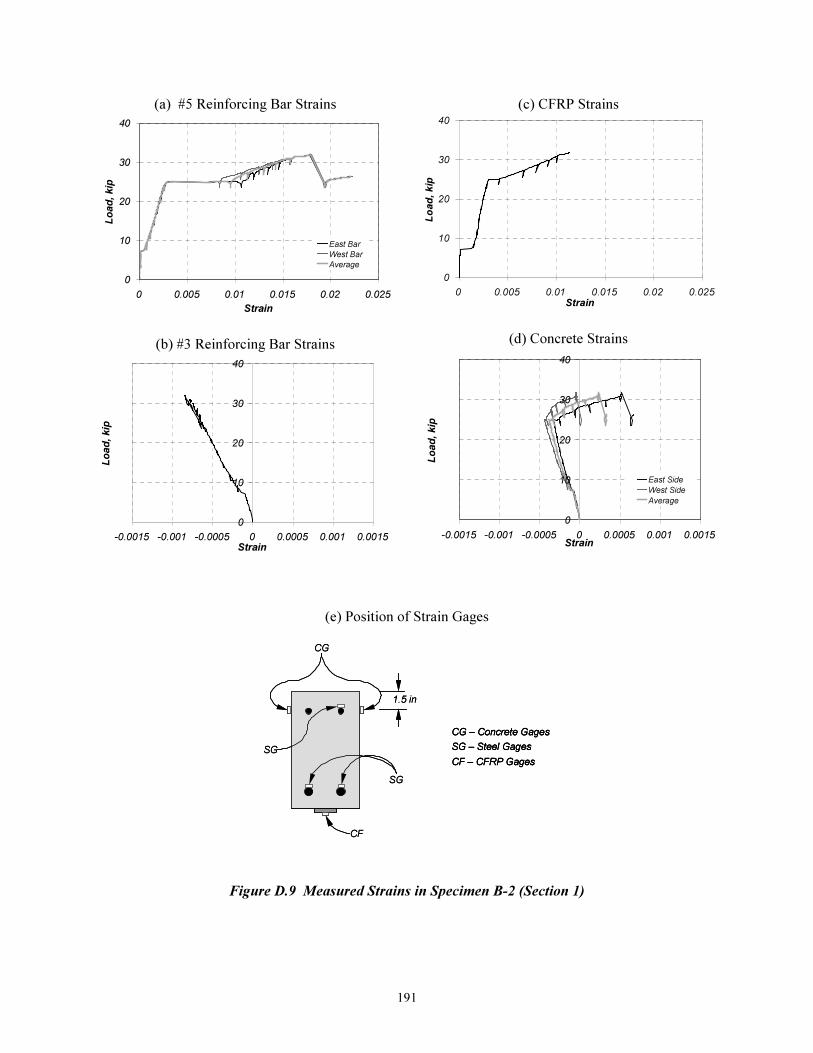
191
(a) #5 Reinforcing Bar Strains
0
10
20
30
40
0 0.005 0.01 0.015 0.02 0.025
Strain
Lo
ad
, kip
East Bar
West Bar
Average
(b) #3 Reinforcing Bar Strains
0
10
20
30
40
-0.0015 -0.001 -0.0005 0 0.0005 0.001 0.0015
Strain
Lo
ad
, kip
(c) CFRP Strains
0
10
20
30
40
0 0.005 0.01 0.015 0.02 0.025
Strain
Lo
ad
, kip
(d) Concrete Strains
0
10
20
30
40
-0.0015 -0.001 -0.0005 0 0.0005 0.001 0.0015Strain
Lo
ad
, kip
East Side
West Side
Average
(e) Position of Strain Gages
1.5 in
SG
CG
CF
SG
CG – Concrete Gages
SG – Steel Gages
CF – CFRP Gages
1.5 in
SG
CG
CF
SG
CG – Concrete Gages
SG – Steel Gages
CF – CFRP Gages
CG – Concrete Gages
SG – Steel Gages
CF – CFRP Gages
Figure D.9 Measured Strains in Specimen B-2 (Section 1)

192
(a) #5 Reinforcing Bar Strains
0
10
20
30
40
0 0.005 0.01 0.015 0.02 0.025
Strain
Lo
ad
, kip
East Bar
West Bar
Average
(b) #3 Reinforcing Bar Strains
0
10
20
30
40
-0.0015 -0.001 -0.0005 0 0.0005 0.001 0.0015
Strain
Lo
ad
, kip
(c) CFRP Strains
0
10
20
30
40
0 0.005 0.01 0.015 0.02 0.025
Strain
Lo
ad
, kip
East CFRP
West CFRP
Average
(d) Concrete Strains
0
10
20
30
40
-0.0015 -0.001 -0.0005 0 0.0005 0.001 0.0015
Strain
Lo
ad
, kip
East Side
West Side
Average
(e) Position of Strain Gages
CG – Concrete Gages
SG – Steel Gages
CF – CFRP Gages
1.5 in
SG
CG
CF
SG
CG – Concrete Gages
SG – Steel Gages
CF – CFRP Gages
CG – Concrete Gages
SG – Steel Gages
CF – CFRP Gages
1.5 in
SG
CG
CF
SG
Figure D.10 Measured Strains in Specimen B-3 (Section 1)
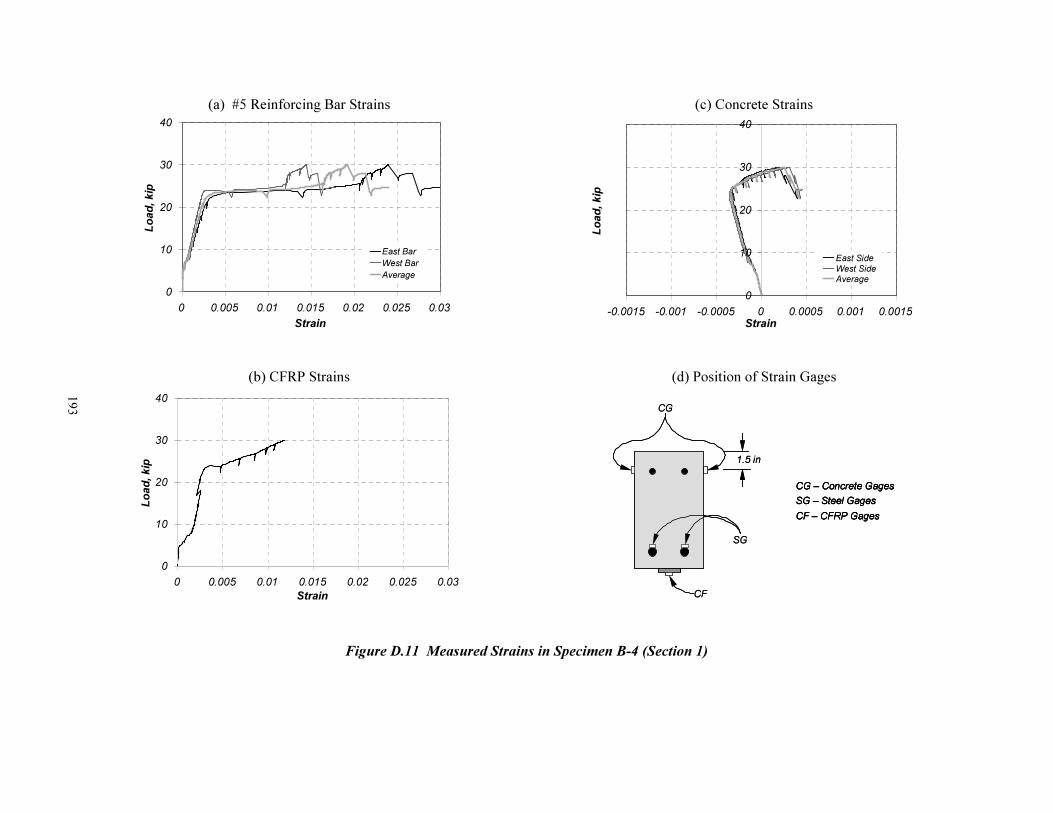
193
(a) #5 Reinforcing Bar Strains
0
10
20
30
40
0 0.005 0.01 0.015 0.02 0.025 0.03
Strain
Lo
ad
, k
ip
East Bar
West Bar
Average
(b) CFRP Strains
0
10
20
30
40
0 0.005 0.01 0.015 0.02 0.025 0.03
Strain
Lo
ad
, k
ip
(c) Concrete Strains
0
10
20
30
40
-0.0015 -0.001 -0.0005 0 0.0005 0.001 0.0015
Strain
Lo
ad
, k
ip
East Side
West SideAverage
(d) Position of Strain Gages
1.5 in
SG
CG
CF
CG – Concrete Gages
SG – Steel Gages
CF – CFRP Gages
1.5 in
SG
CG
CF
CG – Concrete Gages
SG – Steel Gages
CF – CFRP Gages
CG – Concrete Gages
SG – Steel Gages
CF – CFRP Gages
Figure D.11 Measured Strains in Specimen B-4 (Section 1)
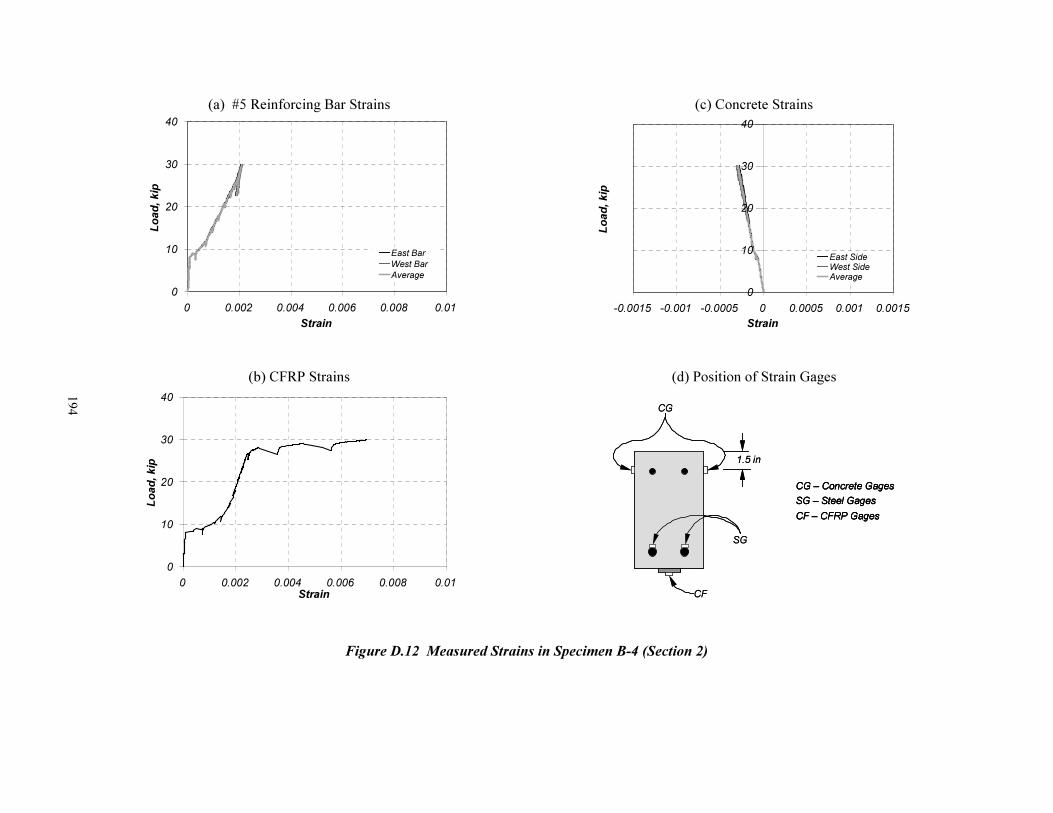
194
(a) #5 Reinforcing Bar Strains
0
10
20
30
40
0 0.002 0.004 0.006 0.008 0.01
Strain
Lo
ad
, k
ip
East Bar
West Bar
Average
(b) CFRP Strains
0
10
20
30
40
0 0.002 0.004 0.006 0.008 0.01
Strain
Lo
ad
, kip
(c) Concrete Strains
0
10
20
30
40
-0.0015 -0.001 -0.0005 0 0.0005 0.001 0.0015
Strain
Lo
ad
, k
ip
East SideWest SideAverage
(d) Position of Strain Gages
1.5 in
SG
CG
CF
CG – Concrete Gages
SG – Steel Gages
CF – CFRP Gages
1.5 in
SG
CG
CF
CG – Concrete Gages
SG – Steel Gages
CF – CFRP Gages
CG – Concrete Gages
SG – Steel Gages
CF – CFRP Gages
Figure D.12 Measured Strains in Specimen B-4 (Section 2)
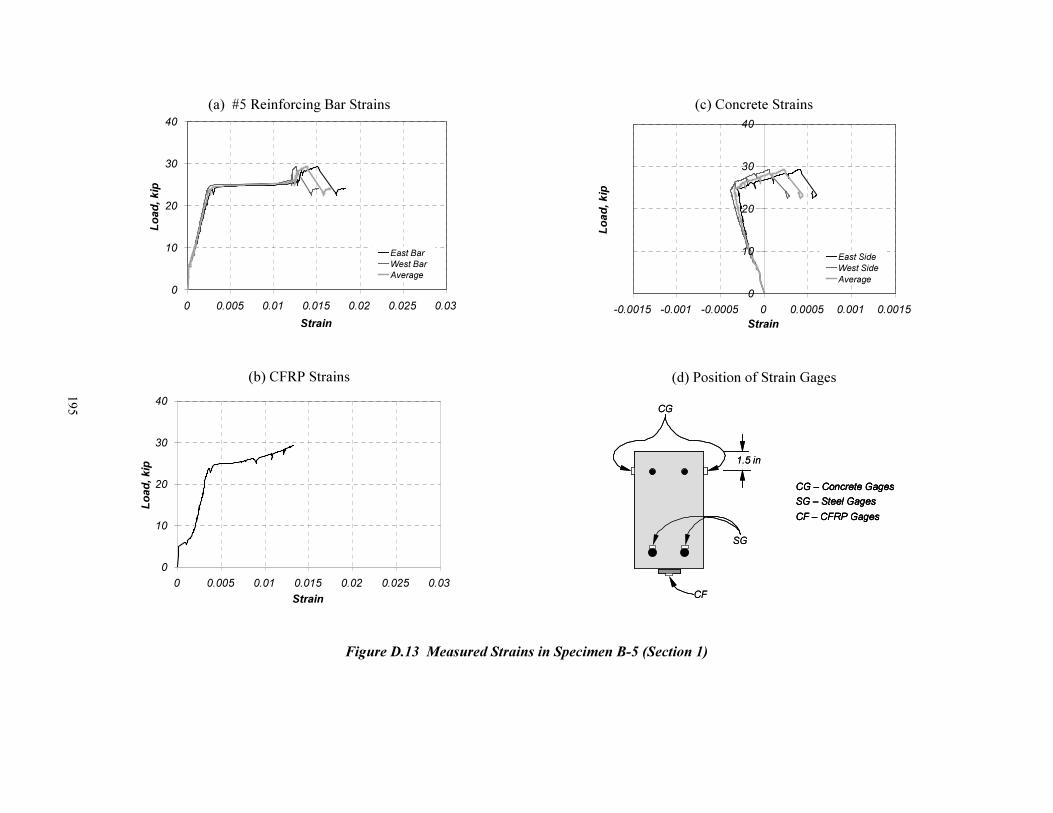
195
(a) #5 Reinforcing Bar Strains
0
10
20
30
40
0 0.005 0.01 0.015 0.02 0.025 0.03
Strain
Lo
ad
, k
ip
East Bar
West Bar
Average
(b) CFRP Strains
0
10
20
30
40
0 0.005 0.01 0.015 0.02 0.025 0.03
Strain
Lo
ad
, kip
(c) Concrete Strains
0
10
20
30
40
-0.0015 -0.001 -0.0005 0 0.0005 0.001 0.0015
Strain
Lo
ad
, k
ip
East Side
West Side
Average
(d) Position of Strain Gages
1.5 in
SG
CG
CF
CG – Concrete Gages
SG – Steel Gages
CF – CFRP Gages
1.5 in
SG
CG
CF
CG – Concrete Gages
SG – Steel Gages
CF – CFRP Gages
CG – Concrete Gages
SG – Steel Gages
CF – CFRP Gages
Figure D.13 Measured Strains in Specimen B-5 (Section 1)

196
(a) #5 Reinforcing Bar Strains
0
10
20
30
40
0 0.002 0.004 0.006 0.008 0.01
Strain
Lo
ad
, k
ip
East Bar
West Bar
Average
(b) CFRP Strains
0
10
20
30
40
0 0.002 0.004 0.006 0.008 0.01
Strain
Lo
ad
, kip
(c) Concrete Strains
0
10
20
30
40
-0.0015 -0.001 -0.0005 0 0.0005 0.001 0.0015
Strain
Lo
ad
, k
ip
East Side
West Side
Average
(d) Position of Strain Gages
1.5 in
SG
CG
CF
CG – Concrete Gages
SG – Steel Gages
CF – CFRP Gages
1.5 in
SG
CG
CF
CG – Concrete Gages
SG – Steel Gages
CF – CFRP Gages
CG – Concrete Gages
SG – Steel Gages
CF – CFRP Gages
Figure D.14 Measured Strains in Specimen B-5 (Section 2)

197
(a) #5 Reinforcing Bar Strains
0
10
20
30
40
0 0.005 0.01 0.015 0.02 0.025 0.03
Strain
Lo
ad
, k
ip
East Bar
West Bar
Average
(b) #3 Reinforcing Bar Strains
0
10
20
30
40
-0.0015 -0.001 -0.0005 0 0.0005 0.001 0.0015
Strain
Lo
ad
, kip
(c) Concrete Strains
0
10
20
30
40
-0.0015 -0.001 -0.0005 0 0.0005 0.001 0.0015
Strain
Lo
ad
, k
ip
East Side
West Side
Average
(d) Position of Strain Gages
1.5 in
SG
CG
SG
CG – Concrete Gages
SG – Steel Gages
1.5 in
SG
CG
SG
CG – Concrete Gages
SG – Steel Gages
Figure D.15 Measured Strains in Control Specimen C & D (Section 1)

198
(a) #5 Reinforcing Bar Strains
0
10
20
30
40
0 0.005 0.01 0.015 0.02 0.025
Strain
Lo
ad
, kip
East Bar
West Bar
Average
(b) #3 Reinforcing Bar Strains
0
10
20
30
40
-0.0015 -0.001 -0.0005 0 0.0005 0.001 0.0015
Strain
Lo
ad
, kip
(c) CFRP Strains B2 2PFY 45
0
10
20
30
40
0 0.005 0.01 0.015 0.02 0.025
Strain
Lo
ad
, kip
(d) Concrete Strains
0
10
20
30
40
-0.0015 -0.001 -0.0005 0 0.0005 0.001 0.0015
Strain
Lo
ad
, kip
East Side
West Side
Average
(e) Position of Strain Gages
1.5 in
SG
CG
CF
SG
CG – Concrete Gages
SG – Steel Gages
CF – CFRP Gages
1.5 in
SG
CG
CF
SG
CG – Concrete Gages
SG – Steel Gages
CF – CFRP Gages
CG – Concrete Gages
SG – Steel Gages
CF – CFRP Gages
Figure D.16 Measured Strains in Specimen C-1 (Section 1)

199
(a) #5 Reinforcing Bar Strains
0
10
20
30
40
0 0.005 0.01 0.015 0.02 0.025
Strain
Lo
ad
, kip
East Bar
West Bar
Average
(b) #3 Reinforcing Bar Strains
0
10
20
30
40
-0.0015 -0.001 -0.0005 0 0.0005 0.001 0.0015
Strain
Lo
ad
, kip
(c) CFRP Strains
0
10
20
30
40
0 0.005 0.01 0.015 0.02 0.025
Strain
Lo
ad
, kip
(d) Concrete Strains
0
10
20
30
40
-0.0015 -0.001 -0.0005 0 0.0005 0.001 0.0015
Strain
Lo
ad
, kip
East Side
West Side
Average
(e) Position of Strain Gages
1.5 in
SG
CG
CF
SG
CG – Concrete Gages
SG – Steel Gages
CF – CFRP Gages
1.5 in
SG
CG
CF
SG
CG – Concrete Gages
SG – Steel Gages
CF – CFRP Gages
CG – Concrete Gages
SG – Steel Gages
CF – CFRP Gages
Figure D.17 Measured Strains in Specimen C-2 (Section 1)

200
(a) #5 Reinforcing Bar Strains
0
10
20
30
40
0 0.005 0.01 0.015 0.02 0.025
Strain
Lo
ad
, kip
East Bar
West Bar
Average
(b) #3 Reinforcing Bar Strains
0
10
20
30
40
-0.0015 -0.001 -0.0005 0 0.0005 0.001 0.0015
Strain
Lo
ad
, kip
(c) CFRP Strains
0
10
20
30
40
0 0.005 0.01 0.015 0.02 0.025
Strain
Lo
ad
, kip
(d) Concrete Strains
0
10
20
30
40
-0.0015 -0.001 -0.0005 0 0.0005 0.001 0.0015
Strain
Lo
ad
, kip
East Side
West Side
Average
(e) Position of Strain Gages
1.5 in
SG
CG
CF
SG
CG – Concrete Gages
SG – Steel Gages
CF – CFRP Gages
1.5 in
SG
CG
CF
SG
CG – Concrete Gages
SG – Steel Gages
CF – CFRP Gages
CG – Concrete Gages
SG – Steel Gages
CF – CFRP Gages
Figure D.18 Measured Strains in Specimen C-3 (Section 1)
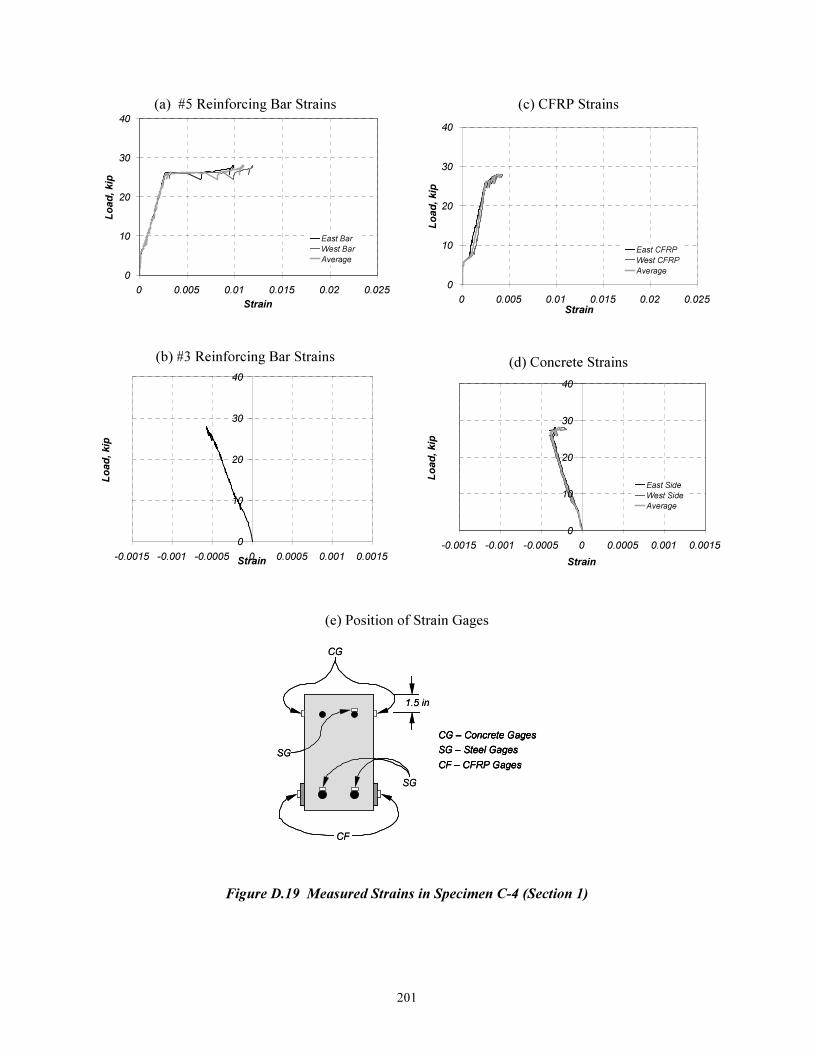
201
(a) #5 Reinforcing Bar Strains
0
10
20
30
40
0 0.005 0.01 0.015 0.02 0.025
Strain
Lo
ad
, kip
East Bar
West Bar
Average
(b) #3 Reinforcing Bar Strains
0
10
20
30
40
-0.0015 -0.001 -0.0005 0 0.0005 0.001 0.0015Strain
Lo
ad
, kip
(c) CFRP Strains
0
10
20
30
40
0 0.005 0.01 0.015 0.02 0.025
Strain
Lo
ad
, kip
East CFRP
West CFRP
Average
(d) Concrete Strains
0
10
20
30
40
-0.0015 -0.001 -0.0005 0 0.0005 0.001 0.0015
Strain
Lo
ad
, kip
East Side
West Side
Average
(e) Position of Strain Gages
CG – Concrete Gages
SG – Steel Gages
CF – CFRP Gages
1.5 in
SG
CG
CF
SG
CG – Concrete Gages
SG – Steel Gages
CF – CFRP Gages
CG – Concrete Gages
SG – Steel Gages
CF – CFRP Gages
1.5 in
SG
CG
CF
SG
Figure D.19 Measured Strains in Specimen C-4 (Section 1)

202
(a) #5 Reinforcing Bar Strains
0
10
20
30
40
50
0 0.005 0.01 0.015 0.02 0.025
Strain
Lo
ad
, kip
East Bar
West Bar
Average
(b) #3 Reinforcing Bar Strains
0
10
20
30
40
50
-0.0015 -0.001 -0.0005 0 0.0005 0.001 0.0015
Strain
Lo
ad
, kip
(c) CFRP Strains
0
10
20
30
40
50
0 0.005 0.01 0.015 0.02 0.025
Strain
Lo
ad
, kip
(d) Concrete Strains
0
10
20
30
40
50
-0.0015 -0.001 -0.0005 0 0.0005 0.001 0.0015
Strain
Lo
ad
, kip
East Side
West Side
Average
(e) Position of Strain Gages
1.5 in
SG
CG
CF
SG
CG – Concrete Gages
SG – Steel Gages
CF – CFRP Gages
1.5 in
SG
CG
CF
SG
CG – Concrete Gages
SG – Steel Gages
CF – CFRP Gages
CG – Concrete Gages
SG – Steel Gages
CF – CFRP Gages
Figure D.20 Measured Strains in Specimen D-1 (Section 1)

203
(a) #5 Reinforcing Bar Strains
0
10
20
30
40
50
0 0.005 0.01 0.015 0.02 0.025
Strain
Lo
ad
, kip
East Bar
West Bar
Average
(b) #3 Reinforcing Bar Strains
0
10
20
30
40
50
-0.0015 -0.001 -0.0005 0 0.0005 0.001 0.0015
Strain
Lo
ad
, kip
(c) CFRP Strains
0
10
20
30
40
50
0 0.005 0.01 0.015 0.02 0.025
Strain
Lo
ad
, kip
(d) Concrete Strains
0
10
20
30
40
50
-0.0015 -0.001 -0.0005 0 0.0005 0.001 0.0015
Strain
Lo
ad
, kip
East Side
West Side
Average
(e) Position of Strain Gages
1.5 in
SG
CG
CF
SG
CG – Concrete Gages
SG – Steel Gages
CF – CFRP Gages
1.5 in
SG
CG
CF
SG
CG – Concrete Gages
SG – Steel Gages
CF – CFRP Gages
CG – Concrete Gages
SG – Steel Gages
CF – CFRP Gages
Figure D.21 Measured Strains in Specimen D-2 (Section 1)
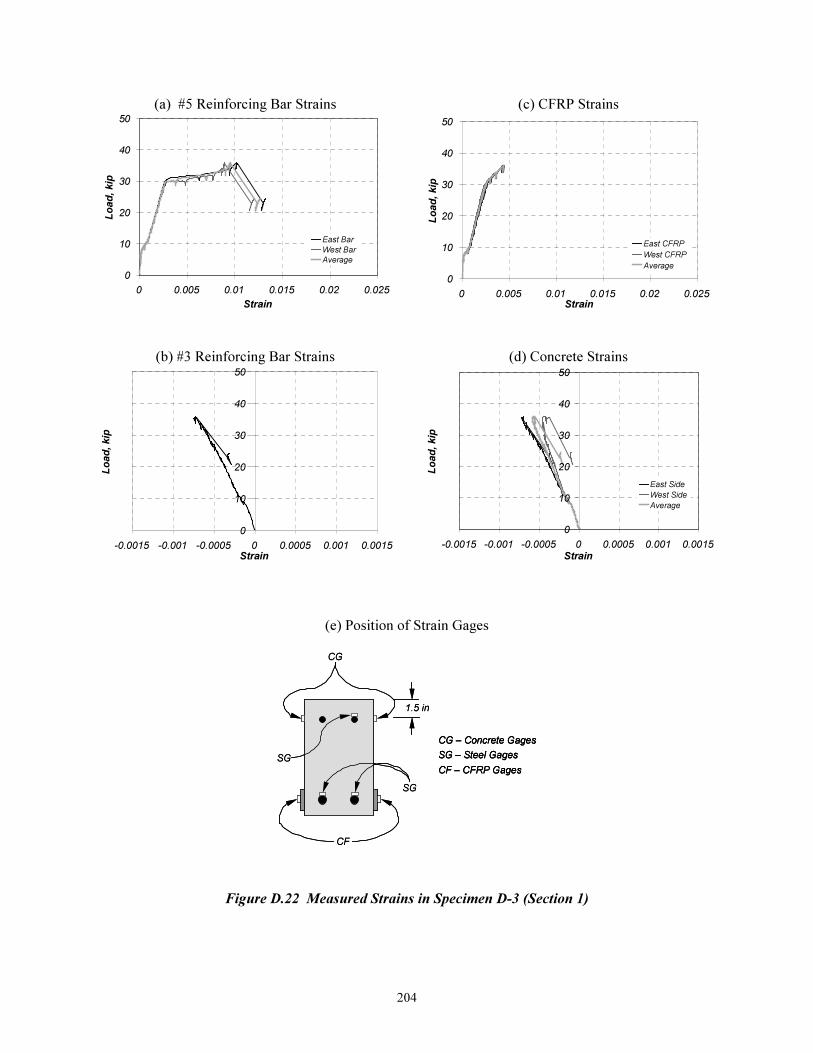
204
(a) #5 Reinforcing Bar Strains
0
10
20
30
40
50
0 0.005 0.01 0.015 0.02 0.025
Strain
Lo
ad
, kip
East Bar
West Bar
Average
(b) #3 Reinforcing Bar Strains
0
10
20
30
40
50
-0.0015 -0.001 -0.0005 0 0.0005 0.001 0.0015
Strain
Lo
ad
, kip
(c) CFRP Strains
0
10
20
30
40
50
0 0.005 0.01 0.015 0.02 0.025
Strain
Lo
ad
, kip
East CFRP
West CFRP
Average
(d) Concrete Strains
0
10
20
30
40
50
-0.0015 -0.001 -0.0005 0 0.0005 0.001 0.0015
Strain
Lo
ad
, kip
East Side
West Side
Average
(e) Position of Strain Gages
CG – Concrete Gages
SG – Steel Gages
CF – CFRP Gages
1.5 in
SG
CG
CF
SG
CG – Concrete Gages
SG – Steel Gages
CF – CFRP Gages
CG – Concrete Gages
SG – Steel Gages
CF – CFRP Gages
1.5 in
SG
CG
CF
SG
Figure D.22 Measured Strains in Specimen D-3 (Section 1)

205
(a) #5 Reinforcing Bar Strains
0
10
20
30
40
50
0 0.005 0.01 0.015 0.02 0.025
Strain
Lo
ad
, k
ip
East Bar
West Bar
Average
(b) CFRP Strains
0
10
20
30
40
50
0 0.005 0.01 0.015 0.02 0.025
Strain
Lo
ad
, k
ip
East CFRP
West CFRP
Average
(c) Concrete Strains
0
10
20
30
40
50
-0.0015 -0.001 -0.0005 0 0.0005 0.001 0.0015
Strain
Lo
ad
, k
ip
East Side
West Side
Average
(d) Position of Strain Gages
CG – Concrete Gages
SG – Steel Gages
CF – CFRP Gages
1.5 in
SG
CG
CF
CG – Concrete Gages
SG – Steel Gages
CF – CFRP Gages
CG – Concrete Gages
SG – Steel Gages
CF – CFRP Gages
1.5 in
SG
CG
CF
Figure D.23 Measured Strains in Specimen D-4 (Section 1)
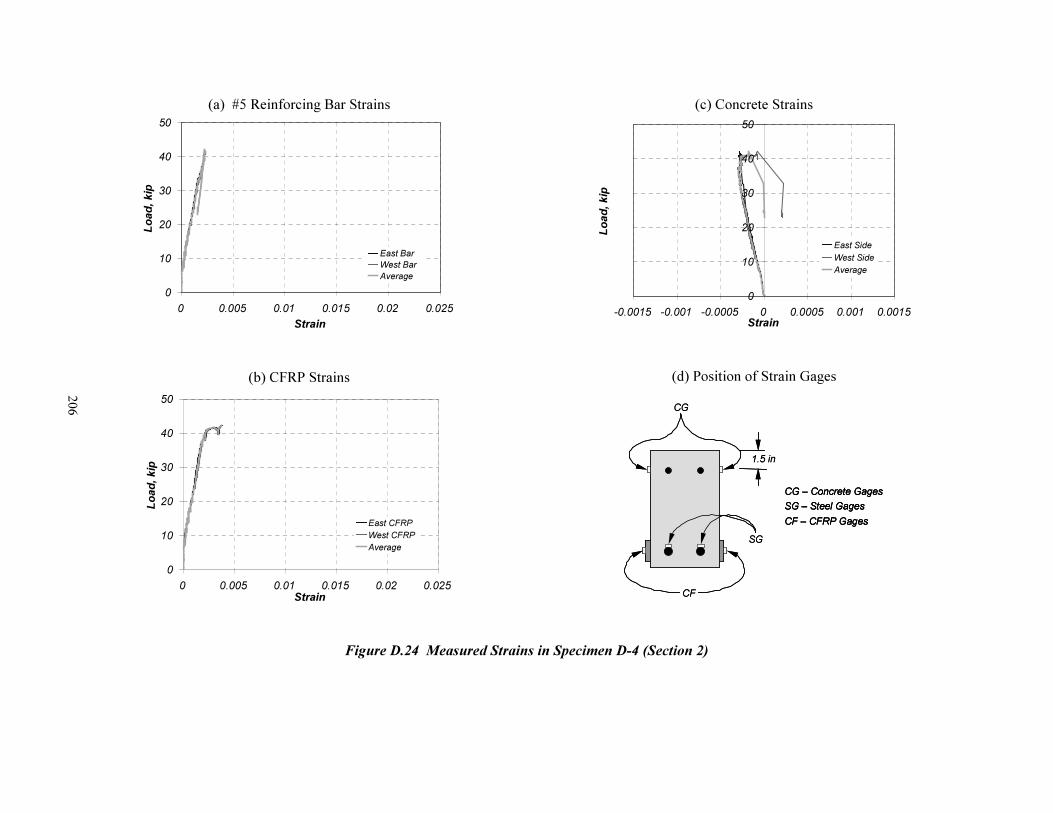
206
(a) #5 Reinforcing Bar Strains
0
10
20
30
40
50
0 0.005 0.01 0.015 0.02 0.025
Strain
Lo
ad
, k
ip
East Bar
West Bar
Average
(b) CFRP Strains
0
10
20
30
40
50
0 0.005 0.01 0.015 0.02 0.025
Strain
Lo
ad
, k
ip
East CFRP
West CFRP
Average
(c) Concrete Strains
0
10
20
30
40
50
-0.0015 -0.001 -0.0005 0 0.0005 0.001 0.0015
Strain
Lo
ad
, k
ip
East Side
West Side
Average
(d) Position of Strain Gages
CG – Concrete Gages
SG – Steel Gages
CF – CFRP Gages
1.5 in
SG
CG
CF
CG – Concrete Gages
SG – Steel Gages
CF – CFRP Gages
CG – Concrete Gages
SG – Steel Gages
CF – CFRP Gages
1.5 in
SG
CG
CF
Figure D.24 Measured Strains in Specimen D-4 (Section 2)
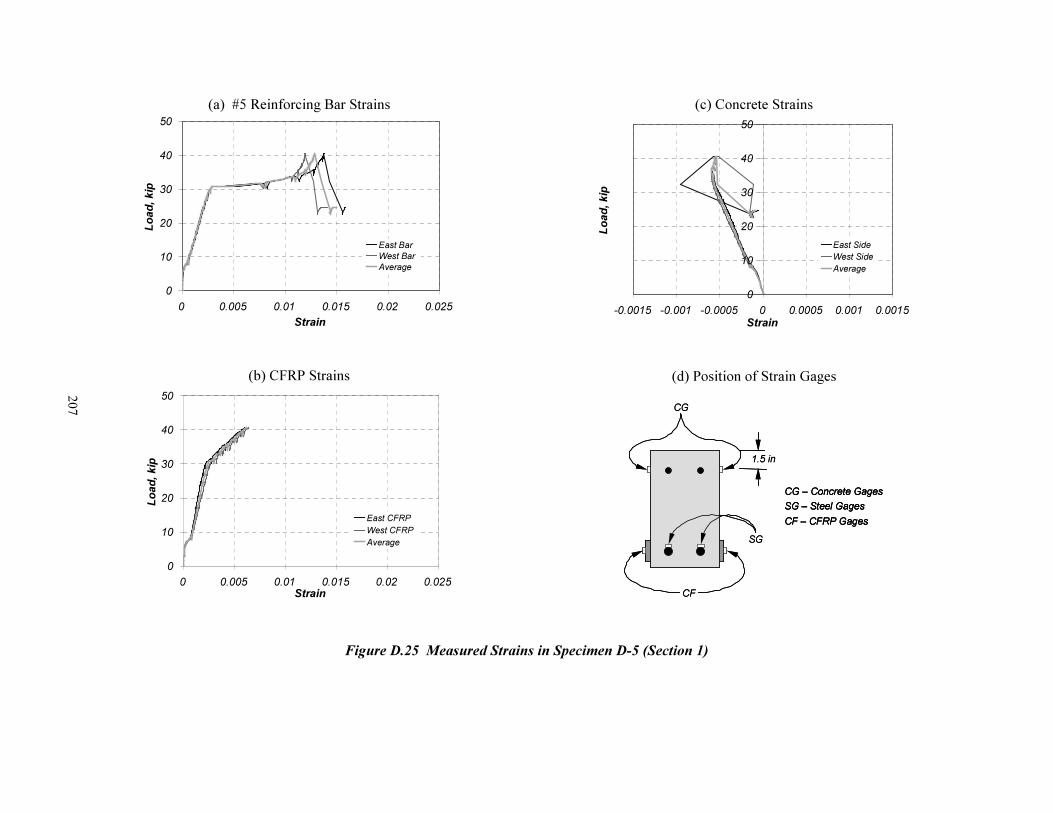
207
(a) #5 Reinforcing Bar Strains
0
10
20
30
40
50
0 0.005 0.01 0.015 0.02 0.025
Strain
Lo
ad
, k
ip
East Bar
West Bar
Average
(b) CFRP Strains
0
10
20
30
40
50
0 0.005 0.01 0.015 0.02 0.025
Strain
Lo
ad
, kip
East CFRP
West CFRP
Average
(c) Concrete Strains
0
10
20
30
40
50
-0.0015 -0.001 -0.0005 0 0.0005 0.001 0.0015
Strain
Lo
ad
, k
ip
East Side
West Side
Average
(d) Position of Strain Gages
CG – Concrete Gages
SG – Steel Gages
CF – CFRP Gages
1.5 in
SG
CG
CF
CG – Concrete Gages
SG – Steel Gages
CF – CFRP Gages
CG – Concrete Gages
SG – Steel Gages
CF – CFRP Gages
1.5 in
SG
CG
CF
Figure D.25 Measured Strains in Specimen D-5 (Section 1)

208
(a) #5 Reinforcing Bar Strains
0
10
20
30
40
50
0 0.005 0.01 0.015 0.02 0.025
Strain
Lo
ad
, k
ip
East Bar
West Bar
Average
(b) CFRP Strains
0
10
20
30
40
50
0 0.005 0.01 0.015 0.02 0.025
Strain
Lo
ad
, kip
East CFRP
West CFRP
Average
(c) Concrete Strains
0
10
20
30
40
50
-0.0015 -0.001 -0.0005 0 0.0005 0.001 0.0015
Strain
Lo
ad
, k
ip
East Side
West Side
Average
(d) Position of Strain Gages
CG – Concrete Gages
SG – Steel Gages
CF – CFRP Gages
1.5 in
SG
CG
CF
CG – Concrete Gages
SG – Steel Gages
CF – CFRP Gages
CG – Concrete Gages
SG – Steel Gages
CF – CFRP Gages
1.5 in
SG
CG
CF
Figure D.26 Measured Strains in Specimen D-5 (Section 2)
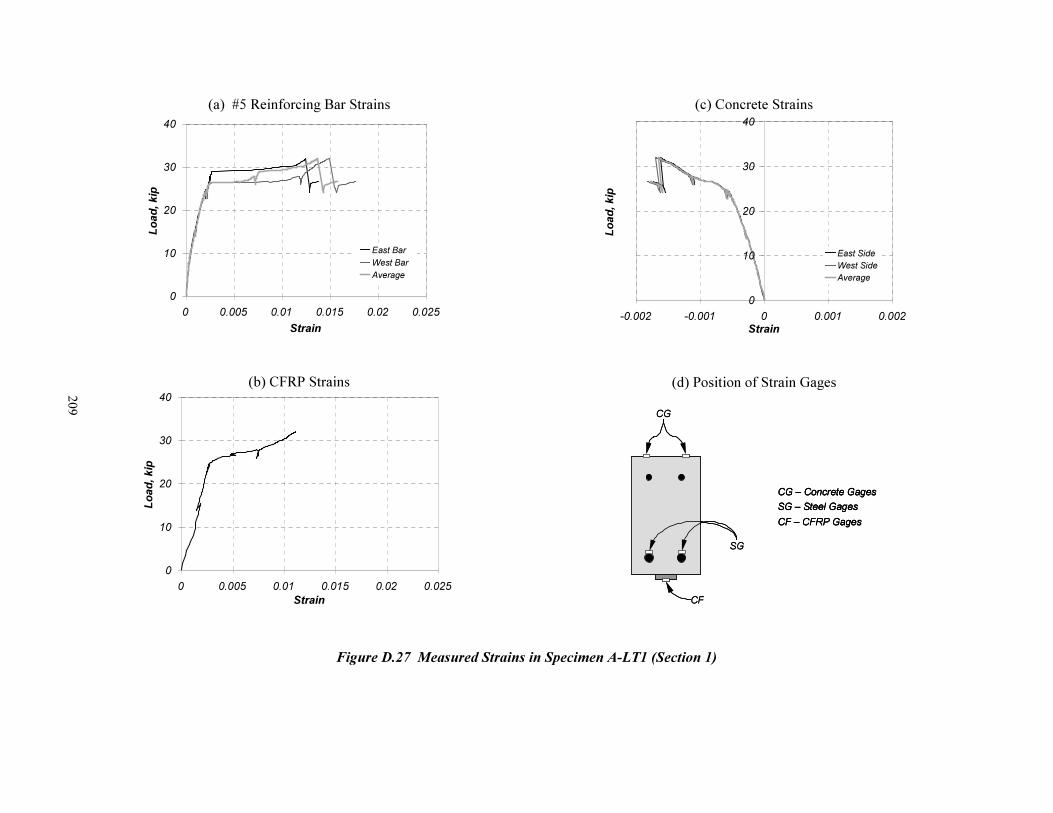
209
(a) #5 Reinforcing Bar Strains
0
10
20
30
40
0 0.005 0.01 0.015 0.02 0.025
Strain
Lo
ad
, kip
East Bar
West Bar
Average
(b) CFRP Strains
0
10
20
30
40
0 0.005 0.01 0.015 0.02 0.025
Strain
Lo
ad
, k
ip
(c) Concrete Strains
0
10
20
30
40
-0.002 -0.001 0 0.001 0.002
Strain
Lo
ad
, k
ip
East Side
West Side
Average
(d) Position of Strain Gages
SG
CG
CF
CG – Concrete Gages
SG – Steel Gages
CF – CFRP Gages
SG
CG
CF
CG – Concrete Gages
SG – Steel Gages
CF – CFRP Gages
CG – Concrete Gages
SG – Steel Gages
CF – CFRP Gages
Figure D.27 Measured Strains in Specimen A-LT1 (Section 1)

210
(a) #5 Reinforcing Bar Strains
0
10
20
30
40
0 0.005 0.01 0.015 0.02 0.025
Strain
Lo
ad
, kip
East Bar
West Bar
Average
(b) CFRP Strains
0
10
20
30
40
0 0.005 0.01 0.015 0.02 0.025
Strain
Lo
ad
, kip
(c) Concrete Strains
0
10
20
30
40
-0.0015 -0.001 -0.0005 0 0.0005 0.001 0.0015
Strain
Lo
ad
, k
ip
East Side
West Side
Average
(d) Position of Strain Gages
SG
CG
CF
CG – Concrete Gages
SG – Steel Gages
CF – CFRP Gages
SG
CG
CF
CG – Concrete Gages
SG – Steel Gages
CF – CFRP Gages
CG – Concrete Gages
SG – Steel Gages
CF – CFRP Gages
Figure D.28 Measured Strains in Specimen A-LT1 (Section 2)
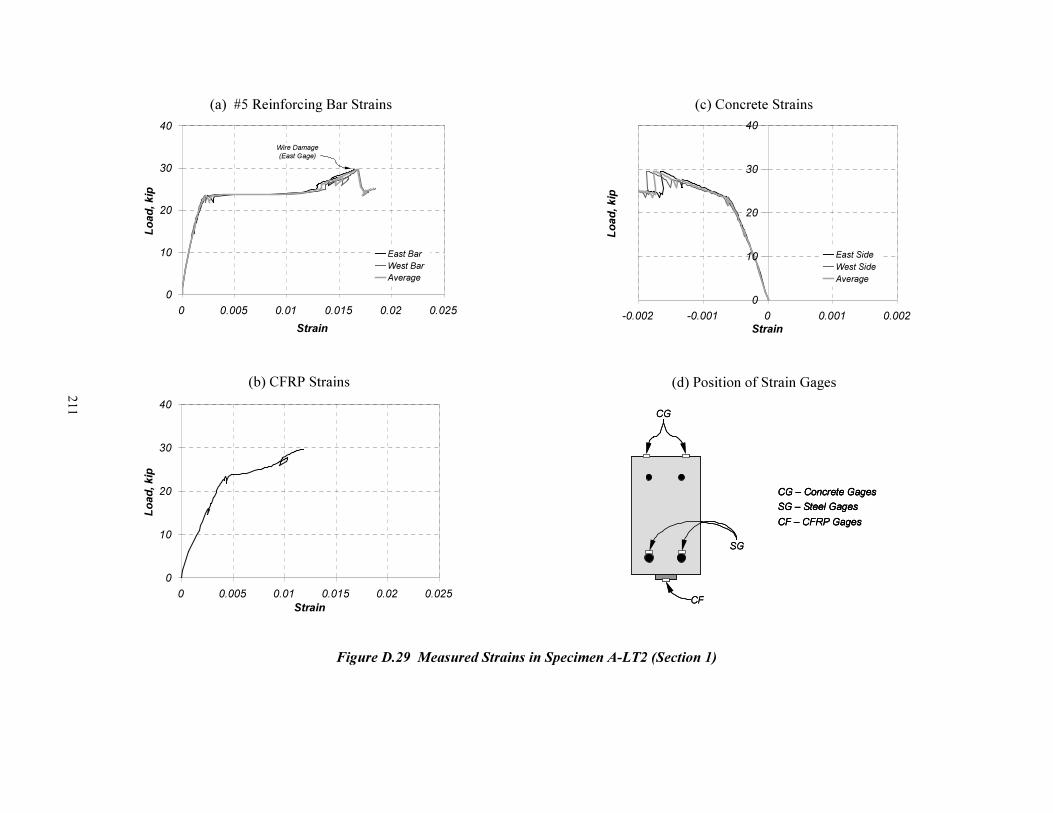
211
(a) #5 Reinforcing Bar Strains
0
10
20
30
40
0 0.005 0.01 0.015 0.02 0.025
Strain
Lo
ad
, kip
East Bar
West Bar
Average
Wire Damage
(East Gage)
(b) CFRP Strains
0
10
20
30
40
0 0.005 0.01 0.015 0.02 0.025
Strain
Lo
ad
, kip
(c) Concrete Strains
0
10
20
30
40
-0.002 -0.001 0 0.001 0.002
Strain
Lo
ad
, k
ip
East Side
West Side
Average
(d) Position of Strain Gages
SG
CG
CF
CG – Concrete Gages
SG – Steel Gages
CF – CFRP Gages
SG
CG
CF
CG – Concrete Gages
SG – Steel Gages
CF – CFRP Gages
CG – Concrete Gages
SG – Steel Gages
CF – CFRP Gages
Figure D.29 Measured Strains in Specimen A-LT2 (Section 1)

212
(a) #5 Reinforcing Bar Strains
0
10
20
30
40
0 0.005 0.01 0.015 0.02 0.025
Strain
Lo
ad
, k
ip
East Bar
West Bar
Average
(b) CFRP Strains
0
10
20
30
40
0 0.005 0.01 0.015 0.02 0.025
Strain
Lo
ad
, k
ip
(c) Concrete Strains
0
10
20
30
40
-0.0015 -0.001 -0.0005 0 0.0005 0.001 0.0015
Strain
Lo
ad
, k
ip
East Side
West Side
Average
(d) Position of Strain Gages
SG
CG
CF
CG – Concrete Gages
SG – Steel Gages
CF – CFRP Gages
SG
CG
CF
CG – Concrete Gages
SG – Steel Gages
CF – CFRP Gages
CG – Concrete Gages
SG – Steel Gages
CF – CFRP Gages
Figure D.30 Measured Strains in Specimen A-LT2 (Section 2)
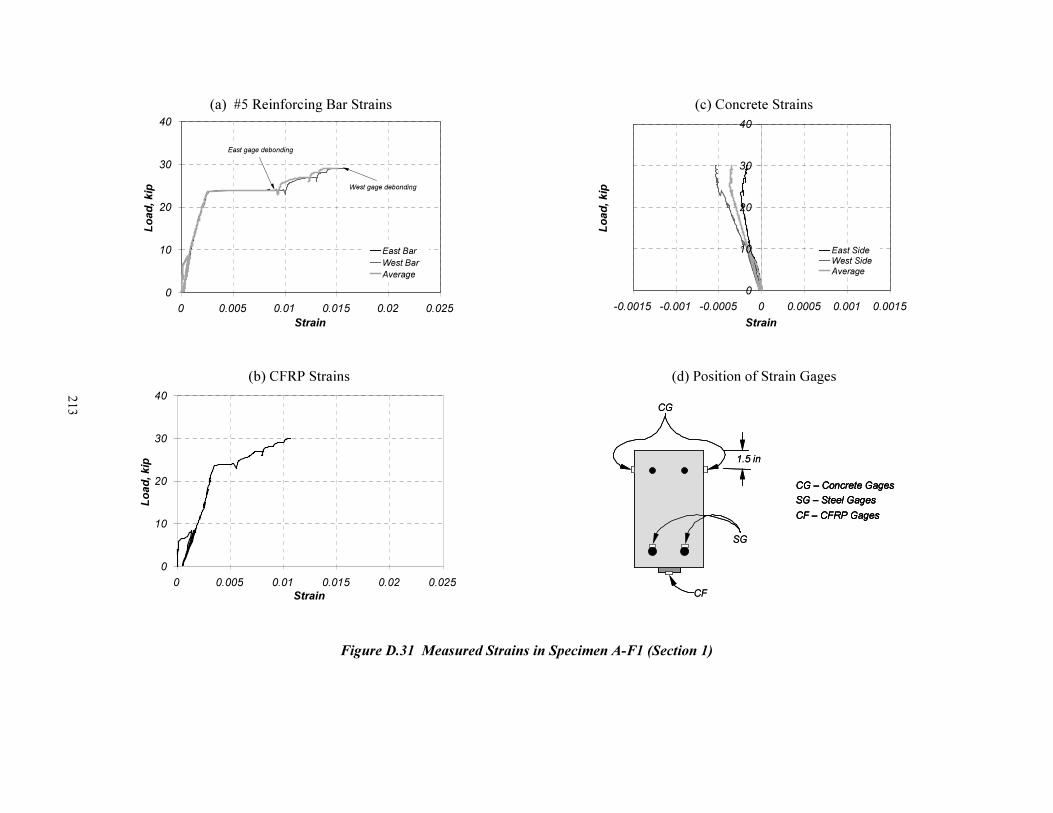
213
(a) #5 Reinforcing Bar Strains
0
10
20
30
40
0 0.005 0.01 0.015 0.02 0.025
Strain
Lo
ad
, k
ip
East Bar
West Bar
Average
East gage debonding
West gage debonding
(b) CFRP Strains
0
10
20
30
40
0 0.005 0.01 0.015 0.02 0.025
Strain
Lo
ad
, kip
(c) Concrete Strains
0
10
20
30
40
-0.0015 -0.001 -0.0005 0 0.0005 0.001 0.0015
Strain
Lo
ad
, k
ip
East SideWest Side
Average
(d) Position of Strain Gages
1.5 in
SG
CG
CF
CG – Concrete Gages
SG – Steel Gages
CF – CFRP Gages
1.5 in
SG
CG
CF
CG – Concrete Gages
SG – Steel Gages
CF – CFRP Gages
CG – Concrete Gages
SG – Steel Gages
CF – CFRP Gages
Figure D.31 Measured Strains in Specimen A-F1 (Section 1)
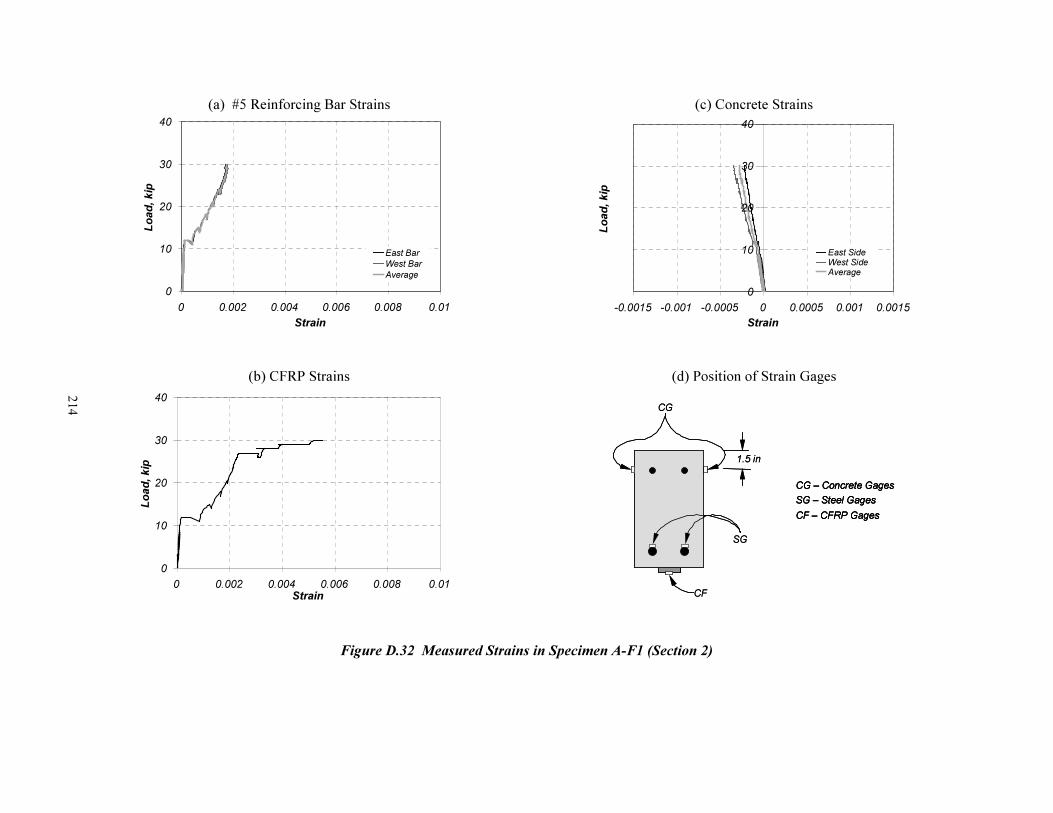
214
(a) #5 Reinforcing Bar Strains
0
10
20
30
40
0 0.002 0.004 0.006 0.008 0.01
Strain
Lo
ad
, k
ip
East Bar
West Bar
Average
(b) CFRP Strains
0
10
20
30
40
0 0.002 0.004 0.006 0.008 0.01
Strain
Lo
ad
, kip
(c) Concrete Strains
0
10
20
30
40
-0.0015 -0.001 -0.0005 0 0.0005 0.001 0.0015
Strain
Lo
ad
, k
ip
East SideWest SideAverage
(d) Position of Strain Gages
1.5 in
SG
CG
CF
CG – Concrete Gages
SG – Steel Gages
CF – CFRP Gages
1.5 in
SG
CG
CF
CG – Concrete Gages
SG – Steel Gages
CF – CFRP Gages
CG – Concrete Gages
SG – Steel Gages
CF – CFRP Gages
Figure D.32 Measured Strains in Specimen A-F1 (Section 2)
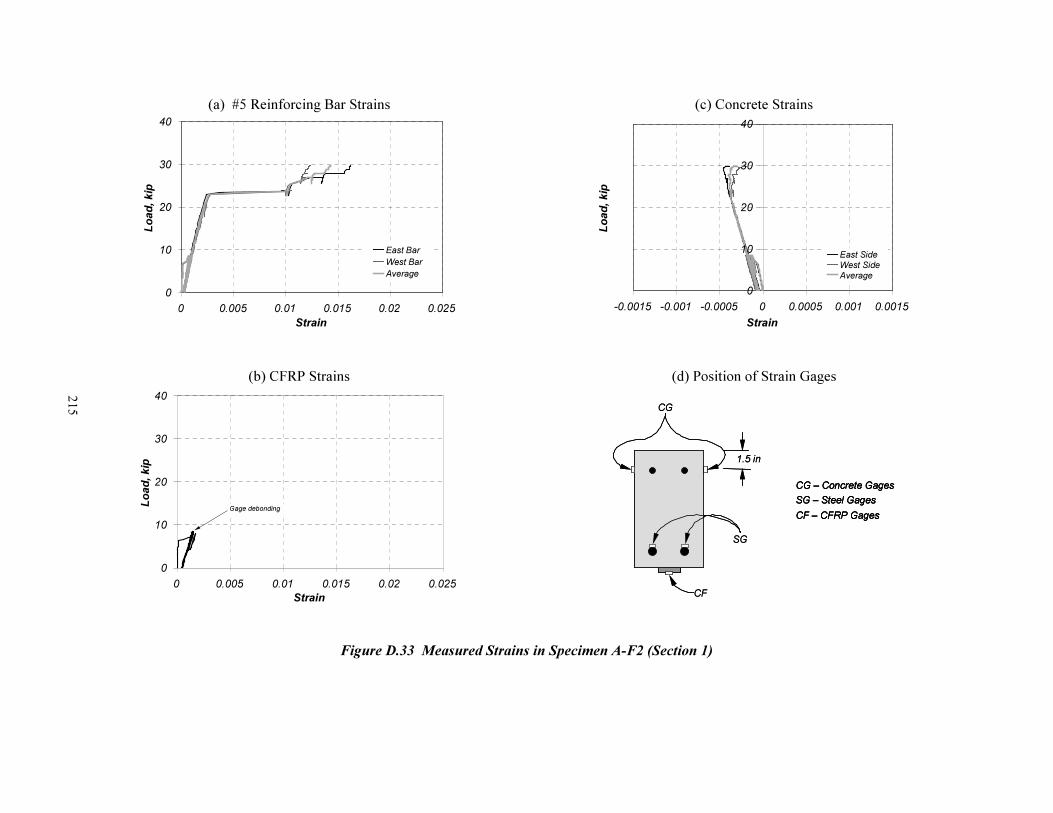
215
(a) #5 Reinforcing Bar Strains
0
10
20
30
40
0 0.005 0.01 0.015 0.02 0.025
Strain
Lo
ad
, k
ip
East Bar
West Bar
Average
(b) CFRP Strains
0
10
20
30
40
0 0.005 0.01 0.015 0.02 0.025
Strain
Lo
ad
, kip
Gage debonding
(c) Concrete Strains
0
10
20
30
40
-0.0015 -0.001 -0.0005 0 0.0005 0.001 0.0015
Strain
Lo
ad
, k
ip
East SideWest Side
Average
(d) Position of Strain Gages
1.5 in
SG
CG
CF
CG – Concrete Gages
SG – Steel Gages
CF – CFRP Gages
1.5 in
SG
CG
CF
CG – Concrete Gages
SG – Steel Gages
CF – CFRP Gages
CG – Concrete Gages
SG – Steel Gages
CF – CFRP Gages
Figure D.33 Measured Strains in Specimen A-F2 (Section 1)
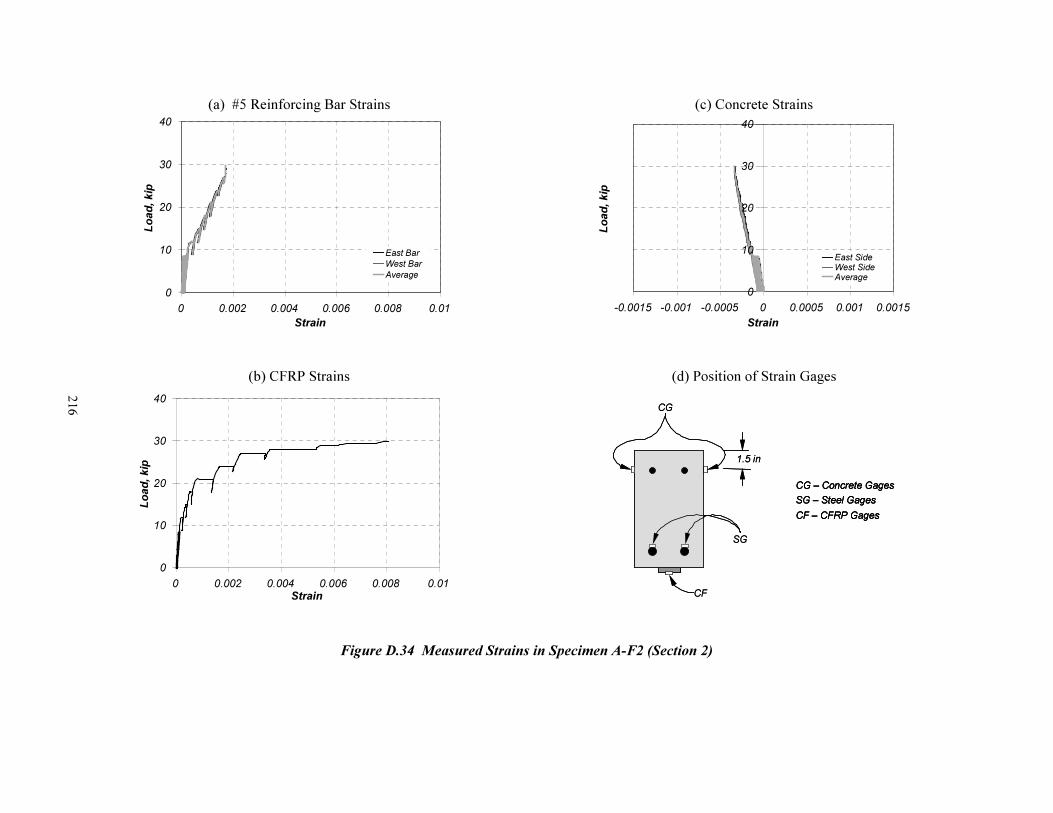
216
(a) #5 Reinforcing Bar Strains
0
10
20
30
40
0 0.002 0.004 0.006 0.008 0.01
Strain
Lo
ad
, k
ip
East Bar
West Bar
Average
(b) CFRP Strains
0
10
20
30
40
0 0.002 0.004 0.006 0.008 0.01
Strain
Lo
ad
, kip
(c) Concrete Strains
0
10
20
30
40
-0.0015 -0.001 -0.0005 0 0.0005 0.001 0.0015
Strain
Lo
ad
, k
ip
East SideWest SideAverage
(d) Position of Strain Gages
1.5 in
SG
CG
CF
CG – Concrete Gages
SG – Steel Gages
CF – CFRP Gages
1.5 in
SG
CG
CF
CG – Concrete Gages
SG – Steel Gages
CF – CFRP Gages
CG – Concrete Gages
SG – Steel Gages
CF – CFRP Gages
Figure D.34 Measured Strains in Specimen A-F2 (Section 2)
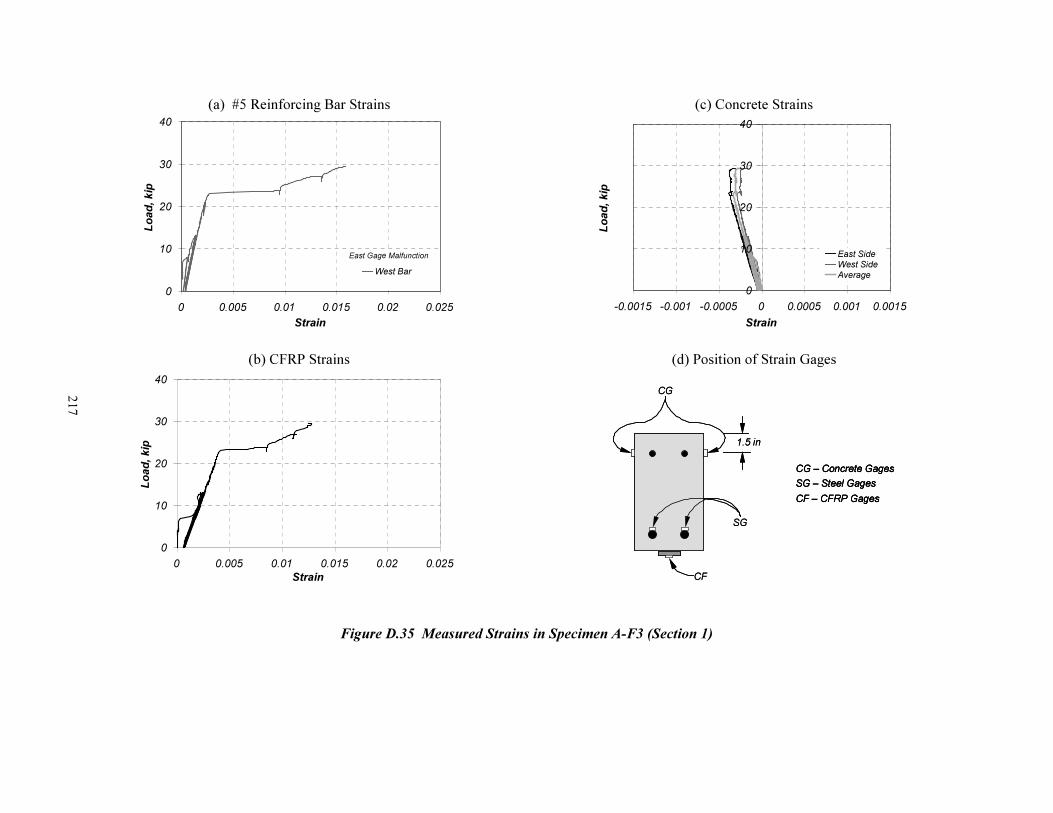
217
(a) #5 Reinforcing Bar Strains
0
10
20
30
40
0 0.005 0.01 0.015 0.02 0.025
Strain
Lo
ad
, k
ip
West Bar
East Gage Malfunction
(b) CFRP Strains
0
10
20
30
40
0 0.005 0.01 0.015 0.02 0.025
Strain
Lo
ad
, k
ip
(c) Concrete Strains
0
10
20
30
40
-0.0015 -0.001 -0.0005 0 0.0005 0.001 0.0015
Strain
Lo
ad
, k
ip
East SideWest Side
Average
(d) Position of Strain Gages
1.5 in
SG
CG
CF
CG – Concrete Gages
SG – Steel Gages
CF – CFRP Gages
1.5 in
SG
CG
CF
CG – Concrete Gages
SG – Steel Gages
CF – CFRP Gages
CG – Concrete Gages
SG – Steel Gages
CF – CFRP Gages
Figure D.35 Measured Strains in Specimen A-F3 (Section 1)

218
(a) #5 Reinforcing Bar Strains
0
10
20
30
40
0 0.002 0.004 0.006 0.008 0.01
Strain
Lo
ad
, k
ip
West Bar
East Gage Malfunction
(b) CFRP Strains
0
10
20
30
40
0 0.002 0.004 0.006 0.008 0.01
Strain
Lo
ad
, kip
(c) Concrete Strains
0
10
20
30
40
-0.0015 -0.001 -0.0005 0 0.0005 0.001 0.0015
Strain
Lo
ad
, k
ip
East Side
West Side
Average
(d) Position of Strain Gages
1.5 in
SG
CG
CF
CG – Concrete Gages
SG – Steel Gages
CF – CFRP Gages
1.5 in
SG
CG
CF
CG – Concrete Gages
SG – Steel Gages
CF – CFRP Gages
CG – Concrete Gages
SG – Steel Gages
CF – CFRP Gages
Figure D.36 Measured Strains in Specimen A-F3 (Section 2)

219
(a) #5 Reinforcing Bar Strains
0
10
20
30
40
0 0.005 0.01 0.015 0.02 0.025
Strain
Lo
ad
, k
ip
East Bar
West Bar
Average
(b) CFRP Strains
0
10
20
30
40
0 0.005 0.01 0.015 0.02 0.025
Strain
Lo
ad
, k
ip
(c) Concrete Strains
0
10
20
30
40
-0.0015 -0.001 -0.0005 0 0.0005 0.001 0.0015
Strain
Lo
ad
, k
ip
East Side
West Side
Average
(d) Position of Strain Gages
1.5 in
SG
CG
CF
CG – Concrete Gages
SG – Steel Gages
CF – CFRP Gages
1.5 in
SG
CG
CF
CG – Concrete Gages
SG – Steel Gages
CF – CFRP Gages
CG – Concrete Gages
SG – Steel Gages
CF – CFRP Gages
Figure D.37 Measured Strains in Specimen A-F4 (Section 1)
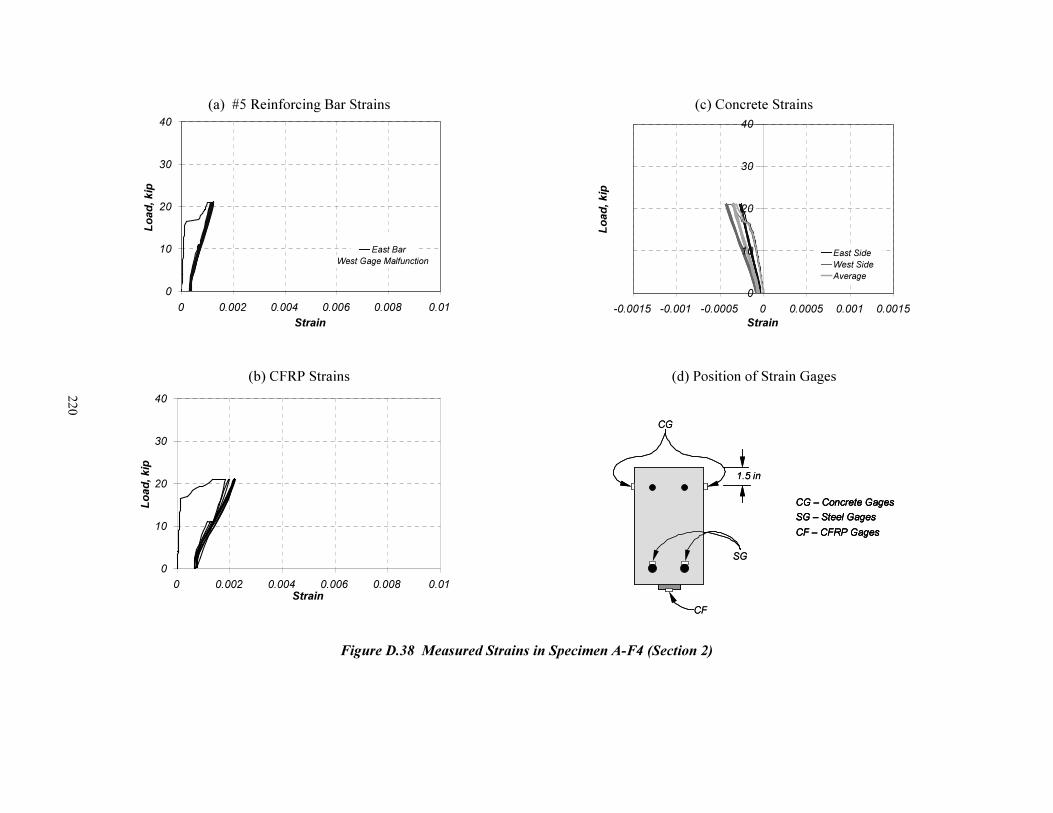
220
(a) #5 Reinforcing Bar Strains
0
10
20
30
40
0 0.002 0.004 0.006 0.008 0.01
Strain
Lo
ad
, k
ip
East Bar
West Gage Malfunction
(b) CFRP Strains
0
10
20
30
40
0 0.002 0.004 0.006 0.008 0.01
Strain
Lo
ad
, kip
(c) Concrete Strains
0
10
20
30
40
-0.0015 -0.001 -0.0005 0 0.0005 0.001 0.0015
Strain
Lo
ad
, k
ip
East Side
West Side
Average
(d) Position of Strain Gages
1.5 in
SG
CG
CF
CG – Concrete Gages
SG – Steel Gages
CF – CFRP Gages
1.5 in
SG
CG
CF
CG – Concrete Gages
SG – Steel Gages
CF – CFRP Gages
CG – Concrete Gages
SG – Steel Gages
CF – CFRP Gages
Figure D.38 Measured Strains in Specimen A-F4 (Section 2)

221
(a) #5 Reinforcing Bar Strains
0
10
20
30
40
50
0 0.005 0.01 0.015 0.02 0.025
Strain
Lo
ad
, k
ip
East Bar
West Bar
Average
Gages debonding
(b) CFRP Strains
0
10
20
30
40
50
0 0.005 0.01 0.015 0.02 0.025
Strain
Lo
ad
, k
ip
East CFRP
West CFRP
Average
(c) Concrete Strains
0
10
20
30
40
50
-0.0015 -0.001 -0.0005 0 0.0005 0.001 0.0015
Strain
Lo
ad
, k
ip
East Side
West Side
Average
(d) Position of Strain Gages
CG – Concrete Gages
SG – Steel Gages
CF – CFRP Gages
1.5 in
SG
CG
CF
CG – Concrete Gages
SG – Steel Gages
CF – CFRP Gages
CG – Concrete Gages
SG – Steel Gages
CF – CFRP Gages
1.5 in
SG
CG
CF
Figure D.39 Measured Strains in Specimen D-F1 (Section 1)
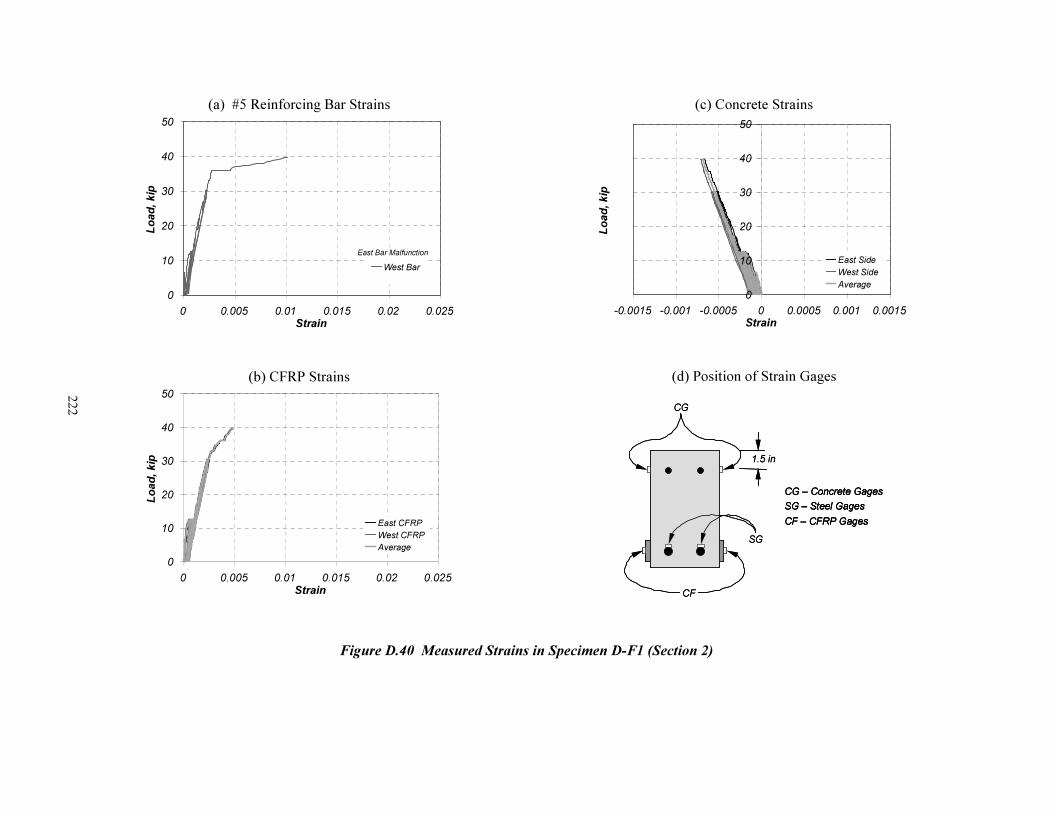
222
(a) #5 Reinforcing Bar Strains
0
10
20
30
40
50
0 0.005 0.01 0.015 0.02 0.025
Strain
Lo
ad
, k
ip
West Bar
East Bar Malfunction
(b) CFRP Strains
0
10
20
30
40
50
0 0.005 0.01 0.015 0.02 0.025
Strain
Lo
ad
, k
ip
East CFRP
West CFRP
Average
(c) Concrete Strains
0
10
20
30
40
50
-0.0015 -0.001 -0.0005 0 0.0005 0.001 0.0015
Strain
Lo
ad
, k
ip
East Side
West Side
Average
(d) Position of Strain Gages
CG – Concrete Gages
SG – Steel Gages
CF – CFRP Gages
1.5 in
SG
CG
CF
CG – Concrete Gages
SG – Steel Gages
CF – CFRP Gages
CG – Concrete Gages
SG – Steel Gages
CF – CFRP Gages
1.5 in
SG
CG
CF
Figure D.40 Measured Strains in Specimen D-F1 (Section 2)
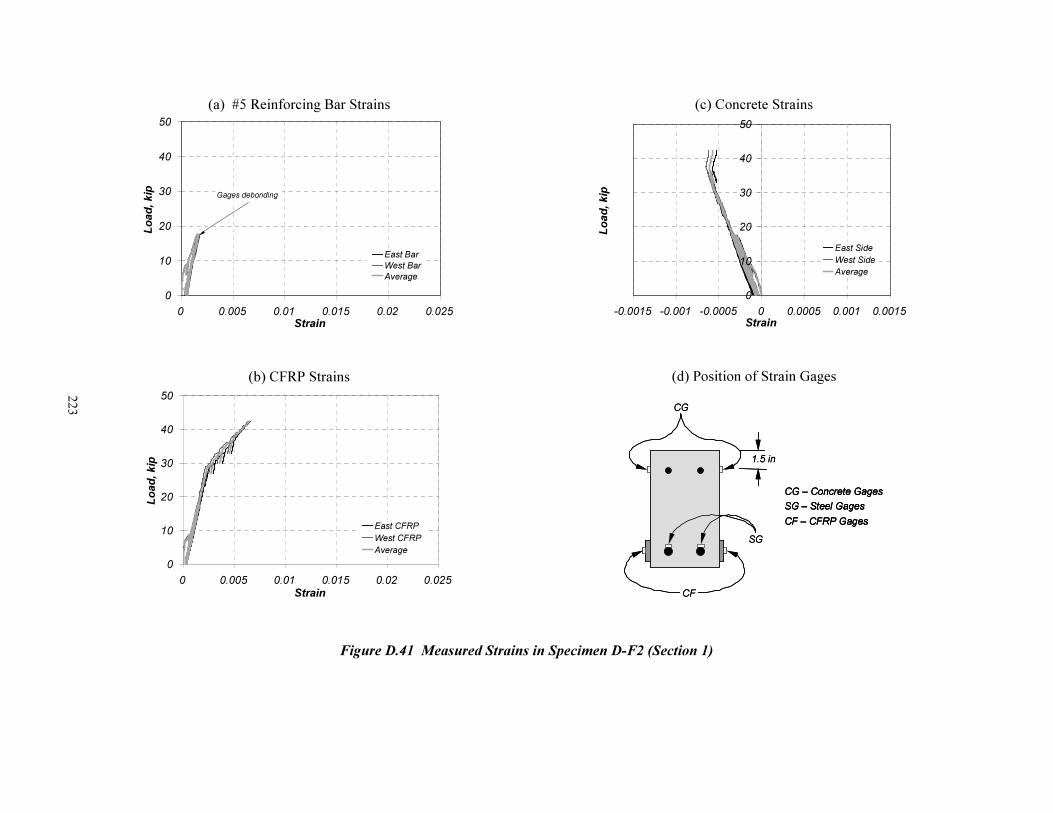
223
(a) #5 Reinforcing Bar Strains
0
10
20
30
40
50
0 0.005 0.01 0.015 0.02 0.025
Strain
Lo
ad
, k
ip
East Bar
West Bar
Average
Gages debonding
(b) CFRP Strains
0
10
20
30
40
50
0 0.005 0.01 0.015 0.02 0.025
Strain
Lo
ad
, k
ip
East CFRP
West CFRP
Average
(c) Concrete Strains
0
10
20
30
40
50
-0.0015 -0.001 -0.0005 0 0.0005 0.001 0.0015
Strain
Lo
ad
, k
ip
East Side
West Side
Average
(d) Position of Strain Gages
CG – Concrete Gages
SG – Steel Gages
CF – CFRP Gages
1.5 in
SG
CG
CF
CG – Concrete Gages
SG – Steel Gages
CF – CFRP Gages
CG – Concrete Gages
SG – Steel Gages
CF – CFRP Gages
1.5 in
SG
CG
CF
Figure D.41 Measured Strains in Specimen D-F2 (Section 1)
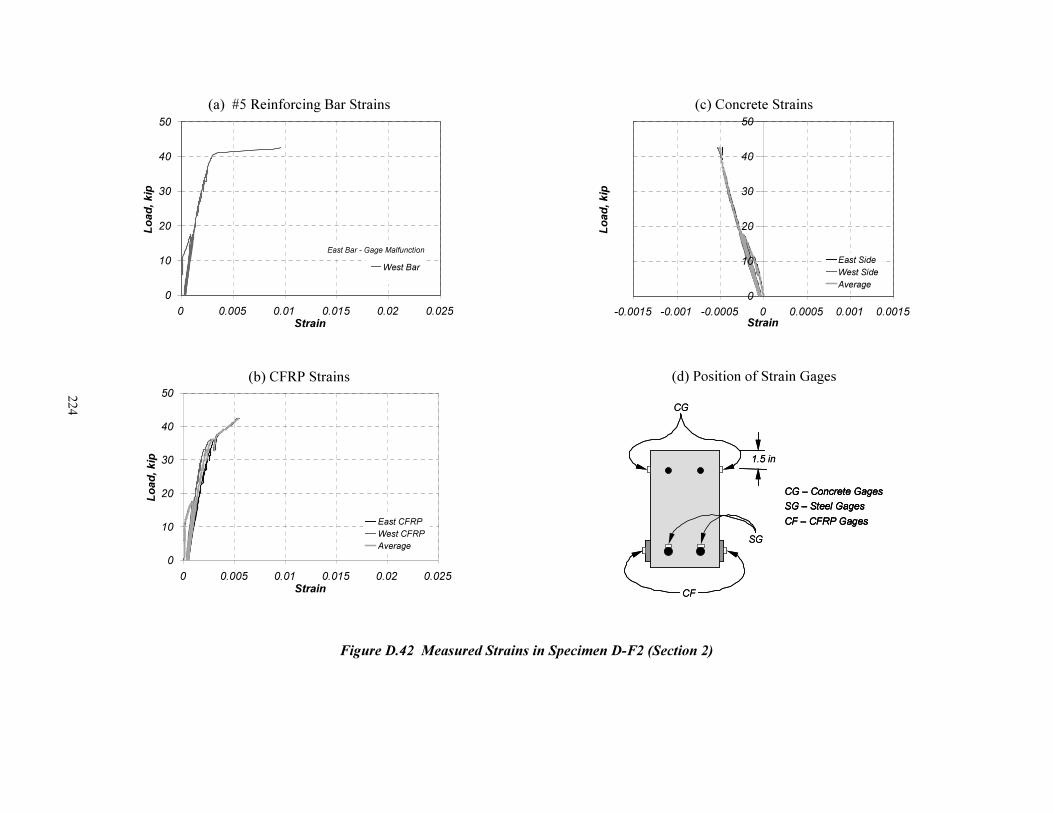
224
(a) #5 Reinforcing Bar Strains
0
10
20
30
40
50
0 0.005 0.01 0.015 0.02 0.025
Strain
Lo
ad
, k
ip
West Bar
East Bar - Gage Malfunction
(b) CFRP Strains
0
10
20
30
40
50
0 0.005 0.01 0.015 0.02 0.025
Strain
Lo
ad
, kip
East CFRP
West CFRP
Average
(c) Concrete Strains
0
10
20
30
40
50
-0.0015 -0.001 -0.0005 0 0.0005 0.001 0.0015
Strain
Lo
ad
, k
ip
East Side
West Side
Average
(d) Position of Strain Gages
CG – Concrete Gages
SG – Steel Gages
CF – CFRP Gages
1.5 in
SG
CG
CF
CG – Concrete Gages
SG – Steel Gages
CF – CFRP Gages
CG – Concrete Gages
SG – Steel Gages
CF – CFRP Gages
1.5 in
SG
CG
CF
Figure D.42 Measured Strains in Specimen D-F2 (Section 2)
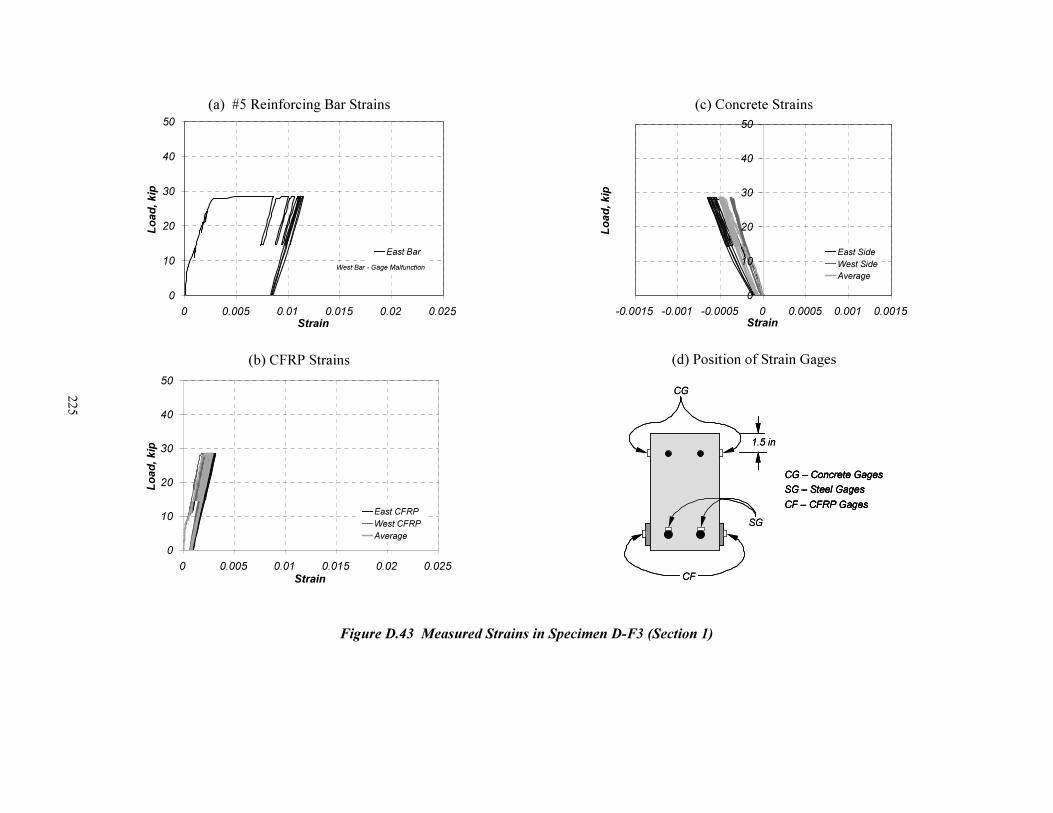
225
(a) #5 Reinforcing Bar Strains
0
10
20
30
40
50
0 0.005 0.01 0.015 0.02 0.025
Strain
Lo
ad
, k
ip
East Bar
West Bar - Gage Malfunction
(b) CFRP Strains
0
10
20
30
40
50
0 0.005 0.01 0.015 0.02 0.025
Strain
Lo
ad
, k
ip
East CFRP
West CFRP
Average
(c) Concrete Strains
0
10
20
30
40
50
-0.0015 -0.001 -0.0005 0 0.0005 0.001 0.0015
Strain
Lo
ad
, k
ip
East Side
West Side
Average
(d) Position of Strain Gages
CG – Concrete Gages
SG – Steel Gages
CF – CFRP Gages
1.5 in
SG
CG
CF
CG – Concrete Gages
SG – Steel Gages
CF – CFRP Gages
CG – Concrete Gages
SG – Steel Gages
CF – CFRP Gages
1.5 in
SG
CG
CF
Figure D.43 Measured Strains in Specimen D-F3 (Section 1)
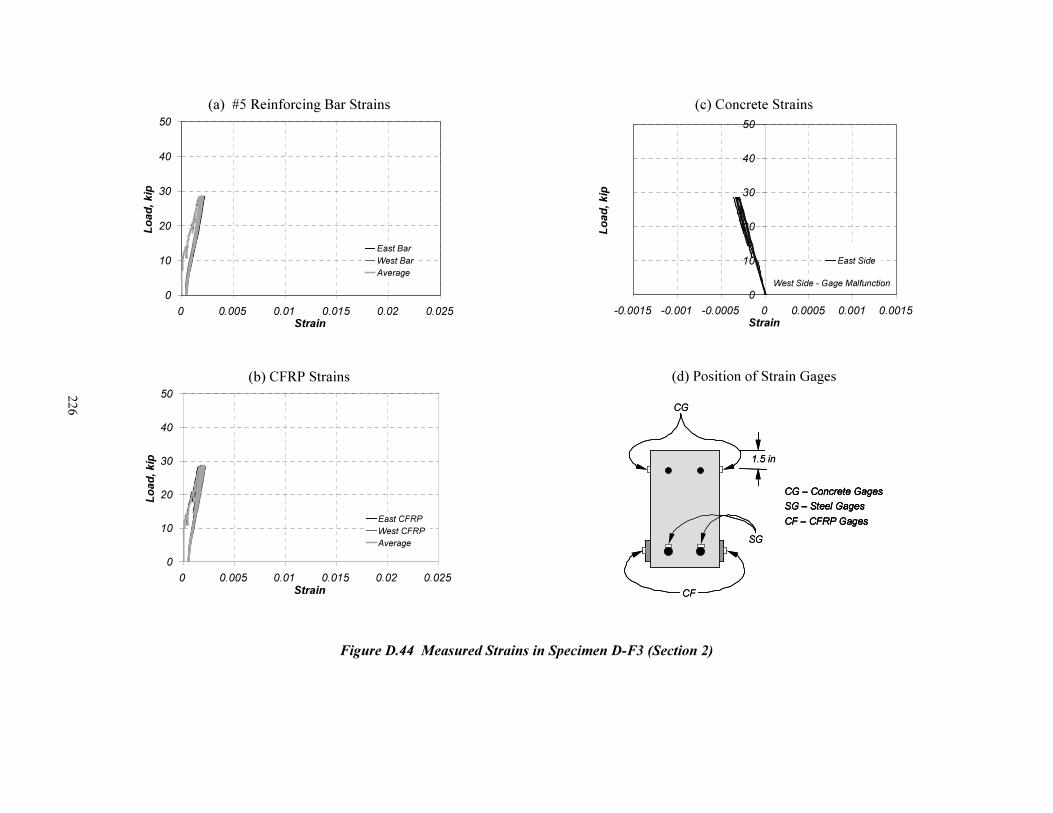
226
(a) #5 Reinforcing Bar Strains
0
10
20
30
40
50
0 0.005 0.01 0.015 0.02 0.025
Strain
Lo
ad
, k
ip
East Bar
West Bar
Average
(b) CFRP Strains
0
10
20
30
40
50
0 0.005 0.01 0.015 0.02 0.025
Strain
Lo
ad
, k
ip
East CFRP
West CFRP
Average
(c) Concrete Strains
0
10
20
30
40
50
-0.0015 -0.001 -0.0005 0 0.0005 0.001 0.0015
Strain
Lo
ad
, k
ip
East Side
West Side - Gage Malfunction
(d) Position of Strain Gages
CG – Concrete Gages
SG – Steel Gages
CF – CFRP Gages
1.5 in
SG
CG
CF
CG – Concrete Gages
SG – Steel Gages
CF – CFRP Gages
CG – Concrete Gages
SG – Steel Gages
CF – CFRP Gages
1.5 in
SG
CG
CF
Figure D.44 Measured Strains in Specimen D-F3 (Section 2)
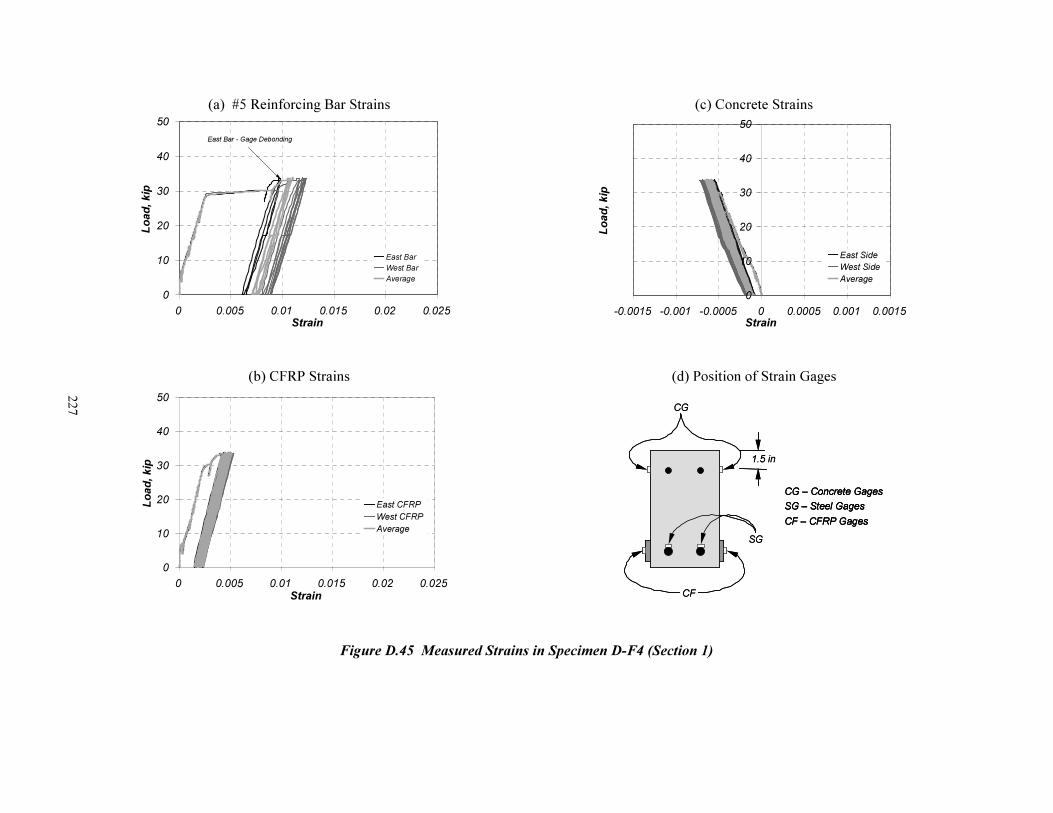
227
(a) #5 Reinforcing Bar Strains
0
10
20
30
40
50
0 0.005 0.01 0.015 0.02 0.025
Strain
Lo
ad
, k
ip
East Bar
West Bar
Average
East Bar - Gage Debonding
(b) CFRP Strains
0
10
20
30
40
50
0 0.005 0.01 0.015 0.02 0.025
Strain
Lo
ad
, k
ip
East CFRP
West CFRP
Average
(c) Concrete Strains
0
10
20
30
40
50
-0.0015 -0.001 -0.0005 0 0.0005 0.001 0.0015
Strain
Lo
ad
, k
ip
East Side
West Side
Average
(d) Position of Strain Gages
CG – Concrete Gages
SG – Steel Gages
CF – CFRP Gages
1.5 in
SG
CG
CF
CG – Concrete Gages
SG – Steel Gages
CF – CFRP Gages
CG – Concrete Gages
SG – Steel Gages
CF – CFRP Gages
1.5 in
SG
CG
CF
Figure D.45 Measured Strains in Specimen D-F4 (Section 1)
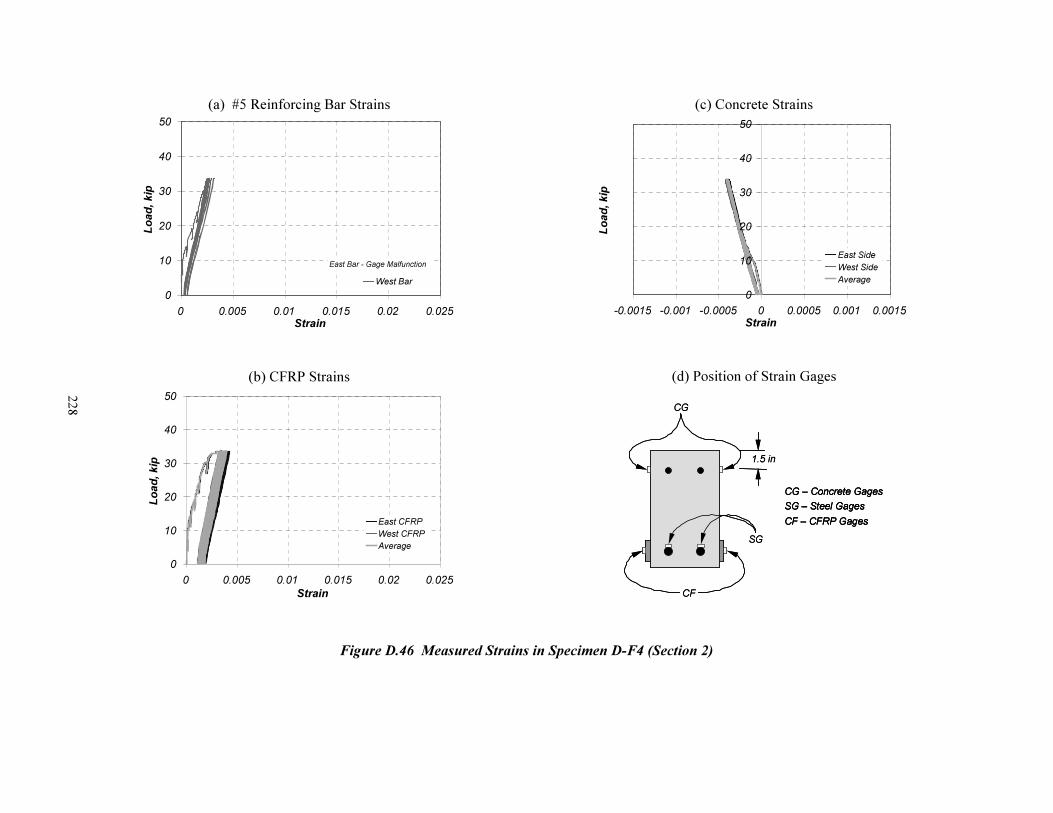
228
(a) #5 Reinforcing Bar Strains
0
10
20
30
40
50
0 0.005 0.01 0.015 0.02 0.025
Strain
Lo
ad
, k
ip
West Bar
East Bar - Gage Malfunction
(b) CFRP Strains
0
10
20
30
40
50
0 0.005 0.01 0.015 0.02 0.025
Strain
Lo
ad
, kip
East CFRP
West CFRP
Average
(c) Concrete Strains
0
10
20
30
40
50
-0.0015 -0.001 -0.0005 0 0.0005 0.001 0.0015
Strain
Lo
ad
, k
ip
East Side
West Side
Average
(d) Position of Strain Gages
CG – Concrete Gages
SG – Steel Gages
CF – CFRP Gages
1.5 in
SG
CG
CF
CG – Concrete Gages
SG – Steel Gages
CF – CFRP Gages
CG – Concrete Gages
SG – Steel Gages
CF – CFRP Gages
1.5 in
SG
CG
CF
Figure D.46 Measured Strains in Specimen D-F4 (Section 2)

229