Use of a Rapid Visual Assessment to Monitor In-Stream ... PDFs... · Monitor In-Stream Structure...
19
Use of a Rapid Visual Assessment to Monitor In-Stream Structure Success Coastal Resources, Inc. 25 Old Solomons Island Road Annapolis, Maryland 21401 410-956-9000 Karen Jennings and Sean Crawford
Transcript of Use of a Rapid Visual Assessment to Monitor In-Stream ... PDFs... · Monitor In-Stream Structure...

Use of a Rapid Visual
Assessment to
Monitor In-Stream
Structure Success
Coastal Resources, Inc.
25 Old Solomons Island Road
Annapolis, Maryland 21401
410-956-9000
Karen Jennings and Sean Crawford

Reasons for monitoring in-stream
structures:
• High cost item
• Key features of design (grade control, channel alignment)
• Lessons learned for future designs
• Early identification and remediation of problems can save
money

Traditional monitoring methods:
• Cross Sections and Longitudinal Profiles only show a 2-D view
• Visual observations may be subjective - results are difficult to
reproduce amongst different people involved
• Photos may not reveal small or obscured problems (i.e. piping)
189
190
191
192
193
194
195
196
197
0 10 20 30 40 50 60 70
Ele
vati
on
(ft
)
Distance (ft)
Cross Section
Apr-09Oct-09Apr-1011-Apr
Left Bank
Right Bank
Bankfull Stage
Structure Performance and Failure Risk
Analysis
• Uses the Rock Cross Vane Rapid Assessment Tool (Puckett,
2007) and expands to include other structure types
• Focuses on failure mechanisms
• Guides attention to visual indications of failure
• Objective and repeatable
• Quantitative
• All encompassing
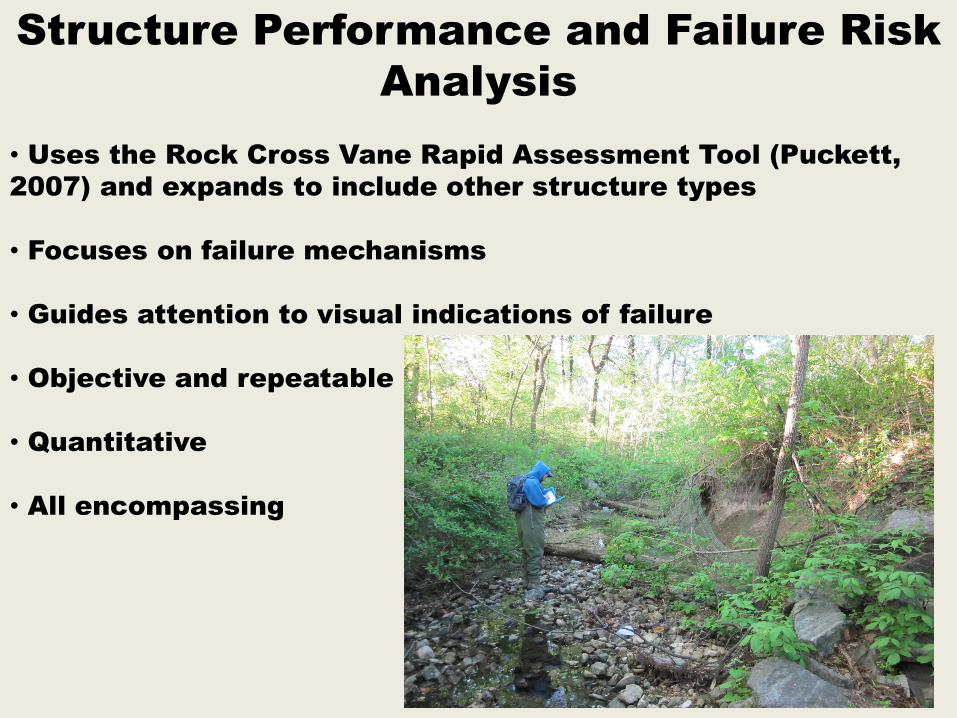
Structure Goal
Failure Type
Failure Indicators
Primary Causes Secondary Causes

A failure indicator is the
visual clue or observation
that indicates the
structure is not durable, or
that it is not performing its
intended function.
Piping under structure boulders.
Bank undercutting and
streambed scour.

Includes
restoration
goals, not just
durability.
Buried step pools are no
longer performing the
restoration goals of
dissipating water energy
or providing pool habitat.

Failure indicators are given a numerical
rating based on severity.
Score 0 1 3 5
Fail
ure
In
dic
ato
r
Arm or Side
Washout
Indicator is not
present.
Less than 10% of the arms
or sides have washed out
(i.e. one or two boulders
missing) or observable
signs of boulder shifting are
present.
11% to 30% of the boulders
are missing.
Greater than 30% of
the boulders are
missing.
Head Cut Indicator is not
present.
Observable signs of boulder
shifting are present, or there
is slight side cutting and/or
undercutting of the sill.
Undercutting travels all the
way under the sill, or the bed
around the sill has begun
down-cutting (as opposed to
the sill simply being installed
above bed elevation)
A visible head cut has
occurred and/or is
migrating upstream.
Bank Erosion at
Structure
Indicator is not
present.
Vegetation has been washed
off at the toe of banks
and/or there are sparse
patches of erosion on less
than 25% of the bank area.
Patchy erosion covers 25% to
50% of the bank area, bank
slumping has occurred but is
still covered by vegetation,
vegetation has been washed
off the banks at half-bankfull,
or there are small bank scour
spots.
Most of the vegetation
up to bankfull has
been washed off,
banks have slumped
or sheared off, or there
are large areas of deep
scour.
Insufficient Scour
Pool
Indicator is not
present.
The pool is shallow
compared to design
intensions (pools were
designed to have minimum
depths of 1ft in step pools,
and 0.75ft at cross and J-
hook vanes).
The pool is shallow and there
is accretion of larger material
or washed out structure
boulders in the pool.
The pool is shallow
with an accretion of
fine material, or the
pool is non-existent.
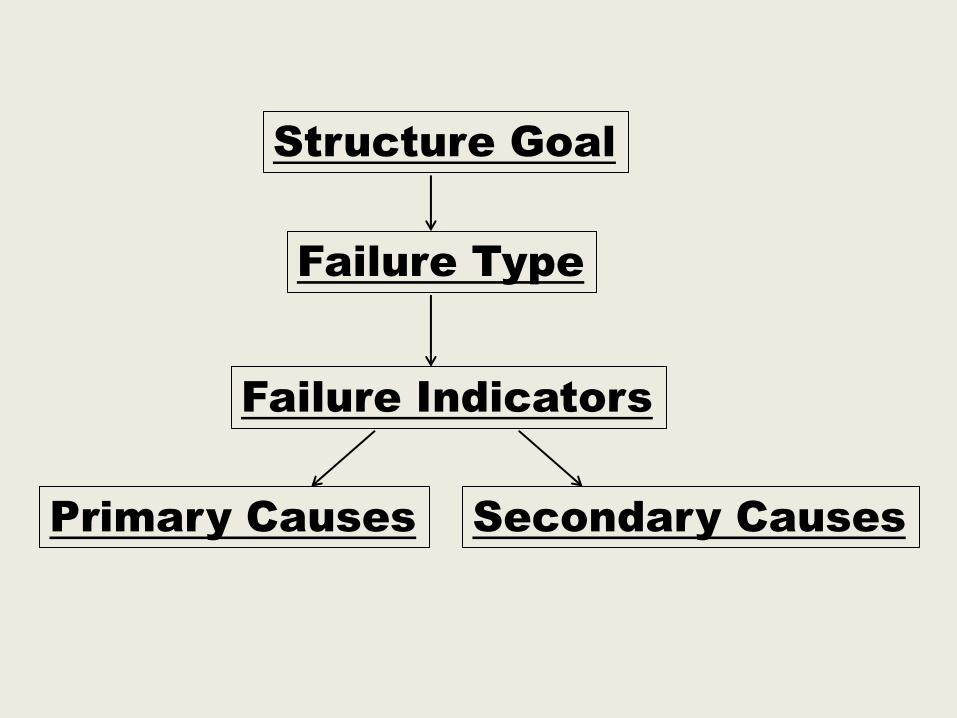
Primary vs
Secondary Causes
of Failure
Structure Indicator Failure
Score
Primary Secondary
Cross
Vane
Arm Washout
3
Undercutting
Insufficient
Backfill
Bank Erosion
at Structure
5
Side Cutting
Arms Washed Out
Downstream
Bank Erosion
4
Side Cutting
Placed in a Bend
Primary cause of failure:
Results from stream flow and
associated hydraulics.
Secondary cause of failure:
Mechanisms which
influence the stream flow,
for example design or
installation flaws.

Structure Indicator Failure
Score
Primary Secondary
Weir
Boulder
Washout
3
Drag and
Lift or
Tipping
Insufficient
Backfill
Bank Erosion
at Structure
3
Side Cutting
Boulders
Washed Out
Downstream
Bank Erosion
3
Flow
Directed at
Banks
Improper
Alignment
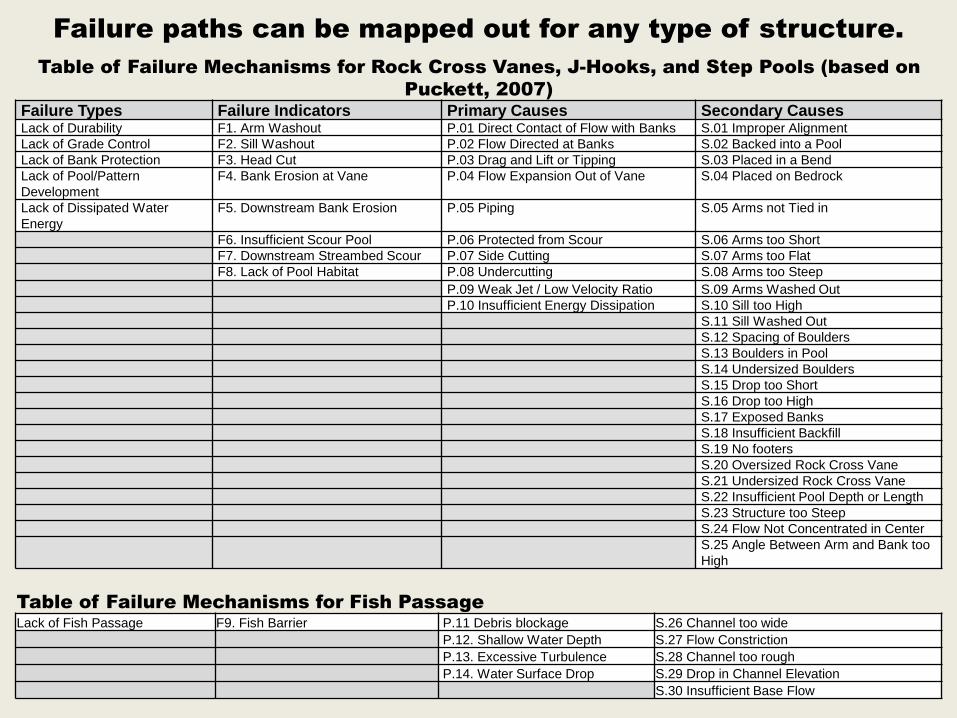
Failure paths can be mapped out for any type of structure.
Table of Failure Mechanisms for Rock Cross Vanes, J-Hooks, and Step Pools (based on
Puckett, 2007)
Failure Types Failure Indicators Primary Causes Secondary Causes Lack of Durability F1. Arm Washout P.01 Direct Contact of Flow with Banks S.01 Improper Alignment
Lack of Grade Control F2. Sill Washout P.02 Flow Directed at Banks S.02 Backed into a Pool
Lack of Bank Protection F3. Head Cut P.03 Drag and Lift or Tipping S.03 Placed in a Bend
Lack of Pool/Pattern
Development
F4. Bank Erosion at Vane P.04 Flow Expansion Out of Vane S.04 Placed on Bedrock
Lack of Dissipated Water
Energy
F5. Downstream Bank Erosion P.05 Piping S.05 Arms not Tied in
F6. Insufficient Scour Pool P.06 Protected from Scour S.06 Arms too Short
F7. Downstream Streambed Scour P.07 Side Cutting S.07 Arms too Flat
F8. Lack of Pool Habitat P.08 Undercutting S.08 Arms too Steep
P.09 Weak Jet / Low Velocity Ratio S.09 Arms Washed Out
P.10 Insufficient Energy Dissipation S.10 Sill too High
S.11 Sill Washed Out
S.12 Spacing of Boulders
S.13 Boulders in Pool
S.14 Undersized Boulders
S.15 Drop too Short
S.16 Drop too High
S.17 Exposed Banks
S.18 Insufficient Backfill
S.19 No footers
S.20 Oversized Rock Cross Vane
S.21 Undersized Rock Cross Vane
S.22 Insufficient Pool Depth or Length
S.23 Structure too Steep
S.24 Flow Not Concentrated in Center
S.25 Angle Between Arm and Bank too
High
Table of Failure Mechanisms for Fish Passage
Lack of Fish Passage F9. Fish Barrier P.11 Debris blockage S.26 Channel too wide
P.12. Shallow Water Depth S.27 Flow Constriction
P.13. Excessive Turbulence S.28 Channel too rough
P.14. Water Surface Drop S.29 Drop in Channel Elevation
S.30 Insufficient Base Flow

Example
of data
form.

We have successfully used this rapid
assessment protocol for:
Step Pools
J-Hooks
Log Vanes
Rock Vanes
Regenerative Stormwater Conveyances
Fish Passages
Weirs
Riffle Grade Controls

Case Study: Sullivan Branch
Headwater Stream Restoration Project
Construction completed in March, 2009
Location: Prince Frederick, Maryland
Physiographic Province: Western Coastal Plain
Length: 550 Linear Feet
Structures: 6 rock cross vanes, 4 rock J-hooks, and 7 step
pools
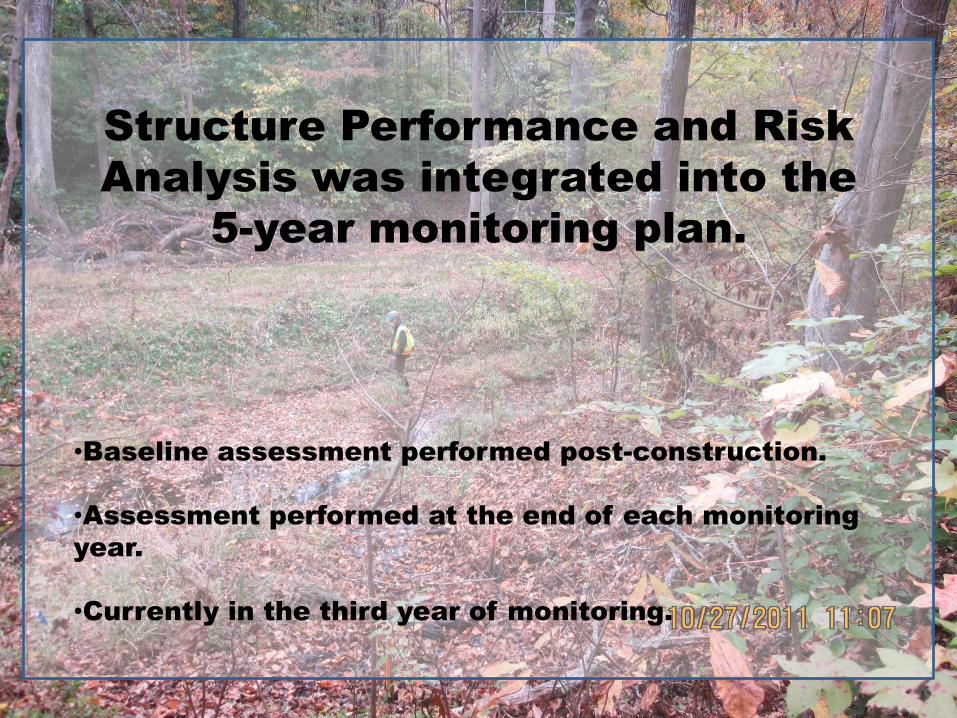
Structure Performance and Risk
Analysis was integrated into the
5-year monitoring plan.
•Baseline assessment performed post-construction.
•Assessment performed at the end of each monitoring
year.
•Currently in the third year of monitoring.
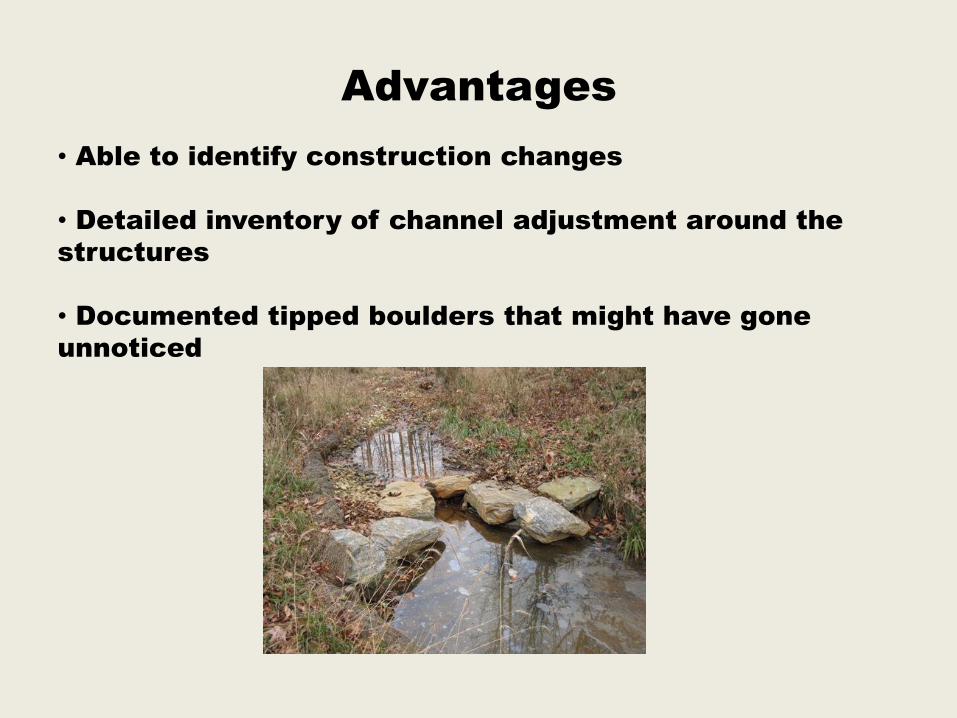
Advantages
• Able to identify construction changes
• Detailed inventory of channel adjustment around the
structures
• Documented tipped boulders that might have gone
unnoticed

Structure Date Failure Indicators
Exhibited
Failure
Score
(1-5)
Primary Causes
Identified
Secondary Causes
Identified
J-Hook
April 2009 Bank Erosion at Vane 1 Piping Insufficient Backfill
Dec. 2009
Bank Erosion at Vane 1 Flow Directed at Banks
Piping
Side Cutting
Placed in a Bend
Insufficient Backfill
Downstream Bank Erosion 2 Flow Directed at Banks Improper Alignment
Dec. 2010 Bank Erosion at Vane 3 Direct Contact of Flow
with Banks
Flow Directed at Banks
Undercutting
Exposed Banks
Improper Alignment
Placed in a Bend
Drop too High
Downstream Bank Erosion 4 Direct Contact of Flow
with Banks
Flow Directed at Banks
Weak Jet
Exposed Banks
Improper Alignment
Flow not Concentrated
in Channel Center
Cross
Vane
April 2009
Insufficient Scour Pool 2 Protected From Scour
Weak Jet
Cobbles Put in Pool
Arms too Flat
Drop too Short
Oversized Rock Cross
Vane
Dec. 2009 Insufficient Scour Pool 1 Weak Jet Drop too Short
Dec. 2010 No Failure Indicators Observed.
Tracking both deterioration and improvement over time.
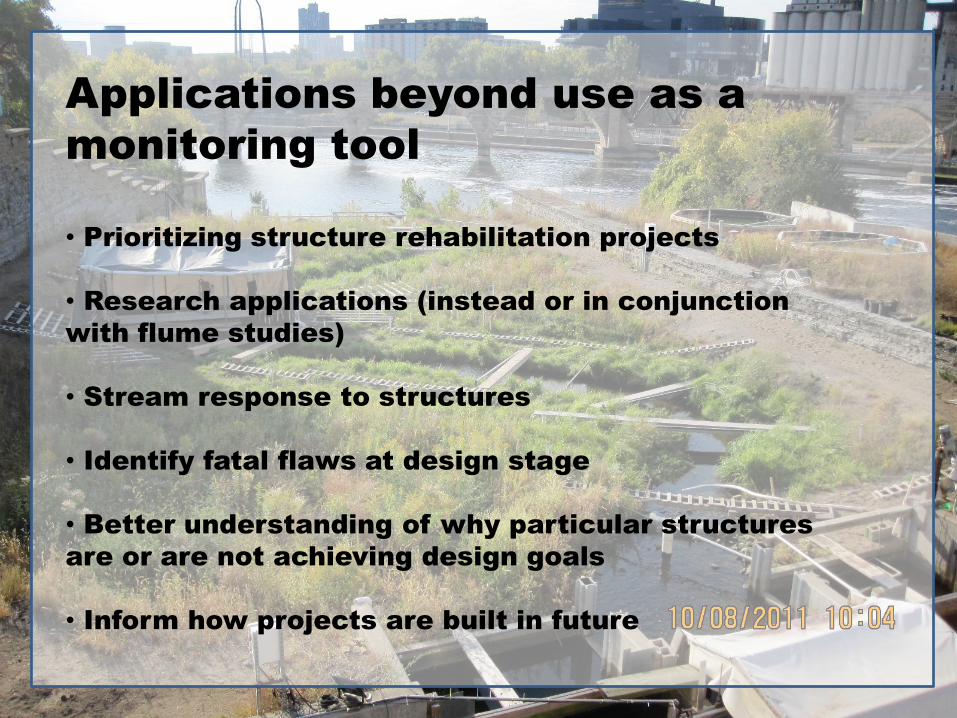
Applications beyond use as a
monitoring tool
• Prioritizing structure rehabilitation projects
• Research applications (instead or in conjunction
with flume studies)
• Stream response to structures
• Identify fatal flaws at design stage
• Better understanding of why particular structures
are or are not achieving design goals
• Inform how projects are built in future

Summary
Acknowledgements:
Maryland State Highway Administration
Field Crew: Matt Hubbard, Sumantha Prasad, Marcus Griswold
• Supplements traditional monitoring methods to give a
multi-dimensional and detailed view.
• Provides consistent, quantitative results
• Flexible protocol can be used for a variety of structures or
applications
• Provides information for future designs on the placement
and use of certain structures, or improved specifications for
construction