Use of 137Cs for soil erosion assessment - Home | … · is crucial also for soil erosion modelling...
76
USE OF 137 CS FOR SOIL EROSION ASSESSMENT
Transcript of Use of 137Cs for soil erosion assessment - Home | … · is crucial also for soil erosion modelling...

USE OF 137CS FOR SOIL EROSION ASSESSMENT

Use of 137Cs for soil erosion assessment
Emil FULAJTAR, Lionel MABIT, Chris S. RENSCHLER,
Amelia LEE ZHI YI
Soil and Water Management & Crop Nutrition Section, Joint FAO/IAEA Division of
Nuclear Techniques in Food and Agriculture, International Atomic Energy Agency,
Vienna, Austria
Food and Agriculture Organization of the United Nations International Atomic Energy Agency
Rome, 2017

Recommended citation FAO/IAEA. 2017. Use of
137Cs for soil erosion assessment. Fulajtar, E., Mabit, L., Renschler, C.S.,
Lee Zhi Yi, A., Food and Agriculture Organization of the United Nations, Rome, Italy. 64 p.
The designations employed and the presentation of material in this information product do not
imply the expression of any opinion whatsoever on the part of the Food and Agriculture
Organization of the United Nations (FAO) concerning the legal or development status of any
country, territory, city or area or of its authorities, or concerning the delimitation of its frontiers or
boundaries. The mention of specific companies or products of manufacturers, whether or not
these have been patented, does not imply that these have been endorsed or recommended by
FAO in preference to others of a similar nature that are not mentioned.
The views expressed in this information product are those of the author(s) and do not necessarily
reflect the views or policies of FAO.
ISBN 978-92-5-130050-3
© FAO, 2017
FAO encourages the use, reproduction and dissemination of material in this information product.
Except where otherwise indicated, material may be copied, downloaded and printed for private
study, research and teaching purposes, or for use in non-commercial products or services, provided
that appropriate acknowledgement of FAO as the source and copyright holder is given and that
FAO’s endorsement of users’ views, products or services is not implied in any way.
All requests for translation and adaptation rights and for resale and other commercial use rights
should be made via www.fao.org/contact-us/licence-request or addressed to [email protected].
FAO information products are available on the FAO website (www.fao.org/publications) and can be
purchased through [email protected].
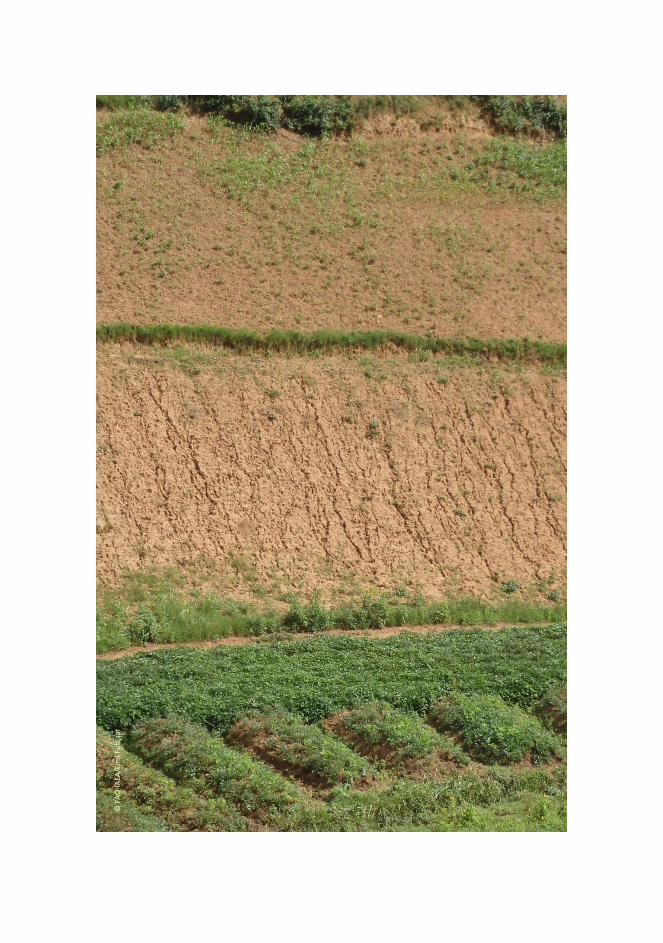
Photo cover: Mountainous agriculture in Uganda (Kigwa, Kabale District) © FAO-IAEA/Emil Fulajtar

Contents
Foreword v
Executive summary vii
1. Introduction` 1 2. Purpose and methods for measuring soil erosion 3 3. Principles of
137Cs method 9
4. Site selection and sampling strategy 17 5. Analysing
137Cs data: gamma spectroscopy 27
6. Conversion of 137
Cs data to soil loss values 31 7. Data analysis, interpretation and presentation 35 8.
137Cs method – validation and use of soil erosion models 41
9. Advantages of 137
Cs method 51 10. Activities performed by the Joint FAO/IAEA Division and furtherperspectives 53 Glossary 54 References 57 List of full-page photos 63
© F
AO
-IA
EA/E
mil
Fula
jtar

v
Foreword
Soil is the fundamental natural resource for humankind and many living organisms. It is the basis for food production and has several environmental functions. It plays a key role in water, nutrient and carbon cycles and serves as an environment for flora and fauna in and above the soil.
Soil is a fragile resource and its development from weathered rocks and sediments under the effect of water, air and living organisms requires time. The soil formation rate usually does not exceed 0.1 mm of soil per year and to form fertile soil suitable for agriculture often requires several hundred or even thousands of years. In contrast the loss of soil can be a quick process, especially if barren soil is exposed to erosion by water or wind.
Combating soil erosion requires investment and, due to the often limited resources, it should be targeted in critical areas and time period during the most vulnerable season. Comprehensive knowledge of spatial and temporal variability of erosion processes is urgently needed. Gaining reliable information is, however, challenging. Conventional methods for measuring soil erosion are labour intensive and time consuming, and data need to cover several decades to get a good representation of mean erosion rates. Furthermore, most conventional methods (except for geodetic method) do not provide information on the spatial distribution of erosion.
Isotope tracers can help meet these deficiencies as some radionuclides and stable isotopes occurring in the environment can serve as environmental tracers and hence facilitate the investigation of these landscape processes. The soil erosion rates can be estimated using
137Cs, a human-induced radionuclide of caesium released into the
atmosphere during nuclear weapon tests more than half a century ago. The 137
Cs method for soil erosion assessment effectively provides long-term mean soil redistribution rates, representing the period since its release (mid-1950s) until the time of the
137Cs sampling. Such information on spatial and temporal distribution of erosion
is crucial also for soil erosion modelling and soil conservation programmes and provides essential information towards several strategic objectives of the Food and Agriculture Organization of the United Nations (FAO).
This publication provides a brief overview of the 137
Cs method and explains the principles and strengths of its applications in research towards climate-smart agriculture. It addresses a wide audience encompassing scientists and students, environmental specialists, agricultural managers and decision makers, farmers and individuals who are interested in soil conservation and sustainable land management. It summarizes the experience of research activities carried out by the Joint FAO/IAEA Division of Nuclear Techniques in Food and Agriculture.

vi
© F
AO
-IA
EA/E
mil
Fula
jtar

vii
Executive summary
Soil erosion by water, wind and tillage are among the most common and important land degradation processes, with both on-site and off-site impacts. They affect more land than all other degradation processes put together. A total of 75 billion tons of fertile soil is removed every year from global soilscape by erosion. As a result, precious soil resources, which should be preserved for next generations, are continuously reduced. Every year approximately 12 million ha of land is lost. It is therefore important that erosion research is conducted to assess the soil redistribution rates, their spatial distribution and temporal dynamics in order to counteract this process.
The measurement of soil redistribution is not an easy task because soil erosion is caused by a number of processes running at different temporal and spatial scales. Conventional erosion measurement methods, such as volumetric, erosion plots, hydrological method and geodetic methods, are used for different erosion processes and they cover different spatial and temporal scales. Most conventional methods have severe limitations. They are associated with point data (measurement profiles) and do not provide information on spatial distribution of erosion. However the major disadvantage is that they are labour-intensive and require long monitoring periods. These disadvantages can be overcome by using
137Cs as an erosion tracer.
The basic principle of the 137
Cs method for soil erosion assessment is based on the chemical characteristics of Caesium. The
137Cs is a human-induced environmental
radionuclide, released into the atmosphere by nuclear weapons testing in the 1950s and 1960s, whereby the radionuclide spread to the stratosphere and gradually descended to the land surface. In addition, smaller regional contaminations were caused by nuclear power plant accidents (such as the Chernobyl and Fukushima-Daiichi accident). When
137Cs gets into contact with soil material, it binds firmly to soil colloids
and is often not transferred by processes such as leaching or plant uptake. It can move only together with soil particles and this means that any change in
137Cs inventories
indicate the occurrence of processes of soil redistribution by physical agents (e.g. soil erosion).
The concept of reference sites was established to express loss and accumulation processes quantitatively. A reference site is an undisturbed site where neither erosion nor sedimentation occurs, so that the
137Cs inventory represents the original fallout
reduced only by radioactive decay. The principle of the method is based on comparison of studied and reference sites. If the studied site contains less
137Cs than the reference
site, it implies that the studied site is eroded. If its 137
Cs inventory is greater, it is affected by sedimentation. This simple relation is interpreted by conversion models in order to convert the differentiated
137Cs inventories into soil erosion and
sedimentation rates.
For successful interpretation of the 137
Cs method, proper selection of the reference site is crucial. The
137Cs sampling should start with depth incremental sampling performed
to determine the depth distribution of 137
Cs contamination; subsequent bulk core samples should then be collected following grid or multiple transect designs.

viii
The analysing of 137
Cs content in the soil is done by gamma spectroscopy. 137
Cs can be easily measured by gamma spectroscopy because it provides a strong peak (at 662 keV energy) that is well identifiable in the gamma ray energy spectrum. After data collection (
137Cs inventories and calculated soil erosion rates), data processing and the
interpretation of data follows. The obtained data can be used for various purposes, such as characterizing the erosion over a range of environments or land uses; estimating the impact of land management and crop rotation on the soil erosion; and assessing the efficiency of particular soil conservation measures. This publication describes the above steps, including data interpretation. It also describes the use of 137
Cs in combination with erosion modelling. The 137
Cs derived erosion data has great potential as a tool for validation of erosion models.
The primary purpose of erosion assessment with 137
Cs method is to provide information needed for identification of erosion hot spot areas and selection of conservation measures. This helps to implement the soil conservation programmes and thus
137Cs method contributes to maintaining food security.

1
1 Introduction
The suggestion to use caesium-137 (137
Cs) as a tracer for soil erosion assessment originated in the 1960s when environmental scientists investigated land contamination by radionuclides released during nuclear weapons tests. It was found that some radionuclides released by these tests could be used as tracers to investigate landscape processes, such as water circulation and transport of soluble/insoluble compounds.
Initial studies on erosion assessment focused on strontium-90 (90
Sr). Menzel (1960) noticed that the loss of
90Sr at sloping relief positions can be attributed to erosion and
sedimentation. As 90
Sr is challenging to analyse, the attention soon turned to 137
Cs. Graham (1963) and Frere and Roberts (1963) began the investigations of
90Sr and
137Cs
redistribution by soil erosion. Rorowski and Tamura (1965, 1970a, b) started to use 137
Cs as artificially added tracers to investigate correlation between soil erosion or soil loss and
137Cs inventories at experimental plots. The
137Cs method underwent
significant development and became a well-established method for soil erosion quantitative assessment in the 1990s and early 2000s (Walling and Quine, 1990, 1991, 1992, 1995; Zupanc and Mabit, 2010; IAEA, 2014).
The Joint FAO/IAEA Division of Nuclear Techniques in Food and Agriculture plays an important role in the development of the FRN methods. It was established in 1964 and represents a strategic partnership between FAO and IAEA, mobilizing the resources of both organizations to promote the application of nuclear science and technology for supporting the sustainable agriculture and secure food production.
In 1995 the Joint FAO/IAEA Division launched its first coordinated research project (CRP) on the ‘Assessment of soil erosion through the use of
137Cs and related
techniques as a basis for soil conservation, sustainable production, and environmental protection (D1.50.05)’. Later activities aimed at FRN methods continued with several other CRPs (‘Conservation Measures for Sustainable Watershed Management Using Fallout Radionuclides, D1.50.08’; ‘Integrated Isotopic Approaches for an Area-wide Precision Conservation to Control the Impacts of Agricultural Practices on Land Degradation and Soil Erosion, D1.20.11.’; and, recently, ‘Nuclear Techniques for a Better Understanding of the Impact of Climate Change on Soil Erosion in Upland Agro-ecosystems, D1.50.17’). The Joint FAO/IAEA Division through the Soil and Water Management and Crop Nutrition (SWMCN) Subprogramme can be considered as the leading international institution in working and developing the
137Cs method. The use
of 137
Cs for the assessment of erosion is becoming well-established. It is widely used for erosion studies to provide key information on sheet and rill erosion rates and soil/sediment dynamics and redistribution. This work is supported by the international research community. The
137Cs method was described several times in detail in several
handbooks (Walling and Quine, 1993; Zapata, 2002; Mabit et al., 2014). The last two being based on the results of the above mentioned CRPs.
Later investigations of FRNs also identified few other radionuclides for soil erosion assessment. Lead-210 (
210Pb) (Walling and He, 1999) and beryllium-7 (
7Be) (Walling et
al., 2000) brought good results, and more recently innovative studies testing

2
plutonium-239+240 (239+240
Pu) were published (Alewell et al., 2014). All these radionuclides are commonly termed as fallout radionuclides (FRNs) as they are fallen on land from the atmosphere. After the initial deposition FRNs provide a baseline to assess the soil redistribution – soil erosion, transport and deposition – in natural as well as managed (or cultivated) landscapes.
The further development of the 137
Cs method requires more widespread dissemination of knowledge to scientists and students specialised in soil erosion research as well as to wider audience of specialists e.g. decision makers working in agriculture and farmers. For this purpose, there is a demand for a short document that can explain the principles of the method clearly and briefly and to provide ideas about its applications for various research objectives. This publication attempts to provide the readers with this information. Additionally, it allows FAO Member Countries and IAEA Member States on the benefit offered by the
137Cs method for sustainable land management
and soil conservation.

3
2 Purpose and methods measuring soil erosion
2.1 Soil erosion as landscape process
Landscape processes of air, water, rock, soil, nutrients, pollutants and living organisms redistribution and transformation are the results of complex interaction of a variety of individual processes from very dynamic processes such as air and water circulation, through medium-term processes, for example the seasonal dynamics of vegetation, up to long-lasting processes such as tectonic movement and rock weathering. The study of the magnitudes, spatial and temporal distribution of these processes is one of the basic objectives of Earth Systems Sciences.
Soil erosion is one of most common and most important group of landscape processes with an on-site and off-site impact. It is closely connected with the water cycle and the circulation of soluble basic nutrients, trace elements and pollutants. Several particular erosion processes participate in soil redistribution. Most important among them are water erosion (sheet, rill and gully) and wind erosion (Figure 2.1).
Figure 2.1. Examples of the main erosion processes: sheet, rill, gully and wind erosion.
Erosion processes show a wide geographical distribution (Figure 2.2) and affect large portion of land especially cultivated land and pastures occurring in arid or semi-arid areas. Erosion affects more land than all other degradation processes together. While most of the latter (e.g. contamination, compaction, salinization, etc.) result in
© F
AO
-IA
EA/E
mil
Fula
jtar

4
deterioration of some soil properties, soil erosion result in complete removal of the whole upper, often most fertile soil layer and redistributes it down-slope in landscapes as sediments. Therefore the programmes for development of sustainable land use for agriculture and forestry have great importance for securing the overall development of society, sustainable land exploitation and food security.
Figure 2.2. Geographical distribution of land degradation (UNEP, 1997).
The most basic task for erosion research is to assess soil redistribution rates, their spatial distribution, and temporal dynamics. These data are serving as primary information for all further investigations of erosion, its mechanisms, modelling of scenarios, predictions, and any other applied activities aimed at soil conservation.
There are five major thematic groups requiring quantitative data on soil erosion and sedimentation rates:
Basic research (understanding of the mechanism of erosion processes);
Identification of critical areas for land conservation;
Testing of the efficiency of soil conservation measures;
Deriving the input parameters for models; and
Model calibration validation and implementation for decision-making.
5
2.2 Soil erosion measurement methods
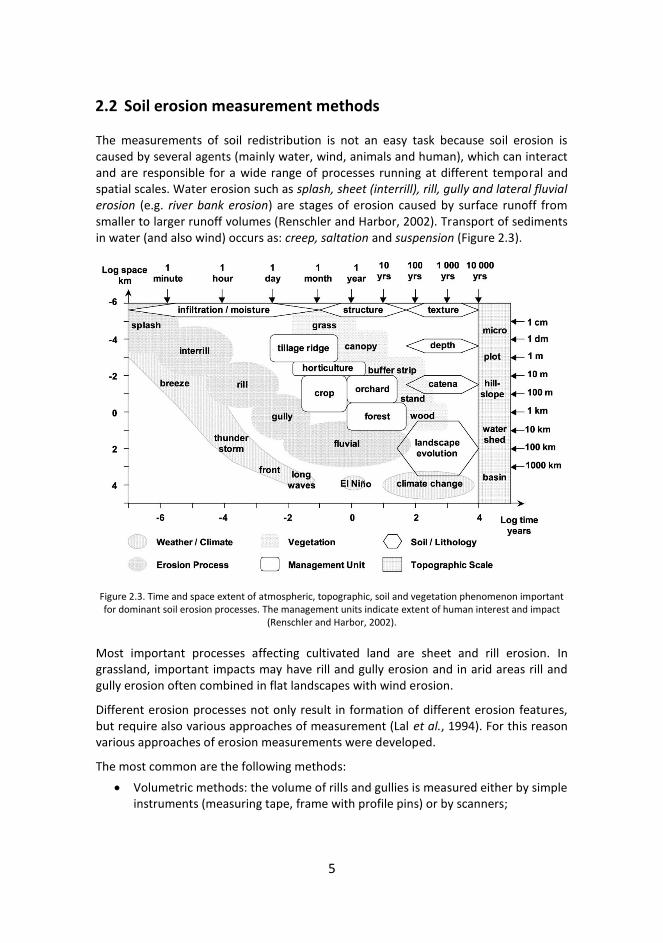
The measurements of soil redistribution is not an easy task because soil erosion is caused by several agents (mainly water, wind, animals and human), which can interact and are responsible for a wide range of processes running at different temporal and spatial scales. Water erosion such as splash, sheet (interrill), rill, gully and lateral fluvial erosion (e.g. river bank erosion) are stages of erosion caused by surface runoff from smaller to larger runoff volumes (Renschler and Harbor, 2002). Transport of sediments in water (and also wind) occurs as: creep, saltation and suspension (Figure 2.3).
Figure 2.3. Time and space extent of atmospheric, topographic, soil and vegetation phenomenon important for dominant soil erosion processes. The management units indicate extent of human interest and impact
(Renschler and Harbor, 2002).
Most important processes affecting cultivated land are sheet and rill erosion. In grassland, important impacts may have rill and gully erosion and in arid areas rill and gully erosion often combined in flat landscapes with wind erosion.
Different erosion processes not only result in formation of different erosion features, but require also various approaches of measurement (Lal et al., 1994). For this reason various approaches of erosion measurements were developed.
The most common are the following methods:
Volumetric methods: the volume of rills and gullies is measured either by simple instruments (measuring tape, frame with profile pins) or by scanners;

6
Erosion plots: a small part of slope is fenced to form separated rectangular plot, protected from runoff generated in surroundings (Figure 2.4). At the lowest end of the plot, the runoff generated within the plot and the transported sediment is trapped by furrow and derived to some of following collecting or recording devices:
o The tank collecting and storing the whole volume of water and sediment (total collection method);
o The device splitting runoff and sediment to several equal parts (multi-slot divisor) among which only one is further collected (thus only a small fraction of the runoff and sediment is collected and stored in order to save space and labour for sediment processing);
o The dynamic devices (filled and emptied) measuring the discharge and sediment concentration (tipping buckets, Coshocton wheels);
Figure 2.4. Example of erosion plots with total collection of sediment (Osikov, Slovakia).
Hydrological methods: the sediment transported by watercourses can be either floating in the water (in suspension) or rolling on the river bed (as bed load). For each of these two groups of sediments, different methods are needed as they are controlled by different movement principles:
o The determination of suspended sediment load is based on measurements of water discharges and concentration of suspended sediments. The discharge (l s
-1 in small water courses and m
-3 s
-1 in rivers) is measured
using the standard hydrological approach measuring the mean flow velocity in known hydrological profile, which are either the selected profiles in natural beds (in rivers), or artificial built up hydrological profiles
© F
AO
-IA
EA/E
mil
Fula
jtar

7
such as sheet-iron parshal fumes (Figure 2.5) used for very small linear flows and stony or concrete hydrological profiles built in river beds of small water courses. The suspended sediment load (expressed as concentration of insoluble suspended soil material in g l
-1) is determined in water
samples collected periodically using either hand sampling or automatic samplers.
o The bed load is measured with the aid of various mechanical bed load traps or bed load samplers.
Figure 2.5. Example of Parshal fume used for measurements of suspended sediment (Lukacovce, Slovakia).
As soil erosion is a complex phenomenon to investigate, each assessment or measurement method has its conceptual and technical advantages and limitations and provides a different picture of the erosion rates. Different methods are mutually complementary and their combination improves the overall understanding of erosion. The selection of a particular method or their eventual combination should reflect the purpose of the study. The specific advantages and disadvantages of the
137Cs method
in comparison to conventional methods will be discussed in Chapter 9.
© F
AO
-IA
EA/E
mil
Fula
jtar

8
© F
AO
-IA
EA/E
mil
Fula
jtar

9
3 Principles of 137Cs method
3.1 Origin and basic characteristics of 137Cs
Caesium (Cs55
) is the heaviest alkali metal (atomic number of 133), that occurs in nature. Alkali metals are known as the most electropositive elements of periodic table and are therefore very reactive. Caesium is rare component of rocks and does not have an important role in soil and life processes. When occurring in soil, it is presented mostly as positively charged cations bounded to mostly negatively charged clay minerals and organic matter (soil colloids).
The natural stable isotope of Cs is 133
Cs. Through human processes a whole range of artificial radioactive isotopes (with atomic mass varying from 125 to 145) can be created. The most important are
134Cs (half-life of t1/2=2.06 years) and
137Cs (t1/2=30.17
years). The 134
Cs resulted from past fallout from nuclear weapon tests and nuclear power plant (NPP) accidents such as Chernobyl and Fukushima-Daiichi. Because of its short half-life the
134Cs isotope is not relevant for soil erosion assessment.
The 137
Cs was formed during nuclear bomb tests as well as NPP accidents as a product of Uranium decay. It further decays resulting in the formation of
137Ba that is a final
product of this decay chain. The decaying 137
Cs emits gamma-rays of high energy (662.66 Kev). Because of its relatively long half-life (30.17 years), the
137Cs is an optimal
erosion tracer. This is an important advantage of 137
Cs as compared to many other environmental radionuclides. Its measurement in environmental samples using gamma spectroscopy is relatively easy and accurate without the need of special chemical separation (Ritchie and McHenry, 1990).
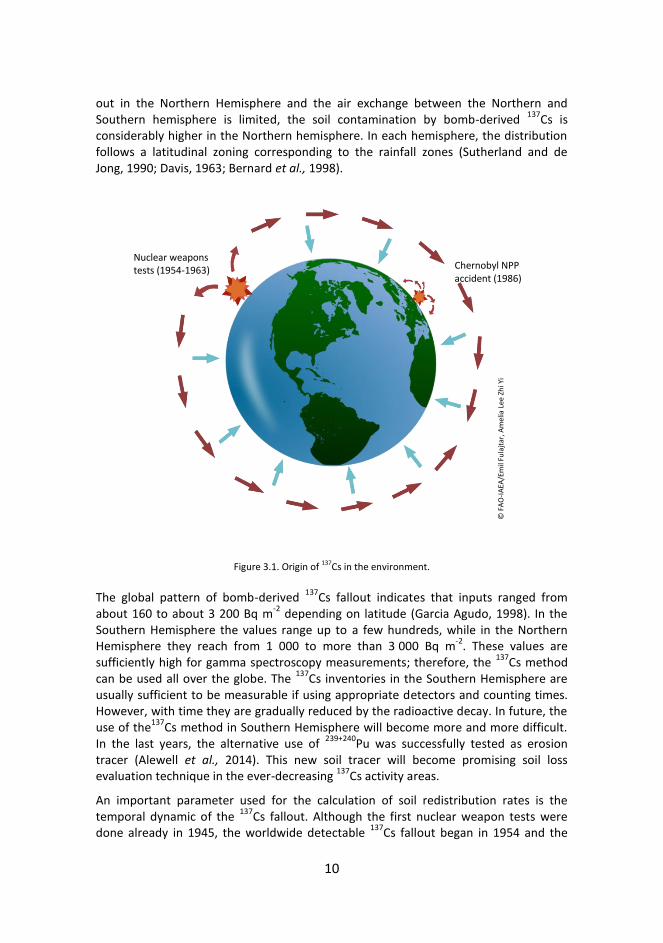
In summary, the main sources of the 137
Cs present in the environment were the atmospheric nuclear weapon tests (bomb-derived
137Cs, or bomb
137Cs) and NPP
accidents among which the most important was Chernobyl accident; therefore the term Chernobyl
137Cs is used (Carter and Moghissi, 1977; Wise, 1980) (Figure 3.1). In
2011, another release of 137
Cs was caused by the Fukushima Daiichi NPP accident, but this
137Cs fallout affected mostly Japan and Pacific Ocean and does not have significant
importance for erosion studies around the world (Miller, 2014).
3.2 Spatial and temporal distribution of 137Cs fallout
In contrast to the NPP-derived 137
Cs injected into the fast, dynamic weather processes of the troposphere, a larger portion of the bomb-derived
137Cs got into the more stable
stratosphere and therefore circulated around the Earth before gradually falling to the Earth’s surface. The latter fallout was associated primarily with precipitation (wet fallout) and the dry fallout was important only locally, around the nuclear test sites (Ritchie and McHenry, 1990).
The spatial distribution of the bomb-derived 137
Cs fallout was determined by a combination of a) the location of the nuclear weapons test sites, b) the air circulation and c) the rainfall distribution pattern. Because most of the weapon tests were carried
10
out in the Northern Hemisphere and the air exchange between the Northern and Southern hemisphere is limited, the soil contamination by bomb-derived
137Cs is
considerably higher in the Northern hemisphere. In each hemisphere, the distribution follows a latitudinal zoning corresponding to the rainfall zones (Sutherland and de Jong, 1990; Davis, 1963; Bernard et al., 1998).
Figure 3.1. Origin of 137Cs in the environment.
The global pattern of bomb-derived 137
Cs fallout indicates that inputs ranged from about 160 to about 3 200 Bq m
-2 depending on latitude (Garcia Agudo, 1998). In the
Southern Hemisphere the values range up to a few hundreds, while in the Northern Hemisphere they reach from 1 000 to more than 3 000 Bq m
-2. These values are
sufficiently high for gamma spectroscopy measurements; therefore, the 137
Cs method can be used all over the globe. The
137Cs inventories in the Southern Hemisphere are
usually sufficient to be measurable if using appropriate detectors and counting times. However, with time they are gradually reduced by the radioactive decay. In future, the use of the
137Cs method in Southern Hemisphere will become more and more difficult.
In the last years, the alternative use of 239+240
Pu was successfully tested as erosion tracer (Alewell et al., 2014). This new soil tracer will become promising soil loss evaluation technique in the ever-decreasing
137Cs activity areas.
An important parameter used for the calculation of soil redistribution rates is the temporal dynamic of the
137Cs fallout. Although the first nuclear weapon tests were
done already in 1945, the worldwide detectable 137
Cs fallout began in 1954 and the
Nuclear weapons tests (1954-1963) Chernobyl NPP
accident (1986)
© F
AO
-IA
EA/E
mil
Fula
jtar
, Am
elia
Lee
Zh
i Yi

11
highest fallout record occurred in 1963. During the second half of the 1960s, the fallout intensity decreased abruptly. Then during the 1970s, a slow decreasing continued and during the first half of the 1980s, the fallout decreased to below detection limit.
The Chernobyl 137
Cs released during the NPP accident in 1986 was injected only into troposphere and it further spread over Russia and Europe in much lower height than the bomb-derived
137Cs. It did not persist in atmosphere as long as the bomb-derived
137Cs but it fell out within a few months. The distribution of Chernobyl
137Cs is very
heterogeneous as its fallout was determined by the rainfall distribution from the end of April-to May 1986. This irregular fallout makes the erosion assessment in Chernobyl affected areas more difficult. The Chernobyl
137Cs fallout increased the existing bomb-
derived inventories by several orders of magnitude in some European areas (WHO, 1986; Anspaugh et al., 1988; Cambray et al., 1987; Mabit et al., 1999). For example in Central Russia the
137Cs inventories after the Chernobyl accident reached 500 000 Bq
m-2
(Golosov et al., 1999). Another example of local 137
Cs fallout from NPP accident happened during Fukushima-Daiichi NPP accident in 2011 (Fukushima-Daiichi
137Cs).
3.3 137Cs behaviour in soil
The early investigations of radionuclide occurrence and transformation in landscape, carried out in the 1960s and 1970s, were focused on their environmental impacts. A number of human-made radionuclides were investigated,
137Cs being among them. It
was found out that 137
Cs is strongly bound to soil colloids and is in principle non-exchangeable (Davis, 1963; Lomenick and Tamura, 1965; Eyman and Kevern, 1975; Ritchie and McHenry, 1990) and its uptake by plants is negligible (Dahlman et al., 1975). The
137Cs, if absorbed by the vegetation, is released to soil after plants die and
decay (Davis, 1963; Rogowski and Tamura, 1970 a,b; Dahlman et al., 1975). A lot of attention was paid to the investigation of the
137Cs vertical distribution (see typical
examples in Figure 3.2).
The investigation of land undisturbed by cultivation showed that the most 137
Cs occurs in the uppermost layer of soil and its content exponentially decreases with the soil depth. Many researchers reported such
137Cs distribution profiles that are similar to
those shown in the Figure 3.2 (Walling and He, 1993; Walling et al., 1999).
As 137
Cs is non-exchangeable, it is not released into soil solution and cannot significantly migrate or take part in the chemical processes running in soil. However, some limited depth redistribution reaching usually 10 to 20 cm results from bioturbation carried by burrowing animals such as earthworms drilling up and down along the soil profile. This causes the slight diffusion of
137Cs to soil layer immediately
below the soil surface. Apart from that, some other physical-chemical processes such as freezing-thawing or wetting-drying of soils can contribute to dynamics in vertical diffusion of
137Cs.
On cultivated land, the redistribution of 137
Cs is primarily the result of mechanical mixing associated with cultivation (e.g. tillage erosion). The
137Cs is homogenously
distributed over the whole depth of plough horizon and below that an abrupt decrease of
137Cs content appears (compare with Figure 3.2).

12
Figure 3.2. Typical vertical distribution of 137Cs in soil profile of undisturbed and cultivated sites (Rabesiranana et. al., 2016).
3.4 General principles of 137Cs method used for soil erosion and sedimentation assessment
Except in some very acid sandy soils, the relative immobility of 137
Cs in agricultural soils under usual environmental conditions is the basic condition enabling its use as a soil erosion tracer. The
137Cs method is based on key assumption about
137Cs baseline
deposition and redistribution:
the 137Cs after (mainly wet) fallout from atmosphere is homogenously
distributed over the landscape and is strongly bound to soil colloids in the uppermost soil layer (Figure 3.3);
it is not significantly leached by water;
it does not migrate as a result of chemical processes;

13
its uptake by plants is negligible; and
it moves only as a result of mechanical processes mobilizing soil particles to which it is bound.
Figure 3.3. Homogenous distribution of the fallen 137Cs in area not affected by soil erosion.
Several mechanical processes of soil redistribution occur in landscape such as bioturbation, erosion, geomorphological processes, or human activities (tillage, digging, mining, construction, etc.). In most landscapes apart from urban areas, erosion is by far the most important among these mechanical processes. The
137Cs method can
serve as assessment of all major erosion processes caused by most common erosion agents such as water, wind and tillage. Most of these processes (splash erosion by raindrops, interrill/sheet erosion through surface water flow, rill erosion by linear runoff, all processes of wind erosion and tillage erosion) contribute to
137Cs
redistribution and are represented by erosion rates estimated by the 137
Cs method. The most advanced processes of linear water erosion, which transport largest volumes of soil and rock material (gully erosion, and fluvial/lateral river bank erosion) can be assessed indirectly by more complex methods, e.g. sediment fingerprinting using
137Cs
together with several other parameters (Walling, 2003).
The principle of the soil erosion assessment is based on the comparison of soil 137
Cs content at landscape positions affected by the soil redistribution dynamics (erosion, transport and sedimentation) to relatively stable landscape position which is not affected by such soil redistribution processes. Provided that
137Cs can be moved only
© F
AO
-IA
EA/E
mil
Fula
jtar
, Am
elia
Lee
Zh
i Yi

14
together with soil particles, then soil enrichment or depletion of 137
Cs at some landscape positions corresponds to removal or input of soil material from the surroundings (Figure 3.4). To assess how much of
137Cs was lost or gained, information
on the original 137
Cs input is needed.
Figure 3.4. Scheme of the 137Cs and soil redistribution by erosion: undisturbed, eroded and deposition site.
To obtain such information a concept of reference site was introduced. A reference site is a stable undisturbed area where neither erosion, nor accumulation took place so it represents the initial
137Cs fallout input (only reduced by radioactive decay). These
stable locations are selected at flat surfaces where water runoff and associated soil erosion cannot originate. Most suitable are somewhat elevated landscape positions such as terraces or denudation plateaus. The lowest landscape positions such as alluvial plains are not suitable because they may be affected by deposition. At some alluvial plains the recent evidences of inundation may be lacking but it is not sure if and when it might occur in the past. Therefore if there is no other choice than to select the reference site at alluvial plain the reliable information on the history of flood is of highest importance.
© F
AO
-IA
EA/E
mil
Fula
jtar
, Am
elia
Lee
Zh
i Yi

15
The 137
Cs inventories at study sites where soil redistribution is expected are compared to that of the stable reference sites. The landscape positions where the
137Cs
inventories are smaller than at the reference site are interpreted as eroded and those positions where they are greater are interpreted as deposition sinks. Those with similar 137
Cs contents are either stable or with a long-term balanced equilibrium of erosion and deposition.
An example of 137
Cs redistribution (at cultivated land) along the slope transect (comprising of stable site, erosion site and deposition site) is provided at Figure 3.5. The transect profiles indicate the reduction of
137Cs content at the slope (as compared
to stable profile at the plateau) and increase of 137
Cs content in valley bottom. The soil erosion and deposition rates can be calculated by conversion models which express the relation between the
137Cs redistribution and soil redistribution (see Chapter 6).
Figure 3.5. Example of the 137Cs redistribution (at cultivated land) along the slope transect, Bohunice site, Slovakia (Fulajtar, 2000).
The detailed description of the 137
Cs method for the assessment of soil redistribution is provided by several guidebooks (Walling and Quine, 1993; Zapata et al., 2002; IAEA, 2014). More information and discussion on the advantages and limitations of the
137Cs
method is provided by Mabit et al. (2013). A comprehensive bibliography on the use of the
137Cs method for various purposes was prepared by Ritchie and Ritchie (2008). A
simple video demonstrating the principles of the 137
Cs method (Fallout Radionuclides in Soil Erosion) was recently developed by the Joint FAO/IAEA Division and is available at http://www-naweb.iaea.org/nafa/resources-nafa/Soil-Erosion-web.mp4.

16
© F
AO
-IA
EA/A
rsen
io T
olo
za

17
4 Site selection and sampling strategy
4.1 Purposes of 137Cs sampling
The sampling design is a critical step for the successful implementation of the 137
Cs method in soil erosion and sedimentation studies. The sampling strategy mainly depends on the study objectives, the geographical focus of the studied area and the heterogeneity of the relief, soilscape and land use.
According to study objectives, three types of studies can be recognised (Zapata et al., 2002):
descriptive studies identify only basic characteristics of the site such as values of 137
Cs activity and basic statistical parameters of datasets, while the spatial aspect is not reflected,
analytical studies comparing two data sets or two studied sites and
spatial distribution studies aimed on mapping of spatial distribution of erosion and sedimentation and calculating spatially related statistical parameters (gross and net erosion and deposition rates).
According to the geographical focus, these four types of soil redistribution studies can be recognised:
plot, field or hillslope studies
floodplain studies
catchment (or watershed) studies, and
reservoir sedimentation studies.
The most studies are aimed at mapping of erosion redistribution at field (or hillslope) scale. In order to evaluate a sediment hillslope budget, they include a reference site with nearly no erosion, a sediment source area (erosion>deposition), a transport area (erosion=deposition) and a sink area (erosion<deposition).
The investigations of reference sites can be classified as descriptive studies. In this chapter only sampling strategies for reference site and soil redistribution at field scale will be presented and discussed.
4.2 Study site selection, scale and data collection
For each intended study, a main objective must be formulated. Before selecting the study site, it should be investigated whether the erosion is active there. Erosion phenomena (for example rills and gullies, sink depressions, soil particles sorted by sheet runoff, etc.) can be observed and the farmers, municipal representatives or other local stakeholders familiar with the area should be interviewed. It is useful to select an area where the basic climate data are accessible, some soil survey has already been performed, the topographical data for DTM are available and land use history is known. The selected study site should not be too large to reduce the heterogeneity

18
and complexity of processes. Its size should correspond to research budget and staff number availability to ensure appropriate sample density. Later the study area can be extended.
The collection of environmental and management data (background) should be done like for any other field pedological study (such as soil survey, land management or crop nutrition field experiments, etc.). Available pedological literature (including unpublished manuscripts and grey literature) related to the area of interest should be investigated. Interviewing of land managers or stakeholders (e.g. landowners or agricultural and municipal employees) in the area about current and historic events and management practices is highly recommended. They can provide key information on land use/cover changes, land management, climate, unusual weather events, erosion features, landslides, etc. The data collection should be dedicated at those pedological, climatic, land use and socio-economic data that are related to erosion and sedimentation processes.
Reconnaissance survey of the selected study area should 1) verify and interpret the collected background information; 2) complement missing geographical, climate, soil and land use information; 3) assess to which extend the area was/is disturbed by human activities, and 4) identify potential reference sites. Especially the latter task is very important. If an appropriate reference site is not available nearby the study site, it should be considered to select other study site locations in area where the reference site would be available. Especially in areas affected by Chernobyl
137Cs the reference
and study sites should be very close to each other because the fallout heterogeneity of Chernobyl
137Cs is much higher than that of bomb
137Cs.
4.3 Selection of undisturbed reference sites
The reference sites should be selected at flat surfaces where neither erosion nor sedimentation took place since the beginning of
137Cs fallout in early 1950s. These sites
should be preferentially at least slightly elevates (plateaus) as the low elevated areas (such as alluvial plains) could be affected by flood and sedimentation.
The reference site should be as close to the study site as possible. According to the original concept of the
137Cs method the reference sites have to be selected in
grassland (Zapata et al., 2002; Mabit et al., 2014). The grassland was understood as the most appropriate land use type as it is considered to be undisturbed and sufficiently homogenous.
In some areas no undisturbed land is suitable for reference sampling can be identified. This happens usually in the following environments:
Mountainous areas with sloping topography;
Areas strongly affected by wind erosion including sand dune movements;
Heavily managed or engineered landscapes such as urbanised, residential, industrial, mining or densely populated mixed use areas where most of land is disturbed by various human activities.

19
In such cases when reference site is not available the following approaches can be used:
The reference value can be estimated using information on 137
Cs fallout. In some countries, the monitoring of radionuclide fallout has been recorded. In those countries where the data on fallout distribution are not available, the 137
Cs fallout can be estimated using the yearly precipitation amount and the latitude of the study site. Several equations directly relating
137Cs atmospheric
fallout to the average annual precipitation of study area have been developed in Canada, Europe and Australia (Bernard et al., 1998; Basher, 2000);
The initial fallout can be evaluated using the software package of Walling et al. (2002). The parameters needed are: longitude, latitude and the annual precipitation of the area under investigation. However, such estimation of fallout is not possible for countries affected by the Chernobyl or other NPP accident fallout as such fallout was very heterogeneous and did not depend on the long term global air circulation;
Adopting the reference values from studies carried in surrounding or nearby areas with similar conditions;
If no information on initial 137
Cs input can be gained, the 137
Cs method cannot provide quantitative estimates of soil erosion rates but it can be used for relative or qualitative characterization of overall trends in soil distribution within a study area. An example of such study in mountainous area affected by Chernobyl fallout was performed by Froehlich et al. (1993).
4.4 Reference site data collection
When starting any soil sampling for 137
Cs determination, the thickness of 137
Cs contaminated layer should be determined to ensure that the whole
137Cs inventory
would be involved in the samples. This is achieved through depth incremental sampling. The depth incremental sampling enables also to assess the
137Cs distribution
profile.
According to this profile, it can be distinguished whether the soil was disturbed by human activities or affected by erosion and deposition. At the undisturbed land, the 137
Cs should be concentrated within the upper few centimetres of the soil profile and the decrease with soil depth should be exponential. At the cultivated site the
137Cs
activity is homogeneous throughout the whole thickness of ploughed horizon and below it the
137Cs concentration drops abruptly.
When the depth distribution of 137
Cs is known, the bulk core samples can be taken. The depth of core samples should exceed the actual depth of
137Cs contaminated layer by
10 cm (or at least 5 cm), to ensure that all 137
Cs is included in the sample. The reference site should be sampled along a regular grid. It is recommended that each sampling point should be represented by three replicate cores, which are bulked to constitute one sample for analysis. The number of samples depends on the variability of
137Cs inventories at the reference site. It depends on random variability of soil

20
properties such as soil bulk density, infiltration capacity, cracking and stoniness, the effects of vegetation cover and roots, etc. It is recommended that the variation coefficient of reference sample sets does not exceed 30 percent (Shutterland, 1996).
4.5 Sampling strategy at field scale
The sampling density depends on the study area, relief variability and the budget available. Three sampling design strategies can be adopted (Figure 4.1):
the individual transect (A);
the multiple transects (B) and
the regular grid (C).
Figure 4.1. Basic sampling designs (Mabit et al., 2014).
The individual transect approach is seldom used. It is useful for reconnaissance surveys or in other cases of preliminary investigations and other situations when more comprehensive sampling is not possible (for time or budget constraints, etc.). The multiple transect approach is based on the assumption that the variability of erosion and deposition processes is lower across the slopes than along the slopes. Therefore, the density of sampling points across the slope does not need to be as dense as along

21
the slopes. This approach allows a more rational use of resources than the grid approach and is useful especially on steep, short and homogeneous slopes where no significant across-slope curvature exists. The number of samples along transect depends on the slope length and shape. The number of transects depends on the slope width, but generally at least three transects should be sampled. The grid approach is used when the topography is more complex (e.g. slopes with significant planar curvature).
More complex sampling designs (such as fan-like multiple transect design, composed designs involving both regular grids and multiple transects or regular grids with different densities) can be used if the relief or study objectives require a more complex picture on
137Cs distribution.
4.6 Sample collection and sampling tools
Two methods are commonly used to collect soil samples:
bulk sampling and
depth incremental sampling.
Bulk samples can be collected by steel cylinder that is inserted to soil throughout the whole depth of
137Cs contaminated layer. This depth should be investigated by depth
incremental sampling that should be done prior to bulk sampling. The diameter of the tube is usually 7 to 10 cm (Wallbrink et al., 2002) with a wall thickness of 5 mm adapted to investigate stony and compacted soil. To facilitate the core extrusion, the cutting edge of the tube should have a smaller internal diameter than the tube itself (Walling and Quine, 1993). The tube can be inserted manually by hammering or mechanically if using a motorized soil column cylinder auger set (Figure 4.2).
The depth incremental sampling helps to provide information on the 137
Cs depth distribution (vertical distribution over the soil profile). This is a key knowledge requested at the reference site and also at the study sites with uncultivated land as the conversion models for uncultivated land are based on
137Cs depth distribution. The
depth incremental sampling requires special devices designed for this purpose, which are able to collect thin layers of soil (1, 2 or maximum 5 cm thick). The most common tool for depth incremental sampling is the scraper plate (Campbell et al., 1988; Loughran et al., 1992; Walling and Quine, 1993; Loughran et al., 2002). It comprises a metal frame that is fixed on the soil surface and the metal plate which can move within the frame. The soil layers can be scraped successively by this metal plate. The plate can be shifted successively following the selected depth intervals. More precisely the soil layers can be cut by the Fine Increment Soil Collector (FISC) developed by the SWMCN Laboratory (Mabit et al., 2014). This device can cut thin layers within a few mm thick. If special sampling tools for incremental sampling are not available, the incremental samples can be obtained through slicing the bulk cores.

22
Figure 4.2. Soil samples collection using a motorized soil column cylinder auger.
4.7 Collection of additional background information
The important part of the erosion investigation is to study and collect data of environmental or management processes that impact the erosion factors and therefore, erosion rates and spatial soil redistribution. Erosion is controlled especially by rainfall, soil properties, topography, and vegetation cover. At cultivated land the land management and human activities are other factors to be considered. The interpretation of the
137Cs data and erosion rates calculated from
137Cs inventories
requires information on selected characteristics of erosion factors. Various approaches can be used to cover this item. The following minimal data set is recommended:
Topographical data:
© F
AO
-IA
EA/L
ion
el M
abit

23
Geographical coordinates: latitude, longitude and altitude should be recorded by using Global Positioning Systems (GPS) or ideally by GPS-enabled sampling devices.
GPS-indexed photographs of study and each sampling locations: the detailed photographical documentation is extremely valuable. It can help to illustrate the locations in addition to any quantitative data (Figure 4.3). It is recommended to make photographs of each location from various angles and if possible from an elevated viewpoint before and after sampling (use of flags). In addition the detailed photographs of each particular transect or sampling point is useful.
Slope inclination: The field measurements of the inclination of each or multiple slope segments between particular sampling points within transect are required. Except of uniform slope segments, it is not sufficient to calculate the inclination from GPS data of variable slope segments as this approach may result in significant error (depending on the accuracy of the GPS used).
Slope length: The field measurements of the distances between particular sampling points within transect are required. One may use distance measurement between sample locations and/or slope break points using measurement tapes or distance lasers. As for slope inclination, slope distances based on calculations from GPS only is not recommended.
Figure 4.3. GPS-referenced photo documentation of sample location.
Climate/Weather data:
© U
niv
ersi
ty a
t B
uff
alo
/Ch
ris
S. R
ensc
hle
r

24
Precipitation: For erosive events the most detailed sequence of rainfall intensities per time period (year, month, day, hour, minute), event pluviographs (e.g. rainfall intensity graph recorded with a tipping bucket) or the total precipitation amounts per event duration are the most important since rainfall intensities determine the amounts of soil being detached and infiltration rates will determine surface runoff rates for erosion and transport. Standing water on soil will act as protection reduce the detachment of soil.
Other climate parameters: Various parameters can be considered depending on the purpose of the study, use of models, etc. Maximum and minimum air temperature during an event will especially help to consider the effects of freezing and thawing of the precipitation and water in/on the soil. Together with dew point temperature and wind velocity the influence of evaporation and evapotranspiration would help to assess the antecedent soil moisture before a precipitation event. The solar radiation might also be helpful to determine the soil surface temperature as well as related parameters for plant/vegetation growth.
Station location(s) and measurement method(s): the spatial and temporal variability of weather data will assist to determine the variability of precipitation and weather events along a hillslope or with a catchment. In the latter case there might be multiple weather stations (Figure 4.4) available and interpolation methods for each climate parameter might be required (arithmetic mean, Thiessen polygons, isohyetal methodology.
Figure 4.4. Weather station, Prague, Czech Republic.
© U
niv
ersi
ty a
t B
uff
alo
/Ch
ris
S. R
ensc
hle
r
25
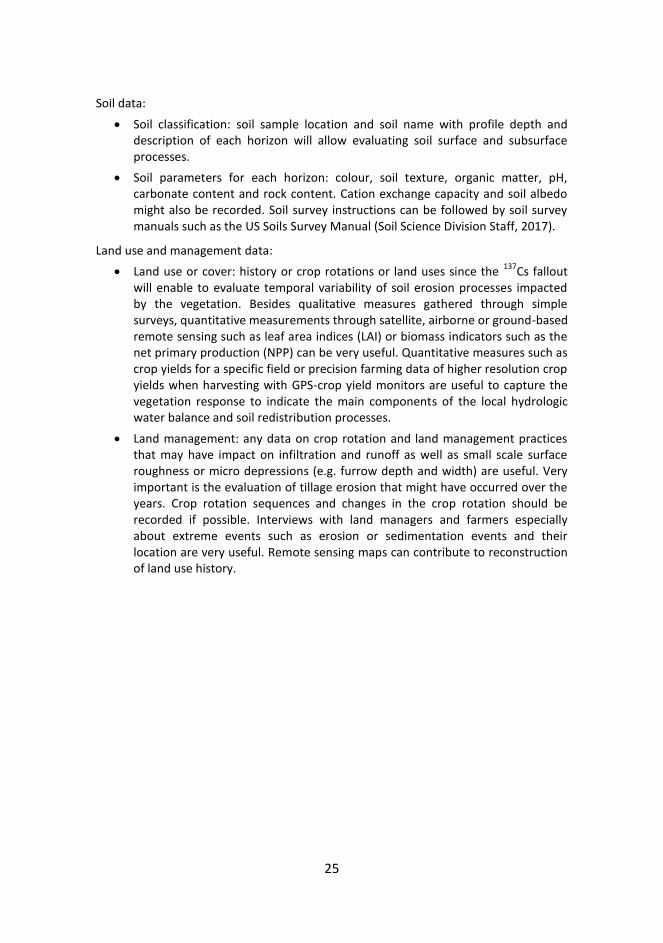
Soil data:
Soil classification: soil sample location and soil name with profile depth and description of each horizon will allow evaluating soil surface and subsurface processes.
Soil parameters for each horizon: colour, soil texture, organic matter, pH, carbonate content and rock content. Cation exchange capacity and soil albedo might also be recorded. Soil survey instructions can be followed by soil survey manuals such as the US Soils Survey Manual (Soil Science Division Staff, 2017).
Land use and management data:
Land use or cover: history or crop rotations or land uses since the 137
Cs fallout will enable to evaluate temporal variability of soil erosion processes impacted by the vegetation. Besides qualitative measures gathered through simple surveys, quantitative measurements through satellite, airborne or ground-based remote sensing such as leaf area indices (LAI) or biomass indicators such as the net primary production (NPP) can be very useful. Quantitative measures such as crop yields for a specific field or precision farming data of higher resolution crop yields when harvesting with GPS-crop yield monitors are useful to capture the vegetation response to indicate the main components of the local hydrologic water balance and soil redistribution processes.
Land management: any data on crop rotation and land management practices that may have impact on infiltration and runoff as well as small scale surface roughness or micro depressions (e.g. furrow depth and width) are useful. Very important is the evaluation of tillage erosion that might have occurred over the years. Crop rotation sequences and changes in the crop rotation should be recorded if possible. Interviews with land managers and farmers especially about extreme events such as erosion or sedimentation events and their location are very useful. Remote sensing maps can contribute to reconstruction of land use history.

26
© F
AO
-IA
EA/A
rsen
io T
olo
za

27
5 Analysing 137Cs data: gamma spectroscopy
5.1 Samples preparation
The gamma radiation emitted by environmental radionuclides occurring in soil is usually measured by laboratory gamma detectors (Figure 5.1) in soil samples which are collected in field and transported to laboratory. The sample preparation should involve the following steps (Walling and Quine, 1993; Pennock and Appleby, 2002):
Air drying or oven drying at 60°C;
Weighing;
Grinding of large aggregates to pass through 2 mm mesh;
Sample homogenization;
Sieving the fine earth (0-2 mm);
Weighing both fine and coarse fractions;
If the sample exceeds the quantity required for analysis, a representative sub-sample (e.g. 50 to 1 500 g depending on the counting geometry) of the fine fraction is submitted for analysis.
Figure 5.1. Laboratory gamma detector in lead shield and with nitrogen cooling (CNESTEN, Morocco).
© C
NES
TEN
/Mo
nce
f B
enm
anso
ur

28
However, it is possible to use also portable gamma detector (Figure 5.2) which can be carried to field and measure the in situ gamma radiation. The advantage of this approach is the acquiring of mean activity values representing large area. For assessment of soil redistribution processes it is better and more precise to interpret the soil samples measured in laboratory, but the portable detector can be used for reconnaissance surveys to check the overall range of activity levels. It is very helpful especially in Chernobyl affected areas where the
137Cs inventories are very variable.
Figure 5.2. Portable gamma detector installed at selected study site (CNESTEN, Morocco).
5.2 Basic principles of gamma spectrometry
The 137
Cs is one of the radionuclides easiest analysed by gamma spectroscopy. Its measurement is facilitated by its clear energy peak at relatively high energy (662.66 Kev) that does not interfere with other existing radionuclides Therefore
137Cs can be
measured by standard gamma detectors, which are not sensitive to low energies.
As such measurement is not destructive, the soil samples analysed by gamma spectrometry can then be used further to perform other analyses such as basic soil analyses (e.g. soil texture, pH, organic matter content).
The principle of gamma ray detection is based on the interaction of gamma rays with germanium crystal, which emits electric signals when being exposed to gamma rays.
© C
NES
TEN
/Mo
nce
f B
enm
anso
ur

29
These signals are characteristics for particular radionuclides and are recognized by the analyser and presented as peaks at the screen of computer connected to analyser. Each radionuclide can have one or several characteristic peaks at certain energetic level. The
137Cs is characterized by well identifiable peak at energy of 662 keV (Figure
5.3). The collected spectral data are converted into activity of gamma radiation expressed in Bq kg
-1. The radionuclide activity per weight unit (mass activity) is
converted into inventory (activity per unit area) expressed in Bq m-2
.
The methodology of gamma radiation detection and the equipment used underwent significant development since the mid-20
th century. Traditionally, gamma
spectroscopic analytical set comprises of high purity germanium semiconductor detector (HPGe detector) equipped with amplifier and connected to a multichannel analyser (MCA) and computer with software for data assessment. The detectors operate at very low temperatures and need efficient cooling. Usually liquid nitrogen is used in these processes but electrical cooling system is also a viable option. They need also lead shielding because the radiation of environmental samples is very low and the background radiation in laboratory needs to be eliminated.
Figure 5.3. Example of the main 137Cs peak at 662 keV in gamma spectrum of soil sample.
Operating a gamma spectroscopic analytical set requires an experienced and skilled staff. The result of the measurement and its accuracy depends on several key factors such as the sample quantity and its activity, the counting time and the sample geometry. A gamma detector should be calibrated (using special multi gamma sources produced for this purpose) and the assessments of the measurement errors should be regularly checked (using specific reference materials).
© F
AO
-IA
EA/A
rsen
io T
olo
za

30
© F
AO
-IA
EA/L
ion
el M
abit

31
6 Conversion of 137Cs data to soil loss values
The last key step of soil erosion and deposition assessment with the 137
Cs method is the conversion of
137Cs data sets into soil erosion and deposition rates. Although the
amount of eroded soil is directly proportional to 137
Cs activity redistribution, the quantitative mathematical expression of this relation is complex. The methodology underwent long development; several different approaches were tested and validated. They can be separated into two groups:
empirical models and
theoretical models.
The empirical models are based on calibration of 137
Cs activities with erosion rates
measured at experimental plots. These are statistical models; therefore, they require the use of equations with parameters that fit the observations. The derived equations are site and time specific; they express the correlation between reduction of total
137Cs
inventory X (%) and soil loss Y (t ha-1
y-1
) and usually they have a form of exponential equations such as Y=aX
b or Y= a
X (with a, b as constants). These equations were
developed in the early stage of the 137
Cs method development (Ritchie and McHenry, 1975; Elliot et al., 1990; Loughran and Campbell, 1995).
The disadvantage of empirical relations was overcome by theoretical models that are based on the logical assumptions and algorithms for calculation of soil redistribution rates. A different theoretical assumptions are needed to express the conditions at undisturbed and at cultivated land because at undisturbed sites the
137Cs is
concentrated near the soil surface and it decreases exponentially with the depth. At cultivated land the
137Cs is distributed homogeneously over the plough horizon and
decreases abruptly immediately below the lower boundary of ploughed horizon (Figure 6.1). This difference requires different algorithms for soil loss calculation. Therefore, the models are usually grouped in two different groups:
models for undisturbed land
models for cultivated land.
Several models were developed at Exeter University, UK (Walling and Quine, 1990; Walling and He, 1999) and they represent an integrated set that was worked out as user-friendly PC software (Error! Reference source not found.). The software package can be downloaded from the website of the SWMCN Subprogramme http://www-naweb.iaea.org/nafa/swmn/models-tool-kits.html. The handling of this IT tool is very user-friendly. The dialogue window offers to select a particular model. The next steps are to fill the input data to predefined cells and finally it provides estimate of soil redistribution rates.
The calculation of soil erosion and deposition rates at undisturbed site is based on 137
Cs inventories and the
137Cs depth distribution. Two approaches are used. The more
simple approach considers the fixed 137
Cs fallout input and stable 137
Cs profile distribution. The depth distribution over the soil profile is mathematically described. If this distribution is characterized by simple mathematical function then the soil loss can

32
be estimated by the proportion of the 137
Cs reference value removed at the examined site. This approach is used for the Profile Distribution Model (PDM). A more comprehensive approach takes into consideration time variant processes of: 1) the 137
Cs fallout and 2) the gradual post-depositional redistribution of 137
Cs within the soil profile, which is caused predominantly by bioturbation and several other processes. This approach is used by the Diffusion and Migration Model (DMM).
Figure 6.1. Exponential depth distribution of 137Cs at undisturbed (left) and homogenous at cultivated (right) site requiring different concepts of conversion models.
The calculation of soil loss at cultivated land can be based on two theoretical concepts. The first one called proportional concept is very simple and it presumes that the removal of soil and
137Cs are directly proportional. Models based on this concept are
called the Proportional Model (PM).
More complex approaches involve a mass balance concept, which considers the temporal dynamics of
137Cs inputs and outputs resulting in the time-variant
concentration of 137
Cs in soil. These changes in concentration affect considerably the relation between the
137Cs loss and soil loss caused by erosion. The
137Cs concentration
in soil is controlled by several processes. Most important are 1) time variable 137
Cs fallout, 2) radioactive decay of
137Cs (i.e. 30.17 years), 3) removal of freshly deposited
137Cs by erosion prior to its incorporation into plough horizon by tillage, and 4)
incorporation of subsoil material free of 137
Cs or having low 137
Cs content into eroded ploughed horizon by tillage.
The Mass Balance Models (MBM) were developed in mid-1980s. Different models use different approaches to handle the
137Cs time-variant concentration in soil and
consider some but not all processes and factors controlling it. More recently three mass balance models were initially developed by Walling and He (1999) are used, e.g. Mass Balance Model 1 (MBM1), Mass Balance Model 2 (MBM2) and Mass Balance
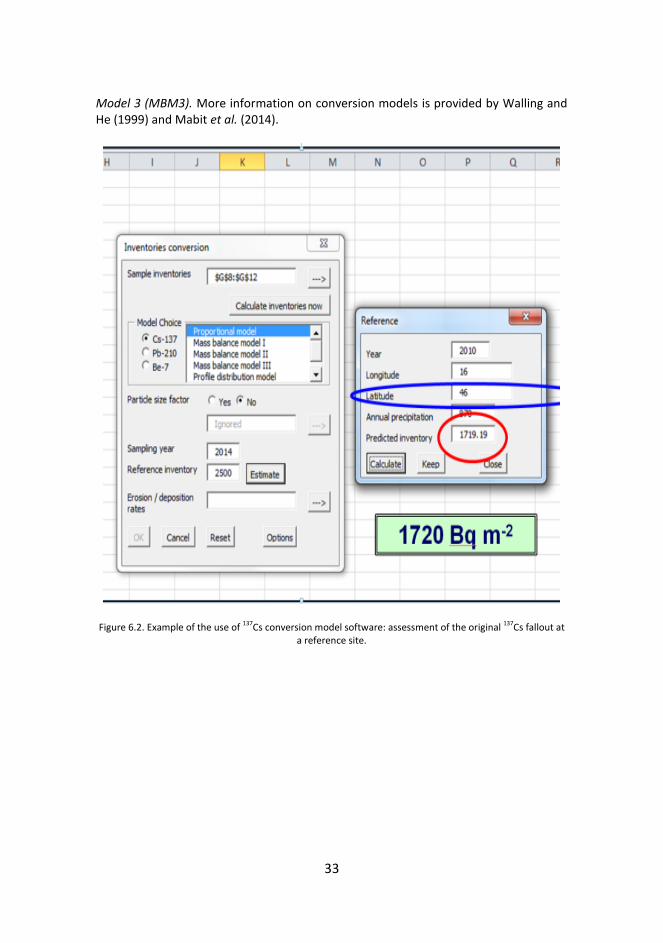
33
Model 3 (MBM3). More information on conversion models is provided by Walling and He (1999) and Mabit et al. (2014).
Figure 6.2. Example of the use of 137Cs conversion model software: assessment of the original 137Cs fallout at a reference site.

34
© F
AO
-IA
EA/A
rsen
io T
olo
za

35
7 Data analysis, interpretation and presentation
7.1 Reference site
The validation of estimated initial 137
Cs fallout for an undisturbed reference site is a key requirement to get reliable values of soil redistribution rates for nearby sample sites affected by erosion or deposition.
The first criteria for reference site selection are flat topography and knowledge on land use/land cover history. The data interpretation at the reference site should be supported by descriptive statistics (average value, standard deviation, coefficient of variation) of the area
137Cs inventories and by the
137Cs depth distribution. Two
features typical for distribution of 137
Cs at land undisturbed by post-depositional soil redistribution can help to validate the selection of the reference site and the representativeness of the obtained reference value: (1) the
137Cs vertical depth
distribution and (2) the horizontal spatial variability (the homogeneity of the initial 137
Cs fallout).
A valid selection of a reference site should fulfil at least these two conditions:
The spatial variability of the 137
Cs fallout at the local scale (high and low values in a small area) should be as low as possible. It should be characterised by descriptive statistic as suggested by Sutherland (1991, 1996), Owens et al. (1996) and Mabit et al. (2012). A value of the coefficient of variation (CV) below 30 percent is a good indicator of a stable and undisturbed reference site. The number of soil samples needed to assess accurately the reference site (generally around 10 samples) depends on the variability and can be calculated considering the value of the CV.
At reference site a clear exponential decrease of the 137
Cs activity with depth (around 80 to 90 percent of the
137Cs included in the first 20 cm of the soil) is
expected.
7.2 Presentation of the results of studies at field scale
At a studied field, the following 137
Cs information should be established:
137
Cs inventories (Bq m-2
) representing the total 137
Cs activity per area unit at the sampling points, and
137
Cs depth distribution along the vertical soil profiles (activity in Bq kg-1
per selected depth intervals in cm).
The inventories are calculated from the 137
Cs mass activity (see Chapter 5.2). Comparison between the inventories at the studied field and the reference site allows identifying the erosion and deposition zones. This
137Cs spatial distribution permits to
represent a soil erosion and sedimentation pattern. Its variability can be studied in relation to land use, soil proprieties and especially relief, e.g. the
137Cs distribution
along the slope transects (Figure 7.1).

36
Figure 7.1. Example of the 137Cs distribution along the slope transects (A-H) at Jaslovske Bohunice, Slovakia. The 137Cs inventories are decreasing from plateaus to slopes and increasing in valley bottom where they
reach their maximum values (Fulajtar, 2003).
The 137
Cs depth distribution profiles, associated with cultivated and/or uncultivated land, allow to see the profile shapes and to verify that they conform to the expected behaviour of
137Cs in erosion and deposition areas.
Assuming an adequately representative sampling design, the 137
Cs inventory error depends mostly on the determination found
by gamma spectrometry. Soil erosion or
deposition rates for each sampling point are quantified using conversion models to convert the total activity of
137Cs or inventory (Bq m
-2) to erosion and/or deposition
rates (t ha-1
yr-1
), which were described in chapter 6. Obtained values of soil redistribution rates can be presented with the aid of the following parameters (Quine and Walling, 1991; Walling and Quine, 1993; Mabit et al., 2014):
Erosion zone: the part of the studied field affected by erosion (area of studied field multiplied by the ratio of eroded sampled profiles and all sampled profiles);
0
1000
2000
3000
4000
5000
6000137C
s in
ven
tory
Slope position
A
B
C
D
E
F
G
H
I
Mean

37
Deposition zone: the part of the studied field affected by deposition (area of studied field multiplied by the ratio of sampled profiles with deposition and all sampled profiles).
Mean erosion in the erosion zone: the total mass of eroded soil material divided by the area affected by erosion;
Mean deposition in the deposition zone: the total mass of deposited soil material divided by the area affected by deposition;
Gross erosion in entire field: the total mass of eroded soil material divided by total area of studied field;
Gross deposition in entire field: the total mass of deposited soil material divided by total area of studied field;
Total erosion: the sum of all erosion values;
Total deposition: the sum of all deposition values;
Net erosion: the amount of soil leaving the studied field;
Sediment Delivery Ratio: the ratio of net and gross erosion.
7.3 Data interpolation and soil redistribution mapping
The measured 137
Cs inventories and soil redistribution rates calculated by conversion models represent point data which are arranged in a grid over the area of interest. Such a data set provides valuable information not only on the soil redistribution rates but on the spatial variability of soil redistribution as well. The quality of this information depends on the processing of point data and creation of soil redistribution maps. If a Digital Elevation Model (DEM) is available the 3D-visualisations of soil redistribution can be made (Figure 7.2). Various simple or more sophisticated interpolation approaches can be employed. To obtain more realistic results, it is recommended to use advanced approaches for spatial interpretation of data. Geostatistical methods such as kriging can take into account the spatial variability based on the distance between points and even based on directions of processes (e.g. soil movement along a flow direction).
7.4 Data interpretation, utilization and communication
For interpretation and utilization of erosion assessments for practical purposes it is crucial to agree upon and implement a terminology that is easy to understand and that enables stakeholders to take actions. The concept of a tolerable (or target) soil loss (T-value) (Figure 7.3) describes the boundary between acceptable (legend of quarters of T in green) and unacceptable soil loss (multiple of T in red). Even though there is no defined tolerable negative soil loss, the amount of deposition is illustrated in two classes: below and above the negative T value (yellow colours).

38
Figure 7.2. Example of 3-D visualisation of soil redistribution, Marchouch, Morocco. (Benmansour et al., 2013).
The identification of likely source areas such as upslope or upstream areas (on-site) and likely deposition areas such as down slope or down steam areas (off-site) enables a spatial identification of stakeholder responsibility (Figure 7.3). This enables stakeholders to put
137Cs erosion/deposition values into perspective and stakeholders
can better communicate to find an agreement on how to interpret the results and turn them into actionable items such as policies and regulations to recognize the problem and find Best Management Practices (BMP) solutions.
The data obtained through the 137
Cs method have a historical information value what happened accumulatively since mid-1950s until the day of the measurement. This long-term data can then be used for various purposes among which the following are most important:
Long-term erosion rate monitoring (this could be a couple of points);
Investigation of the relative long-term temporal dynamic and spatial distribution of erosion rates (this requires more points; ideally in a raster pattern);
Study of impact of erosion factors on long-term erosion rates at different/neighbouring sites;
Verification, calibration and validation of soil erosion models;
Testing the long-term efficiency of soil and water conservation measures (or BMPs).

39
Figure 7.3. The concept of tolerable soil loss for stakeholders to put measurements (e.g. 137Cs) and modelling (e.g. WEPP simulations) into actionable management.
The last purpose is very important to evaluate BMPs in land management (e.g. zero tillage, buffer strips, strip cropping, etc.) and to develop comprehensive, long-term soil conservation strategies and policies. If stakeholders want to assess short-term processes, the
137Cs data should be done repetitively (adjacent to the previous sample
location) combined with short-term observations of soil redistribution such as plot or catchment studies. In contrast to total annual (or average annual) on-site soil loss, event-based runoff and sediment yield data is collected at the lower boundary of a plot or even at the catchment outlet. A nested watershed approach with multiple outlet measurement points would be exceptional for researchers, but would be hard to implement at multiple locations due to costs. This event-based observation data together with long-term point data of
137Cs samples, however, enables to successfully
develop, validate and apply spatially distributed, process-based, continuous soil loss models.
Once such a process-based model is calibrated and validated for a particular hillslope site it can be used to assess soil redistribution based on a variety of scenarios representing changes in soil or vegetation management. If there are sufficient event-based climate data available the models can be used to derive statistical parameters to generate realistic long-term weather patterns (Meyer et al., 2008). There is also the opportunity to introduce climate change pattern and generate scenarios to assess the risk of runoff and sediment discharges of certain return periods of precipitation events (e.g. 100-year return periods of events without and with climate changes in temperature or precipitation).
© U
niv
ersi
ty a
t B
uff
alo
/Ch
ris
S. R
ensc
hle
r

40
© F
AO
-IA
EA/E
mil
Fula
jtar

41
8 137Cs method – validation and use of erosion models
In contrast to just mathematically interpolating 137
Cs sample points, scientists have collected information on erosion processes and developed process-based models that enable them to fill the information gaps between sample points on the basis of understanding the processes in landscapes.
Since the development of the first, widely applied soil erosion model – the Universal Soil Loss Equation (USLE) by Wischmeyer and Smith (1958) - numerous regional and national versions of the empirical-USLE-type models were developed (e.g. Boardman and Poesen, 2006). These empirical soil loss equations were derived based on runoff and sediment yield data collected at the end of unit plot areas of a certain hillslope length. Alternatively, observations of the exposure depth of a physical marker over a particular time period, e.g. erosion pins, would quantify the eroded or deposited soil at a particular point along or at the end of a longer, sometimes complex hillslope with no inflow at the upper boundary. Such long-term empirical models were developed based on a large amount of quantitative data for a specific region, but when they should be applied in other region they need to be calibrated and validated by similar amounts of data collected in that region.
The 137
Cs method does the same as the erosion pins, but without the intensive instrumental setup for a fixed starting point and it covers a long period (since mid-1950s or after a NPP fallout). Once at studied slope the
137Cs measurement is
established, the follow up measurement campaigns (e.g. every 5 to 10 years) are able to provide multi-temporal data indicating the dynamics of erosion rates. Combining the
137Cs method and empirical USLE-type, long-term soil erosion models enable us to
calibrate and validate the models for a reference slope and furthermore the model can be used to extrapolate the information to surrounding fields. However, the original development of the model relies on a specific, uniform plot scale (USLE standard slope length is 22.13 meters) that is usually much shorter than the variable, complex slopes prevailing in real landscapes. There is no accounting for confluence or diversion of flow patterns within those plots. Therefore,
137Cs data in a raster grid sample pattern has
the potential to validate models for complex hillslopes and validated models can be applied at neighbouring hillslopes and in an entire catchment.
The 137
Cs method is a unique way to create landscape erosion pattern since mid-1950s that can be compared not only with single hillslope models, but also spatially-distributed soil erosion models. Models that are capable of simulating soil redistribution along complex hillslopes and/or flow patterns have been developed since half a century. These soil loss and redistribution pattern can then be used together with runoff and sediment discharge data and gaging stations to create entire landscape budgets of water and sediment. Besides plot and hillslope data, floodplain and reservoir data of
137Cs samples and total measures of sediments or sediment fluxes
help to describe these landscape budgets.
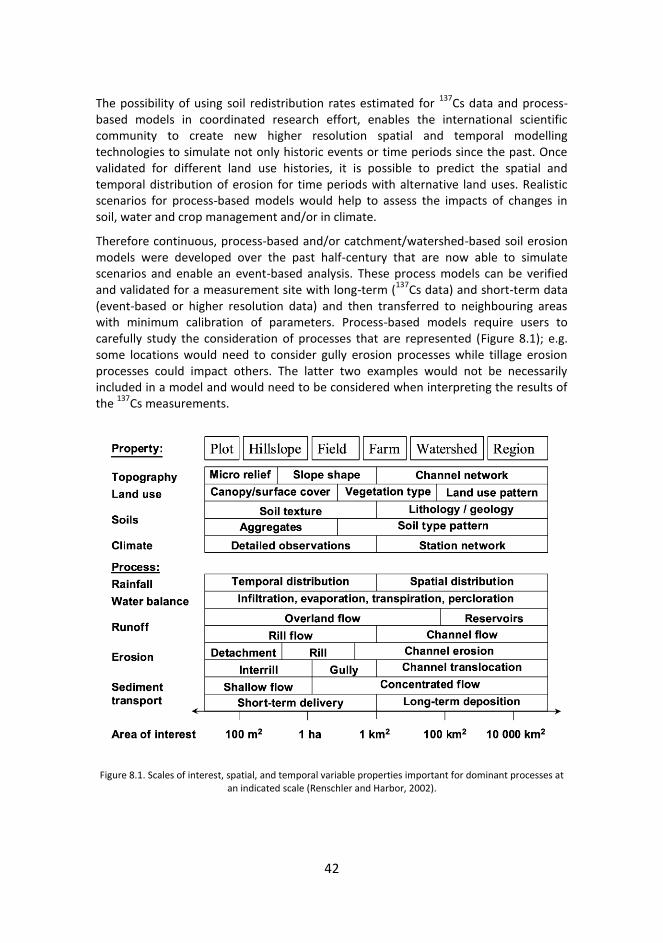
42
The possibility of using soil redistribution rates estimated for 137
Cs data and process-based models in coordinated research effort, enables the international scientific community to create new higher resolution spatial and temporal modelling technologies to simulate not only historic events or time periods since the past. Once validated for different land use histories, it is possible to predict the spatial and temporal distribution of erosion for time periods with alternative land uses. Realistic scenarios for process-based models would help to assess the impacts of changes in soil, water and crop management and/or in climate.
Therefore continuous, process-based and/or catchment/watershed-based soil erosion models were developed over the past half-century that are now able to simulate scenarios and enable an event-based analysis. These process models can be verified and validated for a measurement site with long-term (
137Cs data) and short-term data
(event-based or higher resolution data) and then transferred to neighbouring areas with minimum calibration of parameters. Process-based models require users to carefully study the consideration of processes that are represented (Figure 8.1); e.g. some locations would need to consider gully erosion processes while tillage erosion processes could impact others. The latter two examples would not be necessarily included in a model and would need to be considered when interpreting the results of the
137Cs measurements.
Figure 8.1. Scales of interest, spatial, and temporal variable properties important for dominant processes at an indicated scale (Renschler and Harbor, 2002).

43
8.1 137Cs data: finding right model and scale
Given the critical importance of assessing the impact of temporal and spatial variability in soil erosion parameter data at different scales (Figure 8.1), surprisingly little emphasis has been placed on this in soil erosion simulation tool development and evaluation for practical decision making (Renschler and Harbor, 2002). In modelling, shorter time scales are typically associated with smaller spatial scales because finer time resolution requires more detailed modelling of hydrological and sediment transport processes, which usually means consideration of variability at more detailed spatial scales (Kirkby, 1998). At different scales, different groups of processes are dominant, so the effective focus of the model also changes with scale. Most modern watershed models focus on the prediction of water fluxes for particular space and time scales (Figure 8.1; Renschler and Harbor, 2002).
Hydrologic processes are often described in ways that depend on the model’s scale. But the scale in which the model is designed to operate influences decisions about the level of spatial aggregation in input data, analysis, and model output. However, when the problem of interest is not at the scale of the model, scaling both data and model results is very complex (Renschler et al., 1999). For example, empirical, process-based approaches to predict sheet and rill erosion rates can provide reasonable results to evaluate environmental and economic impacts of agricultural policy on a large scale (Carriquiry et al., 1998), but do not yield accurate predictions of erosion variability on the field scale.
Nearing et al. (2005) provides an overview of a series of state-of-the-art soil erosion models and illustrates results of a model performance comparison for a particular site based on scenarios with changes in vegetation cover and climate change. Models that are widely used include the Revised Universal Soil Loss Equation (RUSLE) – an upgraded version of the empirically-based USLE (Renard et al., 1997), the Limburg Soil Erosion Model (LISEM) (Jetten et al., 1998), the kinematic runoff and erosion model KINEROS (Smith et al., 1995), the widely-used Soil Water Assessment Tool (SWAT) (Arnold et al., 1999) for larger watersheds, and the process-based Water Erosion Prediction Project (WEPP) model for single or multiple hillslopes in small watersheds (Flanagan and Nearing, 1995).
Renschler (2003) developed the Geospatial Interface of WEPP (GeoWEPP) enabling a geospatial application of the WEPP model using GIS data to assess the impacts of spatial and temporal land management and/or climate change through scenarios. Geospatial tools like the Geospatial Interface for the WEPP model (Renschler, 2003) use the idea of a T-value to assist stakeholders in the quest for understanding the history of soil erosion, floods and sedimentation and also assess predictions of land use or climate change scenarios in the future.
The soil loss pattern can then be compared with point-based 137
Cs measurements as well as runoff and sediment yield data at a catchment outlet (Figure 8.2). The event-based runoff and sediment yield measurements enable to compare model results with observations at the watershed outlet.

44
Figure 8.2. 137Cs-based soil loss and simulated soil loss based on generated weather.
8.2 137Cs data and process modelling: powerful new tools
Validated process-based models enable scientists and practitioners then to create new, powerful scientific soil loss prediction tools to support better soil and water conservation decision-making and policy-making through “what if”-scenarios (Figure 8.3). They also help to better plan and deal with contaminated soils after a NPP disaster or accident with radioactivity being released.
Figure 8.3. Modelling of soil erosion for selected crop rotation scenarios, Guadalteba Watershed, Andalusia, Spain (Renschler, 1996).
© U
niv
ersi
ty a
t B
uff
alo
/Ch
ris
S. R
ensc
hle
r

45
It can be concluded that the experience with combined use of the 137
Cs method of erosion assessment and erosion modelling brought up to now the following new developments:
The 137
Cs method can be used for soil conservation in combination with erosion models. This combined approach may provide more comprehensive assessment of soil erosion involving information on long-term mean soil erosion rates and detailed spatial patterns of soil redistribution (provided by
137Cs) as well as
various scenarios of short-term soil erosion dynamics under different land uses and managements (provided by erosion models).
The 137
Cs method can be used for calibration and validation of erosion models. Most easily it can be used for calibration and validation of empirical models such as the USLE because the USLE or USLE-type empirical models are working with empirical factors, such as rainfall erosivity or R-factor, that can be expresses in annual cumulative values. This approach is close to long-term mean soil erosion rates derived from
137Cs inventories. Despite of their
simplicity the USLE is still very useful for soil conservation because it is not demanding for a lot of input data and thus can be applied for large territories.
Very helpful for calibration and validation of erosion models is the combined use of
137Cs and conventional methods (experimental plots, hydrological
profiles) to create catchment (or watershed) models. These models can provide water and sediment budget calculations that are especially useful for water resource management and planning such as water reservoirs.
Apart from the information on erosion rate the 137
Cs data provides very valuable information especially on spatial distribution of soil redistribution rates. Calibration and validation of erosion models is usually based on erosion measurements at experimental plots and suspended sediment load measurements at water courses in small catchments. These data represent usually very few spatial locations. This limited spatial information can be significantly extended by
137Cs data which are usually related to large number of
locations creating grid over the area of interest.
Use of 137
Cs data for calibration and validation of process-based (or physically based) models, which are built on event-based data are more challenging. However
137Cs data points in the landscape provide the ultimate measured
pattern for process-based models for a particular time period (since mid-1950s or after a NPP disaster). The complex calibration and validation of detailed process-based models may require a much larger, coordinated data collection of input parameters. However, those validated model could then be used without further calibration when transferred into neighbouring areas with similar climate and land use.
The use of the 137
Cs method for erosion models calibration and validation requires special emphasis on the systematic collection of input data in addition to
137Cs data. The data set should be accommodated according to the needs of

46
each particular model to be used. For that reasons it is important to know prior to developing study design whether the intended
137Cs study will be used for
erosion models and for which model. The use of older 137
Cs data sets is often problematic because some complementary geographical data are missing and must be estimated or generated using secondary methods, which reduce their accuracy and representativeness.
The use of the 137
Cs method either in combination with erosion models or for their calibration and validation can be done by two approaches: 1) the retrospective approach (using
137Cs data from one time horizon and assessing
the period between the 137
Cs fallout and the time of 137
Cs sampling), or 2) the monitoring approach collecting
137Cs data from several (at least two) time
horizons and assessing the periods between these time horizons). If using this approach, it is recommended to repeat the
137Cs sampling once upon 5 or 10
years. This approach is very demanding for precise recording of the sampling positions, because if the later sampling would not fit to the position of the former sampling the values would not be comparable.
When using 137
Cs data for calibration and validation of erosion models, it is important to use multiple transect design and ensure that transects follow the slope direction (and hence the runoff direction). The regular grid is less appropriate as the erosion models consider the relations along the slope or runoff contributing areas. It is possible to use also data sets from regular grids but in such case the operator should try to identify the mutual relation between the data points considering the slope directions and the representativeness of the results is lower as the points from the regular grid will mostly not be arranged in lines along the slope directions.
When using 137
Cs data in combination with other methods (such as conventional measurements of soil erosion rates, erosion modelling, remote sensing or experimental rain simulation) the interpretation should always carefully consider the different erosion processes, spatial and temporal scales covered by particular methods. Most erosion models estimate water erosion processes at slope, plot or small catchment scales. Some models are aimed solely either on wind or on tillage erosion. Each conventional erosion measurement method covers different processes. The experimental plots represent the sheet and initial stages of rill erosion, the volumetric method represents rill and gully erosion and the suspended sediment load measurements at hydrological profiles represents erosion by those rills and gullies which are interconnected with water courses and bank erosion by water course. Most measurements represent the temporal scales of event, season, year or several years. The
137Cs
method represents overall rates of soil redistribution by all processes and it covers long periods either since the
137Cs fallout (recently 64 years; 1954-2018)
or various medium term periods (e.g. the periods between two samplings if the 137
Cs is sampled repeatedly). These differences in processes and temporal and spatial scales represented by different methods should be always carefully considered when comparing the results from different methods.

47
8.3 Example of using 137Cs method for WEPP model verification in Morocco
To illustrate the benefits for a combined 137
Cs measurement transect and a hillslope modelling study, a recently studied transects along a single 90m-long hillslope (within a 1-hectare field section of a small agricultural watershed near Marchouch, Morocco was used (Benmansour et al., 2013). Like most of the
137Cs measurements taken so far, the
measurement design was not planned with a modeling exercise in mind. A coordination of modeling exercise and data sampling in the field would enable to consider flow pattern and accumulation as well as conversion and diversion of flow in the landscape. The flow path can be determined by using contour lines of a topographic map (Figure 8.4) or a flow accumulation algorithm on a DEM in a GIS. Therefore the following study should be seen as an example to illustrate what can be done with already existing data.
The 90m-transect with a 10m-distance between each of the nine 137
Cs measurement location is an ideal distribution for a landscape section with parallel sheet flow to verify and validate a process-based erosion model at the hillslope scale. The previously mentioned Water Erosion Prediction (WEPP) model (Flanagan and Nearing, 1995) was used in this study for illustration purposes.
Figure 8.4. Direction of contour lines and crop rows at Marchouch study site, Morocco.
© C
NES
TEN
/Mo
nce
f B
enm
anso
ur

48
Besides the topographic data of the slope (slope segment length and slope degrees), the WEPP model requires long-term climate data (in this case generated 100-year worth of data based on the precipitation dynamic of a couple of years of standard meteorological data from a nearby station were utilized), soil-sampling data (standard soil survey data such as soil profiles with soil texture, organic matter, rock content as well as some estimated model parameters such as hydraulic conductivity and shear stress), and land use data (a continuous winter wheat rotation was the best assumption since detailed crop data for the past 60 years are missing). More details on data gathering, model parameters estimation and model equations can be taken from Flanagan and Nearing (1995).
Figure 8.5 illustrates the difference between hillslope profile (red line) and the relative erosion (green line). The grey-shade curve at the bottom of the graph illustrates erosion along the slope ranging from nearly 25 t ha
-1 yr
-1 in the upper section of the
slope and deposition values of more than 25 t ha-1
yr-1
at the bottom of the slope.
Figure 8.5. Soil Redistribution – WEPP vs. Isotope Derived Transect at Marchouch, Morocco.
The 137
Cs measurements for each of the nine sample locations (Table 8.1) were used to make the erosion rate estimation. Gained values were categorized to four classes: slight erosion up to 10 t ha
-1 yr
-1 (orange), medium erosion between 10 and 20 t ha
-1 yr
-
1 (red), strong erosion more than 20 t ha
-1 yr
-1 (bold red) and deposition (green). The
sampling and model simulation do not match exactly, but they match the overall soil redistribution pattern and the order of magnitude.
For a more detailed analysis one should use the GIS and model to determine the flow path first and then sample the
137Cs measurement points accordingly. This illustrates
that GIS, sampling and modelling can and should be ideally used in combination to contribute to more comprehensive understanding of soil redistribution. As previously indicated a range of values of input parameters such as climate and land use can be
© U
niv
ersi
ty a
t B
uff
alo
/Ch
ris
S. R
ensc
hle
r

49
applied to evaluate various scenarios that may help to identify the optimal land use policy.
Table 8.1. Land use and Climate Change analysis using 100-years of generated weather, Marchouch, Morocco.
a) Winter wheat (conventional tillage)
Period Precipitation (mm y-1)
Runoff (mm y-1)
Soil Loss (kg m-2 y-1)
Sediment Yield (t ha-2 y-1)
Current 415.8 42.4 2683 26.1
2030 395.9 41.7 2869 27.8
2060 374.6 40.7 2955 28.7
2090 348.2 42.2 3521 34.1
b) Fallout (without vegetation)
Period Precipitation (mm y-1)
Runoff (mm y-1)
Soil Loss (kg m-2 y-1)
Sediment Yield (t ha-2 y-1)
Current 415.8 107.0 5874 58.7
2030 395.9 102.5 5631 56.3
2060 374.6 96.3 5341 53.4
2090 348.2 90.3 4990 49.9

50
© F
AO
-IA
EA/K
aizz
i Kay
uki

51
9 Advantages of 137Cs method
The methodology of soil erosion rate assessment and measurements is a result of almost 100 years of research. Several methods were developed and refined (e.g. volumetric methods, geodetic methods, erosion plots, hydrological methods, radionuclide methods, etc.) by the contributions of the international scientific community. Each method has different assumption, principle, covers different spatial and temporal segments of erosion-sedimentation cycle, and reflects particular soil redistribution processes participating in this cycle. Therefore the data obtained cannot be schematically compared. Each presented dataset has to be specified in terms of method used, temporal and spatial scale covered and particular processes represented. Moreover, each method has its advantages and limitation, which should be considered already before starting any study and the method most appropriate for the study objective should be selected. Some methods are complementary and can provide useful results if used jointly.
The 137
Cs is an excellent tracer for studying soil erosion processes. It is the more mature and most widely used FRN for soil erosion assessment. Its wide applicability was demonstrated by the bibliography provided by Ritchie and Ritchie (2008). The 137
Cs method has the following advantages, modified according to Mabit et al. (2008) and Zupanc and Mabit (2010):
The obtained data represent long-term (recently over six decades since the 137
Cs fallout until the sampling period) soil redistribution rates. This is probably the main asset provided by the
137Cs method. Long- or medium-term data on soil
redistribution magnitudes are difficult to acquire by conventional methods and they are very valuable for studying the development of landscape and soilscape. Data can be used for soil conservation programmes and for soil erosion model validation.
The obtained values represent an overall soil redistribution rate integrating all processes responsible for mechanical movement of soil particles (e.g. water, wind and tillage erosion), eventually other processes, such as gravitation processes (creep, landslides, etc.). This is an advantage for studies focused on overall assessment of erosion impact on landscape development. Data on overall erosion rates is very scarce. Among the conventional methods, only the geodetic method (erosion pins) reflects the impact of all erosion processes. Most other conventional methods reflect particular processes of water erosion. Measurements at experimental plots provide information only on initial stages of water erosion (rill and sheet erosion). Volumetric methods reflect advanced stages of rill erosion and gully erosion. Hydrological methods represent advanced stages of rill and gully erosion and linear erosion by permanent watercourses such as riverbed erosion and riverbank erosion. Other specific methods have been designed for specific investigation of erosion processes other than water erosion (e.g. tillage and wind erosion).
The obtained values provide retrospective information. It is a unique feature that past erosion rates can be estimated from samples collected at present

52
time. Retrospective data cannot be gained by conventional methods. The 137
Cs method can provide perspective data if the
137Cs sampling is periodically
repeated in time.
The obtained data provide information on the spatial distribution of soil redistribution rates if the sampling design is based on grid or multiple transects (Figure 9.1). This is a clear advantage as compared to conventional methods (such as erosion plots or hydrological method), which provide data attributed to one or few profiles with installed measurement equipment.
There is no need for costly and labour intensive long-term monitoring programs. The fieldwork required is easy to manage. The results can be obtained from a single site visit or short field campaigns.
Figure 9.1. Sampling grid for 137Cs determination and the resulting map of soil redistribution created by ordinary kriging, Boyer Site, Canada (Mabit et al., 2008)
53
10 Activities performed by the Joint FAO/IAEA Division and further perspectives
The 137
Cs method is today widely used by the international erosion research community and has gained much popularity since the 1990s when user-friendly models for converting
137Cs inventories into soil redistribution rates became widely available.
Since 1995 – when the Joint FAO/IAEA Division launched its first CRP on the assessment of erosion by FRNs, it has become one of the leading institutions developing these FRN methods. Probably the most important results of upgrading the FRN methodology to a higher level are the methodological handbooks published by Zapata, 2002 and IAEA, 2014. The Joint FAO/IAEA Division is refining the
137Cs method
also through applied research conducted at its laboratories in Seibersdorf.
Apart from research activities, the Joint FAO/IAEA Division, through IAEA technical cooperation projects (TCPs), disseminates the
137Cs method to FAO and IAEA Member
States. Until now, this specific technical support was provided to more than 70 countries worldwide.
All necessary information about the activities of the Joint FAO/IAEA Division in research and technical cooperation on the
137Cs methods and other related FRNs and
isotopic techniques is available through the SWMCN Subprogramme website http://www-naweb.iaea.org/nafa/swmn/index.html, the Soils Newsletter and the Annual Reports of the SWMCN Laboratory http://www-naweb.iaea.org/nafa/swmn/public/newsletters-swmcn.html.
In future, particular attention will be paid towards extending the use of the 137
Cs method to the assessment of soil conservation efficiency and to erosion modelling. The assessment of soil land use and management impact and soil conservation efficiency has been extensively developed. CRPs provide examples of such studies, including the assessment of terracing in Morocco and Madagascar (Benmansour et al., 2013; Rabesiranana et al., 2016).
The potential of using the 137
Cs method for validating the models has not been fully recognized yet. Erosion rates estimated by the
137Cs method can be used to cross-
validate the erosion models and test the scenarios to find optimal land and soil management strategies and policies for sustainable food production. The
137Cs method
can be used also to monitor soil erosion and sedimentation dynamics if the sampling is repeated at the same side either periodically or occasionally (for example after extreme erosion events). Combining the
137Cs method with other FRNs (such as
210Pb
and 7Be) can provide more comprehensive information on erosion dynamics and
spatial distribution.

54
Glossary
Activity - the concentration of radionuclide in measured sample detected through its radiation and expressed in Becquerel per unit mass.
Alkali metals – group of elements (column in the Mendeleev’s periodic table) involving lithium (Li), sodium (Na), potassium (K), rubidium (Rb) caesium (Cs) and francium (Fr) characterized by high reactivity at normal atmospheric temperatures and pressures. Alkali metals readily lose their outermost electron and form cations with +1 charge.
Bomb-derived 137
Cs - 137
Cs unintentionally released to the atmosphere by the past surface nuclear weapons tests.
Chernobyl accident – Accident of nuclear power plant in Chernobyl, Ukraine (26th
April 1986).
Chernobyl 137
Cs - 137
Cs released to atmosphere by the Chernobyl Nuclear Power Plant (NPP) accident.
Cosmogenic radionuclides – natural radionuclides (such as 3H,
7Be,
14C,
32P) originated
as a result of cosmic ray spallation of atoms (expelling of neutrons and protons from the atom nucleus by high energy cosmic rays). The only cosmogenic radionuclide important for erosion research is
7Be that is formed by spallation of
nitrogen and oxygen.
Deposition – complex of geomorphological process depositing of soil or rock material mobilised and transported from other areas. Deposition takes place usually (but not necessarily) in depressions or low elevated, flat areas when the transporting agent loses the kinetic energy and the transported material exceeds the transporting capacity of the transporting agent. The deposition by wind can occur also on elevated and convex landforms.
Erosion - complex of geomorphological processes driven by several erosion agents (water, wind, tillage, snow, animals, etc.) accusing detachment and removal of soil or rock particles from land surface in affected area.
Erosion rate – amount of soil or rock material eroded from unit area during unit time. Usually it is expressed either as mass in tons per hectare pre year or as volume in mm per year.
Erosion plot – most commonly used conventional approach of erosion measurements. The erosion is quantified for certain land area fenced by artificial boundaries (such as metal sheets). The soil eroded by surface runoff is captured to collection tanks.
Fallout radionuclides – radionuclides that are getting to terrestrial and aquatic environment by fallout from atmosphere. This term was introduced in erosion research and refers to those radionuclides which are usable as erosion tracers (i.e. 137
Cs, 210
Pb, 7Be,
239+240Pu). The fallout is dry and wet (washing by rainfall).
Gamma detector – analytical equipment aimed on measurement of the gamma radiation.

55
Gamma radiation – one of three types of electromagnetic radiation (alfa, beta and gamma radiation) emitted by unstable radioactive nuclei of atoms (radionuclides). Gamma radiation corresponds to emission of photons and is the strongest of the three main radiation types. It does not have mass and charge and travels much further that alfa and beta radiation.
Gamma spectrometry – analytical method for determination of gamma radiation emitted by radionuclides based on assessment of their energy spectra.
Geogenic radionuclides – natural radionuclides originating from bedrock substratum. For erosion research the most important geogenic radionuclide used as erosion tracer is
210Pb, which originates as a product of
238U radioactive decay series. Part of
the 222
Rn, which is one of the decay product of this series evaporates from soil to atmosphere and is decomposing to
210Pb, which falls to land surface and ocean.
Half-life – period during which half of the amount of radioactive isotope decays (its activity is half of the original activity).
Human-induced radionuclides – radionuclides introduced into environment by human activity. For erosion research the most important human-induced radionuclides, which may be used as erosion tracers are
137Cs,
239Pu and
240Pu released from
surface nuclear weapon tests.
Inventory - activity of radionuclide per surface area representing the amount of radionuclide occurring in soil within the unit surface area.
Isotope – atom that differs from the other atom of the same chemical element by number of neutrons. Isotopes can be either stable or radioactive.
Kriging - a widely used method in spatial analysis of interpolation modelling using a Gaussian process utilising distance-weighted averages.
Multislot divisor – device used for splitting runoff at erosion plots in order to save the storage space of collector. Using this device enables to collect only small fraction of the runoff.
Parshal fume – hydrological device serving as artificial hydrological profile on small watercourses for measurements of discharge and picking samples for measurements of suspended load.
Radioactive decay – the process of decomposition of unstable isotopes (radionuclides) by emitting radiation and gradual losing part of the energy and mass until the radionuclide is transformed to stable isotope.
Radionuclide – isotope which is unstable due to having an excess energy in its nucleus. It emits radiation and gradually loses energy and mass until it is transformed to stable isotope.
Reference site – well representative site where the 137
Cs inventory is not affected by erosion, accumulation or other geomorphological processes moving soil material such as gravitation processes (landslides, creep, solifluction) neither by human processes of land mass translocation (construction, building mining activities). The reference site represents the original fallout input of
137Cs reduced only by
radioactive decay.

56
Reference slope – the term used in erosion modelling for a series of measurement points along a linear slope transect which is used as a “reference” for validating a model for a hillslope segment that can be used to extrapolate results to other similar hillslopes. It should not be confused with reference site used for FRN methods.
Sedimentation – originally referring to processes of deposition of soil and rock particles from water (sedimentation in narrow sense). In wider sense, it refers also to all processes of soil and rock deposition by all transporting agents when they lose the transporting capacity.
Tipping bucket – device used for measurement of discharge and suspended sediment at erosion plots. It comprises of one or two containers having oblique shapes. Such containers when filled by collected runoff lose balance and flip over. As a consequence of flipping, water is poured and the container returns to its original position. The flipping motion is recorded by a counter. While flipping small portion of water with suspension is trapped by pipe and drained to sample container to be used for measuring suspended sediment load.
Undisturbed site – land that is not disturbed by human activities, especially agricultural practices (e.g. tillage).
57
References
Alewell, C., Meusburger, K., Juretzko, G., Mabit, L., Ketterer, M.E., 2014. Suitability of 239+240
Pu and 137
Cs as tracers for soil erosion assessment in mountain grasslands. Chemosphere 103. 274-280.
Anspaugh, L.R., Catlin, R.J., Goldman, M. 1988. The global impact of the Chernobyl reactor accident. Science, 242. 1513–1518.
Arnold, J.G., Srinivasan, R., Muttiah, R.S., Allen, P.M., 1999. Continental space simulation of the hydrologic balance. Journal of the American Water Resources Association, 35 (5), 1037– 1051.
Basher, L.R., 2000. Surface erosion assessment using 137
Cs: examples from New Zealand. Acta Geologica Hispanica, 35. 219–228.
Benmansour, M., Mabit, L., Nouira, A., Moussadek, R., Bouksirate, H., Duchemin, M., Benkdad, A., 2013. Assessment of soil erosion and deposition rates in a Moroccan agricultural field using fallout
137Cs and
210Pbex. Journal of Environmental
Radioactivity, 115. 97–106.
Bernard, C., Mabit, L., Laverdière, M.R., Wicherek, S., 1998. Césium-137 et érosion des sols. Cahiers Agricultures, 7. 179–186.
Bernard, C., Mabit, L., Wicherek, S., Laverdière, M.R., 1998. Long-term soil redistribution in a small French watershed as estimated from
137Cs data. Journal of
Environmental Quality, 27. 1178–1183.
Boardman, J. and Poesen, J. (eds). 2006. Soil Erosion in Europe. Wiley. 878 p.
Cambray, R.S., Cawse, P.A., Garland, J.A., Gibson, J.A.B., Johnson, P., Lewis, G.N.J., Newton, D., Salmon, L., Wade, B.O., 1987. Observations on radioactivity from the Chernobyl accident. Nucl. Energ., 26. 77–101.
Cambray, R.S., Playford, K., Carpenter, R.C., 1989. Radioactive fallout in air and rain: results to the end of 1988. AERE-R-10155. U.K. Atomic Energy Authority Report, Harwell, UK.
Cambray, R.S., Playford, K., Lewis, G.N.J. 1985. Radioactive fallout in air and rain: results to the end of 1984. AERE-R-11915. U.K. Atomic Energy Authority Report, Harwell, UK.
Cambray, R.S., Playford, K., Lewis, G.N.J., 1983. Radioactive fallout in air and rain: results to the end of 1982. AERE-R-10859. U.K. Atomic Energy Authority Report, Harwell, UK.
Campbell, B.L., Loughran, R.J., Elliott, G.L., 1988. A method for determining sediment budgets using caesium-137. International Association of Hydrological Sciences Publication, 174. 171–179.
Carriquiry, A.L., Breidt, F.J., Lakshminarayan, P., 1998. Sampling schemes for policy analyses using computer simulation experiments. Environmental Management 22 (4). 505– 515.
Carter, M.W. and Moghissi, A.A., 1977. Three decades of nuclear testing. Health Physics, 33. 55–71.

58
Dahlman, R.C., Francis, C.W., Tamura, T., 1975. Radiocesium cycling in vegetation and soil. 462-481. In: F.G. Howell, Gentry, J.B., and Smith M.H., (eds.), Mineral cycling in southeastern ecosystems, USAEC Symposium Series, CONF-740513, US Atomic Energy Commission, Washington, DC.
Davis, J.J., 1963. Cesium and its relationship to potassium in ecology. 539–556. In: V. Schultz and A.W. Klement Jr. (eds.), Radioecology, Reinhold, New York.
Elliott, G.L., Campbell, B.L., Loughran, R.J., 1990. Correlation of erosion measurements and soil caesium-137 content. Applied Radiation and Isotopes, 39. 1153-1157.
Eyman, L.D. and Kevern, N.R., 1975. Cesium-137 and stable cesium in a hypereutrophic lake. Health Physics, 28. 549–555.
Flanagan, D.C. and Nearing, M.A., 1995. USDA-water erosion prediction project: hillslope profile and watershed model documentation. NSERL Report, vol. 10. USDA-ARS National Soil Erosion Research Laboratory, West Lafayette, IN. 1196– 47097.
Frere M.H. and Roberts H.J., 1963. The loss of strontium-90 from small cultivated watersheds. Soil Science Society of America Proceedings 27. 82-83.
Froehlich, W., Higgitt, D.L., Walling, D.E., 1993. The use of cesium-137 to investigate soil erosion and sediment delivery from cultivated slopes in the Polish Carpathians. 271-283. In: S. Wicherek (ed.), Farmland erosion, Elsevier, Amsterdam.
Fulajtar, E., 2000. Assessment of soil erosion trough the use of 137
Cs at Jaslovske Bohunice, Western Slovakia, Acta geológica hispánica 35/3. 291-300.
García Agudo, E., 1998. Global distribution of Cs-137 inputs for soil erosion and sedimentation studies. In: Use of Caesium-137 in the Study of Soil Erosion and Sedimentation. IAEA TECDOC 1028. 117-121.
Golosov, V.N., Panin, A.V., Markelov, M.V., 1999. Chernobyl 137
Cs redistribution in the small basin of the Lokna River, Central Russia. Physics and Chemistry of the Earth, Part A: Solid Earth and Geodesy, 24 (10). 881–885.
Graham, E.R., 1963. Factors affecting Sr-85 and I-131 removal by runoff water, Water sewage works 110. 407-410.
IAEA, 2014. Guidelines for Using Fallout Radionuclides to Assess Erosion and Effectiveness of Soil Conservation Strategies, IAEA TECDOC No. 1741. 215 p.
Jetten, V.G., De Roo, A.P.J., Guerif, J., 1998. Sensitivity of the model LISEM to variables related to agriculture. In: Boardman, J., Favis-Mortlock, D., (Eds.), Modelling Soil Erosion by Water, NATO ASI Series I, Global Environmental Change, vol. 55. 339–350.
Kirkby, M.J., 1998. Modelling across scales: the MEDALUS family of models. In: Boardman, J., Favis-Mortlock, D. (Eds.), Modelling Soil Erosion by Water. NATO ASI Ser., Ser. I, vol. 55. Springer-Verlag, Berlin, Germany. 161–173.
Lal R., 1994. Soil Erosion Research Methods, Soil and Water Conservation Society (U. S.), CRC Press. 352 p.

59
Lomenick, T.F. and Tamura, T., 1965. Naturally occurring fixation of cesium-137 on sediments of lacustrine origin. Soil Science Society of America Proceedings 29. 383–386.
Loughran, R.J., and Campbell, B.L., 1995. The identification of catchment sediment sources. In: Foster, I.D.L., Gurnell, A.M., Webb, B.W., (Eds.), Sediment and Water Quality in River Catchments. Wiley, Chichester. 189 – 205.
Loughran, R.J., Campbell, B.L., Shelly, D.L., Elliot, G.L., 1992. Developing a sediment budget for a small drainage basin in Australia. Hydrological Processes. 6. 145–158.
Loughran, R.J., Pennock, D.J., Walling, D.E., 2002. Spatial Distribution of Caesium-137. In: Zapata, F. (Ed). Handbook for the Assessment of Soil Erosion and Sedimentation Using Environmental Radionuclides. 97-109.
Mabit, L., Benmansour, M., Walling D.E., 2008. Comparative advantages and limitations of Fallout radionuclides (
137Cs,
210Pb and
7Be) to assess soil erosion and
sedimentation. Journal of Environmental Radioactivity, 99(12). 1799–1807.
Mabit, L., Bernard, C., Makhlouf, M., Laverdière, M.R., 2008. Spatial variability of erosion and soil organic matter content estimated from
137Cs measurements and
geostatistics, Geoderma 145, 245–251.
Mabit, L., Bernard, C., Wicherek, S., Laverdière, M.R., 1999. Les retombées de Tchernobyl, une réalité à prendre en compte lors de l’utilisation de la méthode du Césium-137. In : Paysages agraires et environnement. Principes écologiques de gestion en Europe et au Canada. CNRS ed. 285–292.
Mabit, L., Chhem-Kieth, S., Dornhofer, P., Toloza, A., Benmansour, M., Bernard, C., Fulajtar, E., Walling, D.E., (2014).
137Cs: a widely used and validated medium-term
soil tracer. In: Guidelines for using Fallout radionuclides to assess erosion and effectiveness of soil conservation strategies. 27–77. IAEA-TECDOC-1741.
Mabit, L., Chhem-Kieth, S., Toloza, A., Vanwalleghem, T., Bernard, C., Amate J.I., González de Molina, M., Gómez, J.A. 2012. Radioisotopics and physicochemical background indicators to assess soil degradation affecting olive orchards in southern Spain. Agriculture, Ecosystems & Environment, 159. 70–80.
Mabit, L., Meusburger, K., Fulajtar, E., Alewell, C., 2013. The usefulness of 137Cs as a tracer for soil erosion assessment: A critical reply to Parsons and Foster (2011), Earth-Science Reviews 127, 300-307.
Mabit, L., Meusburger, K., Iurian, A.R., Owens, P.N., Toloza, A., Alewell, C., 2014. Sampling soil and sediment depth profiles at a fine-resolution with a new device for determining physical, chemical and biological properties: the Fine Increment Soil Collector (FISC). Journal of Soils and Sediments, 14(3). 630–636.
Menzel, R., 1960. Transport of strontium-90 in runoff. Science 131. 499-500.
Meyer, C. R., Renschler, C. S., Vining, R. C., 2008. Implementing Quality Control on a Random Number Stream to Improve a Stochastic Weather Generator. Hydrological Processes, 22(8). 1069-1079.
Miller, C.W., 2014. Fukushima Accident: Radioactivity Impact on the Environment, Health Physics 107/3. 265-266.

60
Nearing, M. A., Jetten, V., Baffaut, C., Cerdan, O., Couturier, A., Hernandez, M., Le Bissonnais, Y., Nichols, M.H., Nunes, J.P., Renschler, C.S., Souchère, V., van Oost, K., 2005. Modelling response of soil erosion and runoff to changes in precipitation and cover. Catena, 61. 131–154.
Owens, P.N. and Walling, D.E., 1996. Spatial variability of caesium-137 inventories at reference sites. An example from two contrasting sites in England and Zimbabwe. Applied Radiation and Isotopes, 47. 699–707.
Owens, P.N., Walling, D.E., He, Q., 1996. The behaviour of bomb-derived Caesium-137 fallout in catchment soils. Journal of Environmental Radioactivity, 32. 169–191.
Pennock, D.J. and Appleby, P.G., 2002. Site selection and sampling design. In: Zapata, F., (Ed.), Handbook for the Assessment of Soil Erosion and Sedimentation using Environmental Radionuclides. Kluwer Ac. Publ., Dordrecht, The Netherlands. 15–40.
Quine, T.A. and Walling, D.E., (1991). Rates of soil erosion on arable fields in Britain: quantitative data from caesium-137 measurements. Soil use and management, 7 (4), 169–176.
Rabesiranana, N., Rasolonirina, M., Solonjara, A.F., Ravoson, H.N., Andriambololona, R., Mabit L., 2016. Assessment of soil redistribution rates by
137Cs and
210Pbex in a
typical Malagasy agricultural field, Journal of Environmental Radioactivity 152. 112-118.
Renard, K.G., Foster, G.R., Weesies, G.A., McCool, D.K., Yoder, D.C., 1997. Predicting soil erosion by water—a guide to conservation planning with the revised universal soil loss equation (RUSLE). Agricultural Handbook, vol. 703. U.S. Government Printing Office, Washington, DC.
Renschler, C.S, 1996. Soil erosion hazard mapping by means of geographical information systems (GIS) and hydrological modelling. MSc, Technical University of Braunschweig, Braunschweig, 95 p.
Renschler, C.S., 2003. Designing geo-spatial interfaces to scale process models: The GeoWEPP approach. Hydrological Processes, 17. 1005–1017.
Renschler, C.S. and Harbor, J., 2002. Soil erosion assessment tools from point to regional scales - The role of geomorphologists in land management research and implementation. Geomorphology 47. 189-209.
Renschler, C.S., Mannaerts, C., Diekkrüger, B., 1999. Evaluating spatial and temporal variability of soil erosion risk—rainfall erosivity and soil loss ratios in Andalusia, Spain. Catena 34 (3– 4). 209–225.
Ritchie J.C. and McHenry J.R., 1975. Fallout Cs-137: a tool in conservation research. Journal of Soil and Water Conservation 30. 283-286.
Ritchie, J.C. and McHenry, J.R., 1990. Application of radioactive fallout cesium-137 for measuring soil erosion and sediment accumulation rates and patterns: a review. Journal Environmental Quality, 19. 215–233.
Ritchie, J.C. and Ritchie, C.A., 2008. Bibliography of publications of 137cesium studies related to erosion and sediment deposition, USDA-ARS, Beltsville, 380p.
Rogowski A.S. and Tamura T., 1965. Movement of 137
Cs by runoff, erosion and infiltration on the alluvial captina silt loam. Health Physics 11. 1333-1340.
61
Rogowski, A.S. and Tamura, T., 1970a. Environmental mobility of cesium-137. Radiation Botany, 10. 35–45.
Rogowski, A.S. and Tamura, T., 1970b. Erosional behaviour of cesium-137. Health Physics, 18. 467–477.
Smith, R.E., Goodrich, D.C., Woolhiser, D.A., Unkrich, C.L., 1995. KINEROS: a kinematic runoff and erosion model. In: Singh, V.P. (Ed.), Computer Models of Watershed Hydrology. Water Resources Publications, Highlands Ranch, CO. 697– 732.
Sutherland, R.A., 1996. Caesium-137 soil sampling and inventory variability in reference samples; literature survey. Hydrological Processes, 10. 34–54.
Sutherland, R.A., 1991. Examination of caesium-137 areal activities in control (uneroded) locations. Soil Technology, 4. 33–50.
Sutherland, R.A. and de Jong, E., 1990. Quantification of soil redistribution using caesium-137, Outlook, Saskatchewan, Canada. In: Bryan, R.B. (ed.). Soil erosion-experiments and models. Catena Supplement, 17. 177–193.
Soil Science Division Staff. 2017. Soil survey manual. C. Ditzler, K. Scheffe, and H.C. Monger (eds.). USDA Handbook 18. Government Printing Office, Washington, D.C.
UNEP, 1997. Soil degradation, Map, World Atlas of Desertification, International Soil Reference and Information Centre (ISRIC), UNEP/GRID-Arendal.
Walling, D.E., 2002. Recent advances in the use of environmental radionuclides in soil erosion investigations. In: Proceeding of International Symposium on Nuclear Techniques in Integrated Plant Nutrients, Water and Soil management. International Atomic Energy Agency Publication IAEA-CSP-11/C. 279–301.
Walling, D.E., 2003. Using environmental radionuclides as tracers in sediment budget investigations. International Association of Hydrological Sciences Publication No. 283:57B78.
Walling, D.E. and He, Q., 1997. Use of fallout 137
Cs in investigations of overbank sediment deposition on river floodplains. Catena, 29. 263–82.
Walling, D.E., He, Q., 1999. Improved models for estimating soil erosion rates from cesium-137 measurements. Journal of Environmental Quality 28 (2). 611 – 622.
Walling, D.E., He, Q., Appleby, P.G., 2002. Conversion models for use in soil-erosion, soil-redistribution and sedimentation investigations. Chapter 7. In: Handbook for the assessment of soil erosion and sedimentation using environmental radionuclides. Zapata, F., (Ed.), Kluwer Ac. Publ. 111–164.
Walling, D.E. and Quine, T.A., 1990. Calibration of caesium-137 measurements to provide quantitative erosion rate data. Land Degradation Rehabilitation 2. 161 – 175.
Walling D.E. and Quine T.A., 1991. Use of 137
Cs measurements to investigate soil erosion on arable fields in the UK: potentials applications and limitations. Journal of Soil Science 42. 147-165.
Walling D.E. and Quine T.A., 1992. The use of caesium-137 measurements in soil erosion surveys, Erosion and Sediment Transport Monitoring Programmes in River

62
Basins, Proceedings of the Oslo Symposium, August 1992, IAHS Publ. no. 210, 1992. 143-152.
Walling, D.E. and Quine, T., 1993. Use of Caesium-137 as a Tracer of Erosion and Sedimentation: Handbook for the Application of the Caesium-137 Technique. Department of Geography, University of Exeter publication. 196 p.
Walling, D.E. and Quine, T.A.,1995. The use of fallout radionuclides in soil erosion investigations. In Nuclear Techniques in Soil-Plant Studies for Sustainable Agriculture and Environmental Preservation, International Atomic Energy Agency Publication ST1/PUB/947.
Wallbrink, P.J, Walling, D.E, He, Q., 2002. HPGe Gamma Spectrometry. In: Zapata, F., (Ed.), Handbook for the Assessment of Soil Erosion and Sedimentation using Environmental Radionuclides. Kluwer Ac. Publ. 67–95.
Wischmeier, W.H. and Smith, D.D., 1958. Rainfall energy and its relationship to soil loss. Transactions of American Geophysical Union 39 (2). 285–291.
Wise, S.W., 1980. Caesium-137 and lead-210: a review of the technique and application to geomorphology, pp. 109–127. In: R.A. Cullingford, D.A. Davidson, and J. Lewin (eds.), Timescales in geomorphology, Wiley.
Word Health Organization, 1986. Updated background information on the nuclear reactor accident in Chernobyl, URSS (Copenhagen, 12 June 1986); Word Health Organization Summary report of measurement results relevant for dose assessment (Updated Revision N°7, Copenhagen 12 June 1986).
Zapata, F., (Ed.), 2002. Handbook for the assessment of soil erosion and sedimentation using environmental radionuclides. Kluwer Ac. Publ. 219 p.
Zupanc, V. and Mabit, L., 2010. Nuclear techniques support to assess erosion and sedimentation processes: preliminary results of the use of
137Cs as soil tracer in
Slovenia. Dela, 33. 21–36.

63
Full page photos
Page iv: Rill erosion on cultivated land at Kigwa study site, Uganda
Page vi: Erosion plot with multislot divisor, Harare, Zimbabwe
Page 8: Scheme of reference site, eroded site and deposition site in small watershed, Nanning, China
Page 16: The trainees from Soil Laboratory in Seibersdorf performing core sampling with the aid of motorized soil corer
Page 26: The trainees from Soil Laboratory in Seibersdorf cutting core sample to depth increments
Page 30: Gamma detector, Soil Laboratories in Seibersdorf, IAEA
Page 34: The trainees from Soil Laboratory in Seibersdorf preparing the soil samples for gamma spectroscopy
Page 40: Example of study site of the Technical Cooperation Project where the 137
Cs method is used; The terraces with subsistence family farming, Uganda
Page 50: Technical Officer of TCP during the field work with project partners in Uganda
Page 64: Small sized land use structure of family farms in Kigwa, Uganda
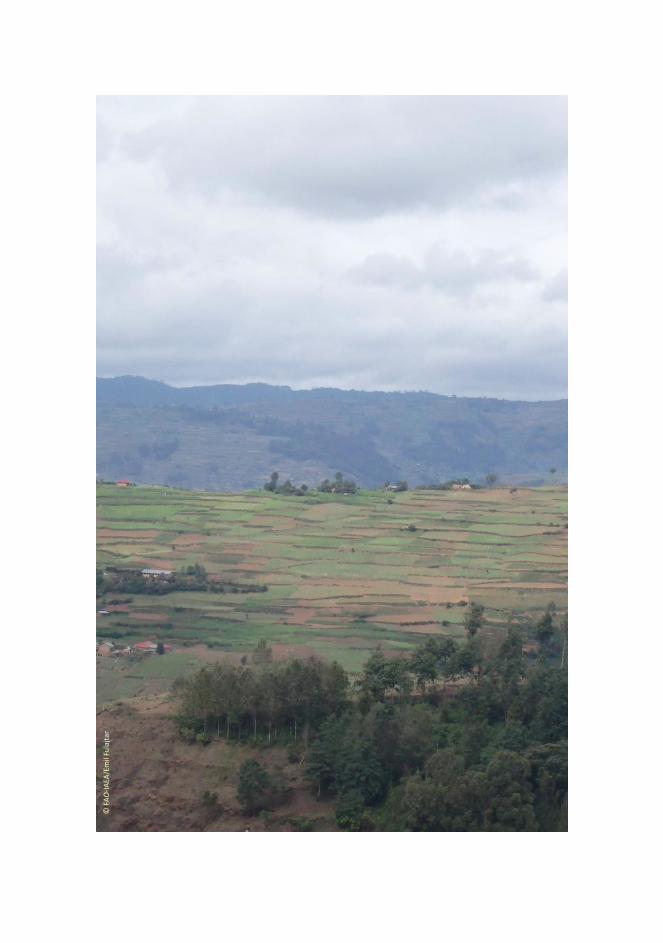
© F
AO
-IA
EA/E
mil
Fula
jtar


ISBN 978-92-5-130050-3
murickanaj
Stamp