USD 101 Erie-Galesburgksde.org/Portals/0/School Finance/budget/Budget_at_a_Glance/13-14... · USD...
30
i USD 101 Erie-Galesburg
-
Upload
nguyenkhuong -
Category
Documents
-
view
215 -
download
0
Transcript of USD 101 Erie-Galesburgksde.org/Portals/0/School Finance/budget/Budget_at_a_Glance/13-14... · USD...
i
USD 101 Erie-Galesburg

ii
• Budget General Information (characteristics of district)
• Supplemental Information for Tables in Summary of Expenditures
• KSDE Website Information Available
• Summary of Expenditures (Sumexpen.xlsx)
1
2013-14 Budget General Information USD #: 101
Introduction
USD 101 Erie – Galesburg, the first district in the state of Kansas to go through consolidation, is starting to enjoy stability after going through more consolidation and de-consolidation to be in its current form. There is now a high school that has a three year old facility that is one of the “greenest” facilities in this part of the country, an elementary school that was completely redone at the same time the high school was being built, and a middle school in Galesburg that had quite a bit of cosmetic work done on it this past summer. The district competes at the 3-A level in athletics and is known for its FFA program and its district wide chess teams.
Board Members Art Maffei – (no e-mail address) - 620-423-5520 – PRESIDENT Chad Boaz – [email protected] - 620-212-4627 - VICE PRESIDENT Buddy Stark - [email protected] - 620-244-5257 Codie Batholomew - [email protected] - 620-249-2245 Amy Montee - [email protected] - 620-820-3043 Justin Kramer - [email protected] - 620-820-3510 William Cook - [email protected] - 620-423-7456
Key Staff Superintendent: Steve Woolf - [email protected] - 620-244-3264 office Clerk: Ginny Oliver - [email protected] Business Office Staff: Pam Thiesing - [email protected]
The District’s Accomplishments and Challenges Accomplishments: While there are many wonderful aspects of the USD 101 school district that make it an amazing place to raise a family – a veritable “21st Century Mayberry,” there are two aspects of the district that stand out. The first is that Erie High School is one of the very few LEED Certified Schools in the state of Kansas. The energy efficiency, healthy building of the facility, and the healthy LEED certified cleaning practices make this a very healthy school to attend. Erie High School receives visitors from throughout the state and this part of the nation to see what a LEED school is. The other aspect is that Erie is a leader in Kansas and one of the leaders in the nation in instituting Project Based Learning on a grand, cross-curricular scale. Students are given responsibility for their learning and their learning coincides with many of their interests and abilities. Schools from across Kansas and this part of the country visit Erie High School to see how this is done.

2
Challenges: While enrollment remains stable, the challenge is to deal with the lack of funding from the state of Kansas to meet the needs of students. The tax burden in the state has been shifted from major corporations and those that own the major corporations paying their fair share to local small businesses and home owners. The mill levy in Erie is substantially higher than it would be if the Kansas State Legislature would follow the state law in funding education. It is the hope of Erie that the legislature and governor of Kansas follow the law soon. If they do, the wonderfully supportive citizens of Erie would be able to receive a large tax break in supporting the schools.

3
Supplemental Information for the Following Tables 1. Summary of Total Expenditures by Function (All Funds)
Every effort is made to keep as much money as possible in the classroom. That being said, it is also important that we spend money on items that our governor sees as not being in the classroom and not necessary such as custodial and maintenance of the facilities that the citizens of Erie have invested in, counselors to help guide and help our students to be all that they can be, administrators of the schools and district, cooks and kitchen staff to feed our students, extra-curricular activities, nurse assistance when needed, and help for our students with disabilities and special needs.
2. Summary of General Fund Expenditures by Function 3. Summary of Supplemental General Fund Expenditures by Function 4. Summary of General and Supplemental General Fund Expenditures by Function 5. Summary of Special Education Fund by Function 6. Instruction Expenditures (1000) 7. Student and Instructional Support Expenditures (2100 & 2200) 8. General Administration Expenditures (2300) 9. School Administration Expenditures (2400) 10. Operations and Maintenance Expenditures (2600) 11. Other Costs (2500 & 2900: Other Supplemental Services) (3000: Non-Instruction
Services) 12. Capital Improvements (4000) 13. Debt Services (5000)
14. Miscellaneous Information - Transfers 15. Miscellaneous Information Unencumbered Cash Balance by Fund 16. Reserve Funds Unencumbered Cash Balance 17. Other Information - FTE 18. Miscellaneous Information Mill Rates by Fund 19. Other Information – Assessed Valuation and Bonded Indebtedness Note: The FTE (full time equivalency) used in this report to calculate the “Amount Per Pupil” is defined as following: Enrollment (FTE) includes the enrollment of the district used for state aid and budget authority, and all other preschool enrollment and kindergarten students attending full time.

4
KSDE Website Information Available K-12 Statistics (Building, District or State Totals) http://svapp15586.ksde.org/k12/k12.aspx
• Attendance / Enrollment Reports • Staff Reports • Graduates / Dropouts Reports • Crime / Violence Reports
School Finance Reports and Publications http://www.ksde.org/Default.aspx?tabid=1870
• Certified Personnel • Enrollment • Dropouts • Graduates • Salary Reports
Kansas Building Report Card http://svapp15586.ksde.org/rcard/
• Attendance Rate • Graduation Rate • Dropout Rate • School Violence • Assessments
o Reading o Mathematics o Writing
• Graduates Passing Adv. Science Courses • Graduates Passing Adv. Math Courses

USD# 101
Summary of Total Expenditures By Function (All Funds)
% % % % %
2011-2012 of 2012-2013 of inc/ 2013-2014 of inc/
Actual Tot Actual Tot dec Budget Tot dec
Instruction 4,138,514 45% 4,361,628 51% 5% 5,255,668 54% 20%
Student Support Services 88,717 1% 135,809 2% 53% 143,300 1% 6%
Instructional Support Services 187,039 2% 170,979 2% -9% 181,800 2% 6%
General Administration 172,112 2% 299,109 4% 74% 344,400 4% 15%
School Administration (Building) 478,494 5% 423,660 5% -11% 485,200 5% 15%
Operations & Maintenance 717,586 8% 613,433 7% -15% 629,444 6% 3%
Transportation 529,803 6% 547,778 6% 3% 531,300 5% -3%
Food Services 382,221 4% 410,949 5% 8% 501,000 5% 22%
Capital Improvements 977,061 11% 69,336 1% -93% 222,000 2% 220%
Debt Services 1,335,565 15% 1,457,415 17% 9% 1,460,359 15% 0%
Other Costs 193,496 2% 15,828 0% -92% 26,200 0% 66%
Total Expenditures* 9,200,608 100% 8,505,924 100% -8% 9,780,671 100% 15%
Amount per Pupil $17,660 $16,202 -8% $18,630 15%
Current Expenditures** 6,874,619 100% 6,852,065 100% 0% 7,548,312 100% 10%
Amount per Pupil $13,195 $13,052 -1% $14,378 10%
Instruction*** (Total Expenditures) 4,125,151 45% 4,257,568 50% 5% 4,755,668 49% -1%
Instruction*** (Current Expenditures) 4,125,151 60% 4,257,568 62% 2% 4,755,668 63% 1%
Note: Percentages on charts are within +-1% due to rounding used. Pie graph percentages may differ from charts for this reason also.
Further definition of what goes into each category:
Instruction - 1000 Transportation - 2700
Student Support Services - 2100 Food Service - 3100
Instructional Support Services - 2200 Other Costs - 2500/2900 and 3300
General Administration - 2300 Capital Improvements - 4000
School Administration (Building) - 2400 Debt Services - 5100
Operations & Maintenance - 2600 Transfers - 5200
Percent of Expenditures
* The funds that are included in the categories above are: General, Supplemental General, Bilingual Education, At Risk(4yr Old), At Risk(K-12), Virtual Education, Capital
Outlay, Driver Education, Extraordinary School Program, Summer School, Special Education, Vocational Education, Professional Development, Bond & Interest #1, Bond &
Interest #2, No-Fund Warrant, Special Assessment, Parent Education, School Retirement, Student Materials Revolving & Textbook Rental, Tuition Reimbursement,
Gifts/Grants, KPERS Special Retirement Contribution, Contingency, Special Liability Expense, Federal Funds, Adult Education, Adult Supplemental Education, Activity Fund
and Special Education Coop Fund.
*** Instruction excludes Capital Outlay and Bond Debt expenditures (Code 16, Code 62, Code 63)
** Current Spending excludes Capital Outlay and Bond Debt expenditures (Code 16, Code 62, Code 63)
0
1,000,000
2,000,000
3,000,000
4,000,000
5,000,000
6,000,000 5,255,668
143,300 181,800 344,400 485,200 629,444 531,300 501,000 222,000
1,460,359
26,200
Summary of Total Expenditures by Function (All Funds)
2011-2012
2012-2013
2013-2014
Instruction 54%
Student Support Services 2%
Instructional Support 2%
General Administration 4%
School Administration (Building)
5%
Operations & Maintenance 6%
Transportation 5%
Food Services 5%
Capital Improvements 2%
Debt Services 15%
2013-14 Summary of Total Expenditures by Function
Instruction
Student Support Services
Instructional Support
General Administration
School Administration (Building)
Operations & Maintenance
Transportation
Food Services
Capital Improvements
Debt Services
Other Costs
9/6/2013 3:30 PM Sumexpen.xlsx Page 1 of 24
USD# 101
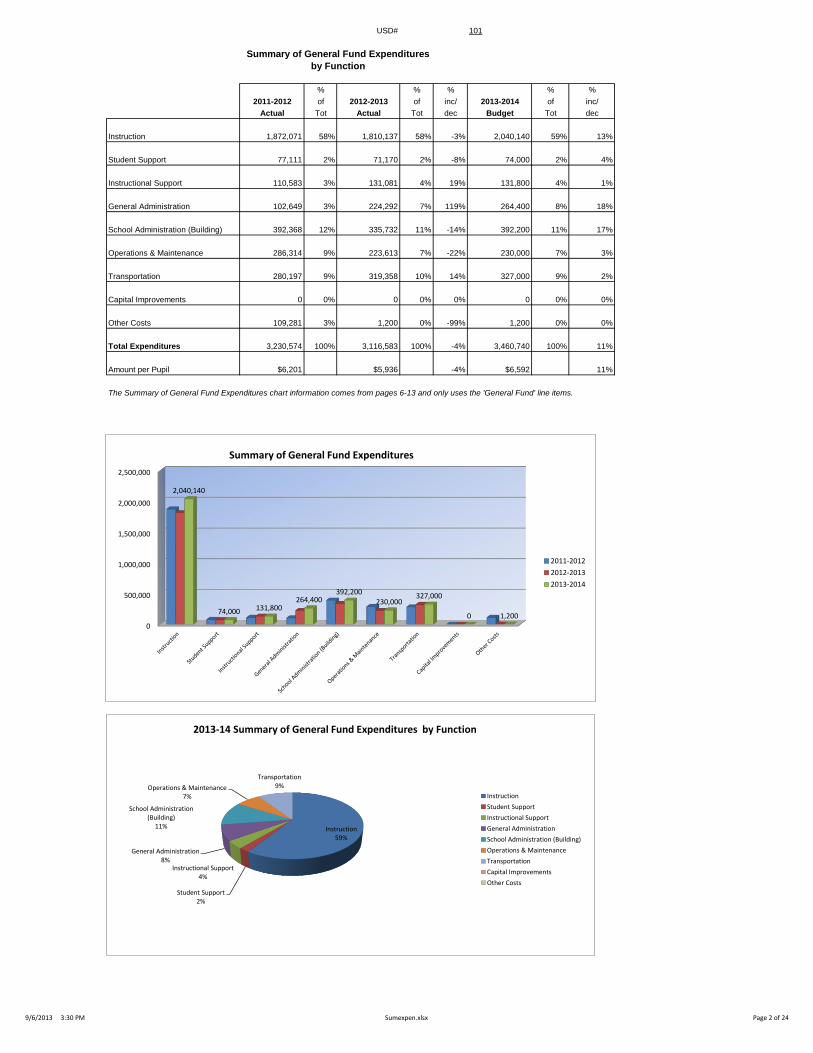
Summary of General Fund Expenditures
by Function
% % % % %
2011-2012 of 2012-2013 of inc/ 2013-2014 of inc/
Actual Tot Actual Tot dec Budget Tot dec
Instruction 1,872,071 58% 1,810,137 58% -3% 2,040,140 59% 13%
Student Support 77,111 2% 71,170 2% -8% 74,000 2% 4%
Instructional Support 110,583 3% 131,081 4% 19% 131,800 4% 1%
General Administration 102,649 3% 224,292 7% 119% 264,400 8% 18%
School Administration (Building) 392,368 12% 335,732 11% -14% 392,200 11% 17%
Operations & Maintenance 286,314 9% 223,613 7% -22% 230,000 7% 3%
Transportation 280,197 9% 319,358 10% 14% 327,000 9% 2%
Capital Improvements 0 0% 0 0% 0% 0 0% 0%
Other Costs 109,281 3% 1,200 0% -99% 1,200 0% 0%
Total Expenditures 3,230,574 100% 3,116,583 100% -4% 3,460,740 100% 11%
Amount per Pupil $6,201 $5,936 -4% $6,592 11%
The Summary of General Fund Expenditures chart information comes from pages 6-13 and only uses the 'General Fund' line items.
0
500,000
1,000,000
1,500,000
2,000,000
2,500,000
2,040,140
74,000 131,800 264,400
392,200
230,000 327,000
0 1,200
Summary of General Fund Expenditures
2011-2012
2012-2013
2013-2014
Instruction 59%
Student Support 2%
Instructional Support 4%
General Administration 8%
School Administration (Building)
11%
Operations & Maintenance 7%
Transportation 9%
2013-14 Summary of General Fund Expenditures by Function
Instruction
Student Support
Instructional Support
General Administration
School Administration (Building)
Operations & Maintenance
Transportation
Capital Improvements
Other Costs
9/6/2013 3:30 PM Sumexpen.xlsx Page 2 of 24

USD# 101
Summary of Supplemental General Fund Expenditures
by Function
% % % % %
2011-2012 of 2012-2013 of inc/ 2013-2014 of inc/
Actual Tot Actual Tot dec Budget Tot dec
Instruction 108,924 15% 96,437 13% -11% 155,346 19% 61%
Student Support 0 0% 54,427 7% 0% 55,300 7% 2%
Instructional Support 51,575 7% 0 0% -100% 0 0% 0%
General Administration 57,857 8% 64,605 8% 12% 68,000 8% 5%
School Administration (Building) 65,110 9% 69,436 9% 7% 71,000 9% 2%
Operations & Maintenance 346,910 47% 366,055 48% 6% 343,000 42% -6%
Transportation 111,707 15% 119,204 15% 7% 120,500 15% 1%
Capital Improvements 0 0% 0 0% 0% 0 0% 0%
Other Costs 0 0% 0 0% 0% 0 0% 0%
Total Expenditures 742,083 100% 770,164 100% 4% 813,146 100% 6%
Amount per Pupil $1,424 $1,467 3% $1,549 6%
The Summary of Supplemental General Fund Expenditures chart information comes from pages 6-13 and only uses the 'Supplemental
General Fund' line items.
0
50,000
100,000
150,000
200,000
250,000
300,000
350,000
400,000
155,346
55,300
0
68,000 71,000
343,000
120,500
0 0
Summary of Supplemental General Expenditures by Function
2011-2012
2012-2013
2013-2014
Instruction 19%
Student Support 7%
General Administration 8%
School Administration (Building) 9%
Operations & Maintenance
42%
Transportation 15%
2013-14 Summary of Supplemental General Fund Expenditures by Function
Instruction
Student Support
Instructional Support
General Administration
School Administration (Building)
Operations & Maintenance
Transportation
Capital Improvements
Other Costs
9/6/2013 3:30 PM Sumexpen.xlsx Page 3 of 24

USD# 101
Summary of General and Supplemental General Fund
Expenditures by Function
% % % % %
2011-2012 of 2012-2013 of inc/ 2013-2014 of inc/
Actual Tot Actual Tot dec Budget Tot dec
Instruction 1,980,995 50% 1,906,574 49% -4% 2,195,486 51% 15%
Student Support 77,111 2% 125,597 3% 63% 129,300 3% 3%
Instructional Support 162,158 4% 131,081 3% -19% 131,800 3% 1%
General Administration 160,506 4% 288,897 7% 80% 332,400 8% 15%
School Administration (Building) 457,478 12% 405,168 10% -11% 463,200 11% 14%
Operations & Maintenance 633,224 16% 589,668 15% -7% 573,000 13% -3%
Transportation 391,904 10% 438,562 11% 12% 447,500 10% 2%
Capital Improvements 0 0% 0 0% 0% 0 0% 0%
Other Costs 109,281 3% 1,200 0% -99% 1,200 0% 0%
Total Expenditures 3,972,657 100% 3,886,747 100% -2% 4,273,886 100% 10%
Amount per Pupil $7,625 $7,403 -3% $8,141 10%
The Summary of General and Supplemental General Fund Expenditures chart information comes from pages 6-13 and adds together
the 'General Fund' and 'Supplemental General Fund' line items.
0
500,000
1,000,000
1,500,000
2,000,000
2,500,000 2,195,486
129,300 131,800 332,400
463,200 573,000
447,500
0 1,200
Summary of General and Supplemental General Fund Expenditures by Function
2011-2012
2012-2013
2013-2014
Instruction 51%
Student Support
3% Instructional Support
3%
General Administration 8%
School Administration (Building)
11%
Operations & Maintenance 13%
Transportation 11%
2013-14 Summary of General and Supplemental General Fund Expenditures by Function
Instruction
Student Support
Instructional Support
General Administration
School Administration (Building)
Operations & Maintenance
Transportation
Capital Improvements
Other Costs
9/6/2013 3:30 PM Sumexpen.xlsx Page 4 of 24

USD# 101
Summary of Special Education Fund
by Function
% % % % %
2011-2012 of 2012-2013 of inc/ 2013-2014 of inc/
Actual Tot Actual Tot dec Budget Tot dec
Instruction 851,059 87% 849,208 90% 0% 1,054,052 94% 24%
Student Support 0 0% 0 0% 0% 0 0% 0%
Instructional Support 0 0% 0 0% 0% 0 0% 0%
General Administration 0 0% 0 0% 0% 0 0% 0%
School Administration (Building) 0 0% 0 0% 0% 0 0% 0%
Operations & Maintenance 0 0% 0 0% 0% 0 0% 0%
Transportation 123,157 13% 94,859 10% -23% 68,800 6% -27%
Capital Improvements 0 0% 0 0% 0% 0 0% 0%
Other Costs 0 0% 0 0% 0% 0 0% 0%
Total Expenditures 974,216 100% 944,067 100% -3% 1,122,852 100% 19%
Amount per Pupil $1,870 $1,798 -4% $2,139 19%
The Summary of Special Education Fund Expenditures chart information comes from pages 6-13 and only uses the 'Special Education Fund'
line items. (Total expenditures excludes Special Ed Coop Fund because it would include expenditures for all schools participating in the Coop.)
0
200,000
400,000
600,000
800,000
1,000,000
1,200,000
85
1,0
59
0
0
0
0
0
12
3,1
57
0
0
84
9,2
08
0
0
0
0
0
94
,85
9
0
0
1,0
54
,05
2
0
0
0
0
0
68
,80
0
0
0
Summary of Special Education Fund Expenditures by Function
2011-2012
2012-2013
2013-2014
Instruction 94%
Transportation 6%
2013-14 Summary of Special Education Fund by Function
Instruction
Student Support
Instructional Support
General Administration
School Administration (Building)
Operations & Maintenance
Transportation
Capital Improvements
Other Costs
9/6/2013 3:30 PM Sumexpen.xlsx Page 5 of 24
USD# 101
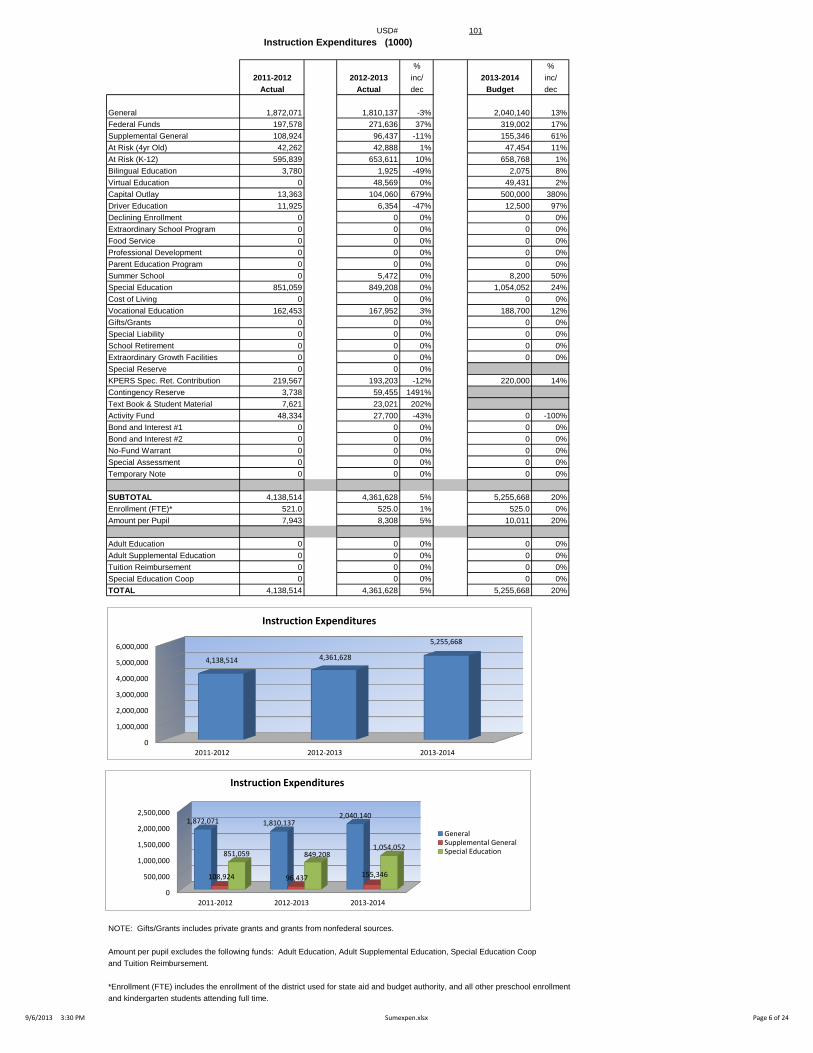
Instruction Expenditures (1000)
% %
2011-2012 2012-2013 inc/ 2013-2014 inc/
Actual Actual dec Budget dec
General 1,872,071 1,810,137 -3% 2,040,140 13%
Federal Funds 197,578 271,636 37% 319,002 17%
Supplemental General 108,924 96,437 -11% 155,346 61%
At Risk (4yr Old) 42,262 42,888 1% 47,454 11%
At Risk (K-12) 595,839 653,611 10% 658,768 1%
Bilingual Education 3,780 1,925 -49% 2,075 8%
Virtual Education 0 48,569 0% 49,431 2%
Capital Outlay 13,363 104,060 679% 500,000 380%
Driver Education 11,925 6,354 -47% 12,500 97%
Declining Enrollment 0 0 0% 0 0%
Extraordinary School Program 0 0 0% 0 0%
Food Service 0 0 0% 0 0%
Professional Development 0 0 0% 0 0%
Parent Education Program 0 0 0% 0 0%
Summer School 0 5,472 0% 8,200 50%
Special Education 851,059 849,208 0% 1,054,052 24%
Cost of Living 0 0 0% 0 0%
Vocational Education 162,453 167,952 3% 188,700 12%
Gifts/Grants 0 0 0% 0 0%
Special Liability 0 0 0% 0 0%
School Retirement 0 0 0% 0 0%
Extraordinary Growth Facilities 0 0 0% 0 0%
Special Reserve 0 0 0%
KPERS Spec. Ret. Contribution 219,567 193,203 -12% 220,000 14%
Contingency Reserve 3,738 59,455 1491%
Text Book & Student Material 7,621 23,021 202%
Activity Fund 48,334 27,700 -43% 0 -100%
Bond and Interest #1 0 0 0% 0 0%
Bond and Interest #2 0 0 0% 0 0%
No-Fund Warrant 0 0 0% 0 0%
Special Assessment 0 0 0% 0 0%
Temporary Note 0 0 0% 0 0%
SUBTOTAL 4,138,514 4,361,628 5% 5,255,668 20%
Enrollment (FTE)* 521.0 525.0 1% 525.0 0%
Amount per Pupil 7,943 8,308 5% 10,011 20%
Adult Education 0 0 0% 0 0%
Adult Supplemental Education 0 0 0% 0 0%
Tuition Reimbursement 0 0 0% 0 0%
Special Education Coop 0 0 0% 0 0%
TOTAL 4,138,514 4,361,628 5% 5,255,668 20%
NOTE: Gifts/Grants includes private grants and grants from nonfederal sources.
Amount per pupil excludes the following funds: Adult Education, Adult Supplemental Education, Special Education Coop
and Tuition Reimbursement.
*Enrollment (FTE) includes the enrollment of the district used for state aid and budget authority, and all other preschool enrollment
and kindergarten students attending full time.
0
500,000
1,000,000
1,500,000
2,000,000
2,500,000
2011-2012 2012-2013 2013-2014
1,872,071 1,810,137 2,040,140
108,924 96,437 155,346
851,059 849,208 1,054,052
Instruction Expenditures
GeneralSupplemental GeneralSpecial Education
0
1,000,000
2,000,000
3,000,000
4,000,000
5,000,000
6,000,000
2011-2012 2012-2013 2013-2014
4,138,514 4,361,628
5,255,668
Instruction Expenditures
9/6/2013 3:30 PM Sumexpen.xlsx Page 6 of 24

USD# 101
Student Support Expenditures (2100)
% %
2011-2012 2012-2013 inc/ 2013-2014 inc/
Actual Actual dec Budget dec
General 77,111 71,170 -8% 74,000 4%
Federal Funds 0 0 0% 0 0%
Supplemental General 0 54,427 0% 55,300 2%
At Risk (4yr Old) 0 0 0% 0 0%
At Risk (K-12) 0 0 0% 0 0%
Bilingual Education 0 0 0% 0 0%
Virtual Education 0 0 0% 0 0%
Capital Outlay 0 0 0% 0 0%
Driver Training 0 0 0% 0 0%
Declining Enrollment 0 0 0% 0 0%
Extraordinary School Program 0 0 0% 0 0%
Food Service 0 0 0% 0 0%
Professional Development 0 0 0% 0 0%
Parent Education Program 0 0 0% 0 0%
Summer School 0 0 0% 0 0%
Special Education 0 0 0% 0 0%
Cost of Living 0 0 0% 0 0%
Vocational Education 0 0 0% 0 0%
Gifts/Grants 0 0 0% 0 0%
Special Liability 0 0 0% 0 0%
School Retirement 0 0 0% 0 0%
Extraordinary Growth Facilities 0 0 0% 0 0%
Special Reserve 0 0 0%
KPERS Spec. Ret. Contribution 11,606 10,212 -12% 14,000 37%
Contingency Reserve 0 0 0%
Text Book & Student Material 0 0 0%
Activity Fund 0 0 0% 0 0%
Bond and Interest #1 0 0 0% 0 0%
Bond and Interest #2 0 0 0% 0 0%
No-Fund Warrant 0 0 0% 0 0%
Special Assessment 0 0 0% 0 0%
Temporary Note 0 0 0% 0 0%
SUBTOTAL 88,717 135,809 53% 143,300 6%
Enrollment (FTE)* 521.0 525.0 1% 525.0 0%
Amount per Pupil 170 259 52% 273 6%
Adult Education 0 0 0% 0 0%
Adult Supplemental Education 0 0 0% 0 0%
Tuition Reimbursement 0 0 0% 0 0%
Special Education Coop 0 0 0% 0 0%
TOTAL 88,717 135,809 53% 143,300 6%
Amount per Pupil $178 $261 47% $273 5%
NOTE: Gifts/Grants includes private grants and grants from nonfederal sources.
Amount per pupil excludes the following funds: Adult Education, Adult Supplemental Education, Special Education Coop
and Tuition Reimbursement.
*Enrollment (FTE) includes the enrollment of the district used for state aid and budget authority, and all other preschool enrollment
and kindergarten students attending full time.
0
20,000
40,000
60,000
80,000
100,000
120,000
140,000
160,000
2011-2012 2012-2013 2013-2014
88,717
135,809 143,300
Student Support Expenditures
9/6/2013 3:30 PM Sumexpen.xlsx Page 7 of 24

USD# 101
Instructional Support Expenditures (2200)
% %
2011-2012 2012-2013 inc/ 2013-2014 inc/
Actual Actual dec Budget dec
General 110,583 131,081 19% 131,800 1%
Federal Funds 0 0 0% 0 0%
Supplemental General 51,575 0 -100% 0 0%
At Risk (4yr Old) 0 0 0% 0 0%
At Risk (K-12) 0 0 0% 0 0%
Bilingual Education 0 0 0% 0 0%
Virtual Education 0 0 0% 0 0%
Capital Outlay 0 0 0% 0 0%
Driver Training 0 0 0% 0 0%
Declining Enrollment 0 0 0% 0 0%
Extraordinary School Program 0 0 0% 0 0%
Food Service 0 0 0% 0 0%
Professional Development 16,098 32,170 100% 40,000 24%
Parent Education Program 0 0 0% 0 0%
Summer School 0 0 0% 0 0%
Special Education 0 0 0% 0 0%
Cost of Living 0 0 0% 0 0%
Vocational Education 0 0 0% 0 0%
Gifts/Grants 0 0 0% 0 0%
Special Liability 0 0 0% 0 0%
School Retirement 0 0 0% 0 0%
Extraordinary Growth Facilities 0 0 0% 0 0%
Special Reserve 0 0 0%
KPERS Spec. Ret. Contribution 8,783 7,728 -12% 10,000 29%
Contingency Reserve 0 0 0%
Text Book & Student Material 0 0 0%
Activity Fund 0 0 0% 0 0%
Bond and Interest #1 0 0 0% 0 0%
Bond and Interest #2 0 0 0% 0 0%
No-Fund Warrant 0 0 0% 0 0%
Special Assessment 0 0 0% 0 0%
Temporary Note 0 0 0% 0 0%
SUBTOTAL 187,039 170,979 -9% 181,800 6%
Enrollment (FTE)* 521.0 525.0 1% 525.0 0%
Amount per Pupil 359 326 -9% 346 6%
Adult Education 0 0 0% 0 0%
Adult Supplemental Education 0 0 0% 0 0%
Tuition Reimbursement 0 0 0% 0 0%
Special Education Coop 0 0 0% 0 0%
TOTAL 187,039 170,979 -9% 181,800 6%
Amount per Pupil $359 $326 -9% $346 6%
NOTE: Gifts/Grants includes private grants and grants from nonfederal sources.
Amount per pupil excludes the following funds: Adult Education, Adult Supplemental Education, Special Education Coop
and Tuition Reimbursement.
*Enrollment (FTE) includes the enrollment of the district used for state aid and budget authority, and all other preschool enrollment
and kindergarten students attending full time.
160,000
165,000
170,000
175,000
180,000
185,000
190,000
2011-2012 2012-2013 2013-2014
187,039
170,979
181,800
Instructional Support Expenditures
9/6/2013 3:30 PM Sumexpen.xlsx Page 8 of 24

USD# 101
General Administration Expenditures (2300)
% %
2011-2012 2012-2013 inc/ 2013-2014 inc/
Actual Actual dec Budget dec
General 102,649 224,292 119% 264,400 18%
Federal Funds 0 0 0% 0 0%
Supplemental General 57,857 64,605 12% 68,000 5%
At Risk (4yr Old) 0 0 0% 0 0%
At Risk (K-12) 0 0 0% 0 0%
Bilingual Education 0 0 0% 0 0%
Virtual Education 0 0 0% 0 0%
Capital Outlay 0 0 0% 0 0%
Driver Training 0 0 0% 0 0%
Declining Enrollment 0 0 0% 0 0%
Extraordinary School Program 0 0 0% 0 0%
Food Service 0 0 0% 0 0%
Professional Development 0 0 0% 0 0%
Parent Education Program 0 0 0% 0 0%
Summer School 0 0 0% 0 0%
Special Education 0 0 0% 0 0%
Cost of Living 0 0 0% 0 0%
Vocational Education 0 0 0% 0 0%
Gifts/Grants 0 0 0% 0 0%
Special Liability Expense 0 0 0% 0 0%
School Retirement 0 0 0% 0 0%
Extraordinary Growth Facilities 0 0 0% 0 0%
Special Reserve 0 0 0%
KPERS Spec. Ret. Contribution 11,606 10,212 -12% 12,000 18%
Contingency Reserve 0 0 0%
Text Book & Student Material 0 0 0%
Activity Fund 0 0 0% 0 0%
Bond and Interest #1 0 0 0% 0 0%
Bond and Interest #2 0 0 0% 0 0%
No-Fund Warrant 0 0 0% 0 0%
Special Assessment 0 0 0% 0 0%
Temporary Note 0 0 0% 0 0%
SUBTOTAL 172,112 299,109 74% 344,400 15%
Enrollment (FTE)* 521.0 525.0 1% 525.0 0%
Amount per Pupil 330 570 72% 656 15%
Adult Education 0 0 0% 0 0%
Adult Supplemental Education 0 0 0% 0 0%
Tuition Reimbursement 0 0 0% 0 0%
Special Education Coop 0 0 0% 0 0%
TOTAL 172,112 299,109 74% 344,400 15%
NOTE: Gifts/Grants includes private grants and grants from nonfederal sources.
Amount per pupil excludes the following funds: Adult Education, Adult Supplemental Education, Special Education Coop
and Tuition Reimbursement.
*Enrollment (FTE) includes the enrollment of the district used for state aid and budget authority, and all other preschool enrollment
and kindergarten students attending full time.
0
50,000
100,000
150,000
200,000
250,000
300,000
350,000
2011-2012 2012-2013 2013-2014
172,112
299,109
344,400
General Administration Expenditures
9/6/2013 3:30 PM Sumexpen.xlsx Page 9 of 24
USD# 101
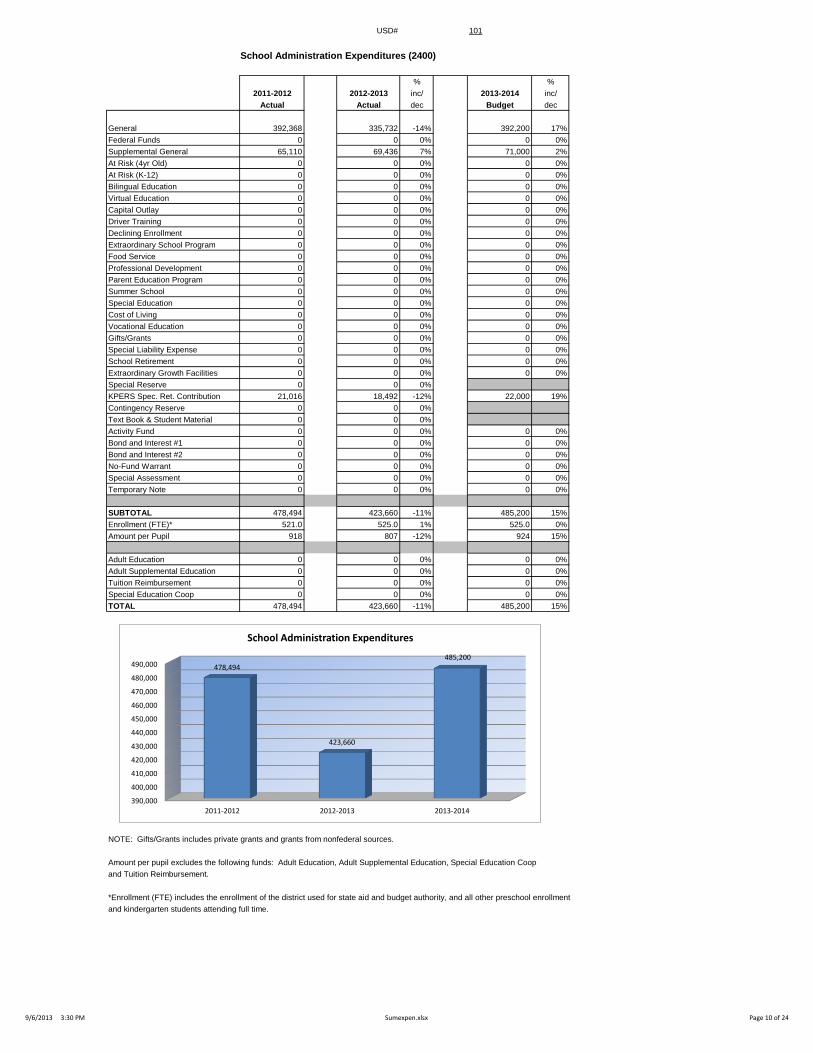
School Administration Expenditures (2400)
% %
2011-2012 2012-2013 inc/ 2013-2014 inc/
Actual Actual dec Budget dec
General 392,368 335,732 -14% 392,200 17%
Federal Funds 0 0 0% 0 0%
Supplemental General 65,110 69,436 7% 71,000 2%
At Risk (4yr Old) 0 0 0% 0 0%
At Risk (K-12) 0 0 0% 0 0%
Bilingual Education 0 0 0% 0 0%
Virtual Education 0 0 0% 0 0%
Capital Outlay 0 0 0% 0 0%
Driver Training 0 0 0% 0 0%
Declining Enrollment 0 0 0% 0 0%
Extraordinary School Program 0 0 0% 0 0%
Food Service 0 0 0% 0 0%
Professional Development 0 0 0% 0 0%
Parent Education Program 0 0 0% 0 0%
Summer School 0 0 0% 0 0%
Special Education 0 0 0% 0 0%
Cost of Living 0 0 0% 0 0%
Vocational Education 0 0 0% 0 0%
Gifts/Grants 0 0 0% 0 0%
Special Liability Expense 0 0 0% 0 0%
School Retirement 0 0 0% 0 0%
Extraordinary Growth Facilities 0 0 0% 0 0%
Special Reserve 0 0 0%
KPERS Spec. Ret. Contribution 21,016 18,492 -12% 22,000 19%
Contingency Reserve 0 0 0%
Text Book & Student Material 0 0 0%
Activity Fund 0 0 0% 0 0%
Bond and Interest #1 0 0 0% 0 0%
Bond and Interest #2 0 0 0% 0 0%
No-Fund Warrant 0 0 0% 0 0%
Special Assessment 0 0 0% 0 0%
Temporary Note 0 0 0% 0 0%
SUBTOTAL 478,494 423,660 -11% 485,200 15%
Enrollment (FTE)* 521.0 525.0 1% 525.0 0%
Amount per Pupil 918 807 -12% 924 15%
Adult Education 0 0 0% 0 0%
Adult Supplemental Education 0 0 0% 0 0%
Tuition Reimbursement 0 0 0% 0 0%
Special Education Coop 0 0 0% 0 0%
TOTAL 478,494 423,660 -11% 485,200 15%
NOTE: Gifts/Grants includes private grants and grants from nonfederal sources.
Amount per pupil excludes the following funds: Adult Education, Adult Supplemental Education, Special Education Coop
and Tuition Reimbursement.
*Enrollment (FTE) includes the enrollment of the district used for state aid and budget authority, and all other preschool enrollment
and kindergarten students attending full time.
390,000
400,000
410,000
420,000
430,000
440,000
450,000
460,000
470,000
480,000
490,000
2011-2012 2012-2013 2013-2014
478,494
423,660
485,200
School Administration Expenditures
9/6/2013 3:30 PM Sumexpen.xlsx Page 10 of 24

USD# 101
Operations and Maintenance Expenditures (2600)
% %
2011-2012 2012-2013 inc/ 2013-2014 inc/
Actual Actual dec Budget dec
General 286,314 223,613 -22% 230,000 3%
Federal Funds 0 0 0% 0 0%
Supplemental General 346,910 366,055 6% 343,000 -6%
At Risk (4yr Old) 0 0 0% 0 0%
At Risk (K-12) 0 0 0% 0 0%
Bilingual Education 0 0 0% 0 0%
Virtual Education 0 0 0% 0 0%
Capital Outlay 0 23,048 0% 50,000 117%
Driver Training 1,036 717 -31% 1,000 39%
Declining Enrollment 0 0 0% 0 0%
Extraordinary School Program 0 0 0% 0 0%
Food Service 0 0 0% 0 0%
Professional Development 0 0 0% 0 0%
Parent Education Program 0 0 0% 0 0%
Summer School 0 0 0% 0 0%
Special Education 0 0 0% 0 0%
Cost of Living 0 0 0% 0 0%
Vocational Education 2,326 0 -100% 0 0%
Gifts/Grants 0 0 0% 0 0%
Special Liability 0 0 0% 0 0%
School Retirement 0 0 0% 0 0%
Extraordinary Growth Facilities 0 0 0% 0 0%
Special Reserve 0 0 0%
KPERS Spec. Ret. Contribution 0 0 0% 5,444 0%
Contingency Reserve 81,000 0 -100%
Text Book & Student Material 0 0 0%
Activity Fund 0 0 0% 0 0%
Bond and Interest #1 0 0 0% 0 0%
Bond and Interest #2 0 0 0% 0 0%
No-Fund Warrant 0 0 0% 0 0%
Special Assessment 0 0 0% 0 0%
Temporary Note 0 0 0% 0 0%
SUBTOTAL 717,586 613,433 -15% 629,444 3%
Enrollment (FTE)* 521.0 525.0 1% 525.0 0%
Amount per Pupil 1,377 1,168 -15% 1,199 3%
Adult Education 0 0 0% 0 0%
Adult Supplemental Education 0 0 0% 0 0%
Tuition Reimbursement 0 0 0% 0 0%
Special Education Coop 0 0 0% 0 0%
TOTAL 717,586 613,433 -15% 629,444 3%
NOTE: Gifts/Grants includes private grants and grants from nonfederal sources.
Amount per pupil excludes the following funds: Adult Education, Adult Supplemental Education, Special Education Coop
and Tuition Reimbursement.
*Enrollment (FTE) includes the enrollment of the district used for state aid and budget authority, and all other preschool enrollment
and kindergarten students attending full time.
560,000
580,000
600,000
620,000
640,000
660,000
680,000
700,000
720,000
2011-2012 2012-2013 2013-2014
717,586
613,433
629,444
Operations and Maintenance Expenditures
9/6/2013 3:30 PM Sumexpen.xlsx Page 11 of 24
USD# 101
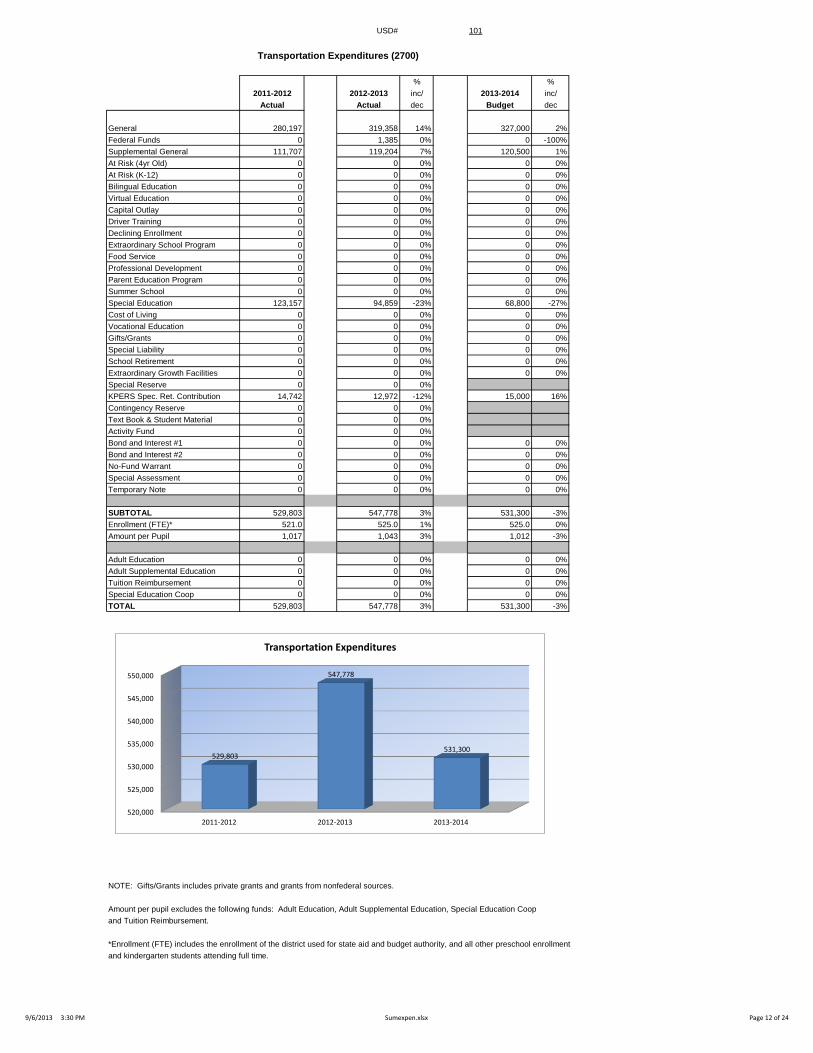
Transportation Expenditures (2700)
% %
2011-2012 2012-2013 inc/ 2013-2014 inc/
Actual Actual dec Budget dec
General 280,197 319,358 14% 327,000 2%
Federal Funds 0 1,385 0% 0 -100%
Supplemental General 111,707 119,204 7% 120,500 1%
At Risk (4yr Old) 0 0 0% 0 0%
At Risk (K-12) 0 0 0% 0 0%
Bilingual Education 0 0 0% 0 0%
Virtual Education 0 0 0% 0 0%
Capital Outlay 0 0 0% 0 0%
Driver Training 0 0 0% 0 0%
Declining Enrollment 0 0 0% 0 0%
Extraordinary School Program 0 0 0% 0 0%
Food Service 0 0 0% 0 0%
Professional Development 0 0 0% 0 0%
Parent Education Program 0 0 0% 0 0%
Summer School 0 0 0% 0 0%
Special Education 123,157 94,859 -23% 68,800 -27%
Cost of Living 0 0 0% 0 0%
Vocational Education 0 0 0% 0 0%
Gifts/Grants 0 0 0% 0 0%
Special Liability 0 0 0% 0 0%
School Retirement 0 0 0% 0 0%
Extraordinary Growth Facilities 0 0 0% 0 0%
Special Reserve 0 0 0%
KPERS Spec. Ret. Contribution 14,742 12,972 -12% 15,000 16%
Contingency Reserve 0 0 0%
Text Book & Student Material 0 0 0%
Activity Fund 0 0 0%
Bond and Interest #1 0 0 0% 0 0%
Bond and Interest #2 0 0 0% 0 0%
No-Fund Warrant 0 0 0% 0 0%
Special Assessment 0 0 0% 0 0%
Temporary Note 0 0 0% 0 0%
SUBTOTAL 529,803 547,778 3% 531,300 -3%
Enrollment (FTE)* 521.0 525.0 1% 525.0 0%
Amount per Pupil 1,017 1,043 3% 1,012 -3%
Adult Education 0 0 0% 0 0%
Adult Supplemental Education 0 0 0% 0 0%
Tuition Reimbursement 0 0 0% 0 0%
Special Education Coop 0 0 0% 0 0%
TOTAL 529,803 547,778 3% 531,300 -3%
NOTE: Gifts/Grants includes private grants and grants from nonfederal sources.
Amount per pupil excludes the following funds: Adult Education, Adult Supplemental Education, Special Education Coop
and Tuition Reimbursement.
*Enrollment (FTE) includes the enrollment of the district used for state aid and budget authority, and all other preschool enrollment
and kindergarten students attending full time.
520,000
525,000
530,000
535,000
540,000
545,000
550,000
2011-2012 2012-2013 2013-2014
529,803
547,778
531,300
Transportation Expenditures
9/6/2013 3:30 PM Sumexpen.xlsx Page 12 of 24
USD# 101
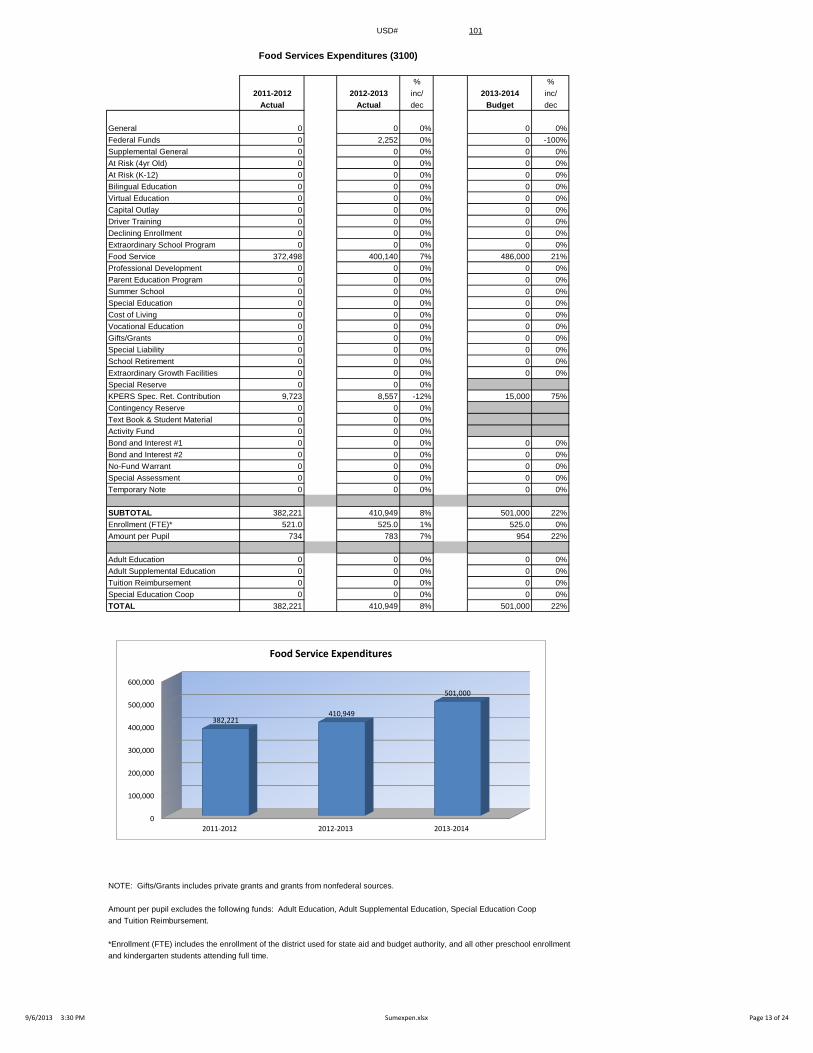
Food Services Expenditures (3100)
% %
2011-2012 2012-2013 inc/ 2013-2014 inc/
Actual Actual dec Budget dec
General 0 0 0% 0 0%
Federal Funds 0 2,252 0% 0 -100%
Supplemental General 0 0 0% 0 0%
At Risk (4yr Old) 0 0 0% 0 0%
At Risk (K-12) 0 0 0% 0 0%
Bilingual Education 0 0 0% 0 0%
Virtual Education 0 0 0% 0 0%
Capital Outlay 0 0 0% 0 0%
Driver Training 0 0 0% 0 0%
Declining Enrollment 0 0 0% 0 0%
Extraordinary School Program 0 0 0% 0 0%
Food Service 372,498 400,140 7% 486,000 21%
Professional Development 0 0 0% 0 0%
Parent Education Program 0 0 0% 0 0%
Summer School 0 0 0% 0 0%
Special Education 0 0 0% 0 0%
Cost of Living 0 0 0% 0 0%
Vocational Education 0 0 0% 0 0%
Gifts/Grants 0 0 0% 0 0%
Special Liability 0 0 0% 0 0%
School Retirement 0 0 0% 0 0%
Extraordinary Growth Facilities 0 0 0% 0 0%
Special Reserve 0 0 0%
KPERS Spec. Ret. Contribution 9,723 8,557 -12% 15,000 75%
Contingency Reserve 0 0 0%
Text Book & Student Material 0 0 0%
Activity Fund 0 0 0%
Bond and Interest #1 0 0 0% 0 0%
Bond and Interest #2 0 0 0% 0 0%
No-Fund Warrant 0 0 0% 0 0%
Special Assessment 0 0 0% 0 0%
Temporary Note 0 0 0% 0 0%
SUBTOTAL 382,221 410,949 8% 501,000 22%
Enrollment (FTE)* 521.0 525.0 1% 525.0 0%
Amount per Pupil 734 783 7% 954 22%
Adult Education 0 0 0% 0 0%
Adult Supplemental Education 0 0 0% 0 0%
Tuition Reimbursement 0 0 0% 0 0%
Special Education Coop 0 0 0% 0 0%
TOTAL 382,221 410,949 8% 501,000 22%
NOTE: Gifts/Grants includes private grants and grants from nonfederal sources.
Amount per pupil excludes the following funds: Adult Education, Adult Supplemental Education, Special Education Coop
and Tuition Reimbursement.
*Enrollment (FTE) includes the enrollment of the district used for state aid and budget authority, and all other preschool enrollment
and kindergarten students attending full time.
0
100,000
200,000
300,000
400,000
500,000
600,000
2011-2012 2012-2013 2013-2014
382,221 410,949
501,000
Food Service Expenditures
9/6/2013 3:30 PM Sumexpen.xlsx Page 13 of 24

USD# 101
Other Costs
(2500 & 2900: Other Supplemental Services)
(3300: Community Services Operations)
% %
2011-2012 2012-2013 inc/ 2013-2014 inc/
Actual Actual dec Budget dec
General 109,281 1,200 -99% 1,200 0%
Federal Funds 0 0 0% 0 0%
Supplemental General 0 0 0% 0 0%
At Risk (4yr Old) 0 0 0% 0 0%
At Risk (K-12) 0 0 0% 0 0%
Bilingual Education 0 0 0% 0 0%
Virtual Education 0 0 0% 0 0%
Capital Outlay 0 0 0% 0 0%
Driver Training 0 0 0% 0 0%
Declining Enrollment 0 0 0% 0 0%
Extraordinary School Program 0 0 0% 0 0%
Food Service 0 0 0% 0 0%
Professional Development 18,726 0 -100% 10,000 0%
Parent Education Program 0 0 0% 0 0%
Summer School 0 0 0% 0 0%
Special Education 0 0 0% 0 0%
Cost of Living 0 0 0% 0 0%
Vocational Education 0 0 0% 0 0%
Gifts/Grants 0 0 0% 0 0%
Special Liability 0 0 0% 0 0%
School Retirement 0 0 0% 0 0%
Extraordinary Growth Facilities 0 0 0% 0 0%
Special Reserve 0 0 0%
KPERS Spec. Ret. Contribution 16,624 14,628 -12% 15,000 3%
Contingency Reserve 48,865 0 -100%
Text Book & Student Material 0 0 0%
Activity Fund 0 0 0% 0 0%
Bond and Interest #1 0 0 0% 0 0%
Bond and Interest #2 0 0 0% 0 0%
No-Fund Warrant 0 0 0% 0 0%
Special Assessment 0 0 0% 0 0%
Temporary Note 0 0 0% 0 0%
SUBTOTAL 193,496 15,828 -92% 26,200 66%
Enrollment (FTE)* 521.0 525.0 1% 525.0 0%
Amount per Pupil 371 30 -92% 50 66%
Adult Education 0 0 0% 0 0%
Adult Supplemental Education 0 0 0% 0 0%
Tuition Reimbursement 0 0 0% 0 0%
Special Education Coop 0 0 0% 0 0%
TOTAL 193,496 15,828 -92% 26,200 66%
NOTE: Gifts/Grants includes private grants and grants from nonfederal sources.
Amount per pupil excludes the following funds: Adult Education, Adult Supplemental Education, Special Education Coop
and Tuition Reimbursement.
*Enrollment (FTE) includes the enrollment of the district used for state aid and budget authority, and all other preschool enrollment
and kindergarten students attending full time.
0
20,000
40,000
60,000
80,000
100,000
120,000
140,000
160,000
180,000
200,000
2011-2012 2012-2013 2013-2014
193,496
15,828 26,200
Other Costs
9/6/2013 3:30 PM Sumexpen.xlsx Page 14 of 24

USD# 101
Capital Improvements Expenditures (4000)
% %
2011-2012 2012-2013 inc/ 2013-2014 inc/
Actual Actual dec Budget dec
General 0 0 0% 0 0%
Federal Funds 0 0 0% 0 0%
Supplemental General 0 0 0% 0 0%
At Risk (4yr Old) 0 0 0% 0 0%
At Risk (K-12) 0 0 0% 0 0%
Bilingual Education 0 0 0% 0 0%
Virtual Education 0 0 0% 0 0%
Capital Outlay 977,061 69,336 -93% 222,000 220%
Driver Training 0 0 0% 0 0%
Declining Enrollment 0 0 0% 0 0%
Extraordinary School Program 0 0 0% 0 0%
Food Service 0 0 0% 0 0%
Professional Development 0 0 0% 0 0%
Parent Education Program 0 0 0% 0 0%
Summer School 0 0 0% 0 0%
Special Education 0 0 0% 0 0%
Cost of Living 0 0 0% 0 0%
Vocational Education 0 0 0% 0 0%
Gifts/Grants 0 0 0% 0 0%
Special Liability 0 0 0% 0 0%
School Retirement 0 0 0% 0 0%
Extraordinary Growth Facilities 0 0 0% 0 0%
Special Reserve 0 0 0%
KPERS Spec. Ret. Contribution 0 0 0% 0 0%
Contingency Reserve 0 0 0%
Text Book & Student Material 0 0 0%
Activity Fund 0 0 0% 0 0%
Bond and Interest #1 0 0 0% 0 0%
Bond and Interest #2 0 0 0% 0 0%
No-Fund Warrant 0 0 0% 0 0%
Special Assessment 0 0 0% 0 0%
Temporary Note 0 0 0% 0 0%
SUBTOTAL 977,061 69,336 -93% 222,000 220%
Enrollment (FTE)* 521.0 525.0 1% 525.0 0%
Amount per Pupil 1,875 132 -93% 423 220%
Adult Education 0 0 0% 0 0%
Adult Supplemental Education 0 0 0% 0 0%
Tuition Reimbursement 0 0 0% 0 0%
Special Education Coop 0 0 0% 0 0%
TOTAL 977,061 69,336 -93% 222,000 220%
NOTE: Gifts/Grants includes private grants and grants from nonfederal sources.
Amount per pupil excludes the following funds: Adult Education, Adult Supplemental Education, Special Education Coop
and Tuition Reimbursement.
*Enrollment (FTE) includes the enrollment of the district used for state aid and budget authority, and all other preschool enrollment
and kindergarten students attending full time.
0
100,000
200,000
300,000
400,000
500,000
600,000
700,000
800,000
900,000
1,000,000
2011-2012 2012-2013 2013-2014
977,061
69,336
222,000
Capital Improvements (4000)
9/6/2013 3:30 PM Sumexpen.xlsx Page 15 of 24
USD# 101
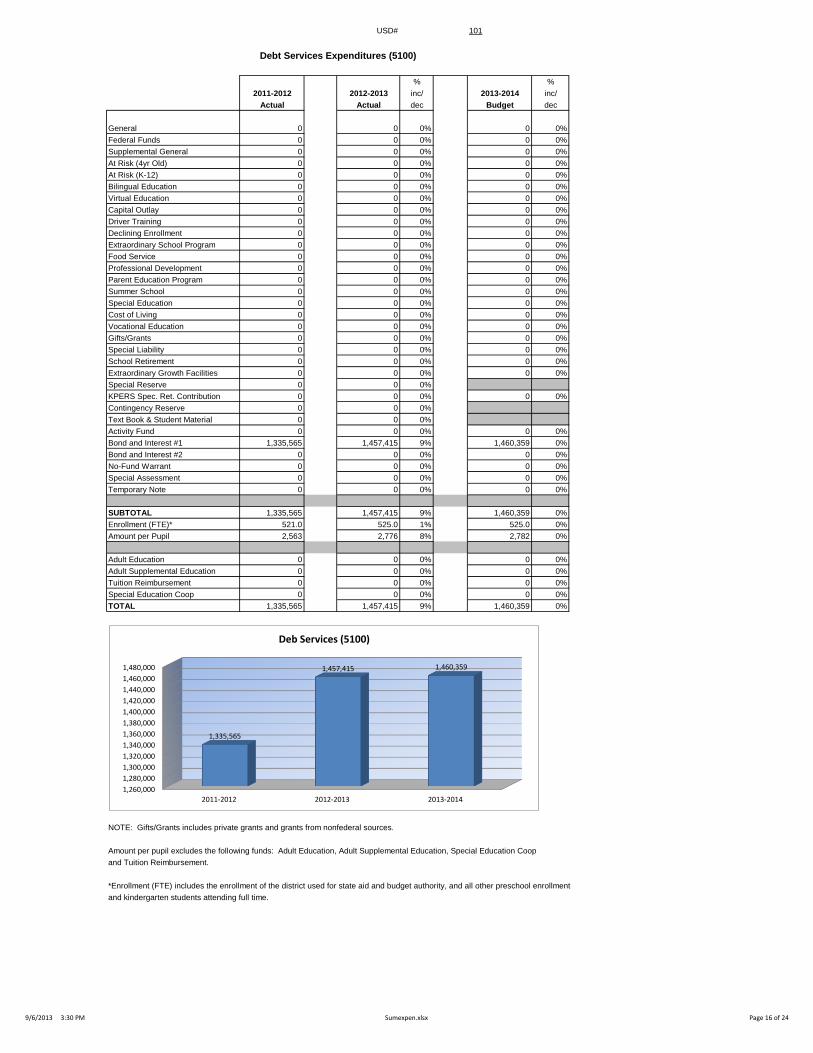
Debt Services Expenditures (5100)
% %
2011-2012 2012-2013 inc/ 2013-2014 inc/
Actual Actual dec Budget dec
General 0 0 0% 0 0%
Federal Funds 0 0 0% 0 0%
Supplemental General 0 0 0% 0 0%
At Risk (4yr Old) 0 0 0% 0 0%
At Risk (K-12) 0 0 0% 0 0%
Bilingual Education 0 0 0% 0 0%
Virtual Education 0 0 0% 0 0%
Capital Outlay 0 0 0% 0 0%
Driver Training 0 0 0% 0 0%
Declining Enrollment 0 0 0% 0 0%
Extraordinary School Program 0 0 0% 0 0%
Food Service 0 0 0% 0 0%
Professional Development 0 0 0% 0 0%
Parent Education Program 0 0 0% 0 0%
Summer School 0 0 0% 0 0%
Special Education 0 0 0% 0 0%
Cost of Living 0 0 0% 0 0%
Vocational Education 0 0 0% 0 0%
Gifts/Grants 0 0 0% 0 0%
Special Liability 0 0 0% 0 0%
School Retirement 0 0 0% 0 0%
Extraordinary Growth Facilities 0 0 0% 0 0%
Special Reserve 0 0 0%
KPERS Spec. Ret. Contribution 0 0 0% 0 0%
Contingency Reserve 0 0 0%
Text Book & Student Material 0 0 0%
Activity Fund 0 0 0% 0 0%
Bond and Interest #1 1,335,565 1,457,415 9% 1,460,359 0%
Bond and Interest #2 0 0 0% 0 0%
No-Fund Warrant 0 0 0% 0 0%
Special Assessment 0 0 0% 0 0%
Temporary Note 0 0 0% 0 0%
SUBTOTAL 1,335,565 1,457,415 9% 1,460,359 0%
Enrollment (FTE)* 521.0 525.0 1% 525.0 0%
Amount per Pupil 2,563 2,776 8% 2,782 0%
Adult Education 0 0 0% 0 0%
Adult Supplemental Education 0 0 0% 0 0%
Tuition Reimbursement 0 0 0% 0 0%
Special Education Coop 0 0 0% 0 0%
TOTAL 1,335,565 1,457,415 9% 1,460,359 0%
NOTE: Gifts/Grants includes private grants and grants from nonfederal sources.
Amount per pupil excludes the following funds: Adult Education, Adult Supplemental Education, Special Education Coop
and Tuition Reimbursement.
*Enrollment (FTE) includes the enrollment of the district used for state aid and budget authority, and all other preschool enrollment
and kindergarten students attending full time.
1,260,000
1,280,000
1,300,000
1,320,000
1,340,000
1,360,000
1,380,000
1,400,000
1,420,000
1,440,000
1,460,000
1,480,000
2011-2012 2012-2013 2013-2014
1,335,565
1,457,415 1,460,359
Deb Services (5100)
9/6/2013 3:30 PM Sumexpen.xlsx Page 16 of 24
USD# 101
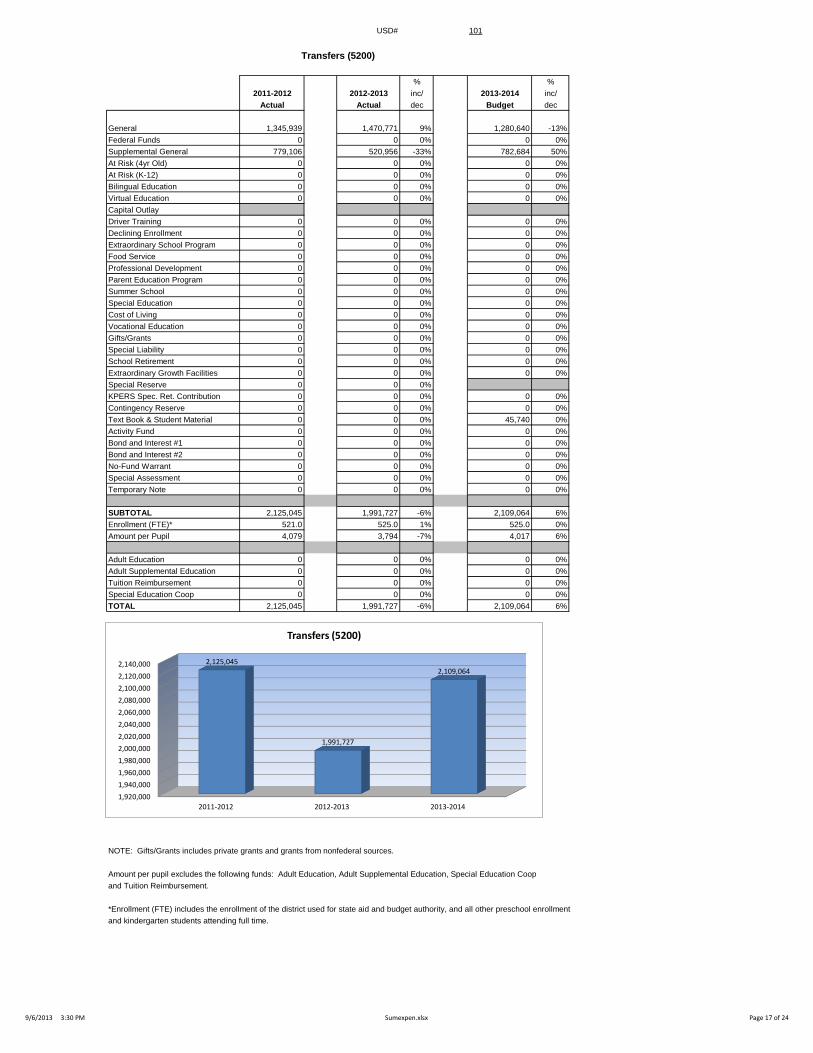
Transfers (5200)
% %
2011-2012 2012-2013 inc/ 2013-2014 inc/
Actual Actual dec Budget dec
General 1,345,939 1,470,771 9% 1,280,640 -13%
Federal Funds 0 0 0% 0 0%
Supplemental General 779,106 520,956 -33% 782,684 50%
At Risk (4yr Old) 0 0 0% 0 0%
At Risk (K-12) 0 0 0% 0 0%
Bilingual Education 0 0 0% 0 0%
Virtual Education 0 0 0% 0 0%
Capital Outlay
Driver Training 0 0 0% 0 0%
Declining Enrollment 0 0 0% 0 0%
Extraordinary School Program 0 0 0% 0 0%
Food Service 0 0 0% 0 0%
Professional Development 0 0 0% 0 0%
Parent Education Program 0 0 0% 0 0%
Summer School 0 0 0% 0 0%
Special Education 0 0 0% 0 0%
Cost of Living 0 0 0% 0 0%
Vocational Education 0 0 0% 0 0%
Gifts/Grants 0 0 0% 0 0%
Special Liability 0 0 0% 0 0%
School Retirement 0 0 0% 0 0%
Extraordinary Growth Facilities 0 0 0% 0 0%
Special Reserve 0 0 0%
KPERS Spec. Ret. Contribution 0 0 0% 0 0%
Contingency Reserve 0 0 0% 0 0%
Text Book & Student Material 0 0 0% 45,740 0%
Activity Fund 0 0 0% 0 0%
Bond and Interest #1 0 0 0% 0 0%
Bond and Interest #2 0 0 0% 0 0%
No-Fund Warrant 0 0 0% 0 0%
Special Assessment 0 0 0% 0 0%
Temporary Note 0 0 0% 0 0%
SUBTOTAL 2,125,045 1,991,727 -6% 2,109,064 6%
Enrollment (FTE)* 521.0 525.0 1% 525.0 0%
Amount per Pupil 4,079 3,794 -7% 4,017 6%
Adult Education 0 0 0% 0 0%
Adult Supplemental Education 0 0 0% 0 0%
Tuition Reimbursement 0 0 0% 0 0%
Special Education Coop 0 0 0% 0 0%
TOTAL 2,125,045 1,991,727 -6% 2,109,064 6%
NOTE: Gifts/Grants includes private grants and grants from nonfederal sources.
Amount per pupil excludes the following funds: Adult Education, Adult Supplemental Education, Special Education Coop
and Tuition Reimbursement.
*Enrollment (FTE) includes the enrollment of the district used for state aid and budget authority, and all other preschool enrollment
and kindergarten students attending full time.
1,920,000
1,940,000
1,960,000
1,980,000
2,000,000
2,020,000
2,040,000
2,060,000
2,080,000
2,100,000
2,120,000
2,140,000
2011-2012 2012-2013 2013-2014
2,125,045
1,991,727
2,109,064
Transfers (5200)
9/6/2013 3:30 PM Sumexpen.xlsx Page 17 of 24
USD# 101
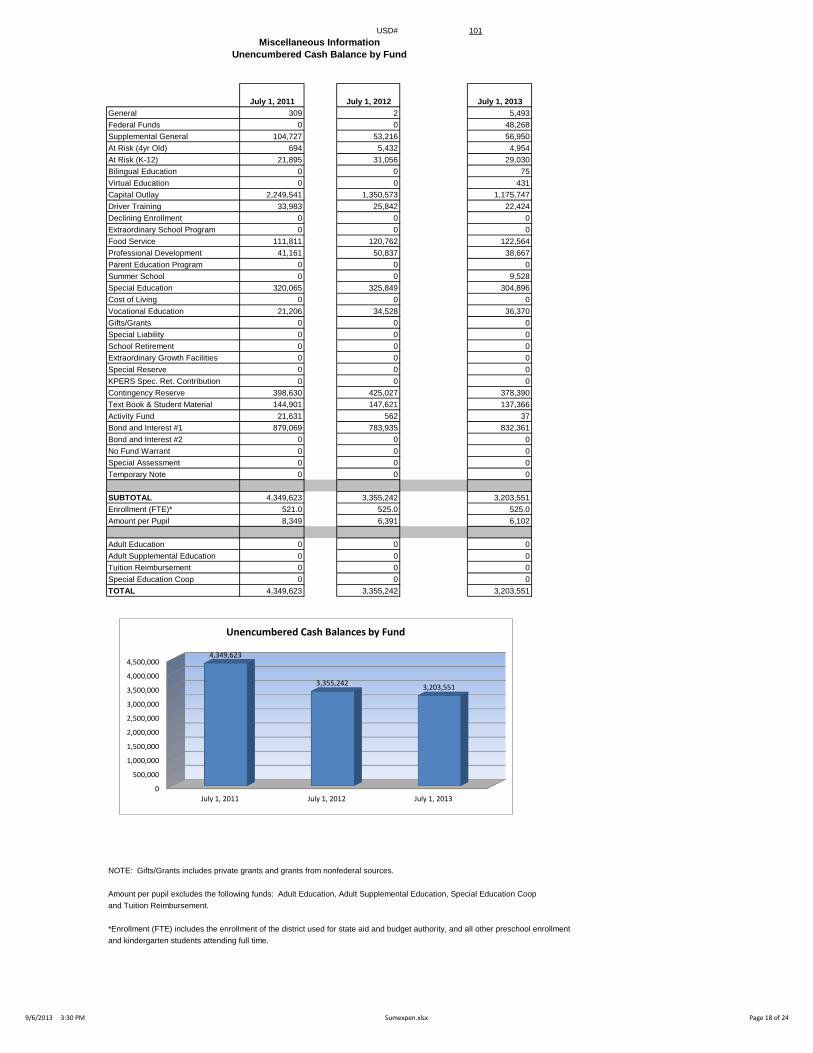
Miscellaneous Information
Unencumbered Cash Balance by Fund
July 1, 2011 July 1, 2012 July 1, 2013
General 309 2 5,493
Federal Funds 0 0 48,268
Supplemental General 104,727 53,216 56,950
At Risk (4yr Old) 694 5,432 4,954
At Risk (K-12) 21,895 31,056 29,030
Bilingual Education 0 0 75
Virtual Education 0 0 431
Capital Outlay 2,249,541 1,350,573 1,175,747
Driver Training 33,983 25,842 22,424
Declining Enrollment 0 0 0
Extraordinary School Program 0 0 0
Food Service 111,811 120,762 122,564
Professional Development 41,161 50,837 38,667
Parent Education Program 0 0 0
Summer School 0 0 9,528
Special Education 320,065 325,849 304,896
Cost of Living 0 0 0
Vocational Education 21,206 34,528 36,370
Gifts/Grants 0 0 0
Special Liability 0 0 0
School Retirement 0 0 0
Extraordinary Growth Facilities 0 0 0
Special Reserve 0 0 0
KPERS Spec. Ret. Contribution 0 0 0
Contingency Reserve 398,630 425,027 378,390
Text Book & Student Material 144,901 147,621 137,366
Activity Fund 21,631 562 37
Bond and Interest #1 879,069 783,935 832,361
Bond and Interest #2 0 0 0
No Fund Warrant 0 0 0
Special Assessment 0 0 0
Temporary Note 0 0 0
SUBTOTAL 4,349,623 3,355,242 3,203,551
Enrollment (FTE)* 521.0 525.0 525.0
Amount per Pupil 8,349 6,391 6,102
Adult Education 0 0 0
Adult Supplemental Education 0 0 0
Tuition Reimbursement 0 0 0
Special Education Coop 0 0 0
TOTAL 4,349,623 3,355,242 3,203,551
NOTE: Gifts/Grants includes private grants and grants from nonfederal sources.
Amount per pupil excludes the following funds: Adult Education, Adult Supplemental Education, Special Education Coop
and Tuition Reimbursement.
*Enrollment (FTE) includes the enrollment of the district used for state aid and budget authority, and all other preschool enrollment
and kindergarten students attending full time.
0
500,000
1,000,000
1,500,000
2,000,000
2,500,000
3,000,000
3,500,000
4,000,000
4,500,000
July 1, 2011 July 1, 2012 July 1, 2013
4,349,623
3,355,242 3,203,551
Unencumbered Cash Balances by Fund
9/6/2013 3:30 PM Sumexpen.xlsx Page 18 of 24
USD# 101
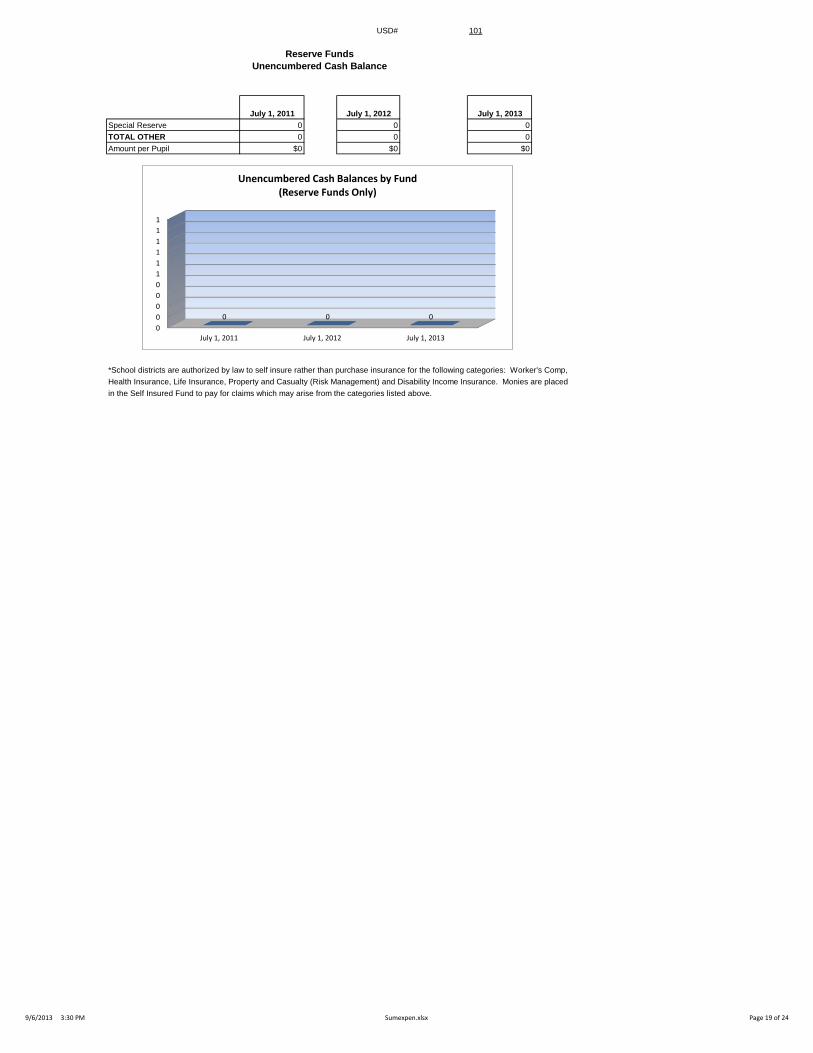
Reserve Funds
Unencumbered Cash Balance
July 1, 2011 July 1, 2012 July 1, 2013
Special Reserve 0 0 0
TOTAL OTHER 0 0 0
Amount per Pupil $0 $0 $0
*School districts are authorized by law to self insure rather than purchase insurance for the following categories: Worker's Comp,
Health Insurance, Life Insurance, Property and Casualty (Risk Management) and Disability Income Insurance. Monies are placed
in the Self Insured Fund to pay for claims which may arise from the categories listed above.
0
0
0
0
0
1
1
1
1
1
1
July 1, 2011 July 1, 2012 July 1, 2013
0 0 0
Unencumbered Cash Balances by Fund (Reserve Funds Only)
9/6/2013 3:30 PM Sumexpen.xlsx Page 19 of 24
USD# 101
2009-2010 2010-2011 % 2011-2012 % 2012-2013 % 2013-2014 %
Actual Actual inc/ Actual inc/ Actual inc/ Budget inc/
dec dec dec dec
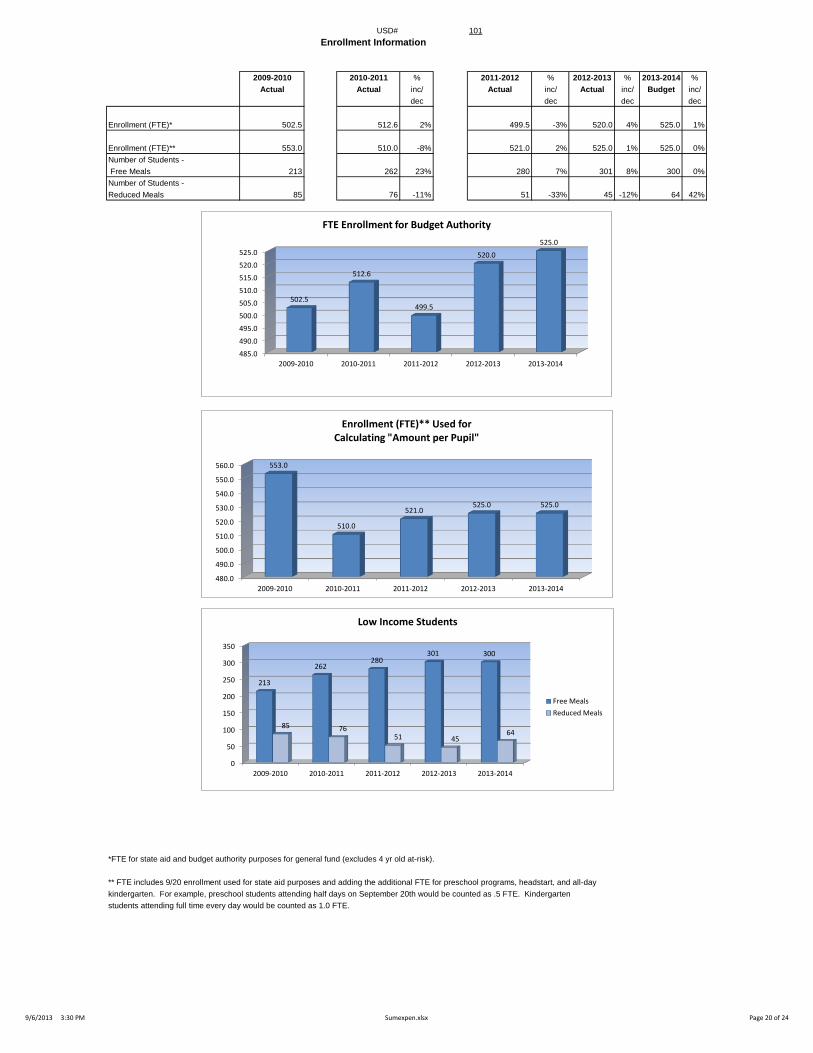
Enrollment (FTE)* 502.5 512.6 2% 499.5 -3% 520.0 4% 525.0 1%
Enrollment (FTE)** 553.0 510.0 -8% 521.0 2% 525.0 1% 525.0 0%
Number of Students -
Free Meals 213 262 23% 280 7% 301 8% 300 0%
Number of Students -
Reduced Meals 85 76 -11% 51 -33% 45 -12% 64 42%
*FTE for state aid and budget authority purposes for general fund (excludes 4 yr old at-risk).
** FTE includes 9/20 enrollment used for state aid purposes and adding the additional FTE for preschool programs, headstart, and all-day
kindergarten. For example, preschool students attending half days on September 20th would be counted as .5 FTE. Kindergarten
students attending full time every day would be counted as 1.0 FTE.
Enrollment Information
480.0
490.0
500.0
510.0
520.0
530.0
540.0
550.0
560.0
2009-2010 2010-2011 2011-2012 2012-2013 2013-2014
553.0
510.0
521.0 525.0 525.0
Enrollment (FTE)** Used for Calculating "Amount per Pupil"
0
50
100
150
200
250
300
350
2009-2010 2010-2011 2011-2012 2012-2013 2013-2014
213
262 280
301 300
85 76 51 45
64
Low Income Students
Free Meals
Reduced Meals
485.0
490.0
495.0
500.0
505.0
510.0
515.0
520.0
525.0
2009-2010 2010-2011 2011-2012 2012-2013 2013-2014
502.5
512.6
499.5
520.0
525.0
FTE Enrollment for Budget Authority
9/6/2013 3:30 PM Sumexpen.xlsx Page 20 of 24

USD# 101
Miscellaneous Information
Mill Rates by Fund
2011-2012 2012-2013 2013-2014
Actual Actual Budget
General 20.000 20.000 20.000
Supplemental General 23.308 23.582 29.745
Adult Education 0.000 0.000 0.000
Capital Outlay 0.000 0.000 0.000
Declining Enrollment 0.000 0.000 0.000
Cost of Living 0.000 0.000 0.000
Special Liability 0.000 0.000 0.000
School Retirement 0.000 0.000 0.000
Extraordinary Growth Facilities 0.000 0.000 0.000
Bond and Interest #1 31.684 36.344 30.103
Bond and Interest #2 0.000 0.000 0.000
No Fund Warrant 0.000 0.000 0.000
Special Assessment 0.000 0.000 0.000
Temporary Note 0.000 0.000 0.000
TOTAL USD 74.992 79.926 79.848
Historical Museum 0.000 0.000 0.000
Public Library Board 0.000 0.000 0.000
Public Library Brd & Emp Benf 0.000 0.000 0.000
Recreation Commission 0.000 0.000 0.000
Rec Comm Employee Bnfts 0.000 0.000 0.000
TOTAL OTHER 0.000 0.000 0.000
0.000
10.000
20.000
30.000
40.000
50.000
60.000
70.000
80.000
2011-2012 2012-2013 2013-2014
74.992 79.926 79.848
Total USD Mill Rates
General 25%
Supplemental General 37%
Bond and Interest #1 38%
2013-14 Miscellaneous Information Mill Rates by Fund (Total USD)
General
Supplemental General
Adult Education
Capital Outlay
Special Liability
School Retirement
Declining Enrollment
Cost of Living
Bond and Interest #1
Bond and Interest #2
Extraordinary Growth Facilities
No Fund Warrant
Special Assessment
Temporary Note
9/6/2013 3:30 PM Sumexpen.xlsx Page 21 of 24
USD# 101
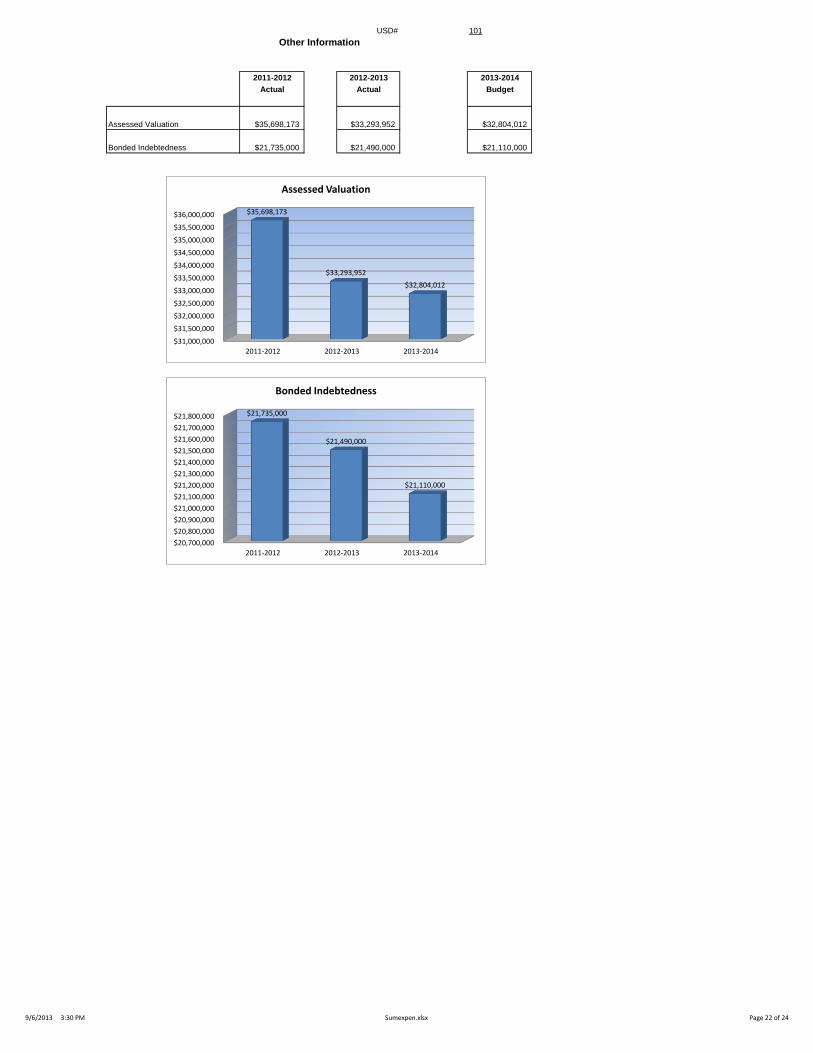
Other Information
2011-2012 2012-2013 2013-2014
Actual Actual Budget
Assessed Valuation $35,698,173 $33,293,952 $32,804,012
Bonded Indebtedness $21,735,000 $21,490,000 $21,110,000
$31,000,000
$31,500,000
$32,000,000
$32,500,000
$33,000,000
$33,500,000
$34,000,000
$34,500,000
$35,000,000
$35,500,000
$36,000,000
2011-2012 2012-2013 2013-2014
$35,698,173
$33,293,952
$32,804,012
Assessed Valuation
$20,700,000
$20,800,000
$20,900,000
$21,000,000
$21,100,000
$21,200,000
$21,300,000
$21,400,000
$21,500,000
$21,600,000
$21,700,000
$21,800,000
2011-2012 2012-2013 2013-2014
$21,735,000
$21,490,000
$21,110,000
Bonded Indebtedness
9/6/2013 3:30 PM Sumexpen.xlsx Page 22 of 24

USD 101
2013-14 Estimated Sources of Revenue--2013-14 Estimated
Amount July 1, 2013 State Federal Local July 1, 2014
Fund Budgeted Cash Balance Interest Transfers Other Cash Balance
General 4,754,198 5,493 4,145,646 0 45,740 557,319 XXXXXXXX
Supplemental General 1,595,830 56,950 524,412 1,014,468 XXXXXXXX
Adult Education 0 0 0 0 0 0 0 0
At Risk (4yr Old) 47,454 4,954 0 0 42,500 0 0
Adult Supplemental Education 0 0 0 0 0 0
At Risk (K-12) 658,768 29,030 0 0 627,712 2,026 0
Bilingual Education 2,075 75 0 0 2,000 0 0
Virtual Education 49,431 431 0 49,000 0 0
Capital Outlay 772,000 1,175,747 0 0 0 0 403,747
Driver Training 13,500 22,424 4,025 0 0 0 0 12,949
Declining Enrollment 0 0 0 0 XXXXXXXX
Extraordinary School Program 0 0 0 0 0 0 0
Food Service 486,000 122,564 2,588 182,662 0 124,000 73,549 19,363
Professional Development 50,000 38,667 0 0 20,000 0 8,667
Parent Education Program 0 0 0 0 0 0 0 0
Summer School 8,200 9,528 0 0 0 0 1,328
Special Education 1,122,852 304,896 0 0 0 1,038,112 0 220,156
Vocational Education 188,700 36,370 0 0 0 160,000 0 7,670
Special Liability Expense Fund 0 0 0 0 0
Special Reserve Fund 0 XXXXXXXX
Gifts and Grants 0 0 0 0
Textbook & Student Materials Revolving 137,366 XXXXXXXX
School Retirement 0 0 0 0 0
Extraordinary Growth Facilities 0 0 0 0 XXXXXXXXX
KPERS Special Retirement Contribution 328,444 0 328,444 XXXXXXXXX
Contingency Reserve 378,390 XXXXXXXXX
Activity Funds 37 XXXXXXXXX
Tuition Reimbursement 0 0 0 0 0
Bond and Interest #1 1,460,359 832,361 379,693 0 0 1,092,496 844,191
Bond and Interest #2 0 0 0 0 0 0 0
No Fund Warrant 0 0 0 0
Special Assessment 0 0 0 0
Temporary Note 0 0 0 0 0
Coop Special Education 0 0 0 0 0 0 0
Federal Funds 319,002 48,268 xxxxxxxxxxx 270,734 xxxxxxxxxxxx xxxxxxxxxxxx xxxxxxxxxxx 0
Cost of Living 0 0 xxxxxxxxxxx xxxxxxxxxxx xxxxxxxxxxxx 0 0 XXXXXXXXX
SUBTOTAL 11,856,813 3,203,551 5,384,808 453,396 0 2,109,064 2,739,858 1,518,071
Less Transfers 2,109,064
TOTAL Budget Expenditures $9,747,749
2011-2012 2012-2013 2013-2014
State Revenues 4,758,376 4,873,184 5,384,808
Federal Revenues 390,841 532,329 453,396
Local Revenues 5,182,055 4,940,447 4,848,922
Total Revenues 10,331,272 10,345,960 10,687,126
Revenues Per Pupil 19,830 19,707 20,356
Sources of Revenue and Proposed Budget for 2013-14
Sources of Revenue - - State, Federal, Local

Intentionally left blank