USAID FIRMS PROJECT Fruit Processing Facilitypdf.usaid.gov/pdf_docs/PA00K7SP.pdfUSAID FIRMS PROJECT...
40
USAID FIRMS PROJECT Fruit Processing Facility Pre-feasibility Study Report September, 2014 This publication was produced for review by the USAID. It was prepared by KPMG Taseer Hadi & Co. for an assignment commissioned by Chemonics International under the USAID Firms Project.
Transcript of USAID FIRMS PROJECT Fruit Processing Facilitypdf.usaid.gov/pdf_docs/PA00K7SP.pdfUSAID FIRMS PROJECT...

USAID FIRMS PROJECT
Fruit Processing Facility Pre-feasibility Study Report
September, 2014
This publication was produced for review by the USAID. It was prepared by KPMG Taseer Hadi & Co. for an assignment commissioned by Chemonics International under the USAID Firms Project.

USAID FIRMS PROJECT
Fruit Processing Facility Pre-feasibility Study Report
DISCLAIMER
The author’s views expressed in this publication do not necessarily reflect the views of the United States Agency for International Development, the United States Government or Chemonics International Inc.


USAID Firms Project Page. i
Data Page Contract Number: GBTI II Task Order No. EEM-4-07-07-00008-00
Contractor Name: Chemonics International, Inc.
Name of the Component: Value Chain Development (VCD)
USAID Technical Office: Office of the Economic Growth and Agriculture; USAID Pakistan
Date of Report: September, 2014
Document Title: Fruit Processing Facility - Pre-feasibility Study Report
Author’s Name: KPMG Taseer Hadi & Co. Chartered Accountants
Study Design and Methodology: KPMG Taseer Hadi & Co. Chartered Accountants
Editing: Saleem, M.
SOW Title and Work Plan & Action ID:
Technical support to conduct pre feasibility studies of various projects that fall under high economic growth sectors, Work Plan Level: 22190, Action ID No.: 7351, SOW No.: 2305
Project Area: Khyber Pakhtunkhwa, Pakistan
Key Words: Financial pre-feasibility, Fruit processing project, Khyber Pakhtunkhwa, Pre-feasibility report

USAID Firms Project Page. ii
USAID Firms Project Page. iii
Abstract: The USAID Pakistan Firms project aims to assist the Khyber Pakhtunkhwa Board of Investment and Trade (KPBOIT) in promoting investment and trade in the province. In an effort to achieve this aim preliminary feasibility studies have been conducted in order to highlight the investment opportunities available for international and domestic investors. The focus of these preliminary feasibility studies has been kept on the high economic growth sectors in KPK.
This report is a part of series of pre-feasibility studies conducted for identified projects. The information used for the preparation of this report has been gathered from various reliable sources including economic and statistical surveys carried out by the government of Pakistan. Competitor’s data and industry averages have been used as a basis for the preparation of preliminary financial projections.
This report provides a financial and economic analysis of the opportunities available in the sector and identifies the potential technical strengths and constraints that may be encountered by the investor(s) in undertaking the identified project. It aims to help the reader develop an understanding of the operational aspects of the sector and its growth potential in the country particularly in the Khyber Pakhtunkhwa province. An outline for a business plan has been prepared for the identified project which identifies the operational requirements (equipment, human resource, infrastructure etc.). The analysis is supported by preliminary financial projections for the first ten years of the business.

USAID Firms Project Page. iv
USAID Firms Project Page. v
Acronyms GDP Gross Domestic Product
HR Human Resource
IRR Internal Rate of return
IT Information Technology
KIBOR Karachi Inter Bank Offer Rate
KPBOIT Khyber Pakhtunkhwa Board of Investment and Trade
KPK Khyber PakhtunKhwa
NGO Non-Governmental Organization
NPV Net present Value
PKR Pakistani Rupee
ROI Return on Investment
SOW Scope of Work
US / USA United States of America
USAID United States Agency for International Development
USD United States Dollar

USAID Firms Project Page. vi
USAID Firms Project Page. vii
Table of Contents EXECUTIVE SUMMARY .......................................................................... IX
1. PROJECT BACKGROUND AND RATIONALE ................................. 1
1.1 INTRODUCTION .................................................................................... 1
1.2 INTRODUCTION TO KPBOIT ................................................................ 1
1.3 OVERVIEW OF HORTICULTURE SECTOR IN THE PROVINCE ........ 2
1.4 HARVEST SEASON .............................................................................. 3
1.5 LOCATION ............................................................................................. 3
1.6 CONCLUSION ....................................................................................... 4
1.7 KPBOIT ASSISTANCE .......................................................................... 4
2. PROJECT DESIGN AND PROCESSES ............................................ 5
2.1 FRESH FRUIT FACILITY ....................................................................... 5
2.2 FRUIT PULP PRODUCTION ................................................................. 6
2.3 DEHYDRATED PRODUCTS ................................................................. 8
3. FINANCIAL PRE-FEASIBILITY ......................................................... 9
3.1 PROJECT DESIGN ASSUMPTIONS..................................................... 9
3.2 PROJECT SET UP COSTS ................................................................... 9
3.3 OPERATING REVENUES ................................................................... 11
3.4 OPERATING COSTS ........................................................................... 13
3.5 DEPRECIATION ASSUMPTIONS ....................................................... 15
3.6 WORKING CAPITAL ASSUMPTIONS................................................. 15
3.7 FINANCING ASSUMPTIONS .............................................................. 16
3.8 PROJECT RETURNS .......................................................................... 16
4. APPENDICES .................................................................................. 19
APPENDIX -1 INDICATIVE FINANCIAL STATEMENTS ............................. 19

USAID Firms Project Page. viii
List of Tables Table 1: Exports of Major Fruits ........................................................................................................... 2
Table 2: Production of Fruits in Pakistan – in tonnes .................................................................... 2
Table 3: Fruit Area & Production over Five Years in Pakistan (2007-2012) .............................. 3
Table 4: Harvest Seasons ...................................................................................................................... 3
Table 5: Buildings and Infrastructure ................................................................................................. 9
Table 6: Project Capital Cost .............................................................................................................. 10
Table 7: Fresh Fruits Processing ....................................................................................................... 10
Table 8: Fruit Pulping Facility ............................................................................................................. 11
Table 9: Dehydration Equipment ....................................................................................................... 11
Table 10: Product Mix ........................................................................................................................... 12
Table 11: Selling Price .......................................................................................................................... 12
Table 12: Purchase Price ..................................................................................................................... 13
Table 13: Human Resource Requirements ...................................................................................... 14
Table 14: Other Costs ........................................................................................................................... 14
Table 15: Assets Useful Life ............................................................................................................... 15
Table 16: Working Capital Assumptions ......................................................................................... 15
List of Figures Figure 1: Fruit Pulp Production Process ........................................................................................... 7
Figure 2: Profit Margins ........................................................................................................................ 17
Figure 3: Free Cashflows ..................................................................................................................... 17
Figure 4: Revenue Comparison.......................................................................................................... 18
USAID Firms Project Page. ix
Executive Summary Chemonics International is implementing the USAID Pakistan Firms Project that works to develop a dynamic internationally competitive business sector to accelerate sales, increase exports, investment, job growth and produce higher value added products and services. Within the business enabling component, the project has initiated an assistance program for the Khyber Pakhtunkhwa Board of Investment and Trade (KPBOIT) to help it meet its mandate promoting investment and trade in the province. The KPBOIT was created with a mandate to advocate specific investment friendly reforms and advise the KPK government regarding the provision of adequate infrastructure facilities for making the KPK Province business environment more conducive to international investment.
The USAID Pakistan Firms project has selected KPMG Taseer Hadi & Co as the subcontractor to work closely with KP-BoIT to improve its institutional and working capacity.
Results of financial pre-feasibility
The Khyber Pakhtunkhwa Board of Investment and Trade (KPBOIT) is considering development of a multipurpose fruit processing facility in the province. The project will be housed on a total land area of five acres and will comprise of fresh fruit processing, fruit pulping and dehydrated fruit processing facilities.
Subject to approval from the provincial government, land will be offered for the project to investors through competitive bidding process. However, at this stage, the feasibility is based on the assumption that the investors will acquire land on their own. Identification of land and obtaining requisite approvals from the provincial government for construction of the proposed will be the responsibility of the investor. KPBOIT will facilitate the investor in obtaining requisite approvals for the project.
This pre-feasibility has been based on a series of assumptions with respect to design, size, costs, revenues, returns etc. However, these are indicative only and the investors might require to carry out their own feasibility studies.
The results of this financial pre-feasibility indicate that development of a fruit processing facility comprising of a fresh fruit processing facility, dehydration facility and a pulping facility on a total land area of five acres, will be a profitable financial investment.
The results of this financial pre-feasibility indicate that the project is capable of generating following results:
Equity IRR of 24.4% and
Project IRR of 19.96%
Following are the key assumptions/considerations for the investors which were used in this pre-feasibility and which form basis of projected returns from the project:
Total project outlay is estimated at PKR 326 million, financed through 40% equity and 60% debt. Total equity contribution will be required at around PKR 130 million.
The cost of equity has been assumed at 15%, whereas, cost of debt is estimated at KIBOR + 3% (13.5% total).
Cost estimates are based on competitor analysis and industry averages.

USAID Firms Project Page. x
Fruit Processing Facility - Pre-feasibility Study Report Final Report
USAID Firms Project Page. 1
1. Project Background and Rationale
1.1 Introduction
The horticulture sector contributes about 12% to the national agricultural GDP of Pakistan and holds great potential for increasing export of premium quality horticultural produce, and offering multiple employment opportunities throughout the supply chain, particularly in rural areas. Investment in the modern post-harvest management facilities (grading, packing, storage and transport/cool-chain) will reduce post-harvest losses, increased production surplus along with improving shelf life and quality of fresh produce, which will help meet the demand in domestic markets, as well as to substantially boost exports to highly lucrative and competitive international markets.
The Khyber Pakhtunkhwa Board of Investment and Trade (KPBOIT) has conceived an idea to develop a fruit processing facility in KPK. This study has been prepared to determine the financial feasibility of building and operating a fruit processing facility.
1.2 Introduction to KPBOIT
Khyber PakhtunKhwa Board of Investment and Trade (KPBOIT) is established for the promotion of trade and investment activities in Khyber PakhtunKhwa (KPK). Government of Khyber PakhtunKhwa is committed to bring economic prosperity in the Province through industrial and trade development and delegated this role to KP-BOIT.
KP-BOIT has accepted this challenging task towards achievement of its mission under the leadership of a dynamic Board Members comprising of eminent people of public and private sectors.
High motivation and commitment is there to achieve the vision to flourish the investment and trade in Khyber PakhtunKhwa making it most favorite investment destination for investors.
Our land is blessed with abundance of natural resources of Oil & Gas, Hydel Power Generation, Tourist Destinations, Mines and Minerals along with Agriculture. The Province is located at an outstanding geographical location.
KPBOIT is striving for exploiting the tremendous potential of the Province into reality and is focused on meeting its important objective of facilitating local and foreign investors desirous of benefiting from this huge potential of the KPK. Our aim is creating an attractive business environment through proactive policy advocacy both at the Provincial and Federal level. Another important role of awareness among investors is to the tremendous opportunities available for investment in KPK and therefore facilitating them for undertaking such investment as a joint venture partners.
We also act as a focal point of contact for both foreign and domestic investors providing information and assistance in coordination with other Government Departments and Agencies.
KPBOIT’s objectives are:
To flourish and revive the investment climate of Khyber Pakhtunkhwa and to make it a lucrative investment friendly destination.
To provide one window operation facility to investors by proactively engaging with all stakeholders to ensure successful investments.

Fruit Processing Facility - Pre-feasibility Study Report Final Report
USAID Firms Project Page. 2
To act as a bridge between investors and all related government and semi Government Departments/Organizations.
Advise the Provincial Government to create environment for investment through advocacy of specific investment friendly and comprehensive Public Private Partnership policies.
1.3 Overview of Horticulture Sector in the province
The Khyber Pakhtunkhwa province is blessed with five Agro-climatic zones, which gives it an edge over the rest of the country. The land is extremely fertile producing different crops, fruits and vegetables. Variety of corps including wheat, maize, rice, sugarcane, gram and barley are produced in the province. Districts including Charsadda, Mardan and Swabi are producing quality sugarcane. High quality tobacco is also produced in the province with around three fourth of the total production in the country.
The abundantly available variety of fruits and vegetables offers the opportunity to both local and foreign investors to establish industrial units for production of natural fruit juices and other fruit and vegetable based products or confectionary, such as Jams, Jellies, Pickles and Squashes manufacturing units. The conception of preserving fruits and vegetables in cans and bottles by preservation and dehydration is another lucrative investment opportunity to meet both local and international demand.
Government of Khyber Pakhtunkhwa is focused to exploit the potential in the Agriculture sector and take steps to promote the production and export potential of fruits and vegetables, along with major and minor crops of the Province. For many years, horticulture has been the leading sector for the economy of KPK.
Pakistan produces some of the world‘s best fruit varieties that are exported to over 40 countries.
Table 1: Exports of Major Fruits
Khyber Pakhtunkhwa Province is gifted with a natural ecology and land fit to grow a variety of quality crops, fruits and vegetables. About 30 varieties of Kharif and Rabi fruits are produced in KPK and orchards spread over 74,130 Acres.
Table 2: Production of Fruits in Pakistan – in tons
Quantity Value Quantity ValueAPPLE (FRESH) 1,448,951 48,862 1,328,972 47,914
APPLES (DRIED) 7,042 1,771 - -
PEARS AND QUINCES,(FRESH) 1,748,835 60,190 137,124 4,779
PEACHES(ARROO) 15,122 1,095 235 110
APRICORTS;FRESH(KHUBANI) 155,088 18,394 158,102 23,296
APRICOTS DRIED 326,125 78,470 644,217 158,715
PEACHES,(AAROO) FRESH 786,776 36,161 671,160 26,887
PLUMS AND SLOES 41,798 11,872 35,072 6,199
Total Exports 4,529,737 256,815 2,974,882 267,900
Source: Pakistan Bureau of Statistics
2011-12 2010-11Commodity

Fruit Processing Facility - Pre-feasibility Study Report Final Report
USAID Firms Project Page. 3
Table 3: Fruit Area & Production over Five Years in Pakistan (2007-2012)
1.4 Harvest Season
The following table details the harvest seasons for various fruits grown in the region:
Table 4: Harvest Seasons
Grapes August – November
Apple July – November
Mango May – August
Citrus November – February
Peach May - September
Apricot May - August
Cherry May - July
Plum May - June
Lychee July - August
Name of Fruit Harvest Season
1.5 Location
The Swat district is particularly suitable for fruit cultivation. This sector has faced a strong growth in the recent years and large areas of land have been converted to orchards. Grafting wild varieties with improved cultivars have led to a considerable increase in production.
YEAR PUNJAB SINDH KPK BALOCHISTANTOTAL
PAKISTAN
2007-08 400,905 150,098 120,425 255,177 852,630
2008-09 400,140 154,865 47,409 254,695 856,937
2009-10 395,933 157,829 47,026 251,734 857,093
2010-11 390,029 154,661 43,282 248,026 800,964
2011-12 387,612 142,373 43,108 249,406 829,616
source: Pakistan Bureau of Statistics
Year Area (Hectares) &
Production (Tonnes)Apple Appricot Peach Pear Plum
Area(Hectares) 113,043 31,256 15,624 2,105 7,602
Production (Tonnes) 441,575 240,192 82,392 24,152 73,053
Area(Hectares) 113,029 31,018 15,774 2,130 7,160
Production (Tonnes) 441,062 237,937 83,670 24,376 66,881
Area(Hectares) 111,597 30,206 15,349 3,130 6,960
Production (Tonnes) 366,360 193,936 53,994 20,225 57,470
Area(Hectares) 110,562 29,648 15,096 1,955 6,770
Production (Tonnes) 525,855 190,174 52,579 19,291 56,232
Area(Hectares) 110,411 29,634 15,409 1,942 6,781
Production (Tonnes) 598,804 189,420 54,378 19,071 56,223
source: Pakistan Bureau of Statistics
2010-11
2011-12
2007-08
2008-09
2009-10

Fruit Processing Facility - Pre-feasibility Study Report Final Report
USAID Firms Project Page. 4
This area is characterized by different agro meteorological conditions and therefore is suitable for the cultivation of several types of crops. Many varieties of fruit trees are cultivated in the area, such as apple, walnut, citrus, apricot, pear, peach, cherry, plum.
1.6 Conclusion
The results of pre-feasibility study indicate that there is considerable potential for investment in the fruit processing project in the Swat valley. The project can benefit from abundant supply of high quality fruits in the valley and limited existing fruit processing facilities.
1.7 KPBOIT Assistance
In accordance with the objectives of the KPBOIT, it will serve as one window facilitation center for the investors with respect to the proposed project. KPBOIT will assist the investors, in relation to the proposed project, through:
Obtaining requisite approvals from the provincial government;
Provision of land for the project on lease basis;
Provision of pre-feasibility study for the project; and
Assistance in arranging utilities etc.

Fruit Processing Facility - Pre-feasibility Study Report Final Report
USAID Firms Project Page. 5
2. Project Design and Processes
The project is aimed at developing fresh fruit processing, fruit pulp preparation and fruit dehydration. Rationale and processes of each of the facility are explained below:
2.1 Fresh Fruit Facility
Fruit consumers are getting hygiene conscious day by day throughout the country and abroad and try to purchase properly processed and packed fruits from well-established stores. The target customers for the fresh fruit processing unit are domestic and international fruit wholesalers and retailers. However, the investors may establish their own fruit shops in different areas depending upon the market demand.
Fresh fruit processing process is explained below:
Washing and Sterilization
Fruits are washed and disinfected with the introduction of chlorine and other chemical disinfectant.
Sorting
The sorting of Fruits are carried out according to predetermined parameter as per demand led strategy.
Defect Identification
The defected fruits including culls are identified and are removed from the processing line.
Waxing
The fruits are waxed to protect the fruit humidity.
Additional protective coating
An extra precautionary protective and decorative value added measure as per the demand of the consumer market.
Drying
After waxing fruits are dried through drying tunnel in a very precise manner.
Grading
Color grading
Size grading
Weight grading
Shape grading
Packing
The packing of fruits are carried out as per requirement. Mostly fruits are packed in 5Kg and10Kg (corrugated carton packs) for each variety of the graded fruit.

Fruit Processing Facility - Pre-feasibility Study Report Final Report
USAID Firms Project Page. 6
2.2 Fruit Pulp Production
Fruit pulp is an important value added product and has a high demand in both local and export markets. The local market of fruit juices, nectars and drinks has been growing at a very high rate. Consequently, the demand for fruit pulps has also increased during this period. The product will be sold in local and export markets. The proposed facility will contribute towards reducing the postharvest losses, increasing employment opportunities in the area and maximizing crop value for the farmers.
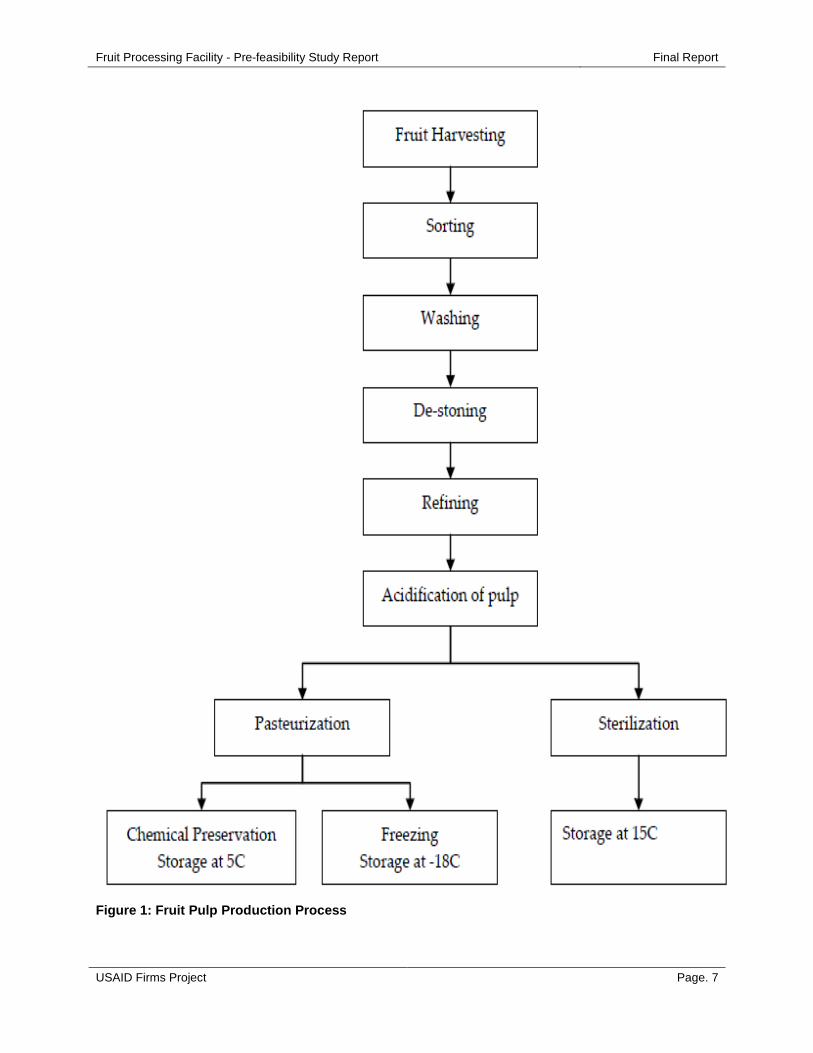
Fruit pulp is the raw material for making ready-to-drinks and juices. Local market for fruit drinks and juices has grown at very high rates during the past years. The diagram on the ensuing page provides summary of fruit pulp production process.
Fruit Processing Facility - Pre-feasibility Study Report Final Report
USAID Firms Project Page. 7
Figure 1: Fruit Pulp Production Process
Fruit Processing Facility - Pre-feasibility Study Report Final Report
USAID Firms Project Page. 8
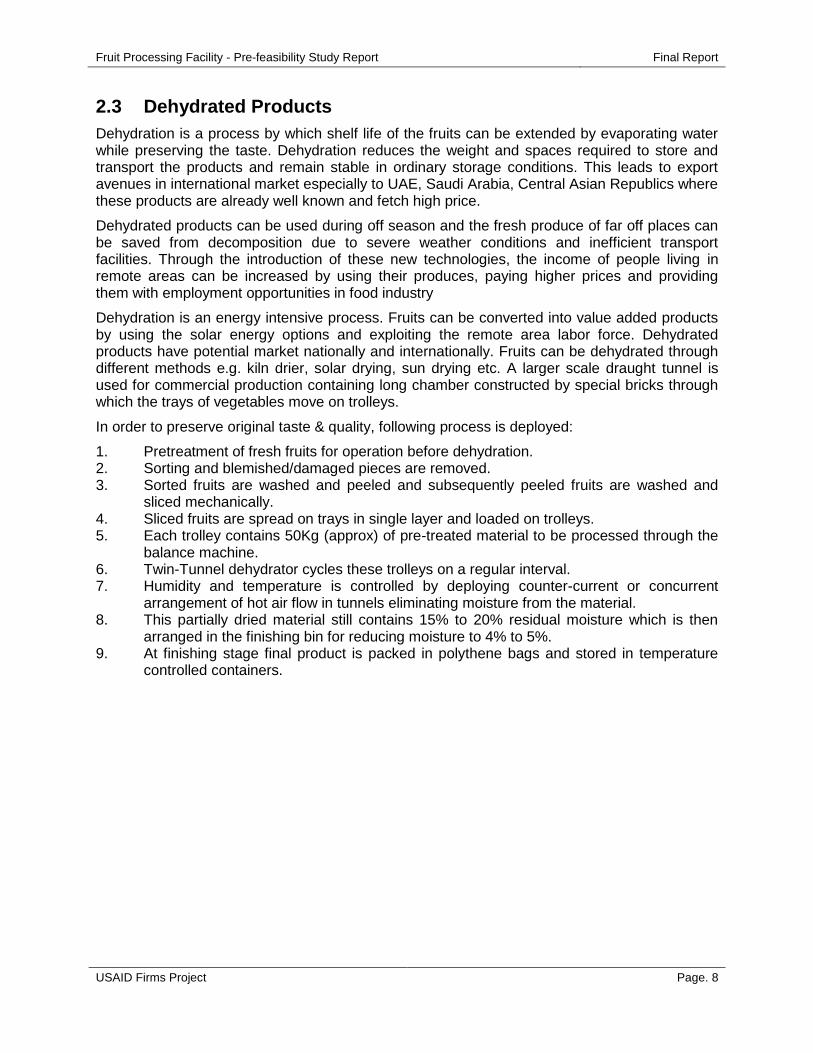
2.3 Dehydrated Products
Dehydration is a process by which shelf life of the fruits can be extended by evaporating water while preserving the taste. Dehydration reduces the weight and spaces required to store and transport the products and remain stable in ordinary storage conditions. This leads to export avenues in international market especially to UAE, Saudi Arabia, Central Asian Republics where these products are already well known and fetch high price.
Dehydrated products can be used during off season and the fresh produce of far off places can be saved from decomposition due to severe weather conditions and inefficient transport facilities. Through the introduction of these new technologies, the income of people living in remote areas can be increased by using their produces, paying higher prices and providing them with employment opportunities in food industry
Dehydration is an energy intensive process. Fruits can be converted into value added products by using the solar energy options and exploiting the remote area labor force. Dehydrated products have potential market nationally and internationally. Fruits can be dehydrated through different methods e.g. kiln drier, solar drying, sun drying etc. A larger scale draught tunnel is used for commercial production containing long chamber constructed by special bricks through which the trays of vegetables move on trolleys.
In order to preserve original taste & quality, following process is deployed:
1. Pretreatment of fresh fruits for operation before dehydration. 2. Sorting and blemished/damaged pieces are removed. 3. Sorted fruits are washed and peeled and subsequently peeled fruits are washed and
sliced mechanically. 4. Sliced fruits are spread on trays in single layer and loaded on trolleys. 5. Each trolley contains 50Kg (approx) of pre-treated material to be processed through the
balance machine. 6. Twin-Tunnel dehydrator cycles these trolleys on a regular interval. 7. Humidity and temperature is controlled by deploying counter-current or concurrent
arrangement of hot air flow in tunnels eliminating moisture from the material. 8. This partially dried material still contains 15% to 20% residual moisture which is then
arranged in the finishing bin for reducing moisture to 4% to 5%. 9. At finishing stage final product is packed in polythene bags and stored in temperature
controlled containers.

Fruit Processing Facility - Pre-feasibility Study Report Final Report
USAID Firms Project Page. 9
3. Financial Pre-feasibility 3.1 Project design assumptions
The project aims at the development of a fruit processing facility in the Swat valley. Based on the high quality produce available in the valley, the project is aimed at processing the following fruits:
Apples
Pears
Peaches
Apricots
Plums
The facility will be constructed over a land area of five acres valued at PKR 1.5 million per acre. The facility will be further divided into three sections each responsible for the production of a different fruit based product:
Fresh fruit processing facility
Fruit pulping facility
Fruit dehydration facility
The area required for development of buildings and related infrastructure for these sections is detailed in the following table:
Table 5: Buildings and Infrastructure
Area of Building and Infrastructure in Sq Ft
Fresh fruits processing facility 12,000
Fruit pulping facility 15,000
Dehydration facility 8,000
Management building/ services 10,000
Stores including clod storage 15,000
3.2 Project set up costs
The total project outlay has been estimated at PKR 300.99 million. In addition to these set up costs, working capital injection of around PKR 25 million will be required initially.
Please refer table below for detailed breakdown of project set up costs.

Fruit Processing Facility - Pre-feasibility Study Report Final Report
USAID Firms Project Page. 10
Table 6: Project Capital Cost
Project Capital Cost (PKR)
Land 5 acres @ PKR 1.5 million per acre 7,500,000
Building and related infrastructure
Fresh fruits processing facility 14,400,000
Fruit pulping facility - 15,000 SFT 18,000,000
Dehydration facility - 8,000 SFT 9,600,000
Management building/ services - 10,000 SFT 12,000,000
Stores including clod storage - 15,000 SFT 18,000,000
Machinery and equipment
Fresh fruits processing facility 24,426,800
Fruit pulping facility 114,954,000
Dehydration facility 18,200,000
Genset, chiller and other accessories/ equipment 26,500,000
Furniture, fixtures, office equipment & MIS 5,000,000
Vehicles 6,000,000
Interest during construction 26,404,837
Total Capital Cost 300,985,637
The fruit processing facility will comprise of 3 facilities producing separate products. The following tables provide details of the building and infrastructure requirements for the 3 facilities.
Table 7: Fresh Fruits Processing
Fresh fruits grading, waxing and processing (PKR)
Roller Feed Conveyer 6,624,000
Roller Sorting Conveyer 4,416,000
Roller Brush Washer 1,104,000
Roller Foam Dryer 800,400
Hot Air Dryer 1,800,000
Roller Sorter 1,214,400
Roller Waxing System 2,600,000
Hot Air Dryer (II) 1,800,000
Sizer/Grader 1,368,000
Main Sorted Fruit Conveyers 1,200,000
Packing Conveyers and Trays 1,500,000
24,426,800

Fruit Processing Facility - Pre-feasibility Study Report Final Report
USAID Firms Project Page. 11
Table 8: Fruit Pulping Facility
Fruit pulping facility (PKR)
Fruit de-stoning machine 6,072,000
Chopping machine/hammer mill 8,280,000
Thermo break 6,624,000
Two stage refiner 20,976,000
Monix pumps 7,176,000
Sterilizer/Pasteurizer 10,488,000
Conveyor / elevators 6,900,000
Aseptic filling system 16,560,000
Stainless steel tanks 8,832,000
SS screw conveyer for waste removal 12,696,000
Brushing machine 10,350,000
114,954,000
Table 9: Dehydration Equipment
Dehydration equipment (PKR)
Peeling, chopping and slicing equipment 800,000
Dicing Machine 750,000
Blanching / Sulphiting Tank 500,000
Steam Blancher, Trolly Load 1,200,000
Twin Tunnel Dehydrator 2,800,000
Trolly-Dehydrator 1,750,000
Finishing chanmbers & bins 900,000
Grinding Mill 2,000,000
Threshing Machine 600,000
Storage Vessels 800,000
Steam Jacketed Kettles 1,600,000
Boiler 500,000
Laboratory Equipments 1,000,000
Storage Conveyors 800,000
Rotto Sealer Machine & Poly Sealer-Paddle 2,200,000
18,200,000
3.3 Operating revenues
Revenue will be generated from the sale of three types of products:
Fresh fruit
Fruit pulp
Fruit Processing Facility - Pre-feasibility Study Report Final Report
USAID Firms Project Page. 12
Dehydrated fruit
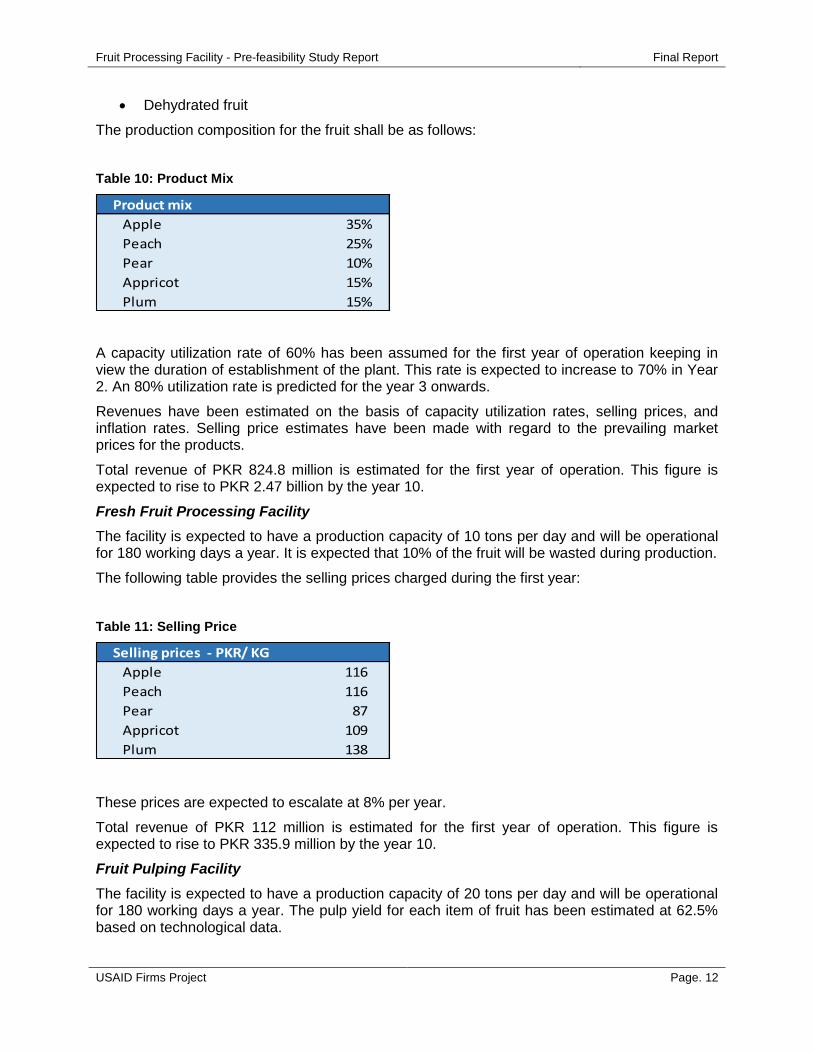
The production composition for the fruit shall be as follows:
Table 10: Product Mix
Product mix
Apple 35%
Peach 25%
Pear 10%
Appricot 15%
Plum 15%
A capacity utilization rate of 60% has been assumed for the first year of operation keeping in view the duration of establishment of the plant. This rate is expected to increase to 70% in Year 2. An 80% utilization rate is predicted for the year 3 onwards.
Revenues have been estimated on the basis of capacity utilization rates, selling prices, and inflation rates. Selling price estimates have been made with regard to the prevailing market prices for the products.
Total revenue of PKR 824.8 million is estimated for the first year of operation. This figure is expected to rise to PKR 2.47 billion by the year 10.
Fresh Fruit Processing Facility
The facility is expected to have a production capacity of 10 tons per day and will be operational for 180 working days a year. It is expected that 10% of the fruit will be wasted during production.
The following table provides the selling prices charged during the first year:
Table 11: Selling Price
Selling prices - PKR/ KG
Apple 116
Peach 116
Pear 87
Appricot 109
Plum 138
These prices are expected to escalate at 8% per year.
Total revenue of PKR 112 million is estimated for the first year of operation. This figure is expected to rise to PKR 335.9 million by the year 10.
Fruit Pulping Facility
The facility is expected to have a production capacity of 20 tons per day and will be operational for 180 working days a year. The pulp yield for each item of fruit has been estimated at 62.5% based on technological data.

Fruit Processing Facility - Pre-feasibility Study Report Final Report
USAID Firms Project Page. 13
The product will have an average selling price of PKR 180,000/ton. This price is expected to escalate at a rate of 8% per year.
Total revenue of PKR 388.8 million is estimated for the first year of operation. This figure is expected to rise to PKR 1.16 billion by the year 10.
Dehydrating Facility
The facility is expected to have an annual plant capacity of 1000 tons. The dehydration ratio for each item of fruit has been estimated at 17.5% based on technological data.
The product will have an average selling price of PKR 540/kg. This price is expected to escalate at a rate of 8% per year.
Total revenue of PKR 324 million is estimated for the first year of operation. This figure is expected to rise to PKR 971.5 million by the year 10.
3.4 Operating costs
Fruit Purchase Cost
The following table details the cost of each type of fruit in Year 1:
Table 12: Purchase Price
Base purchase price - PKR/ KG
Apple 80
Peach 80
Pear 60
Appricot 75
Plum 95
These costs are expected to increase by 8% per year.
Human Resource:
The following table detail the number of staff required for the operation of each section of the facility along with their annual salary:

Fruit Processing Facility - Pre-feasibility Study Report Final Report
USAID Firms Project Page. 14
Table 13: Human Resource Requirements
Dehydration
Facility
Fresh Fruits
Processing
Fruit Pulping
Facility
Number of Staff
Manager and supervisors 4 4 8
Skilled and semi-skilled
Labor20 20 36
Annual Salary (PKR)
Manager and supervisors 2,400,000 2,400,000 4,800,000
Skilled and semi-skilled
Labor4,320,000 4,320,000 7,776,000
HR costs of PKR 26 million have been estimated for the first year of operation. This figure is expected to rise at a rate of 8% per year to PKR 52 million by the year 10.
The following categories of employees will be required:
Manager
Supervisor
Food Technologist
Processing Plant Operator
Helper
Machine Mechanic
Packers
Accounts Administrator
Store Clerk
Driver
Security Guards
Peon
Trainings will be provided to workers when needed with regard to the proper operation of the facility to help them perform their duties more efficiently, reduce losses, and thereby increase profitability.
Other Costs
Other costs incurred during the fruit processing are detailed in the tables below. All of these costs are expected to escalate at 8% per annum.
Table 14: Other Costs
Fresh Fruits Processing
Packing cost - PKR/ KG 8
Waxing cost - PKR/ KG 5
Other overheads - PKR/ month 300,000

Fruit Processing Facility - Pre-feasibility Study Report Final Report
USAID Firms Project Page. 15
Repair and Maintenance Costs
Repair and maintenance cost are expected to be low in the initial years of operation as the assets will newly built up or installed . However, a maintenance fund model has been assumed with costs at 5% of P & M cost. Over time as assets become older, expenses towards repairs and maintenance will increase.
Insurance costs
Insurance costs have been estimated at 1% per annum of the total project costs. This figure is expected to increase at 5% per year.
3.5 Depreciation Assumptions
The following assumptions for useful life of assets have been applied for the purposes of financial pre-feasibility study:
Table 15: Assets Useful Life
Assets useful life (Years)
Plant and machinery 15
Building 20
Furniture, fixtures & office equipment 10
Vehicles 10
3.6 Working capital assumptions
The following working capital assumptions have been applied for the purposes of financial pre-feasibility study:
Table 16: Working Capital Assumptions
Working capital assumptions
Raw material (inventory in months) 1
Finished product (months) 1
Trade debts (days) 25
Trade creditors (days) 60
Fruit Pulping Facility
Aseptic bag - PKR/ Ton 4,450
Drum - PKR/ Ton 11,400
Processing cost - PKR/ Ton 8,500
Overheads - PKR/ Ton 5,000
Dehydration Facility
Processing cost - PKR/ KG 30
Overheads - PKR/ KG 22
Packing Cost - PKR/ KG 15

Fruit Processing Facility - Pre-feasibility Study Report Final Report
USAID Firms Project Page. 16
3.7 Financing Assumptions
For the purpose of this financial pre-feasibility, the debt to equity ratio has been assumed as 60% debt and 40% equity. At these levels, the investors will be required to plough in equity of PKR 120.3 million in the first year Debt financing of up to PKR 180.5 million will be required during the construction period of the project. Financing cost has been estimated at KIBOR (currently 10.5%) + 3%.
3.8 Project returns
The indicative project and equity return have been identified below. The NPV has been calculated with reference to a hurdle rate of 15%.
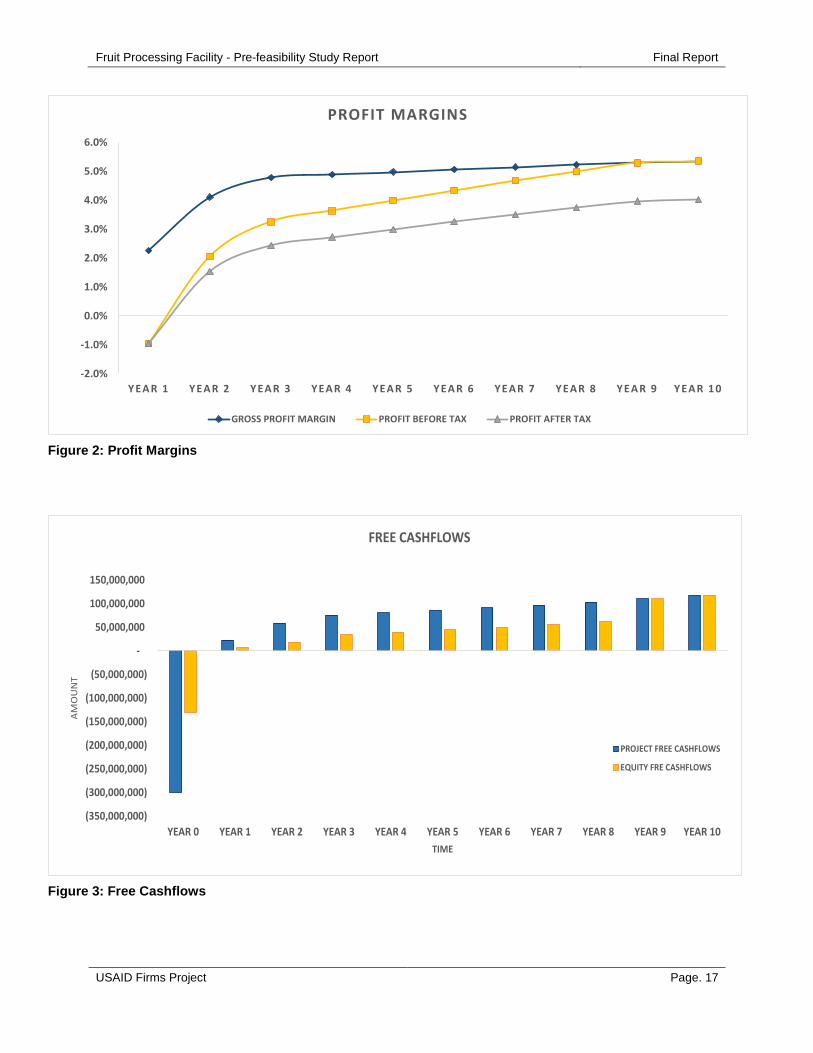
Based on cash flow projections prepared after taking into consideration project set up costs and operating results, the project is expected to generate IRR of 24.4% for the equity investor. Please refer charts on the following pages for profitability analysis.
Project IRR 19.96%
Project NPV @15% 63,785,726
Equity IRR 24.40%
Equity NPV @15% 68,035,256
Fruit Processing Facility - Pre-feasibility Study Report Final Report
USAID Firms Project Page. 17
Figure 2: Profit Margins
Figure 3: Free Cashflows
-2.0%
-1.0%
0.0%
1.0%
2.0%
3.0%
4.0%
5.0%
6.0%
YEAR 1 YEAR 2 YEAR 3 YEAR 4 YEAR 5 YEAR 6 YEAR 7 YEAR 8 YEAR 9 YEAR 10
PROFIT MARGINS
GROSS PROFIT MARGIN PROFIT BEFORE TAX PROFIT AFTER TAX
(350,000,000)
(300,000,000)
(250,000,000)
(200,000,000)
(150,000,000)
(100,000,000)
(50,000,000)
-
50,000,000
100,000,000
150,000,000
YEAR 0 YEAR 1 YEAR 2 YEAR 3 YEAR 4 YEAR 5 YEAR 6 YEAR 7 YEAR 8 YEAR 9 YEAR 10
AM
OU
NT
TIME
FREE CASHFLOWS
PROJECT FREE CASHFLOWS
EQUITY FRE CASHFLOWS

Fruit Processing Facility - Pre-feasibility Study Report Final Report
USAID Firms Project Page. 18
Figure 4: Revenue Comparison
- 500,000,000 1,000,000,000 1,500,000,000
YEAR 1
YEAR 2
YEAR 3
YEAR 4
YEAR 5
YEAR 6
YEAR 7
YEAR 8
YEAR 9
YEAR 10
REVENUE
TIM
ECOMPARISON OF REVENUE GENERATED BY EACH FACILITY
DEHYDRATED FRUIT
FRUIT PULP
FRESH PROCESSED FRUIT
Fruit Processing Facility - Pre-feasibility Study Report Final Report
USAID Firms Project Page. 19
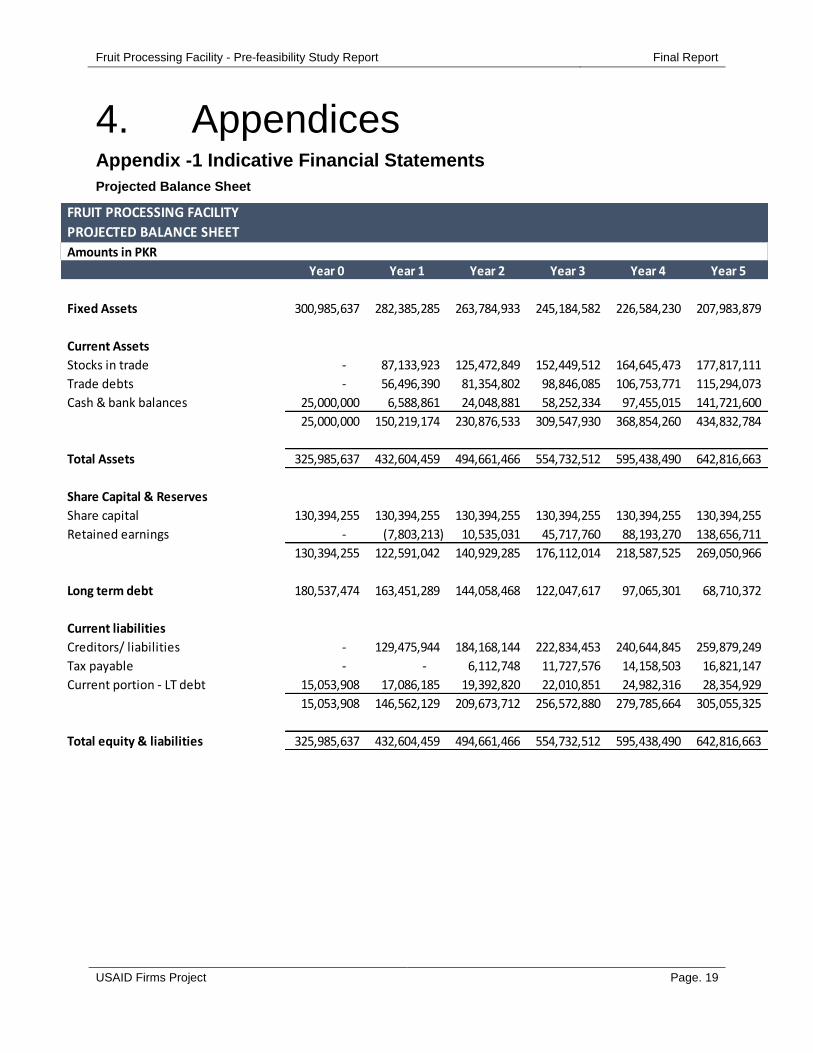
4. Appendices Appendix -1 Indicative Financial Statements
Projected Balance Sheet
Year 0 Year 1 Year 2 Year 3 Year 4 Year 5
Fixed Assets 300,985,637 282,385,285 263,784,933 245,184,582 226,584,230 207,983,879
Current Assets
Stocks in trade - 87,133,923 125,472,849 152,449,512 164,645,473 177,817,111
Trade debts - 56,496,390 81,354,802 98,846,085 106,753,771 115,294,073
Cash & bank balances 25,000,000 6,588,861 24,048,881 58,252,334 97,455,015 141,721,600
25,000,000 150,219,174 230,876,533 309,547,930 368,854,260 434,832,784
Total Assets 325,985,637 432,604,459 494,661,466 554,732,512 595,438,490 642,816,663
Share Capital & Reserves
Share capital 130,394,255 130,394,255 130,394,255 130,394,255 130,394,255 130,394,255
Retained earnings - (7,803,213) 10,535,031 45,717,760 88,193,270 138,656,711
130,394,255 122,591,042 140,929,285 176,112,014 218,587,525 269,050,966
Long term debt 180,537,474 163,451,289 144,058,468 122,047,617 97,065,301 68,710,372
Current liabilities
Creditors/ liabilities - 129,475,944 184,168,144 222,834,453 240,644,845 259,879,249
Tax payable - - 6,112,748 11,727,576 14,158,503 16,821,147
Current portion - LT debt 15,053,908 17,086,185 19,392,820 22,010,851 24,982,316 28,354,929
15,053,908 146,562,129 209,673,712 256,572,880 279,785,664 305,055,325
Total equity & liabilities 325,985,637 432,604,459 494,661,466 554,732,512 595,438,490 642,816,663
FRUIT PROCESSING FACILITY
PROJECTED BALANCE SHEET
Amounts in PKR

Fruit Processing Facility - Pre-feasibility Study Report Final Report
USAID Firms Project Page. 20
Year 6 Year 7 Year 8 Year 9 Year 10
Fixed Assets 189,383,527 170,783,175 152,182,824 133,582,472 114,982,121
Current Assets
Stocks in trade 192,042,480 207,405,878 223,998,348 241,918,216 261,271,674
Trade debts 124,517,599 134,479,007 145,237,327 156,856,314 169,404,819
Cash & bank balances 191,425,144 246,963,884 308,762,608 418,732,787 535,897,745
507,985,223 588,848,769 677,998,284 817,507,317 966,574,237
Total Assets 697,368,750 759,631,945 830,181,108 951,089,789 1,081,556,358
Share Capital & Reserves
Share capital 130,394,255 130,394,255 130,394,255 130,394,255 130,394,255
Retained earnings 197,873,610 266,687,479 346,028,299 436,921,983 536,303,238
328,267,864 397,081,733 476,422,554 567,316,237 666,697,493
Long term debt 36,527,528 - - - -
Current liabilities
Creditors/ liabilities 280,651,547 303,084,727 327,311,614 353,475,658 381,731,780
Tax payable 19,738,966 22,937,956 26,446,940 30,297,895 33,127,085
Current portion - LT debt 32,182,844 36,527,528 - - -
332,573,358 362,550,212 353,758,554 383,773,552 414,858,865
Total equity & liabilities 697,368,750 759,631,945 830,181,108 951,089,789 1,081,556,358
FRUIT PROCESSING FACILITY
PROJECTED BALANCE SHEET
Amounts in PKR
Fruit Processing Facility - Pre-feasibility Study Report Final Report
USAID Firms Project Page. 21
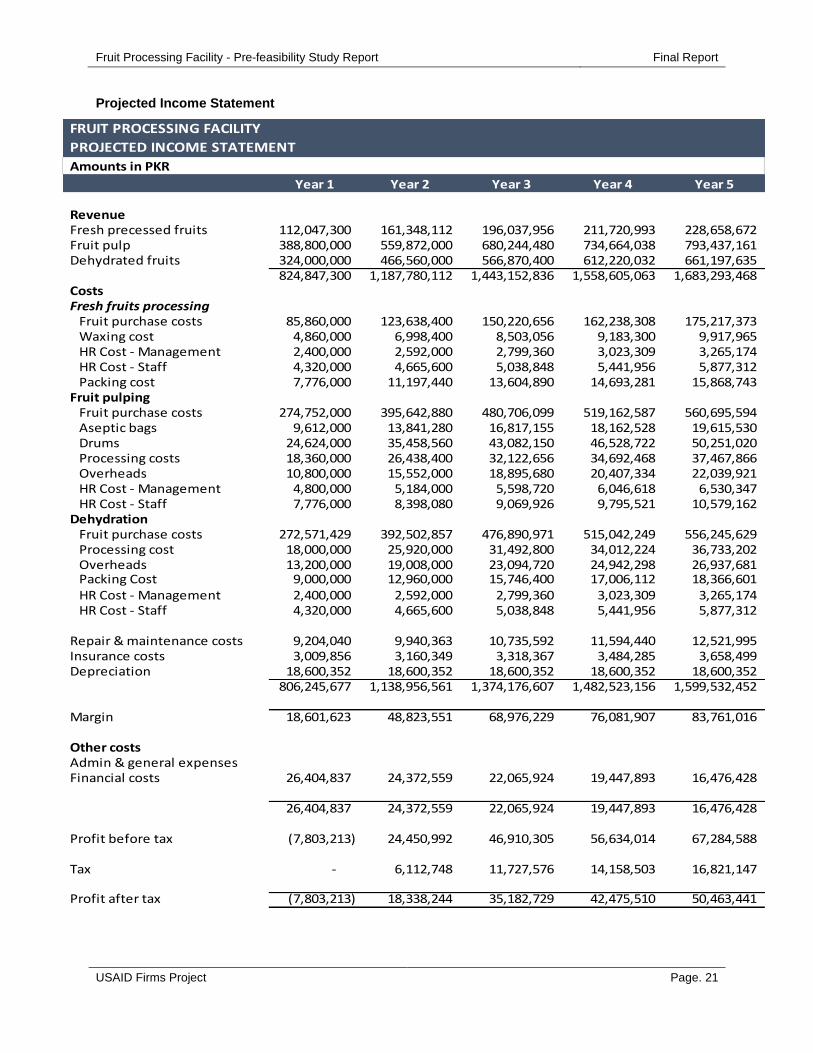
Projected Income Statement
Year 1 Year 2 Year 3 Year 4 Year 5
RevenueFresh precessed fruits 112,047,300 161,348,112 196,037,956 211,720,993 228,658,672 Fruit pulp 388,800,000 559,872,000 680,244,480 734,664,038 793,437,161 Dehydrated fruits 324,000,000 466,560,000 566,870,400 612,220,032 661,197,635
824,847,300 1,187,780,112 1,443,152,836 1,558,605,063 1,683,293,468 CostsFresh fruits processing
Fruit purchase costs 85,860,000 123,638,400 150,220,656 162,238,308 175,217,373 Waxing cost 4,860,000 6,998,400 8,503,056 9,183,300 9,917,965 HR Cost - Management 2,400,000 2,592,000 2,799,360 3,023,309 3,265,174 HR Cost - Staff 4,320,000 4,665,600 5,038,848 5,441,956 5,877,312 Packing cost 7,776,000 11,197,440 13,604,890 14,693,281 15,868,743
Fruit pulping Fruit purchase costs 274,752,000 395,642,880 480,706,099 519,162,587 560,695,594 Aseptic bags 9,612,000 13,841,280 16,817,155 18,162,528 19,615,530 Drums 24,624,000 35,458,560 43,082,150 46,528,722 50,251,020 Processing costs 18,360,000 26,438,400 32,122,656 34,692,468 37,467,866 Overheads 10,800,000 15,552,000 18,895,680 20,407,334 22,039,921 HR Cost - Management 4,800,000 5,184,000 5,598,720 6,046,618 6,530,347 HR Cost - Staff 7,776,000 8,398,080 9,069,926 9,795,521 10,579,162
DehydrationFruit purchase costs 272,571,429 392,502,857 476,890,971 515,042,249 556,245,629 Processing cost 18,000,000 25,920,000 31,492,800 34,012,224 36,733,202 Overheads 13,200,000 19,008,000 23,094,720 24,942,298 26,937,681 Packing Cost 9,000,000 12,960,000 15,746,400 17,006,112 18,366,601 HR Cost - Management 2,400,000 2,592,000 2,799,360 3,023,309 3,265,174 HR Cost - Staff 4,320,000 4,665,600 5,038,848 5,441,956 5,877,312
Repair & maintenance costs 9,204,040 9,940,363 10,735,592 11,594,440 12,521,995 Insurance costs 3,009,856 3,160,349 3,318,367 3,484,285 3,658,499 Depreciation 18,600,352 18,600,352 18,600,352 18,600,352 18,600,352
806,245,677 1,138,956,561 1,374,176,607 1,482,523,156 1,599,532,452
Margin 18,601,623 48,823,551 68,976,229 76,081,907 83,761,016
Other costsAdmin & general expenses Financial costs 26,404,837 24,372,559 22,065,924 19,447,893 16,476,428
26,404,837 24,372,559 22,065,924 19,447,893 16,476,428
Profit before tax (7,803,213) 24,450,992 46,910,305 56,634,014 67,284,588
Tax - 6,112,748 11,727,576 14,158,503 16,821,147
Profit after tax (7,803,213) 18,338,244 35,182,729 42,475,510 50,463,441
FRUIT PROCESSING FACILITY
PROJECTED INCOME STATEMENT
Amounts in PKR

Fruit Processing Facility - Pre-feasibility Study Report Final Report
USAID Firms Project Page. 22
Year 6 Year 7 Year 8 Year 9 Year 10
RevenueFresh precessed fruits 246,951,366 266,707,475 288,044,073 311,087,599 335,974,607 Fruit pulp 856,912,134 925,465,105 999,502,314 1,079,462,499 1,165,819,499 Dehydrated fruits 714,093,445 771,220,921 832,918,595 899,552,082 971,516,249
1,817,956,945 1,963,393,501 2,120,464,981 2,290,102,180 2,473,310,354 CostsFresh fruits processing
Fruit purchase costs 189,234,763 204,373,544 220,723,428 238,381,302 257,451,806 Waxing cost 10,711,402 11,568,314 12,493,779 13,493,281 14,572,744 HR Cost - Management 3,526,387 3,808,498 4,113,178 4,442,233 4,797,611 HR Cost - Staff 6,347,497 6,855,297 7,403,721 7,996,019 8,635,700 Packing cost 17,138,243 18,509,302 19,990,046 21,589,250 23,316,390
Fruit pulping Fruit purchase costs 605,551,242 653,995,341 706,314,968 762,820,166 823,845,779 Aseptic bags 21,184,772 22,879,554 24,709,918 26,686,712 28,821,649 Drums 54,271,102 58,612,790 63,301,813 68,365,958 73,835,235 Processing costs 40,465,295 43,702,519 47,198,720 50,974,618 55,052,587 Overheads 23,803,115 25,707,364 27,763,953 29,985,069 32,383,875 HR Cost - Management 7,052,775 7,616,997 8,226,356 8,884,465 9,595,222 HR Cost - Staff 11,425,495 12,339,535 13,326,698 14,392,833 15,544,260
DehydrationFruit purchase costs 600,745,279 648,804,902 700,709,294 756,766,037 817,307,320 Processing cost 39,671,858 42,845,607 46,273,255 49,975,116 53,973,125 Overheads 29,092,696 31,420,112 33,933,721 36,648,418 39,580,292 Packing Cost 19,835,929 21,422,803 23,136,628 24,987,558 26,986,562 HR Cost - Management 3,526,387 3,808,498 4,113,178 4,442,233 4,797,611 HR Cost - Staff 6,347,497 6,855,297 7,403,721 7,996,019 8,635,700
Repair & maintenance costs 13,523,754 14,605,655 15,774,107 17,036,036 18,398,919 Insurance costs 3,841,424 4,033,495 4,235,170 4,446,929 4,669,275 Depreciation 18,600,352 18,600,352 18,600,352 18,600,352 18,600,352
1,725,897,265 1,862,365,775 2,009,746,004 2,168,910,601 2,340,802,014
Margin 92,059,680 101,027,726 110,718,977 121,191,578 132,508,340
Other costsAdmin & general expenses Financial costs 13,103,816 9,275,900 4,931,216 - -
13,103,816 9,275,900 4,931,216 - -
Profit before tax 78,955,865 91,751,825 105,787,760 121,191,578 132,508,340
Tax 19,738,966 22,937,956 26,446,940 30,297,895 33,127,085
Profit after tax 59,216,899 68,813,869 79,340,820 90,893,684 99,381,255
FRUIT PROCESSING FACILITY
PROJECTED INCOME STATEMENT
Amounts in PKR

Fruit Processing Facility - Pre-feasibility Study Report Final Report
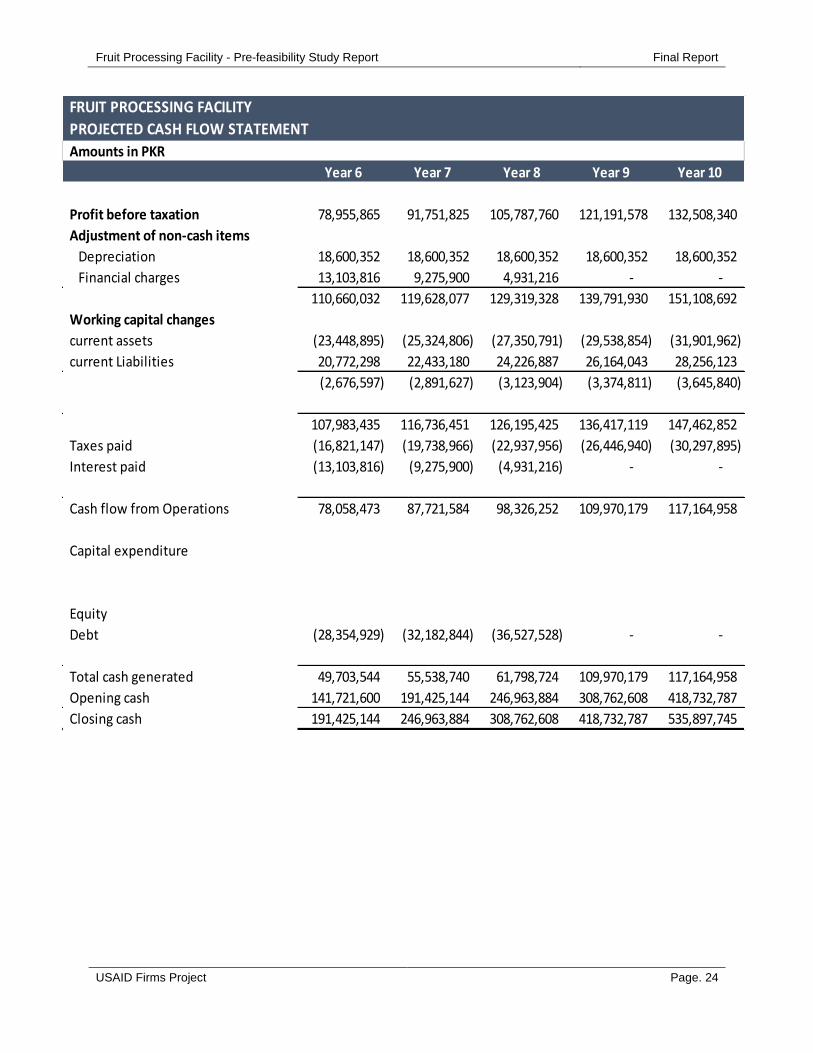
USAID Firms Project Page. 23
Projected Cash flow Statement
Year 0 Year 1 Year 2 Year 3 Year 4 Year 5
Profit before taxation - (7,803,213) 24,450,992 46,910,305 56,634,014 67,284,588
Adjustment of non-cash items
Depreciation - 18,600,352 18,600,352 18,600,352 18,600,352 18,600,352
Financial charges - 26,404,837 24,372,559 22,065,924 19,447,893 16,476,428
- 37,201,975 67,423,902 87,576,581 94,682,258 102,361,368
Working capital changes
current assets - (143,630,314) (63,197,338) (44,467,945) (20,103,648) (21,711,940)
current Liabilities - 129,475,944 54,692,200 38,666,309 17,810,392 19,234,405
- (14,154,370) (8,505,138) (5,801,636) (2,293,256) (2,477,535)
- 23,047,605 58,918,765 81,774,945 92,389,002 99,883,833
Taxes paid - - - (6,112,748) (11,727,576) (14,158,503)
Interest paid (26,404,837) (26,404,837) (24,372,559) (22,065,924) (19,447,893) (16,476,428)
Cash flow from Operations (26,404,837) (3,357,231) 34,546,206 53,596,273 61,213,533 69,248,901
Capital expenditure (274,580,800)
Equity 130,394,255
Debt 195,591,382 (15,053,908) (17,086,185) (19,392,820) (22,010,851) (24,982,316)
Total cash generated 25,000,000 (18,411,139) 17,460,020 34,203,452 39,202,682 44,266,585
Opening cash - 25,000,000 6,588,861 24,048,881 58,252,334 97,455,015
Closing cash 25,000,000 6,588,861 24,048,881 58,252,334 97,455,015 141,721,600
FRUIT PROCESSING FACILITY
PROJECTED CASH FLOW STATEMENT
Amounts in PKR
Fruit Processing Facility - Pre-feasibility Study Report Final Report
USAID Firms Project Page. 24
Year 6 Year 7 Year 8 Year 9 Year 10
Profit before taxation 78,955,865 91,751,825 105,787,760 121,191,578 132,508,340
Adjustment of non-cash items
Depreciation 18,600,352 18,600,352 18,600,352 18,600,352 18,600,352
Financial charges 13,103,816 9,275,900 4,931,216 - -
110,660,032 119,628,077 129,319,328 139,791,930 151,108,692
Working capital changes
current assets (23,448,895) (25,324,806) (27,350,791) (29,538,854) (31,901,962)
current Liabilities 20,772,298 22,433,180 24,226,887 26,164,043 28,256,123
(2,676,597) (2,891,627) (3,123,904) (3,374,811) (3,645,840)
107,983,435 116,736,451 126,195,425 136,417,119 147,462,852
Taxes paid (16,821,147) (19,738,966) (22,937,956) (26,446,940) (30,297,895)
Interest paid (13,103,816) (9,275,900) (4,931,216) - -
Cash flow from Operations 78,058,473 87,721,584 98,326,252 109,970,179 117,164,958
Capital expenditure
Equity
Debt (28,354,929) (32,182,844) (36,527,528) - -
Total cash generated 49,703,544 55,538,740 61,798,724 109,970,179 117,164,958
Opening cash 141,721,600 191,425,144 246,963,884 308,762,608 418,732,787
Closing cash 191,425,144 246,963,884 308,762,608 418,732,787 535,897,745
FRUIT PROCESSING FACILITY
PROJECTED CASH FLOW STATEMENT
Amounts in PKR